Supercontinuum Generation in 1-decanol
Although solids have been recently used in ultrafast experiments for spectral broadening due to their relatively high nonlinearity, their sensitivity to damage limits their long-term stability. Liquids are a possible alternative to solids as a nonlinear medium because of their comparable nonlinearity and resistance to permanent damage. We generate a supercontinuum in 1-decanol that spans more than an octave from the visible to the near-infrared regime. We measure the nonlinear index of refraction of 1-decanol and find a significant contribution. This contribution leads to a nonlinearity comparable to CS2 (a frequent reference for nonlinear optics) in high-intensity regimes while being significantly less volatile and toxic. We find this supercontinuum spectrum to be stable for at least 30 minutes.
1 Introduction
Ultrashort and few-cycle laser pulses require supercontinuum (SC) spectra spanning more than an octave of bandwidth [1]. Few-cycle laser pulses offer a route of coherent control on a femtosecond (1 fs s) timescale, driving experiments in strong-field physics, high-harmonic generation, and attosecond science [2, 3, 4, 5, 6]. SC generation has been successfully achieved in gases [7, 8, 9] and in solids [10, 11, 12] with spectra spanning more than an octave. More recently, SC generation in liquids has been a growing area of study, particularly in hollow-core fibres [13] and liquid-core photonic-crystal fibres (PCFs) [14].
Liquids are favourable media for nonlinear optics due to their high density, high nonlinearity, and good power stability [15]. Ethanol has successfully generated SC in a PCF [16], although its volatility and low boiling point limit its stability [17]. Among the commonly used and effective liquids for SC generation are chloroform (CHCl3)[18], carbon disulfide (CS2)[19], toluene (C7H8)[14], and benzene (C6H6)[13]. A significant drawback of using these four liquids is that they are all highly toxic [20, 21, 22, 23]. Due to the volatility and associated health risks with these organic solvents, we began studying high boiling point organic alcohols instead. The MAK (“maximale Arbeitsplatz-Konzentration”: maximum workplace concentration) [24] of 1-decanol is reportedly 10 mL/m3 with no reported carcinogenicity [25], compared to a value of 5 mL/m3 for carbon disulfide [26], 0.5 mL/m3 for chloroform [27], 5 mL/m3 for benzene [28], and 50 mL/m3 for toluene [29] (but toluene vapours are known to be harmful in comparison to 1-decanol [30]).
We have previously studied the effects of 1-decanol on intense femtosecond pulses and found that its high boiling point (231.85 )[31] leads to stable pulse compression by a factor of three that is readily achievable [32]. In this paper, we further explore the nonlinear optical properties of 1-decanol and demonstrate significant contributions from higher-order nonlinearities.
2 Methods
As shown in Figure 1(a), we use a Ti:Sapphire laser that produces 100 fs, 1.5 mJ pulses centered at 785 nm with 1 kHz repetition rate. The beam passes through a half-wave plate () and a polarizer (Pol.) to control the power. A 200 mm focal length lens focuses the beam into the 1 cm cuvette of 1-decanol, which sits on an automated translation stage (Thorlabs PT1-Z8). When measuring the spectrum as a function of axial position, the output beam is then focused into the spectrometer with a 100 cm focal length lens and attenuated before reaching the spectrometer (Ocean Insight Flame-S) using neutral density filters. When measuring the spectrum as a function of radial position, the spectrometer is placed 45 cm after the 200 cm focusing lens with no second lens after the cuvette so the beam is not focused into the slit of the spectrometer; instead, the spectrometer is scanned through the beam radially.
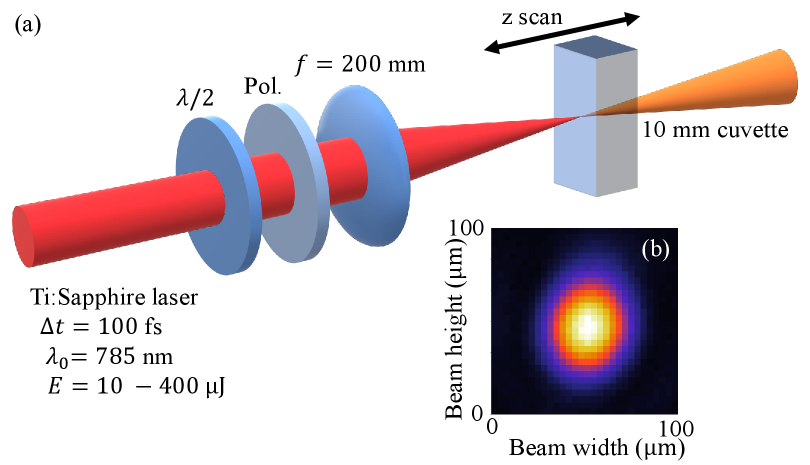
In both the radial and axial cases, the data is taken using 3 wavelength filters and stitched together during data analysis to increase the dynamic range and to better resolve both the visible and infrared portions, which are relatively weaker in intensity compared to the central wavelength. To this end, the spectrum is measured with no filter in order to resolve the spectrum from 740-800 nm. Next, the same measurement is made using a visible filter (335-610 nm), and two infrared (IR) filters (800-850 nm and 850 nm long-pass). Normalization is required to account for different spectrometer integration times and different degrees of beam attenuation before the spectrometer.
3 Results and Discussion
3.1 Measuring the nonlinear index of refraction
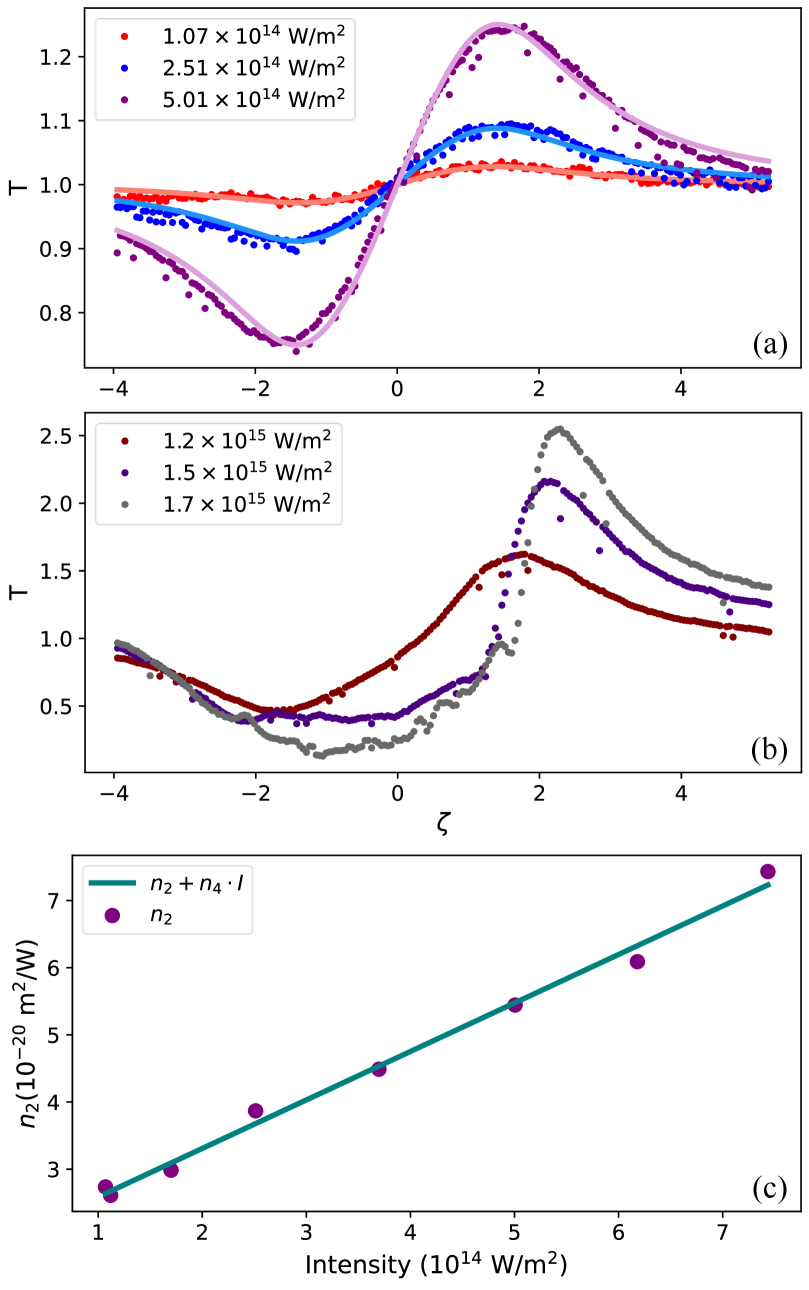
We measure the nonlinear index of refraction of 1-decanol with the z-scan technique [33]. We use an index of refraction of 1.43[34], which agrees with our previous measurement of the dispersion and index of refraction of 1-decanol[35]. Figure 2(a) shows the low-intensity regime where we do not see SC, but the data follows a typical z-scan shape. For this reason, the curve fit agrees extremely well with the data, allowing us to calculate m2/W at I0 = 0. Aside from our previous measurement [32], the only known value for the n2 of 1-decanol is m2/W, which was measured using a 1.06 µm ps laser [36]. It should be noted that the nonlinear phase imparted by the cuvette is small compared to that of the liquid, due to the thickness of the cuvette walls being much smaller than that of the liquid. Nevertheless, we do include the nonlinearity of the cuvette in our model [37].
We record the closed-aperture transmission and fit it to the function,
| (1) |
where is the self-focusing-induced phase shift, is the laser central wavelength, is the (free space) Rayleigh range, and is the peak intensity. The characteristic z-scan function for a thick sample,
| (2) |
where the parameters and scale the scanning length and the cuvette length, respectively. The material nonlinear Kerr coefficient, , is then extracted from the fit from the z-scan curves.
Figure 2(b) shows the high-intensity, SC regime where the data do not follow the z-scan shape exhibited in (a). Because the z-scan technique breaks down in this regime, we do not use it to calculate higher orders of nonlinearity for the medium. The breakdown of the fit begins at W/m2 and becomes more apparent W/m2. We argue that multi-photon absorption is not responsible for the disagreement with the z-scan fit, because we do not measure additional power loss through the cuvette at these high intensities.
Figure 2(c) illustrates how in the low-intensity regime, we are able to fit the nonlinear index as a function of intensity in order to calculate m4/W2. Compared to some values of reported in the literature for CS2, a commonly used medium for supercontinuum generation, the of 1-decanol is lower by approximately an order of magnitude ((CS2) m2/W)[38, 39]. However, for CS2 is reportedly m4/W2 at 800 nm [40], where the change of sign is related to the location of the third harmonic compared to the absorption bands of the medium [41]. Therefore, we have shown that 1-decanol exhibits a degree of optical nonlinearity on par with CS2 without a high degree of toxicity. In fact, using the cited values, the nonlinear index of refraction of 1-decanol exceeds that of CS2 above W/m2, which is the regime where we report SC generation.
3.2 Spectrum vs. axial position
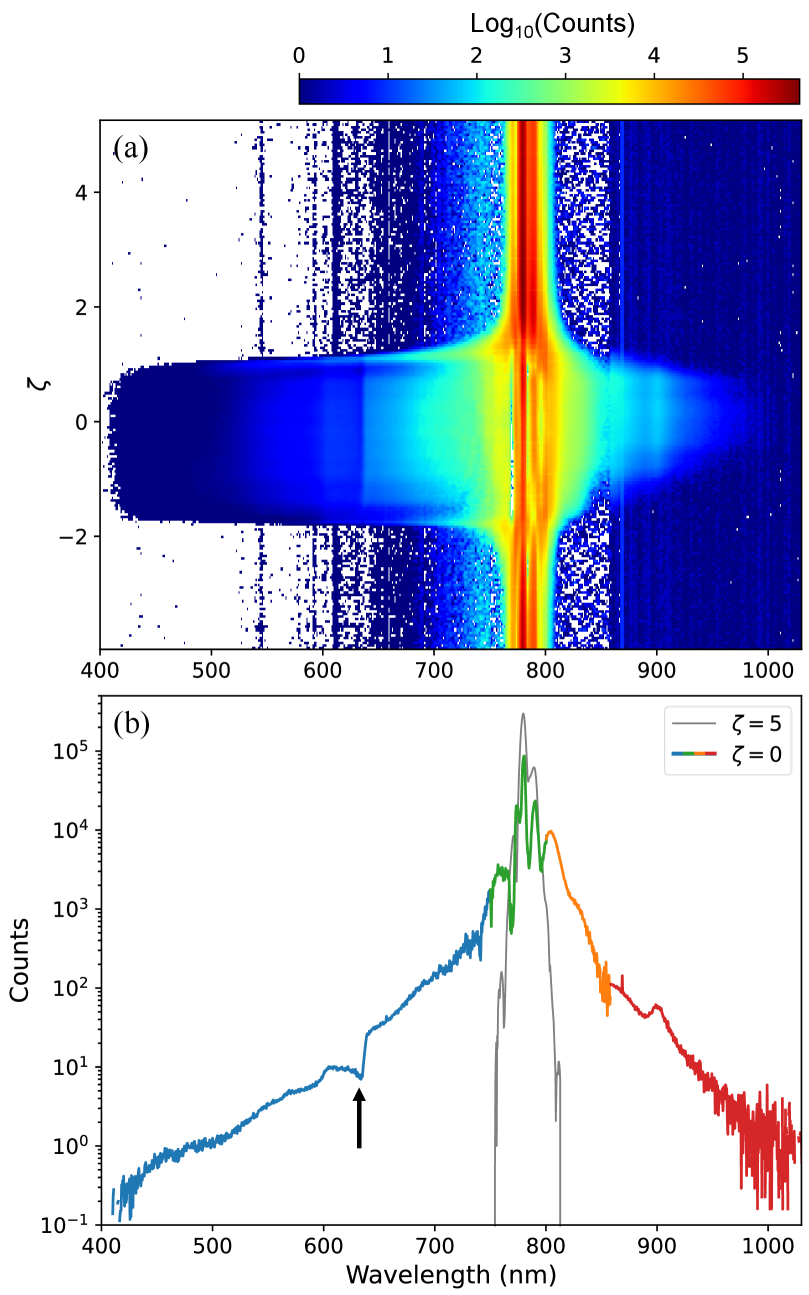
Figure 3(a) illustrates the intensity of the spectrum as a function of wavelength and cuvette position. As the 1-decanol approaches the focus, the spectrum undergoes significant spectral broadening, creating a SC which is stable until the 1-decanol passes out of the focus and returns to its initial bandwidth. The SC contains frequencies across more than an octave, from approximately 450 nm to 950 nm. This sudden explosion in spectrum near indicates that the beam undergoes significant self-focusing, which extends beyond the Rayleigh range and indicates filamentation. At these intensities, the interplay between absorption, thermal lensing, self-focusing, and diffraction allows for extending the high-intensity interaction length, enabling more efficient SC generation [42, 43].
Figure 3(b) shows lineouts contrasting the initial spectrum () to the SC (). The peak intensity of the beam at the focus is estimated to be W/m2. The difference in energy between 785 nm and 636 nm corresponds to a Raman shift of -2984 cm-1, which lies within the broad Raman response of 1-decanol centered at 2900 cm-1 [44], indicating Raman loss caused by the pump (black arrow) [45, 46, 47, 48].
3.3 Spectrum vs. radial angle
The radial distribution of the spectrum, as shown in Figure 4, is such that all wavelengths in the supercontinuum are present near the center of the beam. However, while the visible wavelengths remain present at greater radial distances, the infrared components do not. Furthermore, we do not observe significant spectral peak shifts off-axis.
The visible portion of the spectrum is relatively uniform and not significantly radially dependent over this divergence. This angle-wavelength distribution exhibits a different pattern than the X-wave amplification exhibited from four-wave mixing [49]. This pattern shows that the beam maintains a tight focus for an extended length, indicating that the increased spectral broadening comes from filamentation.
3.4 Temporal stability of the spectrum
Laser power fluctuations and material degradation would cause instability in the edges of the supercontinuum. As shown in Figure 5, we measured the temporal stability of the SC over the main portion of the spectrum for 30 minutes. A benchmark of stability for SC spectra in liquids is found in [15] where the authors report a spectrum stable for over 70 hours using CS2 in a liquid-core fiber. Because of the high boiling point of 1-decanol, we observe little evaporation of the sample after several weeks of repeated use and we expect similar longevity in our sample.
4 Conclusion
We show that it is possible to generate a supercontinuum in 1-decanol that contains frequencies across more than an octave. Although the nonlinear Kerr coefficient is modest, we find that the higher-order nonlinearities significantly contribute to the measured phase shift. Not only is 1-decanol a much safer alternative to commonly used liquids such as chloroform (CHCl3), carbon disulfide (CS2), toluene (C7H8), and benzene (C6H6), but it demonstrates a nonlinear index on par with these liquids at high intensities. Additionally, we find that the supercontinuum is stable for extended periods of time, enabling prolonged study of strong-field physics. We expect that the comparable nonlinearity of 1-decanol to more toxic liquids makes it an attractive alternative for future nonlinear optics applications such as Kerr-instability amplification.
4.1 Data Availability
-
1.
TJ Hammond, "Data to replicate supercontinuum generation in 1-decanol," figshare (2014), https://doi.org/10.5683/SP3/4HLCO9.
5 Back matter
Funding N.G. Drouillard acknowledges funding from the Queen Elizabeth II Graduate Scholarship in Science and Technology (QEII-GSST) Program, sponsored by the Ontario government. Jeet Shannigrahi acknowledges funding from Mitacs. TJ Hammond acknowledges funding from NSERC Discovery RGPIN-2019-06877 and University of Windsor Xcellerate grants.
Acknowledgment We want to thank Aldo DiCarlo for his technical assistance and Jill Crossman for her support.
Disclosures “The authors declare no conflicts of interest.”
Data Availability Statement
Data availability Data availability. Data underlying the results presented in this paper are available in Ref. [50].
6 References
References
- [1] Y. Liu, H. Tu, and S. A. Boppart, “Wave-breaking-extended fiber supercontinuum generation for high compression ratio transform-limited pulse compression,” \JournalTitleOpt. Lett. 37 (2012).
- [2] T. Gaumnitz, A. Jain, Y. Pertot, et al., “Streaking of 43-attosecond soft-x-ray pulses generated by a passively CEP-stable mid-infrared driver,” \JournalTitleOpt. Express 25 (2017).
- [3] F. Krausz and M. Ivanov, “Attosecond physics,” \JournalTitleRMP 81, 163–234 (2009).
- [4] T. J. Hammond, S. Monchocé, C. Zhang, et al., “Integrating solids and gases for attosecond pulse generation,” \JournalTitleNat. Photon 11, 594–599 (2017).
- [5] E. Goulielmakis, M. Schultze, M. Hofstetter, et al., “Single-cycle nonlinear optics,” \JournalTitleScience 320, 1614–1617 (2008).
- [6] M. T. Hassan, T. T. Luu, A. Moulet, et al., “Optical attosecond pulses and tracking the nonlinear response of bound electrons,” \JournalTitleNature 530, 66–70 (2016).
- [7] S.-F. Gao, Y.-Y. Wang, F. Belli, et al., “From raman frequency combs to supercontinuum generation in nitrogen-filled hollow-core anti-resonant fiber,” \JournalTitleLaser Photonics Rev. 16 (2022).
- [8] A. I. Adamu, M. S. Habib, C. R. Petersen, et al., “Deep-uv to mid-ir supercontinuum generation driven by mid-ir ultrashort pulses in a gas-filled hollow-core fiber,” \JournalTitleSci. Rep. 9 (2019).
- [9] K. Y. Kim, A. J. Taylor, J. H. Glownia, and G. Rodriguez, “Coherent control of terahertz supercontinuum generation in ultrafast laser-gas interactions,” \JournalTitleNat. Photon 2, 605–609 (2008).
- [10] A. M. Heidt, A. Hartung, G. W. Bosman, et al., “Coherent octave spanning near-infrared and visible supercontinuum generation in all-normal dispersion photonic crystal fibers,” \JournalTitleOpt. Express 19 (2011).
- [11] R. Grigutis, G. Tamošauskas, V. Jukna, et al., “Supercontinuum generation and optical damage of sapphire and YAG at high repetition rates,” \JournalTitleOpt. Lett. 45 (2020).
- [12] V. Marčiulionyté, V. Jukna, G. Tamošauskas, and A. Dubietis, “High repetition rate green-pumped supercontinuum generation in calcium fluoride,” \JournalTitleSci Rep 11 (2021).
- [13] L. C. Van, V. T. Hoang, V. C. Long, et al., “Supercontinuum generation in benzene-filled hollow-core fibers,” \JournalTitleOpt Eng 60 (2021).
- [14] T. N. Thi, D. H. Trong, B. T. L. Tran, et al., “Optimization of optical properties of toluene-core photonic crystal fibers with circle lattice for supercontinuum generation,” \JournalTitleJ. Opt. (2022).
- [15] K. Schaarschmidt, H. Xuan, J. Kobelke, et al., “Long-term stable supercontinuum generation and watt-level transmission in liquid-core optical fibers,” \JournalTitleOpt. Lett. 44, 2236–2239 (2019).
- [16] P. Kumar, K. F. Fiaboe, and J. S. Roy, “Design of nonlinear photonic crystal fibers with ultra-flattened zero dispersion for supercontinuum generation,” \JournalTitleETRI J. 42, 282–291 (2020).
- [17] W. M. Haynes, CRC Handbook of Chemistry and Physics 95th Edition (CRC Press, 2014).
- [18] C. V. Lanh, V. T. Hoang, V. C. Long, et al., “Optimization of optical properties of photonic crystal fibers infiltrated with chloroform for supercontinuum generation,” \JournalTitleLaser Phys 29 (2019).
- [19] C. Wang, G. Feng, W. Li, and S. Zhou, “Highly coherent supercontinuum generation in cs2 -infiltrated single-core optical fiber,” \JournalTitleJ. Opt. 21 (2019).
- [20] C. Lionte, “Lethal complications after poisoning with chloroform - case report and literature review,” \JournalTitleHum Exp Toxicol 29, 615–622 (2010).
- [21] Y. Yan, C. Wang, Z. Zheng, et al., “Renal injury following long-term exposure to carbon disulfide: analysis of a case series,” \JournalTitleBMC Nephrol 20 (2019).
- [22] S. L. Cruz, M. T. Rivera-García, and J. J. Woodward, “Review of toluene actions: Clinical evidence animal studies, and molecular targets,” \JournalTitleJ. Drug Alcohol Res. 3, 1–8 (2014).
- [23] R. Snyder, G. Witz, and B. D. Goldstein, “The toxicology of benzene.” \JournalTitleEHP pp. 293–306 (1993).
- [24] Forschungsgemeinschaft, Significance Use and Derivation of MAK Values (Wiley Online Library, 2015).
- [25] A. Hartwig, MAK value documentation (Wiley Online Library, 2011).
- [26] D. Stevenz, Carbon disulfide (Wiley Online Library, 2002).
- [27] H. Greim, Chloroform (Wiley, 2012).
- [28] Angerer and Gundel, Benzene and Alkylbenzenes (Wiley Online Library, 2002).
- [29] H. Greim, Toluene (Wiley, 2012).
- [30] N. O. of Response and Restoration, “Carbon disulfide,” (2022).
- [31] D. Ambrose and C. Sprake, “Thermodynamic properties of organic oxygen compounds xxv. vapour pressures and normal boiling temperatures of aliphatic alcohols,” \JournalTitleJ. Chem. Thermodyn 2, 632–645 (1970).
- [32] J. A. Stephen, C. J. Arachchige, and T. J. Hammond, “Spectral broadening for pulse compression using liquid alcohols,” \JournalTitleJ. Phys. B 55 (2022).
- [33] M. G. Kuzyk and C. W. Dirk, eds., Characterization Techniques and Tabulations for Organic Nonlinear Optical Materials, vol. 60 of Optical Engineering (Marcel Dekker, New York, 1998).
- [34] J. Ortega, “Densities and refractive indices of pure alcohols as a function of temperature,” \JournalTitleJ. Chem. Eng. Data 27, 312–317 (1982).
- [35] N. G. Drouillard and T. J. Hammond, “Measurement of dispersion and index of refraction of 1-decanol with spectrally resolved white light interferometry,” \JournalTitleOpt. Express (2022).
- [36] P. P. Ho and R. R. Alfano, “Optical kerr effect in liquids,” \JournalTitlePhys. Rev. A 20, 2170 (1979).
- [37] D. Milam, “Review and assessment of measured values of the nonlinear refractive-index coefficient of fused silica,” \JournalTitleAppl. Opt. 37, 546–550 (1998).
- [38] S. Couris, M. Renard, O. Faucher, et al., “An experimental investigation of the nonlinear refractive index (n2) of carbon disulfide and toluene by spectral shearing interferometry and z-scan techniques,” \JournalTitleChem. Phys. Lett. 369, 318–324 (2003).
- [39] R. A. Ganeev, A. I. Ryasnyanskiĭ, and H. Kuroda, “Nonlinear optical characteristics of carbon disulfide,” \JournalTitleOpt Spectrosc 100, 108–118 (2006).
- [40] D. G. Kong, Q. Chang, H. A. Ye, et al., “The fifth-order nonlinearity of cs2,” \JournalTitleJ. Phys. B 42 (2009).
- [41] V. Besse, H. Leblond, and G. Boudebs, “Filamentation of light in carbon disulfide,” \JournalTitlePhys. Rev. A 89, 043840 (2014).
- [42] E. L. Falcão Filho, C. B. de Araújo, G. Boudebs, et al., “Robust two-dimensional spatial solitons in liquid carbon disulfide,” \JournalTitlePhys. Rev. Lett. 110, 013901 (2013).
- [43] J. E. Q. Bautista, M. L. da Silva-Neta, C. L. A. V. Campos, et al., “Thermal and non-thermal intensity dependent optical nonlinearities in ethanol at 800 nm, 1480 nm, and 1560 nm,” \JournalTitleJ. Opt. Soc. Am. B 38, 1104–1111 (2021).
- [44] D. Carrizo, V. Muñoz-Iglesias, M. T. Fernández-Sampedro, et al., “Detection of potential lipid biomarkers in oxidative environments by raman spectroscopy and implications for the exomars 2020-raman laser spectrometer instrument performance,” \JournalTitleAstrobiology 20, 405–414 (2020).
- [45] J. Yang and G. Mu, “Multi-dimensional observation of white-light filaments generated by femtosecond laser pulses in condensed medium,” \JournalTitleOpt. Express 15 (2007).
- [46] C. Santhosh, A. K. Dharmadhikari, J. A. Dharmadhikari, et al., “Supercontinuum generation in macromolecular media,” \JournalTitleAppl. Phys. B 99, 427–432 (2010).
- [47] S. Sreeja, C. Leela, V. R. Kumar, et al., “Dynamics of tightly focused femtosecond laser pulses in water,” \JournalTitleLaser Phys. 23 (2013).
- [48] N. G. Drouillard and T. J. Hammond, “Stimulated raman spectroscopy using a tunable visible broadband probe pulse generated by kerr instability amplification,” \JournalTitleAppl. Spectrosc. 0, 0 (2025).
- [49] D. Faccio, M. A. Porras, A. Dubietis, et al., “Conical emission, pulse splitting, and x-wave parametric amplification in nonlinear dynamics of ultrashort light pulses,” \JournalTitlePhys. Rev. Lett. 96, 193901 (2006).
- [50] T. J. Hammond, “Data to replicate supercontinuum generation in 1-decanol,” (2025). Dataset.