Prime Implicant Explanations for
Reaction Feasibility Prediction
Abstract
Machine learning models that predict the feasibility of chemical reactions have become central to automated synthesis planning. Despite their predictive success, these models often lack transparency and interpretability. We introduce a novel formulation of prime implicant explanations—also known as minimally sufficient reasons—tailored to this domain, and propose an algorithm for computing such explanations in small-scale reaction prediction tasks. Preliminary experiments demonstrate that our notion of prime implicant explanations conservatively captures the ground truth explanations. That is, such explanations often contain redundant bonds and atoms but consistently capture the molecular attributes that are essential for predicting reaction feasibility.
1 Introduction
We aim to generate formally grounded and reliable explanations for reaction feasibility (RF) prediction tasks [23]. Predicting feasibility of chemical reactions is fundamental to the problem of computer-aided synthesis planning (CASP)[11]. Although machine learning (ML) models have shown remarkable success in this field [9], their use can lead to significant reduction in transparency and interpretability [22]. To address these challenges, initial efforts have been made to enhance the explainability of ML based RF prediction models, for example, by combining coarse level and fine level representations [17] or by applying layer-wise relevance propagation [6] in a neural network classifier [20]. However, such explanations do not have well-defined semantics and can often be misleading [13, 22]. Furthermore, to the best of our knowledge, there is no widely accepted notion of an explanation with formally defined semantics in the context of reaction feasibility prediction. Here, we aim to fill this gap.
We leverage and expand a formal notion of minimally sufficient explanations known as prime implicant (PI) explanations. PI explanations are a formally grounded and widely accepted notion of explanations for propositional logic classifiers [12]. Recent results have devised a similar notion of explanations for graph classification tasks [5]. However, formal notion of explanations for applications similar to RF prediction are relatively underexplored. We first show that conventional notions of PI explanations [5] are semantically misaligned and computationally expensive for RF prediction tasks. We then introduce PI reaction explanations for explaining RF prediction tasks. Although computing PI reaction explanations is intractable in general, we show that for small instances they can be identified efficiently. Our method uses the Imaginary Transition State graphs (ITS), i.e., node and edge labeled graphs that provide a succinct representation of a chemical reaction. We show that explaining RF predictions reduces to finding minimally sufficient rooted connected subgraphs of an ITS. To solve this search problem, we introduce extension DAGs a directed acyclic graph (DAG) that encodes the partial order induced by rooted subgraphs of an ITS. We perform preliminary empirical analysis using expert ratings on 179 RF prediction explanations from a graph neural network based classifier. Our analysis shows that PI reaction explanations consistently capture the ground truth explanation as a subgraph but often include multiple non-essential nodes and edges. We conclude with a brief discussion on the potential reasons behind the observed redundancies, open challenges, and future directions.
2 Preliminaries
This section introduces the foundational concepts and terminology needed to formalize the problem and present the proposed solution. We begin by establishing basic graph-theoretic notions, give an overview of prime implicant (PI) explanations, and describe the chemical reaction representation used in graph classification.
Chemical notation specifies molecules as labeled graphs , with vertices denoting atoms and edges denoting chemical bonds between them. We write and for the node and edge set of the graph , and assume that belongs to a graph class of interest . We write edges as , and in undirected graphs . A subgraph of is denoted , and the node-induced subgraph of on the node set is written as . Similarly, the subgraph of consisting of the edges of is denoted by .
Prime implicant explanation
A prime implicant (PI) explanation of a classification is a subset of features from the instance that is minimally sufficient for the prediction [24]. For decision problems, a PI explanation is a minimal set of features implying the decision. PI explanations are the analogue of prime implicants in propositional logic. For example, consider the function as a binary classifier for the features . The PI explanations for are and . PI explanations give an intuitive description of what the classifier considers sufficient for the respective prediction. PI explanations are not unique in general.
Imaginary Transition State graph
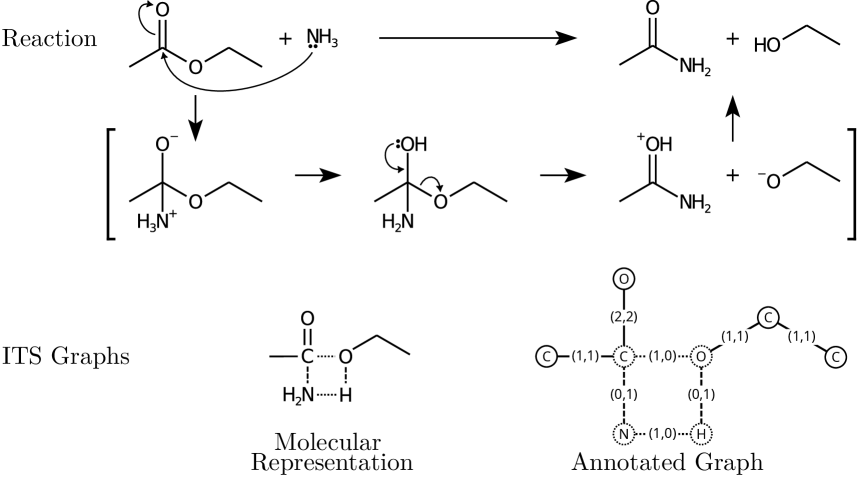
The Imaginary Transition State (ITS) [15, 25] graph is a graph-theoretical representation of the structural changes that molecules, encoded as annotated graphs, undergo during a chemical reaction. It is the superposition of the molecular graphs of reactants and products, where edge labels encode the changes in bond order between the atoms. Thus, the edge labels in the ITS graph are tuples, with the first element encoding the bond order in the reactant graph and the second element encoding the bond order in the product graph. Edges with unequal label values encode a transformation. In the chemical domain, this corresponds to the formation or breaking of valence bonds. We use the ITS graph as defined in [16], see Appendix 5 for the formal definition. Every ITS graph contains a reaction center, defined as the subgraph consisting of the changing bonds. It represents the structural transformation that occurs during the chemical reaction.
Definition 1(Reaction Center)
The reaction center of an ITS graph with edge labels for edge is defined by .
Fig. 2 depicts the ITS graph of a chemical reaction. Besides the annotated ITS graph, the figure also shows a concise, molecular-graph-like representation that we will be using. The reaction center is marked by dotted and dashed lines. The ITS graph is a convenient representation of chemical reactions because all for the reaction relevant structures are adjacent to the reaction center, and hence the ITS graph is connected [16].
Reaction feasibility prediction
Reaction feasibility (RF) prediction is a binary graph classification problem on ITS graphs, where the prediction target is the chemical feasibility of a given ITS graph. These predictions could, for example, improve template-based synthesis planning by ruling out chemically infeasible combinatorial solutions. Fig. 3 depicts two reactions—one feasible and the other infeasible. Although the reaction centers in both cases are isomorphic, the feasibility of the reaction depends on some additional surrounding context. To evaluate these classifier decisions, we introduce and analyze subgraph PI explanations. These explanations allow domain experts to assess whether the classifier has learned chemical domain knowledge.

3 PI Explanations on Graphs
We begin by adapting the definition of a PI explanation by Shih et al. [24, Def.5] to the setting of simple, undirected graphs, following an approach similar to [5]. In a second step, we further adapt this definition to the domain-specific setting of reaction feasibility prediction.
Definition 2(Subgraph PI explanation [5])
Let be the binary classification function and the graph instance. A PI explanation is a graph such that
-
(a)
,
-
(b)
for all ,
-
(c)
and no proper subgraph satisfies (a) and (b).
Remark 1
A key difference of subgraph PI explanations to PI explanations in general is in point (b). In the general case, all possible extensions from the domain are allowed . In contrast, subgraph PI explanations only permit extensions within the instance . This constraint is necessary to reduce the complexity of finding PI explanations, as the general case is highly intractable.
A subgraph PI explanation for a binary graph classification is a subgraph such that all of its supergraphs within the instance are assigned the same label. To find all PI explanations, one can, in principle, exhaustively query the classifier on all possible subgraphs and select those that satisfy Definition 2. This brute-force approach is intractable in practice because the number of subgraphs grows exponentially with graph size. However, due to the nature of the application domain, the space of admissible graphs can be constrained. Although these constraints do not improve the worst-case complexity, they substantially reduce the number of subgraphs, making the problem solvable for small instances, as demonstrated in the empirical complexity analysis in Appendix 0.A.4.
3.1 PI Reaction Explanation
We now adapt the previously introduced subgraph PI explanations to a domain-specific setting for obtaining explanations from RF predictions, guided by two key domain observations. Within the context of chemical reactions encoded as ITS graphs, two graph class restrictions can be derived from prior work on their structural properties [16]. Firstly, in an ITS graph, all compound graphs undergoing bond changes are connected to the reaction center [16]. Environmental effects that are transparent to structural changes—such as solvents—are inherently absent from this representation. Likewise, non-valence interactions such as hydrogen bonds are not captured in ITS graphs. Consequently, extensions must be connected graphs, and thus, all disconnected subgraphs can be discarded. Secondly, each ITS graph contains a reaction center—the subgraph that encodes all the bond changes between reactants and products [16]. This component is essential for the graph to represent a reaction mechanism. Without it, the ITS graph does not encode any chemical transformation. Hence, PI reaction explanations necessarily are connected subgraphs rooted at the reaction center.
Definition 3(PI reaction explanation)
Let be a reaction feasibility classifier, and be an instance from the class of connected ITS graphs with denoting its reaction center. A PI reaction explanation is a graph such that
-
(a)
,
-
(b)
for all
-
(c)
is connected,
-
(d)
and no proper subgraph satisfies (a) to (c).
The connectivity constraint, together with the necessary root, reduces the problem from enumerating all subgraphs to enumerating only rooted connected subgraphs.
3.2 Rooted and Connected Subgraph Extensions
Computing PI reaction explanations for an ITS graph involves classifying its rooted connected subgraphs. To reduce the number of classifier decisions, we utilize a directed acyclic graph (DAG) defined by a partial ordering. The nodes in this extension DAG are the set of rooted connected subgraphs, and the edges correspond to the subgraph-supergraph relationships. This structure captures how extensions can be incrementally constructed.
Definition 4(Extension DAG)
Let be an instance, and let be the set of connected subgraphs of that contain the root as subgraph. For we say that iff is a subgraph of . Then the extension DAG represents the partial order (lattice).
That is, is a DAG with nodes and edges and there is no such that . In other words, is the Hasse diagram for the subgraph relation on the possible PI explanations.
Observation 1
An extension DAG for the instance contains a unique sink node, representing the root, and a unique source node, which corresponds to the entire instance .
Extension DAG construction
The algorithm for constructing the extension DAG of is adapted from the linear-delay enumeration algorithm for connected node-induced subgraphs proposed by Alokshiya et al. [2], which in turn is based on the reverse search algorithm introduced by Avis and Fukuda [4]. Our adaptation modifies this approach such that it generates a directed acyclic graph of rooted subgraphs. The algorithmic solution requires the root to be a single node. Without loss of generality for the construction of the DAG we can assume that the root subgraph is merged into a single root node by contracting its edges. Algorithm 2 in the appendix provides a pseudocode description of the proposed algorithm.
3.3 Computing PI Reaction Explanations
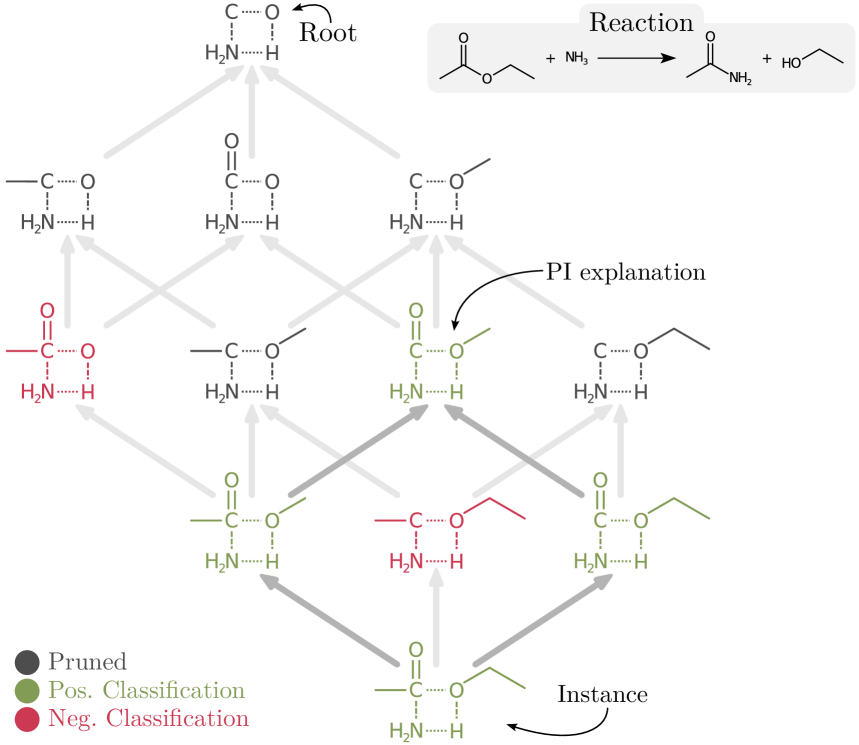
To address the core objective of finding PI explanations for reaction feasibility prediction on the ITS graph , we traverse its full extension DAG and classify the subgraphs. Since reaction feasibility is a non-monotonic property [3] of the ITS graph (see Appendix 0.A.2), the use of more efficient search algorithms is limited. During this traversal, invalid paths are pruned based on the obtained decision, yielding a final DAG in which the DAG-nodes without descendants correspond to the PI reaction explanations of . Since the prediction on is the decision being explained, qualifies as an explanation, although it is typically not a PI explanation. Moreover, all subgraphs along the path to a PI explanation must preserve the classification label. Therefore, when an extension causes a change in prediction, we prune all of its subgraphs from , as any further subgraph would violate point (b) of Definition 3. The algorithm terminates once no further nodes remain to be evaluated. Algorithm 1 provides a pseudocode description for computing PI explanations based on an extension DAG.
Fig. 4 shows the PI reaction explanation search on the extension DAG. Evaluation starts at the full instance with a positive prediction. In the next iteration, all outneighbor extensions from the previous round are tested. In the example, there are two positive predictions and one negative prediction. For the negative prediction the algorithm prunes all its descendants, i.e., all paths upwards. After another iteration, the algorithm terminates. The nodes (only one in the example) without descendants in the remaining DAG are the PI reaction explanations.
To find PI reaction explanations for ITS graph classifications, we consider connected and rooted edge-induced subgraphs, which best capture the chemical intuition behind molecular interactions [7, 14]. In molecular orbital theory, atoms can alter the properties of a molecule by sharing electrons through overlapping orbitals—the valence bonds. The presence or absence of a valence bond can significantly influence a molecule’s electronic structure and, consequently, its reactivity. In the ITS graph representation, valence bonds and bond changes are modeled as edges. Thus, the presence or absence of a single edge can render a reaction mechanism feasible or infeasible, as illustrated in Fig. 3. An additional edge can allow an otherwise disconnected atom to contribute its electrons and enable the reaction. Therefore, it is more natural and chemically meaningful to base our explanations on edge sets rather than node sets. Although enumerating edge-induced subgraphs differs technically from enumerating node-induced subgraphs, this distinction can be bridged by employing the line graph of a graph . Each edge-induced subgraph in corresponds to a node-induced subgraph in , and vice versa. Hence, enumerating edge-induced subgraphs in is equivalent to enumerating node-induced subgraphs in . The extension DAG used to compute PI reaction explanations for an ITS graph is constructed using Algorithm 2 on after contracting the reaction center edges.
4 Evaluation
To evaluate our approach, we construct a small dataset for reaction feasibility prediction using the publicly available USPTO reaction dataset [18, 21]. We train a Graph Isomorphism Network (GIN) [26] for graph classification and derive PI reaction explanations for its decisions. Due to the lack of an established benchmark for evaluating PI explanations in this context, we perform a qualitative analysis, comparing the results against expert judgment of the underlying structural reasons.
Dataset
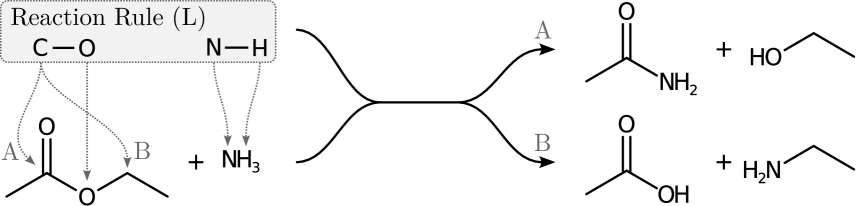
The dataset is generated from the USPTO-MIT [18] dataset by applying a reaction template on the reactant molecules from the dataset and selecting a balanced subset of positive and negative instances from the obtained reaction candidates. A reaction candidate is considered positive if the candidate product matches the expected product from the data, and negative otherwise. As complexity of the proposed method is exponential in the size of the graph we consider ITS graphs of at most 25 nodes. For the moment, we restrict ourselves to one specific reaction mechanism, namely the substitution of Oxygen by Nitrogen at a Carbon atom as depicted in Fig. 5. The USPTO-MIT contains 3809 reactions with this reaction center, which serve as positive examples. Negative samples are generated by undersampling an equal-sized set from the infeasible candidates. The final dataset therefore contains 7618 ( positive and negative) instances.

Applying a reaction rule to a reactant molecular graph is a combinatorial process that can produce multiple possible reaction candidates, as illustrated in Fig. 6. These candidates are generated by identifying subgraph isomorphisms between the left-hand side graph of the rule and the reactant graph. The ITS graphs can directly be constructed by this alignment and the right-hand side graph of the rule.
4.1 Experiment
For the experimental evaluation the Graph Isomorphism Network (GIN) [26] is chosen as classifier for its strong performance on graph-based learning tasks and, crucially, its fast inference. The latter is particularly important because computing PI explanations requires a large number of predictions. We perform a stratified dataset split of 60% for training, 20% for validation, and 20% for testing. Model selection is guided by hyperparameter optimization on the training and validation sets, using the tree-structured Parzen estimator (TPE) algorithm [8] as implemented in the optimization framework Optuna [1]. Based on preliminary experiments we fix the number of training epochs to and the batch size to . We then optimize the following hyperparameters in the respective ranges over iterations: number of layers , layer size , dropout , readout function , and learning rate . The best model configuration includes layers of size with a dropout rate of , a readout function, and a learning rate of . The final model configuration is trained 10 times on the combined training and validation sets, and its performance is evaluated on the held-out test set. The test performance is summarized in Table 1. The table shows the mean and standard deviation of accuracy, precision, recall, F1 score and the area under the receiver operator curve (AUROC) in percent. The values are averaged over 10 runs.
| Accuracy | Precision | Recall | F1 score | AUROC |
|---|---|---|---|---|
With the trained model in place we compute the PI reaction explanations for each true positive instance in the test set. For this, we construct the extension DAG based on Algorithm 2 and compute the explanations according to Algorithm 1. To improve inference time, we can utilize GPU-based batch processing of extensions. Instead of querying the classifier with individual instances we can assemble a batch from the loop in lines 4-10 of Algorithm 1.
4.2 Analysis of Results
The qualitative analysis—based on 179 manually identified expected explanations from the 653 true positive predictions—revealed that the PI reaction explanations significantly diverge from expert mechanistic interpretations. A chemically sound reaction explanation must capture changes in all relevant atoms and bonds throughout the mechanistic sequence, including necessary neighboring atoms. For instance, any valid explanation of the nucleophilic addition-elimination reaction in Fig. 2 must include the carbonyl double bond, essential for both forming the tetrahedral intermediate and cleaving the C-O bond during elimination. Since the classifier’s PI explanations often lack precision in reflecting the true underlying chemical mechanisms, we adopt a 1-to-6 rating scale instead of a binary correct/incorrect label. This allows us to capture varying degrees of alignment between the model’s reasoning and established chemical knowledge. A rating of 1 indicates the best match, where the obtained explanation exactly matches the expected explanation. A rating of 6 indicates the worst match, where the expected explanation is not even a subgraph of the obtained explanation. The categories are defined as follows.
-
1.
Perfect explanation: The explanation is isomorphic to the expected explanation.
-
2.
Good explanation: The explanation is a supergraph of the expected explanation and has at most three additional carbon atoms.
-
3.
Acceptable explanation: The explanation is a supergraph of the expected explanation and has at most five additional carbon atoms and at most one additional Nitrogen or Oxygen atom.
-
4.
Mediocre explanation: The explanation is a supergraph of the expected explanation and has at most eight additional carbon atoms and at most two additional Nitrogen or Oxygen atoms.
-
5.
Bad explanation: The explanation is a supergraph of the expected explanation but there are too many additional atoms.
-
6.
Not an explanation: The expected explanation is not a subgraph of the explanation.
The experiment shows that the reaction explanations are sensitive to uncertainty in the classifier’s predictions. In the default setting—where the threshold for a positive prediction is 0.5 and the classifier outputs a probability in the range indicating the feasibility of a reaction—only of the obtained explanations receive a rating of or , while receive a rating of or . To account for uncertain negative classifications, we gradually lower the positive classification threshold from to in steps of . The accuracy decreases from to , while the distribution of explanation ratings changes significantly. As the threshold decreases, the proportion of good ratings increases and that of bad ratings decreases. The closest alignment with the expected explanations is observed at a threshold of . A threshold of causes a significant increase in explanations rated . Many of these explanations tend to be small, often consisting only of the reaction center, which suggests that the bias toward positive predictions is too strong. A summary of these results is shown in Fig. 7.
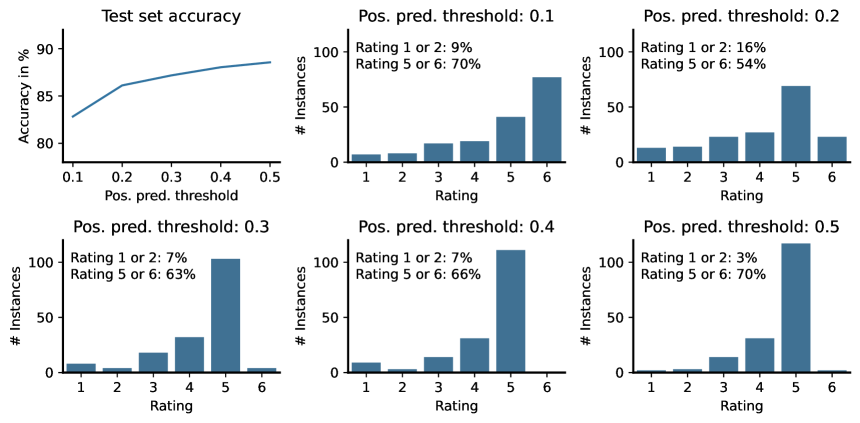
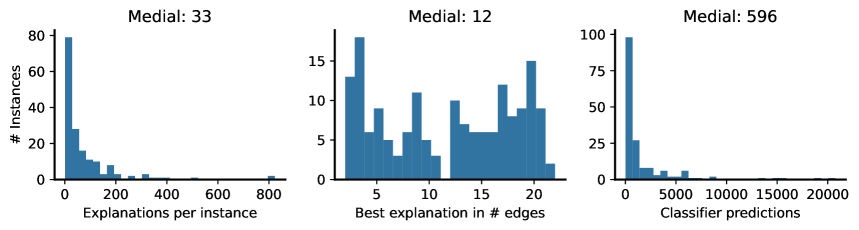
Fig. 8 depicts distributions of PI reaction explanations for the positive prediction threshold of . The first plot shows the distribution of the number of explanations per instance. The median number of explanations per instance is , with a maximum of . The center plot shows the distribution of the top-rated explanation sizes in terms of the number of edges. Since hydrogen are not explicitly represented in the dataset, the smallest possible explanation size is , i.e., the number of edges in the reaction center excluding the hydrogen atom. The right plot shows the number of classifier decisions required to compute PI reaction explanations. This highlights the need for fast inference, as the number of predictions can be high for individual instances.
Given the absence of chemically insightful PI reaction explanations, we hypothesize three factors contributing to the obtained results. Inadequacy of the graph class: The defined graph class may not ideally represent the chemical space. While considering connected rooted subgraphs as possible extensions is a reasonable constraint compared to the general case of subgraphs, more chemically-aware rules might be needed to filter out synthetically infeasible structures. It is unknown how many genuinely infeasible extensions are generated under this model. There might occur truly negative extensions that, if classified accordingly, would legitimately prune the extension DAG. The expected explanations are typically small. This implies that, even with a perfect classifier, successfully identifying the expected PI explanations requires a flawless extension model—one that never generates truly negative extensions in which the expected explanation appears as a subgraph. Ambiguity in ground-truth: The ground truth for RF prediction is inherently vague, making it difficult to evaluate reliably. The chosen 1-to-6 evaluation scale reflects the high degree of divergence from expected outcomes. Determining reaction feasibility is a complex task. Manual curation requires chemical expertise, which inherently introduces subjectivity and leads to significant inter-annotator variability [10]. Classifier limitations: The GIN, combined with the tested readout functions, may not be well-suited for this evaluation task. The relatively small training set, combined with sensitivity to out-of-distribution extensions in respect to training samples, could contribute to arbitrary explanations. Since the number of truly infeasible ITS graphs occurring within the extensions is unknown, measures to mitigate the effect of out-of-distribution samples could help improve the robustness of the predictions.
5 Outlook
We summarize the main challenges identified in this early study on PI explanations for RF prediction and conclude with their current capabilities, limitations and directions for future research.
Open challenges
In addition to the domain-specific difficulties encountered during evaluation, there are also fundamental challenges inherent to PI explanations for graph classification. Computational intractability: The number of subgraph extensions grows exponentially with the size of the instance. This limits explanations to small instances and classifiers with fast inference times. It will be of interest to explore whether the exhaustive enumeration can be replaced by a sampling-based approach focussing on subgraphs whose edge-deletions preserve the classification. The lattice structure of may be helpful to guide heuristic approximations by providing clearly defined largest common subgraphs and smallest common supergraphs for alternative explanations. Lack of benchmarks: Currently, there is no standard way for accessing the quality of PI explanations in graph classification tasks. In addition to limited comparability, it can be challenging to define meaningful expected explanations—particularly in applied domains such as cheminformatics. For instance, in the task of RF prediction, it may not always be possible to clearly identify a substructure that is fully accountable for a mechanism. Moreover, atoms that are not strictly necessary for the reaction may still influence important properties such as rate or yield, making it difficult to draw a clear boundary between relevant and irrelevant atoms.
Conclusion
We introduced subgraph PI explanations for graph classification and applied this method to explain RF predictions. Although limitations and open challenges remain (as discussed), PI explanations provide valuable insights into classifier decisions. In our application, these explanations correspond to the minimally sufficient reaction context—an inferred extension beyond the explicitly defined reaction center in the ITS graph. While our initial experiment shows that PI explanations capture important aspects of chemical intuition, they do not align well with expert-defined mechanistic explanations. This misalignment is amplified by suboptimal classifier performance and inherent sensitivity to noisy decisions, leading to imprecise comparisons. However, this comparison assumes that PI explanations inherently represent the same thing as the expert annotation, which may not hold true. Consequently, PI reaction explanations could still provide valuable insight into the model’s reasoning. We hope these early results stimulate further research into PI explanations for graph data and contribute to a deeper understanding of chemical reasoning within reaction prediction models.
5.0.1 Acknowledgements
Part of this work was funded by the European Unions Horizon Europe Doctoral Network program under the Marie-Skłodowska-Curie grant agreement No 101072930 (TACsy—Training Alliance for Computational systems chemistry). TG has been partially supported by the Vienna Science and Technology Fund (WWTF), project ICT22-059 (StruDL). PFS acknowledges support by the German Federal Ministry of Education and Research BMBF through DAAD project 57616814 (SECAI, School of Embedded Composite AI). DeepL was used for grammar and spellchecking. ChatGPT was used to improve sentence structure for clarity and readability.
5.0.2 \discintname
Views and opinions expressed are however those of the author(s) only and do not necessarily reflect those of the European Union. Neither the European Union nor the granting authority can be held responsible for them.
References
- [1] Akiba, T., Sano, S., Yanase, T., Ohta, T., Koyama, M.: Optuna: A next-generation hyperparameter optimization framework. In: Proceedings of the 25th ACM SIGKDD international conference on knowledge discovery & data mining. pp. 2623–2631 (2019). https://doi.org/10.1145/3292500.3330701
- [2] Alokshiya, M., Salem, S., Abed, F.: A linear delay algorithm for enumerating all connected induced subgraphs. BMC Bioinformatics 20(12), 319 (Jun 2019). https://doi.org/10.1186/s12859-019-2837-y, https://doi.org/10.1186/s12859-019-2837-y
- [3] Alon, N., Shapira, A.: Every monotone graph property is testable. In: Proceedings of the Thirty-Seventh Annual ACM Symposium on Theory of Computing. p. 128–137. STOC ’05, Association for Computing Machinery, New York, NY, USA (2005). https://doi.org/10.1145/1060590.1060611, https://doi.org/10.1145/1060590.1060611
- [4] Avis, D., Fukuda, K.: Reverse search for enumeration. Discrete Applied Mathematics 65(1), 21–46 (1996). https://doi.org/https://doi.org/10.1016/0166-218X(95)00026-N, https://www.sciencedirect.com/science/article/pii/0166218X9500026N, first International Colloquium on Graphs and Optimization
- [5] Azzolin, S., Malhotra, S., Passerini, A., Teso, S.: Beyond topological self-explainable gnns: A formal explainability perspective (2025), https://arxiv.org/abs/2502.02719
- [6] Bach, S., Binder, A., Montavon, G., Klauschen, F., Müller, K.R., Samek, W.: On pixel-wise explanations for non-linear classifier decisions by layer-wise relevance propagation. PloS one 10(7), e0130140 (2015)
- [7] Benkö, G., Flamm, C., Stadler, P.F.: A graph-based toy model of chemistry. Journal of Chemical Information and Computer Sciences 43(4), 1085–1093 (Jul 2003). https://doi.org/10.1021/ci0200570, https://doi.org/10.1021/ci0200570
- [8] Bergstra, J., Bardenet, R., Bengio, Y., Kégl, B.: Algorithms for hyper-parameter optimization. Advances in neural information processing systems 24 (2011)
- [9] Coley, C.W., Green, W.H., Jensen, K.F.: Machine learning in computer-aided synthesis planning. Accounts of Chemical Research 51(5), 1281–1289 (May 2018). https://doi.org/10.1021/acs.accounts.8b00087, https://doi.org/10.1021/acs.accounts.8b00087
- [10] Corbett, P., Boyle, J.: Chemlistem: chemical named entity recognition using recurrent neural networks. Journal of Cheminformatics 10(1), 59 (Dec 2018). https://doi.org/10.1186/s13321-018-0313-8, https://doi.org/10.1186/s13321-018-0313-8
- [11] Corey, E.J.: General methods for the construction of complex molecules. Pure and Applied Chemistry 14(1), 19–38 (1967). https://doi.org/doi:10.1351/pac196714010019, https://doi.org/10.1351/pac196714010019
- [12] Darwiche, A., Hirth, A.: On the reasons behind decisions. In: ECAI 2020, pp. 712–720. IOS Press (2020)
- [13] Dombrowski, A., Alber, M., Anders, C.J., Ackermann, M., Müller, K., Kessel, P.: Explanations can be manipulated and geometry is to blame. CoRR abs/1906.07983 (2019), http://arxiv.org/abs/1906.07983
- [14] Flamm, C., Müller, S., Stadler, P.F.: Every atom-atom map can be explained by electron pushing diagrams (2023), https://arxiv.org/abs/2311.13492
- [15] Fujita, S.: Description of organic reactions based on imaginary transition structures. 1. Introduction of new concepts. Journal of Chemical Information and Computer Sciences 26 (1986)
- [16] González Laffitte, M.E., Weinbauer, K., Phan, T.L., Beier, N., Domschke, N., Flamm, C., Gatter, T., Merkle, D., Stadler, P.F.: Partial imaginary transition state (its) graphs: A formal framework for research and analysis of atom-to-atom maps of unbalanced chemical reactions and their completions. Symmetry 16(9) (2024). https://doi.org/10.3390/sym16091217, https://www.mdpi.com/2073-8994/16/9/1217
- [17] Hou, J., Dong, Z.: Learning hierarchical representations for explainable chemical reaction prediction. Applied Sciences 13(9) (2023). https://doi.org/10.3390/app13095311, https://www.mdpi.com/2076-3417/13/9/5311
- [18] Jin, W., Coley, C., Barzilay, R., Jaakkola, T.: Predicting organic reaction outcomes with weisfeiler-lehman network. In: Guyon, I., Luxburg, U.V., Bengio, S., Wallach, H., Fergus, R., Vishwanathan, S., Garnett, R. (eds.) Advances in Neural Information Processing Systems. vol. 30. Curran Associates, Inc. (2017), https://proceedings.neurips.cc/paper_files/paper/2017/file/ced556cd9f9c0c8315cfbe0744a3baf0-Paper.pdf
- [19] Kangas, K., Kaski, P., Korhonen, J.H., Koivisto, M.: On the number of connected sets in bounded degree graphs. Electr. J. Comb. 25, P4.34 (2018). https://doi.org/https://doi.org/10.37236/7462
- [20] Kim, J., Gu, G.H., Noh, J., Kim, S., Gim, S., Choi, J., Jung, Y.: Predicting potentially hazardous chemical reactions using an explainable neural network. Chemical science 12(33), 11028–11037 (2021)
- [21] Lowe, D.M.: Extraction of chemical structures and reactions from the literature. Ph.D. thesis, Apollo - University of Cambridge Repository (2012). https://doi.org/10.17863/CAM.16293, https://www.repository.cam.ac.uk/handle/1810/244727
- [22] Rudin, C.: Stop explaining black box machine learning models for high stakes decisions and use interpretable models instead. Nature Machine Intelligence 1(5), 206–215 (2019). https://doi.org/10.1038/s42256-019-0048-x, https://doi.org/10.1038/s42256-019-0048-x
- [23] Segler, M.H.S., Waller, M.P.: Modelling chemical reasoning to predict and invent reactions. Chemistry – A European Journal 23(25), 6118–6128 (2017). https://doi.org/https://doi.org/10.1002/chem.201604556, https://chemistry-europe.onlinelibrary.wiley.com/doi/abs/10.1002/chem.201604556
- [24] Shih, A., Choi, A., Darwiche, A.: A symbolic approach to explaining bayesian network classifiers. arXiv preprint arXiv:1805.03364 (2018)
- [25] Wilcox, C.S., Levinson, R.A.: A self-organized knowledge base for recall, design, and discovery in organic chemistry. In: Pierce, T.H., Hohne, B.A. (eds.) Artificial Intelligence Applications in Chemistry, Am. Chem. Soc. symposium series, vol. 306, chap. 18, pp. 209–230. American Chemical Society, Washington, DC (1986). https://doi.org/10.1021/bk-1986-0306.ch018
- [26] Xu, K., Hu, W., Leskovec, J., Jegelka, S.: How powerful are graph neural networks? (2019), https://arxiv.org/abs/1810.00826
Appendix 0.A Appendix
0.A.1 Definitions
The definition of the ITS graph used in this work follows that of Laffitte et al. [16]. The reactant and product graphs and are disjoint unions of the relevant molecular graphs. Note that the same molecule, i.e., connected subgraphs, may appear more than once as a connected component in and , as in the case of the oxyhydrogen reaction 2H2 + O2 2H2O. In addition to the graph and , a complete specification of a reaction also requires the atom-atom map that identifies each product atom with a corresponding reactant atom.
Definition 5(ITS graph [16])
Let be a label preserving bijective function (the atom-atom map) for the reactant graph and the product graph . Then, the Imaginary Transition State (ITS) is the graph defined by the following:
-
(a)
There is a bijection ,
-
(b)
For we have iff
or , -
(c)
is labeled by the pair with labeling function
-
(i)
if
and -
(ii)
if and
-
(iii)
if
and
-
(i)
0.A.2 Feasibility as ITS Graph Property
Reaction feasibility can be seen as a global property of the ITS graph. A graph-property is said to be monotonic if it is closed under node and edge deletion (e.g.: planarity, acyclicity). Equivalently, if does not satisfy , then any graph that contains as a (not necessarily induced) subgraph does not satisfy [3]. Figure 9 shows a counterexample for reaction feasibility being a monotonic property of the ITS graph.

0.A.3 Algorithms
Algorithm 2 provides a pseudocode description for the adapted node-induced subgraph enumeration algorithm proposed by Alokshiya et al. [2]. The algorithm begins by initializing the node set with the root node , and the candidate set with the direct neighbors of . The nodes in are assigned ascending integer indices, starting from 0 at the root, thereby defining a total order on iff the index of is less than the index of . The extension DAG is initialized with a single node representing , and no edges. Two auxiliary data structures, and , are used to store the distance of each node to the root, and the parent node from where the extension is created. These structures help prune redundant exploration paths and ensure efficient traversal. For a comprehensive explanation of the underlying subgraph enumeration algorithm, refer to the work by Alokshiya et al. [2]. The function EnumerateCIS recursively extends the root node set and constructs the full extension DAG. The algorithm can be turned into a linear-delay generator by yielding the newly added node after line 19 in Algorithm 2.
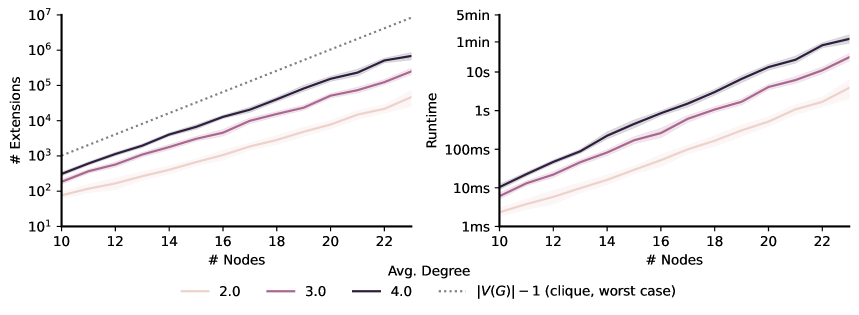
0.A.4 Complexity Analysis
ITS graphs typically have low degree and are bounded by a constant upper degree. Despite this structural simplicity and the imposed constraints, the computational complexity of finding PI explanations appears to be exponential in practice. Fig. 10 presents an empirical analysis, showing the number of generated extensions and the corresponding computation time over the number of nodes in the graph. The number of subgraphs that need to be considered is bounded above by , where is the number of edges in the reaction center. Even though the ITS graph has bounded degree because the constituting molecular graph have bounded degree, the number of connected subgraphs still grows exponentially with in general [19]. The observed growth in computation time and number of extensions suggests that computing solutions beyond small instances becomes computationally infeasible with the current approach. The small instances, however, include some of the chemically relevant problems.