Sub-Threshold Fermi-LAT Sources in the Vicinity of KM3-230312A
Abstract
The KM3NeT collaboration has recently reported the detection of an extraordinary ultra-high-energy neutrino event with an energy of 220 PeV. Ultrahigh energy neutrinos and gamma-rays are co-produced in ultrahigh energy cosmic-ray interactions. The ultrahigh energy gamma-rays produced alongside the KM3NeT neutrino may quickly cascade down to lower energies due to interactions with intergalactic photons and magnetic fields. Because of this, the KM3NeT neutrino could be accompanied by an observable GeV - TeV gamma-ray signal. We investigate the data collected by the Large Area Telescope (LAT) on-board the Fermi Gamma-ray Space Telescope for transient and sub-threshold gamma-ray sources in the vicinity of the KM3NeT neutrino. We find three sub-threshold sources with TS within of the neutrino event not included in any existing Fermi-LAT catalogs. One of the three, J0616.1-0428, is a transient sub-threshold gamma-ray source that appears only after the neutrino observation, but may be the unrelated flaring of a nearby microquasar. Another sub-threshold source, J0621.1-0610, also exhibits fluctuations in gamma-rays immediately following the neutrino observation, and may be coincident with a radio blazar. We note that the number of sub-threshold sources observed around the KM3NeT neutrino could be expected at another sky region of the same Galactic latitude, and that the fluctuations they exhibit appear to be consistent with background.
1 Introduction
The KM3NeT collaboration has recently reported the detection of an extraordinary ultra-high-energy neutrino event KM3-230213A. The event, which occurred on 13 February 2023, had properties of a muon with an estimated energy of 120 PeV. Because of its horizontal angle and very high energy, it likely originated from an astrophysical neutrino that interacted in the vicinity of the detector. The corresponding neutrino energy of 220 PeV makes the event the highest-energy neutrino observed to date (KM3NeT Collaboration et al., 2025b).
Ultrahigh energy (UHE; PeV) neutrinos and gamma-rays are the predicted counterparts of ultrahigh energy cosmic rays (UHECRs), which are charged nuclei whose energies can exceed eV. While the sources producing ultrahigh energy cosmic rays remain unknown, the neutrinos and gamma-rays produced in their interactions may be used to better understand their origins. These UHE neutrinos and gamma-rays may be produced inside a source (astrophysical origin) or by interactions of UHECRs during propagation through the cosmic microwave background (CMB) (cosmogenic origin; Ackermann et al. (2022)). UHE gamma-rays are difficult to detect because they are quickly attenuated by cosmic photon backgrounds. However, in the case of cosmogenic production, the UHE gamma-rays may generate an electromagnetic cascade (e.g., Waxman & Coppi, 1996; Mirabal, 2023; Fang et al., 2025) or synchrotron pair echo (Murase, 2012) resulting in an observable GeV-TeV signal.
Unfortunately, initial follow-up efforts have not succeeded in localizing a clear counterpart to KM3-230213A. KM3NeT Collaboration et al. (2025a) considered known blazars as candidate sources of KM3-230213A. They found four 4FGL-DR4 objects within the 99% confidence region of the neutrino event, though none of them exhibit a gamma-ray flare coinciding with or after the neutrino arrival time. In addition, Crnogorčević et al. (2025) searched for a gamma-ray cascade following the neutrino, but found no such emission. Finally, the High Altitude Water Cherenkov (HAWC) gamma-ray observatory conducted follow-up searches for TeV gamma-ray emission at the position of KM3-230213A on three time intervals after the neutrino observation, but observed no significant gamma-ray emission (Huang & HAWC Collaboration, 2025). Motivated by the lack of an observed cascaded gamma-ray signal or an identified source counterpart, we investigate the Fermi-LAT data in the vicinity of KM3-230213A for uncatalogued, sub-threshold111We consider sub-threshold sources to be those observed with less than significance and therefore not listed in the existing Fermi-LAT catalogs. sources. We find three sub-threshold sources of test statistic (TS) within of the neutrino event (note that this is relaxed beyond the 99% containment region of the neutrino, which is ). We define the TS in Section 3.
In Section 2, we outline two models motivating a GeV-TeV gamma-ray signature that may accompany KM3-230213A, as well as how this signal could be influenced by the environment in which the neutrino was produced. In Section 3, we describe our analysis procedure using the Fermi-LAT data. Based on our analysis, we uncover three uncatalogued sub-threshold sources in the vicinity of the neutrino event; in Section 4, we present details of these sub-threshold gamma-ray sources and identify their potential counterparts at lower energies.
2 Theoretical motivation
Here we briefly outline two mechanisms by which GeV-TeV gamma-ray emission could be co-produced following an UHE neutrino: inverse-Compton pair echo and synchrotron pair echo.
Inverse-Compton pair echo emission: For a neutrino of energy PeV, the pion decay gamma-rays from the same proton interaction would have energy PeV (because the pion energies are assumed to be distributed evenly among their decay products). If the neutrino was cosmogenic, i.e. produced by a cosmic-ray interaction with the CMB during propagation, the photon co-produced with the neutrino would interact with the CMB to produce an electron-positron pair. The electron and positron would in turn inverse Compton scatter off photons in the CMB to produce a new generation of gamma-rays. This process would continue until the photon energy has dropped below the threshold for pair production off the CMB and the extragalactic background light (EBL), resulting in an electromagnetic cascade. This electromagnetic cascade would exhibit a distinct spectral shape that can separate the observation from a traditional gamma-ray transient such as a blazar flare. Deflections by electrons and positrons in the intergalactic magnetic field would result in an angular deflection and time delay for the observed cascade signature, and this signature is called an inverse-Compton pair echo (e.g., Plaga, 1995; Waxman & Coppi, 1996; Dai et al., 2002; Ichiki et al., 2008; Murase et al., 2008; Murase, 2009).
The cascade emission model for the case of KM3-230213A is developed in Fang et al. (2025), and we briefly summarize their results here. The 440 PeV photon co-produced with the neutrino cascade would travel for kpc before interacting with the CMB and producing electrons through pair production. Note that this estimate assumes a redshift z = 0, which is a reasonable approximation as the angular deflection and time delay of the cascade is determined by the interaction length of the last-generation photons. In the case of KM3-230213A, assuming a source distance of 10 Mpc and an intermediate IGMF strength of G results in a time delay of 5 years and an observed angular deflection of . If the source is sufficiently distant that the cascade can fully develop, the cascade spectrum peaks at the pair production threshold energy with the EBL: , where the factor accounts for the energy redshift due to the cosmological expansion, and is the energy of the EBL photons at redshift . Note that for a nearby source with redshift , a harder spectrum is expected as the cascades do not get a chance to fully develop before observation (see Figure 4 of Fang et al. (2025) to see how the cascaded spectrum varies with source redshift). Even for sources at a high redshift, , would reach no lower than GeV. Below this peak energy, the spectrum of the cascade emission is very hard, following (e.g., Murase et al., 2012; Fang et al., 2025; Crnogorčević et al., 2025). While the source’s distance can affect the shape of the cascade spectrum, the expected flux of the cascade is primarily dependent on the strength of the intergalactic magnetic field (IGMF), which is unknown. Figures 3 of Fang et al. (2025) demonstrates how the cascade spectrum is suppressed in a stronger IGMF. The numerical estimates of the cascaded emission spectrum in Fang et al. (2025) are made using the EBL model of Domínguez et al. (2010), but in general the predictions are insensitive to this choice. Note that the cascade cannot be detected by Fermi-LAT and ground-based gamma-ray observatories if the field strength is G; for a weaker magnetic field strengths, a point-like source may appear at the location of KM3-230213A on the of years after the neutrino observation.
Synchrotron pair echo: If the UHE neutrino was produced by a hadronic interaction within the large-scale structure around the source where its parent cosmic ray was accelerated (for example a filament or the outskirt of a galaxy cluster), gamma-ray emission may be expected via the synchrotron pair echo mechanism. This mechanism is described in Murase (2012) and recently applied to the observation of gamma-ray bursts (e.g., Das et al., 2025). We extrapolate the mechanism to the case of KM3-230213A here, and provide a detailed estimate the flux of the resulting emission in Appendix A. Similarly to the cascaded emission mechanism, the PeV gamma-ray co-produced with the neutrino would initially travel for approximately 100-200 kpc before interacting with the EBL and producing electrons through pair production. In the large scale structure where the magnetic field may be on the order of tens-hundreds of nG, the pairs may lose energy to synchrotron radiation in addition to inverse Compton scattering. Assuming a field strength of nG (which is consistent with the G scale fields typically inferred for the large scale structure; Carilli & Taylor (2002)), the synchrotron emission of the secondary electrons peaks at GeV, and the time delay caused by deflections in the magnetic field may be anywhere between 0.5 to 500 yr.
In summary, if the neutrino was produced far outside the large scale structure in the presence of low IGMF, a gamma-ray signal may be expected via the inverse-Compton pair echo mechanism. If the neutrino was produced near the source in the large scale structure where there is a stronger magnetic field, a gamma-ray signal may be expected by the synchrotron pair echo mechanism. In either case, if a cosmogenic origin is assumed for KM3-230213A, a nondetection of a gamma-ray signature may be used to place a constraint on the distance at which the neutrino was produced and the strength of the magnetic field in its environment. On the other hand, it is worth noting that the gamma-ray signal following KM3-230213A may be attenuated inside an astrophysical source if the source is radio loud. As is pointed out in Fang et al. (2025), for a photon at PeV, the pair production cross section would peak for interactions with radio photons at MHz, which would be detectable by low-frequency radio observatories. In the case that the neutrino was produced inside a source with a sufficiently luminous radio field around this frequency, the corresponding gamma-ray signal could be fully attenuated and may not be detected. Because of this, if no gamma-ray signature is observed to follow KM3-230213A, radio-loud sources, in particular those known to emit high-energy radiation, may be particularly interesting candidates for the neutrino’s origin.
3 LAT Analysis
We utilized the Fermitools222https://fermi.gsfc.nasa.gov/ssc/data/analysis/documentation/ package (v.2.2.0) and fermipy package (v. 1.3.0) (Wood et al., 2017) to search for potential secondary gamma-ray emission associated with the KM3-230213A. Given that the secondary emission and synchrotron pair echoes are anticipated to peak in the GeV-TeV energy range, we analyze events from 1 GeV to 1 TeV. We consider datasets over two different time intervals: the first interval is from MJD = 59988.00 to MJD = 60766.00, which corresponds to February 13, 2023 (the time of arrival of KM3-230213A) until April 1, 2025. The second dataset covers the time range from MJD = 54683.00 to MJD = 60766.00, which corresponds to all data taken by Fermi-LAT from August 5, 2008 until April 1, 2025. We selected events from the Pass 8 SOURCE class (Atwood et al., 2013; Bruel et al., 2018) within a degrees Radius of Interest (RoI) centred at the best-fit position of KM3-230213A and applied a maximum zenith angle cut of to minimize contamination from the Earth’s limb. The P8R3_SOURCE_V3 instrumental response functions are adopted. Additional contributions from nearby point sources were accounted for using the 4FGL-DR4 (Ballet et al., 2023) catalog and standard background templates for the Galactic diffuse emission (gll_iem_v07.fits)333https://fermi.gsfc.nasa.gov/ssc/data/analysis/software/aux/4fgl/Galactic_Diffuse_Emission_Model_for_the_4FGL_Catalog_Analysis.pdf and the isotropic component (iso_P8R3_SOURCE_V3_v1.txt)444The Galactic and isotropic diffuse emission templates can be downloaded at https://fermi.gsfc.nasa.gov/ssc/data/access/lat/BackgroundModels.html. within of the RoI center. The RoI has pixel sizes of .
In order to identify potential excess emission in the region of interest, we generated a test-statistic (TS) map using the fermipy function gta.tsmap. This function produces a TS map by introducing a tentative point source at every position in the region and calculating the likelihood ratio between the previously optimized model and the best-fit model with the additional test source. Here, represents the likelihood of the original model and indicates the likelihood of the model with the added source. The test statistic is then defined as TS .
To locate the most significant features in the region of interest, we first free the region using the fermipy function gta.free_sources, which frees the spectral parameters and normalization for all sources in the model. We then use the iterative source-finding algorithm gta.find_sources to identify emission peaks on the TS map. We constrain the positions of identified sub-threshold sources using gta.localize, and use these coordinates to add each sub-threshold source to our model. To evaluate the test-statistic of a potential source using one degree of freedom, we allow the normalization of the isotropic and Galactic diffuse background components, as well as sources with TS , to vary during fitting, but we hold the spectral parameters of all sources fixed (the candidate sub-threshold source’s spectral index is fixed as , which is the default value in fermipy). Finally, we free all parameters in the region using gta.free_sources and generate a new fit with the added sub-threshold sources using gta.fit. Using the output of this final fit, we generate a light curve using gta.lightcurve and a TS Map using gta.tsmap. By default, gta.tsmap assumes that each test source is a point source with power law spectral index . The shape parameters of the test source and the parameters of background components remain fixed when a during this step of analysis (the background components are allowed to vary during the initial fit). For the spectral energy density (SED) analysis, we extend the energy range of our analysis to 500 MeV - 1 TeV. On this energy range, we free the region using gta.free_sources and generate a gta.fit with the added sub-threshold sources. We use the output of this fit to evaluate the best-fit spectral index and expected energy flux of each sub-threshold source. Finally, we generate an SED for each sub-threshold source using gta.sed.555Example scripts for reproducing our analysis can be found at https://github.com/angelinapartenheimer/Fermi-LAT-analysis-example
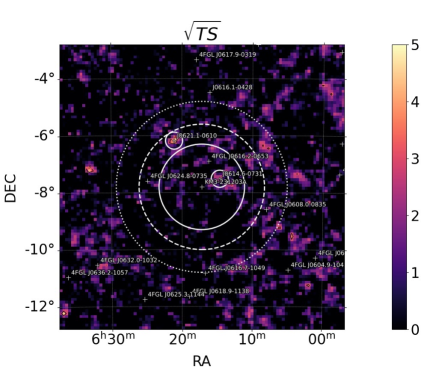
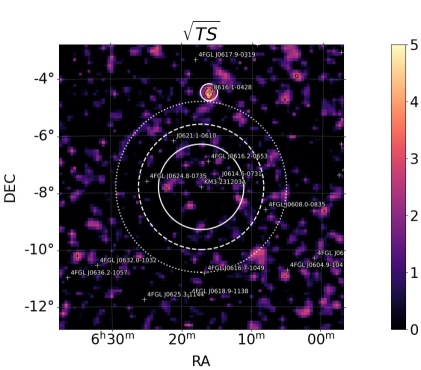
We relaxed our search criteria slightly beyond the 99% error circle (radius ) defined by the KM3NeT collaboration, and instead consider all sources within of KM3-230213A; this ensures that any sources falling at the edge of the error circle or sources with extended emission are captured in the analysis. We select sub-threshold sources with TS (which corresponds to roughly significance) that fall within this radius of KM3NeT. We perform separate searches using the two-year post-neutrino dataset and the all-time dataset. We identify three sub-threshold sources that meet these criteria, one of which is a transient sub-threshold gamma-ray source that appears only after the observation of KM3-230213A.
4 Results
| J0616.1-0428 | J0614.6-0731 | J0621.1-0610 | |
| Dataset: | post-neutrino (2 year) | all-time (17-year) | all-time (17-year) |
| TS: | 19 | 16 | 21 |
| Right ascension: | |||
| Declination: | |||
| Localization (95% conf): | |||
| Offset: | |||
| Spectral index: | |||
| Energy flux (erg cm-2 s-1): | |||
| Notable counterparts: | 1eRASS J061605.3-043303 | NVSS J061448-073001 | ICRF J062110.3-060954 |
| NVSS J061605-043301 | 1eRASS J061439.9-073357 | ||
| 2MASS J06160546-0432594 | |||
| References: | Chuprikov et al. (2004) | Charlot et al. (2020) | |
| D’Abrusco et al. (2014) | |||
| Notes: | microquasar candidate | radio blazar |
For each sub-threshold source, we searched for high-energy counterparts in a variety of source catalogs using the database source search tools such as Simbad (Wenger et al., 2000), the NASA/IPAC Extragalactic Database (NED)666https://ned.ipac.caltech.edu, and the XAMIN search tool provided by NASA’s High Energy Astrophysics Science Archive Research Center. In particular, we considered sources in catalogs from the extended ROentgen Survey with an Imaging Telescope Array (eROSITA) (Merloni et al., 2024), the NRAO 1.4 GHz VLA Sky Survey (NVSS) (Condon et al., 1998), and the Two Micron All Sky Survey (2MASS) (Skrutskie et al., 2006), the Wide-field Infrared Survey Explorer (WISE) (Wright et al., 2010). While we describe the most notable counterparts that we find, these observations should be considered as purely informative and not as a formal counterpart search.
4.1 Post-neutrino ( 2) year dataset: a sub-threshold transient source
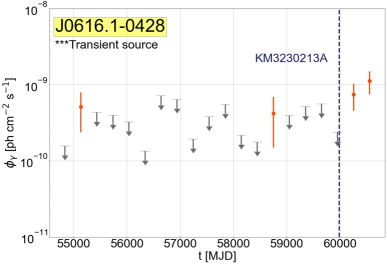
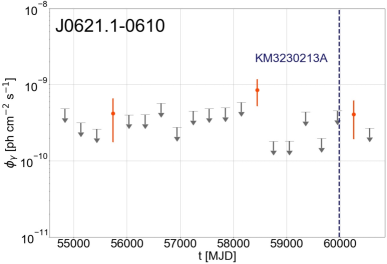
J0616.1-0428: We identify one sub-threshold transient source that appears after the observation of KM3-230213A. This sub-threshold source is labeled J0616.1-0428 and has a TS (see Figure 1). Using gta.localize, we find a position for the candidate source (J2000) RA: 06:16:05.52 Dec:–04:28:46.08 with a 95% confidence radius of 0.12 degrees, which corresponds to an offset of from KM3-230213A. The light curve is shown in Figure 2 and reveals marginal initial activity approximately 200 days after the KM3NeT detection, with a more prominent peak occurring around 650 days post-neutrino event.
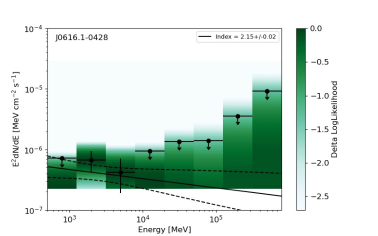
The Fermi-LAT flux of this source on the time interval following the observation of KM3-230213A (from February 13, 2023 until April 1, 2025) is calculated to be erg cm-2 s-1 with a spectral index of . The majority of the signal is detected at energies where the LAT effective area peaks, specifically between 1-10 GeV (see Figure 3). While the emission is transient, it does not exhibit the characteristics of electromagnetic cascade radiation, as the observed spectrum is much softer than what is expected for such a scenario. Using the full year dataset, a point source at the position of J0616.1-0428 has a TS = 6, which indicates that the candidate source is a truly transient event and does not appear as a steady-state sub-threshold source during the full duration of Fermi-LAT observation. The SED analysis using 17 years of LAT data prior to the neutrino event suggests an upper limit for the flux of erg cm-2 s-1 at the sub-threshold source’s location.
The most interesting counterpart we find for this transient sub-threshold gamma-ray source is the eROSITA X-ray source 1eRASS J061605.3-043303, which is located 4.31’ away from J0616.1-0428 and has a flux of erg/cm2/s on the 0.2-2.3 keV band. The eROSITA source falls within less than 0.1’ from the infrared source 2MASS J06160546-0432594 (magnitude ) and the radio point source NVSS J061605-043301 (which has a flux density of mJy on the 1.4 GHz band and is relatively faint). The radio point source also appears in the VLASS survey (Lacy et al., 2020) as VLASS1QLCIR J061605.50-043259.2 with an integrated flux of mJy. Notably, the infrared source 2MASS J06160546-0432594 has been identified as a possible microquasar candidate in Chuprikov et al. (2004)777https://images.astronet.ru/pubd/2008/09/28/0001230826/447-452.pdf. However, no spectroscopic confirmation has been reported in the literature. The counterpart is identified in the Gaia catalog as having a very high () probability of being a star, and a near-zero probability of being a quasar or galaxy. Microquasars have been known to flare in the GeV band (Prokhorov & Moraghan, 2022; Bodaghee et al., 2013; Martí-Devesa & Olivera-Nieto, 2025), and if the candidate source is indeed a microquasar flaring in gamma-rays it would lack the sufficient bolometric luminosity to generate a neutrino with the energy of KM3-230213A.
4.2 Full ( 17) year dataset: sub-threshold sources
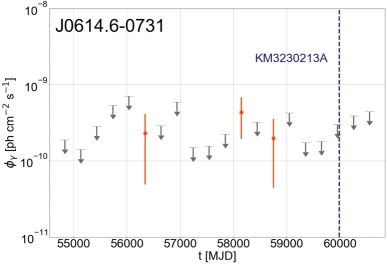
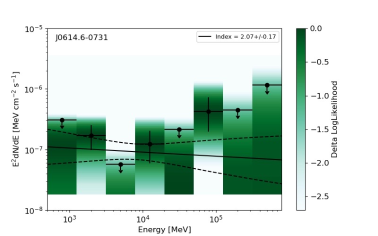
J0614.6-0731: The nearest sub-threshold source with respect to KM3-230213A is J0614.6-0731, which has a TS . We localize the candidate source to a position of RA: 06:14:39.5 Dec:–07:30:51.7 with a 95% confidence radius of . This corresponds to an offset of , which is within the 68% error circle of KM3-230213A. This sub-threshold source falls 2.4’ from the radio source NVSS J061448-073001 and 3.1’ from the eROSITA X-ray source 1eRASS J061439.9-073357. The light curve indicates that any gamma-ray fluctuations occurred before KM3-230213A, with the most recent fluctuation preceding the neutrino by about three years. Performing a spectral analysis yields a spectral index of and an energy flux of erg cm-2 s-1.
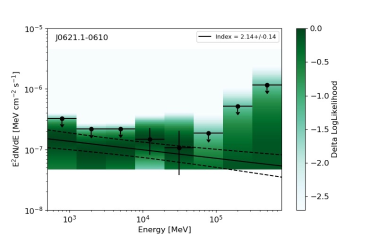
J0621.1-0610: The most significant sub-threshold source that appears in the vicinity of KM3-230213A is J0621.1-0610 with a TS . We localize this candidate source to the position RA: 6:21:6.70 Dec:–06:10:33.3 with a 95% confidence radius of . This position corresponds to an offset of and is located within the 90% error circle of KM3-230213A. The sub-threshold source appears to have had four upward fluctuations in gamma-rays in the past fifteen years, with the most recent fluctuation occurring coincident with the KM3-230213A (see Figure 2). Using only the year time interval following KM3-230213A, this candidate source has a TS of , which falls slightly below our defined threshold of TS and is the reason that we did not identify this as a transient sub-threshold source using the two-year dataset. The sub-threshold source has a spectral index of and a predicted energy flux of erg cm-2 s-1. The emission peaks on 10 - 100 GeV (see Figure 3).
J0621.1-0610 falls within 1’ of ICRF J062110.3-060954, which is a radio-loud blazar (Charlot et al., 2020). This source has an estimated integrated flux density of 66 mJy on the X-band and 81 mJy on the S-band. This source appears in other catalogs as WISE J062110.35-060954.0, 2MASS J06211034-0609539, and NVSS J062110-060954. It also appears in the WISE Blazar-like Radio-Loud Source catalog (D’Abrusco et al., 2014, 2019) as WIBRaLS J0621-0609, where it is idenitified as a BL Lac.
Note that in the light curves shown in Figure 2, many of the points indicating above observation are very close to the level of the upper limits and are not inconsistent with background fluctuations. For the 20 bins comprising the light curve, a background observation is expected to have one bin fluctuate above the 95% confidence level. For a source that is near threshold, upward fluctuations of three or four bins are consistent with statistical variation, and should not be considered good indicators of the source’s activity.
5 Summary and discussion
In this work, we investigated sub-threshold Fermi-LAT sources in the vicinity of the ultrahigh energy KM3NeT neutrino event KM3-230213A. With an energy of 220 PeV, KM3-230213A would be co-produced with a gamma-ray photon of energy PeV. Such a gamma-ray photon could interact with its surrounding medium and produce an electromagnetic cascade or a synchrotron echo, both of which would produce a GeV-TeV signal observable in the Fermi-LAT data. Notably, such a signal may lag the observation time of KM3-230213A by a duration of days to years depending on the strength of the magnetic field in the environment where the gamma-ray interacts. On the other hand, if the source of the neutrino is radio loud, the corresponding gamma-ray signature may be strongly attenuated by the photon field inside the source.
We used the Fermi-LAT data to search for sub-threshold sources with TS that fall within degrees of the KM3-230213A localization, a search area slightly relaxed beyond the 99% containment region of for KM3-230213A. We searched two datasets separately: the first one uses the complete 17-year dataset from all Fermi-LAT observations. The second one uses the years of data from the observation time of KM3-230213A until April 1, 2025. We uncovered 3 sub-threshold sources that are not catalogued by Fermi-LAT. Two sub-threshold sources are detected on the all-time dataset, while one candidate source seems to be a transient sub-threshold gamma-ray source that becomes significant only after the observation of KM3-230213A.
The transient sub-threshold gamma-ray source (J0616.1–0428) is located just outside the 99% error circle of KM3—230213A and is of interest because of its temporal coincidence with the observation of the neutrino. However, this sub-threshold source may be the unrelated flaring of a microquasar, in which case it would have insufficient bolometric luminosity to produce a hundreds of PeV neutrino. We note, however, that Fermi-LAT evidence for GeV emission in microquasars is limited to the three of the brightest microquasars ever observed (Martí-Devesa & Olivera-Nieto, 2025). While a firm identification of a microquasar as a gamma-ray emitter would be extremely interesting, it requires confirmation using correlated variability with a different wavelength.
Another sub-threshold source that has an upward fluctuation after the neutrino observation is J0621.1-0610, which appears on the full 17-year dataset and falls within the 90% error circle of KM3-230213A. While this candidate source has had three upward fluctuations in gamma-rays in the years preceding KM3-230213A, the most recent fluctuation occurs immediately after the neutrino observation. This sub-threshold source appears to be coincident with a known radio blazar, and is identified in D’Abrusco et al. (2014) as a BL Lac. Note that for all the sub-threshold sources discussed in this work, the fluctuations observed in the light curves are consistent with natural statistical variation and are not a good indicator of the source’s intrinsic variability.
As a simple check to determine whether or not the number of sub-threshold sources that we identified around KM3-230213A was unusual, we performed a source search analysis with a patch of sky centered on RA: 19:36:48.00 Dec: -3:41:2.40, which is at the same Galactic latitude as KM3-230213A but away in Galactic longitude. Here we also find two sub-threshold sources with TS and offset less than from the RoI center, which indicates that the number of sub-threshold sources we find is roughly consistent with the number of sub-threshold sources expected in other sky regions of the same Galactic latitude. This test demonstrates that the number of sub-threshold sources uncovered around KM3-230213A could be found in a different sky region at the same latitude; in other words, the sub-threshold emission around KM3-230213A does not appear to be unusual or unique.
The observation of the unprecedented neutrino event KM3-230213A and a lack of an easily-identified counterpart strongly motivates multifrequency follow-up observations and continued monitoring in the GeV-TeV band. While this analysis only considered years of observation following KM3-230213A, depending on the distance of and magnetic field surrounding the neutrino’s counterpart source, a detectable gamma-ray flare following the neutrino may have a time delay of up to five years, and a delayed gamma-ray signature could still be anticipated. In addition, follow-up observations in the X-ray band, for example with the Neil Gehrels Swift telescope which is especially sensitive to transient sources, would also be useful for further monitoring of the variability of any candidate sources. In addition, with the advent of the Vera Rubin Observatory (Brough et al., 2020), there will also be a great opportunity to search for possible optical transient counterparts to the neutrino. Finally, it is worth noting that if the source that produced the neutrino was radio-loud, it could obscure the corresponding gamma-ray signature. Because of this, dedicated radio observations of any potential radio counterparts could be especially informative.
Acknowledgments
K.F. acknowledges support from the National Science Foundation (PHY-2238916) and the Sloan Research Fellowship. This work was supported by a grant from the Simons Foundation (00001470, KF). We also acknowledge NSF Grants Nos. AST-2108466 (K.M.), AST-2108467 (K.M.), AST-2308021 (K.M.), and KAKENHI No. 20H05852 (K.M.). The material is based upon work supported by NASA under award number 80GSFC24M0006. This research has made use of data and web tools obtained from the High Energy Astrophysics Science Archive Research Center (HEASARC), a service of the Astrophysics Science Division at NASA/GSFC and of the Smithsonian Astrophysical Observatory’s High Energy Astrophysics Division. This research has also made use of the NASA/IPAC Extragalactic Database, which is funded by the National Aeronautics and Space Administration and operated by the California Institute of Technology.
The Fermi-LAT Collaboration acknowledges generous ongoing support from a number of agencies and institutes that have supported both the development and the operation of the LAT as well as scientific data analysis. These include the National Aeronautics and Space Administration and the Department of Energy in the United States,the Commissariat à l’Energie Atomique and the Centre National de la Recherche Scientifique / Institut National de Physique Nucléaire et de Physique des Particules in France, the Agenzia Spaziale Italiana and the Istituto Nazionale di Fisica Nucleare in Italy, the Ministry of Education, Culture, Sports, Science and Technology (MEXT), High Energy Accelerator Research Organization (KEK) and Japan Aerospace Exploration Agency (JAXA) in Japan, and the K. A. Wallenberg Foundation, the Swedish Research Council and the Swedish National Space Board in Sweden. Additional support for science analysis during the operations phase from the following agencies is also gratefully acknowledged: the Istituto Nazionale di Astrofisica in Italy and the Centre Nationald’Etudes Spatiales in France. This work performed in part under DOE Contract DE-AC02-76SF00515.
References
- Ackermann et al. (2022) Ackermann, M., Agarwalla, S. K., Alvarez-Muñiz, J., et al. 2022, High-Energy and Ultra-High-Energy Neutrinos. https://arxiv.org/abs/2203.08096
- Atwood et al. (2013) Atwood, W., Albert, A., Baldini, L., et al. 2013, arXiv e-prints, arXiv:1303.3514, doi: 10.48550/arXiv.1303.3514
- Ballet et al. (2023) Ballet, J., Bruel, P., Burnett, T. H., Lott, B., & The Fermi-LAT collaboration. 2023, arXiv e-prints, arXiv:2307.12546, doi: 10.48550/arXiv.2307.12546
- Bodaghee et al. (2013) Bodaghee, A., Tomsick, J. A., Pottschmidt, K., et al. 2013, The Astrophysical Journal, 775, 98, doi: 10.1088/0004-637x/775/2/98
- Brough et al. (2020) Brough, S., Collins, C., Demarco, R., et al. 2020, The Vera Rubin Observatory Legacy Survey of Space and Time and the Low Surface Brightness Universe. https://arxiv.org/abs/2001.11067
- Bruel et al. (2018) Bruel, P., Burnett, T. H., Digel, S. W., et al. 2018, arXiv e-prints, arXiv:1810.11394, doi: 10.48550/arXiv.1810.11394
- Carilli & Taylor (2002) Carilli, C. L., & Taylor, G. B. 2002, Annual Review of Astronomy and Astrophysics, 40, 319–348, doi: 10.1146/annurev.astro.40.060401.093852
- Carpio et al. (2023) Carpio, J. A., Kheirandish, A., & Murase, K. 2023, JCAP, 04, 019, doi: 10.1088/1475-7516/2023/04/019
- Charlot et al. (2020) Charlot, P., Jacobs, C. S., Gordon, D., et al. 2020, A&A, 644, A159, doi: 10.1051/0004-6361/202038368
- Chuprikov et al. (2004) Chuprikov, A., Ishwara Chandra, C. H., Guirin, I., & Tsarevsky, G. 2004, Astronomical and Astrophysical Transactions, 23, 447, doi: 10.1080/1055679042000272695
- Condon et al. (1998) Condon, J. J., Cotton, W. D., Greisen, E. W., et al. 1998, AJ, 115, 1693, doi: 10.1086/300337
- Crnogorčević et al. (2025) Crnogorčević, M., Blanco, C., & Linden, T. 2025, Looking for the -Ray Cascades of the KM3-230213A Neutrino Source. https://arxiv.org/abs/2503.16606
- Dai et al. (2002) Dai, Z. G., Zhang, B., Gou, L. J., Mészáros, P., & Waxman, E. 2002, ApJ, 580, L7, doi: 10.1086/345494
- Das et al. (2025) Das, S., Razzaque, S., Mirabal, N., et al. 2025, arXiv e-prints, arXiv:2504.15890, doi: 10.48550/arXiv.2504.15890
- Dermer et al. (2012) Dermer, C. D., Murase, K., & Takami, H. 2012, Astrophys. J., 755, 147, doi: 10.1088/0004-637X/755/2/147
- Domínguez et al. (2010) Domínguez, A., Primack, J. R., Rosario, D. J., et al. 2010, Monthly Notices of the Royal Astronomical Society, 410, 2556–2578, doi: 10.1111/j.1365-2966.2010.17631.x
- D’Abrusco et al. (2014) D’Abrusco, R., Massaro, F., Paggi, A., et al. 2014, The Astrophysical Journal Supplement Series, 215, 14, doi: 10.1088/0067-0049/215/1/14
- D’Abrusco et al. (2019) D’Abrusco, R., Álvarez Crespo, N., Massaro, F., et al. 2019, The Astrophysical Journal Supplement Series, 242, 4, doi: 10.3847/1538-4365/ab16f4
- Eskenasy et al. (2023) Eskenasy, R., Kheirandish, A., & Murase, K. 2023, Phys. Rev. D, 107, 103038, doi: 10.1103/PhysRevD.107.103038
- Fang et al. (2025) Fang, K., Halzen, F., & Hooper, D. 2025, ApJ, 982, L16, doi: 10.3847/2041-8213/adbbec
- Huang & HAWC Collaboration (2025) Huang, D., & HAWC Collaboration. 2025, The Astronomer’s Telegram, 17069, 1
- Ichiki et al. (2008) Ichiki, K., Inoue, S., & Takahashi, K. 2008, Astrophys. J., 682, 127, doi: 10.1086/588275
- KM3NeT Collaboration et al. (2025a) KM3NeT Collaboration, MessMapp Group, Fermi-LAT Collaboration, et al. 2025a, arXiv e-prints, arXiv:2502.08484, doi: 10.48550/arXiv.2502.08484
- KM3NeT Collaboration et al. (2025b) KM3NeT Collaboration, S., A., Albert, A., Alhebsi, A. R., et al. 2025b, Nature, 638, 376, doi: 10.1038/s41586-024-08543-1
- Lacy et al. (2020) Lacy, M., Baum, S. A., Chandler, C. J., et al. 2020, PASP, 132, 035001, doi: 10.1088/1538-3873/ab63eb
- Martí-Devesa & Olivera-Nieto (2025) Martí-Devesa, G., & Olivera-Nieto, L. 2025, ApJ, 979, L40, doi: 10.3847/2041-8213/ada14f
- Merloni et al. (2024) Merloni, A., Lamer, G., Liu, T., et al. 2024, Astronomy amp; Astrophysics, 682, A34, doi: 10.1051/0004-6361/202347165
- Mirabal (2023) Mirabal, N. 2023, Mon. Not. R. Astron. Soc., 519, L85, doi: 10.1093/mnrasl/slac157
- Murase (2009) Murase, K. 2009, Phys. Rev. Lett., 103, 081102, doi: 10.1103/PhysRevLett.103.081102
- Murase (2012) —. 2012, Astrophys. J. Lett., 745, L16, doi: 10.1088/2041-8205/745/2/L16
- Murase et al. (2012) Murase, K., Beacom, J. F., & Takami, H. 2012, JCAP, 08, 030, doi: 10.1088/1475-7516/2012/08/030
- Murase et al. (2008) Murase, K., Takahashi, K., Inoue, S., Ichiki, K., & Nagataki, S. 2008, Astrophys. J. Lett., 686, L67, doi: 10.1086/592997
- Plaga (1995) Plaga, R. 1995, Nature, 374, 430, doi: 10.1038/374430a0
- Prokhorov & Moraghan (2022) Prokhorov, D. A., & Moraghan, A. 2022, Monthly Notices of the Royal Astronomical Society, 519, 2680–2689, doi: 10.1093/mnras/stac3453
- Skrutskie et al. (2006) Skrutskie, M. F., Cutri, R. M., Stiening, R., et al. 2006, AJ, 131, 1163, doi: 10.1086/498708
- Waxman & Coppi (1996) Waxman, E., & Coppi, P. 1996, ApJ, 464, L75, doi: 10.1086/310090
- Wenger et al. (2000) Wenger, M., Ochsenbein, F., Egret, D., et al. 2000, A&AS, 143, 9, doi: 10.1051/aas:2000332
- Wood et al. (2017) Wood, M., Caputo, R., Charles, E., et al. 2017, Fermipy: An open-source Python package for analysis of Fermi-LAT Data. https://arxiv.org/abs/1707.09551
- Wright et al. (2010) Wright, E. L., Eisenhardt, P. R. M., Mainzer, A. K., et al. 2010, AJ, 140, 1868, doi: 10.1088/0004-6256/140/6/1868
Appendix A Synchrotron Pair Echo Emission
If the UHE neutrino was produced within the large-scale structure around the source where it was accelerated, gamma-ray emission may be expected via the synchrotron pair echo mechanism. Such a mechanism was proposed in Murase (2012), and has been applied to the observations of blazars Dermer et al., 2012 and gamma-ray bursts (e.g., Das et al., 2025), and we extrapolate it to KM3-230213A here.
Electrons and positrons from the interaction of the UHE photons accompanying the neutrino may be confined in a magnetized region and produce synchrotron radiation. Assuming a field strength of nG (which is consistent with the sub-G scale fields typically inferred for the large scale structure (Carilli & Taylor, 2002)), the synchrotron emission of the secondary electrons, at an energy of PeV or , peaks at
| (A1) |
where is the pitch angle of the electron with respect to the magnetic field. Note that should be expected in the deep Klein-Nishina regime (Murase, 2009). The electrons lose their energy over the electron cooling length scale, which is given by:
| (A2) |
with being the Thomson cross section and being the magnetic energy density. Since is much shorter than the cooling distance of the electrons by inverse Compton scattering the CMB photons, electrons lose most of their energies through the synchrotron radiation at this energy (Murase, 2012). Assuming that the field is coherent over the electron cooling length, the typical deflection angle of the electrons in the magnetic field is
| (A3) |
where is the electron’s Larmor radius. As a result of the electron deflection, the synchrotron photons that reach the observer are separated from the source by an angle of
| (A4) |
where is the interaction length due to electron-positron pair production (see, e.g., Figure 1 of Fang et al., 2025) and is the source distance. The time delay of the synchrotron photons with respect to the neutrinos is (Murase, 2012)
| (A5) |
where is the scale of the large scale structure in which the interaction occurs (assumed to be Mpc) and therefore . Note that for the cosmic microwave background , but can also be as low as pc due to the infrared field of active galactic nuclei (see, Figure 9 of Dermer et al., 2012). This results in a range of possible time delays yr and observed deflection angles .
The fraction of the total flux from the synchrotron pair ‘echo’ emission observed at following the neutrino may be estimated as
| (A6) |
where is the distribution function of delayed photons for a given . The distribution function depends on the energy distribution of the primary photons as well as the strength and structure of the magnetic field, and needs to be evaluated either analytically or numerically. Similar calculations for echo emission mechanisms can be found in Ichiki et al. (2008); Eskenasy et al. (2023); Carpio et al. (2023); an extremely simple approximation that may be invoked in the case that is . The total gamma-ray flux may be estimated as in the photomeson production scenario. For the case of KM3-230213A, the observed neutrino flux can be estimated as , where is the full-sky averaged per-flavor intensity inferred by the KM3NeT event (KM3NeT Collaboration et al., 2025b), and days is the livetime of ARCA used to derive the isotropic flux.
Appendix B Spectral energy distribution of sub-threshold sources
Here we present the spectral energy distributions of the three sub-threshold Fermi-LAT sources in the vicinity of KM3-230213A. The spectra are evaluated on 500 MeV - 1 TeV. The spectra are evaluated using the full year dataset for J0614.6-0731 and J0621.1-0610, while the spectrum for J0616.1-0428 is evaluated on the year dataset following KM3-230213A. The initial fit is performed after adding the sub-threshold sources to the model and freeing all parameters. The spectral energy distributions are evaluated using fermipy SED fitting function gta.sed, which assumes a powerlaw spectrum with spectral index within each energy bin. In the legend we also list the overall best-fit spectral index.
]