language = [5.0]Lua, basicstyle = , showstringspaces = false, upquote = true,
Literate Tracing
Abstract.
As computer systems grow ever larger and more complex, a crucial task in software development is for one person (the system expert) to communicate to another (the system novice) how a certain program works. This paper reports on the author’s experiences with a paradigm for program documentation that we call literate tracing. A literate trace explains a software system using annotated, concrete execution traces of the system. Literate traces complement both in-code comments (which often lack global context) and out-of-band design docs (which often lack a concrete connection to the code). We also describe TReX, our tool for making literate traces that are interactive, visual, and guaranteed by construction to be faithful to the program semantics. We have used TReX to write literate traces explaining components of large systems software including the Linux kernel, Git source control system, and GCC compiler.
1. Introduction
The dream of production-quality computing systems small enough to be casually studied and customized is dead. Our kernels, compilers, and browser engines have grown large and unwieldy. It often seems impossible for any one person to understand whole systems; even experienced programmers might need days or weeks to understand a subsystem well enough to make a seemingly trivial change.
Users rightfully demand that their software support an ever-growing set of hardware and software configurations while being secure, reliable and performant. Despite virtuous attempts to reduce the size and complexity of modern software systems (Kay et al., 2006; Martin, 2009; Ousterhout, 2018), these modern user demands fundamentally conflict with small, hackable systems design.
Hence, we must design techniques that make it easier to bring novices up-to-speed to understand and work with these complex systems. Comments, for example, help give the new reader of a piece of code higher level intuition for its behavior. Unfortunately, because they are located in the code itself, they tend to be most useful for local context: it is hard for a comment in one module to explain that module’s relation to any number of possible interacting modules. Furthermore, comments can obscure the code and cannot support explanatory diagrams and long prose.
Documentation written separate from the source code can more easily focus on the global structure of the code without being tied to any particular line in the code, and encourages custom diagrams and extended prose. Unfortunately, it tends to be too high level, not giving the reader much indication of how and where exactly the code implements this high-level design, and silently falls out-of-sync as the codebase evolves.
This paper describes literate tracing, a technique for explaining software systems that helps bridge comments and out-of-band documentation. A literate trace is a document explaining how a software system works by walking the reader through concrete execution traces of the system. Like out-of-band documentation, a literate trace is separate from the code. What makes a literate trace special is that its structure is centered around concrete execution traces of the program, helping the reader see exactly where in the code a certain high-level action happens. With proper tools (Section 3), authors can extract engaging visualizations of a running program’s internal state even for modern systems software like the Linux kernel, GCC compiler, and Git source control system. Portions of the trace that are relatively unimportant or uninteresting can be skipped over without fear, as the reader can see any relevant effects of the skipped-over portions on the concrete state.
From the documentation author’s perspective, literate tracing is a rewarding way to understand and document systems. It involves reifying one’s understanding of a system into a concrete object (the literate trace) that can be shared with others. This turns the task of reading a program into the task of writing a program (the program that generates the literate trace and visualizations), which is a task programmers often prefer. This gives us hope for a future where writing and sharing a literate trace becomes the natural next step after studying a large system. Computer users everywhere could benefit from these traces, as they make the software running on their computers easier to understand and modify.
2. Literate Tracing by Example
The following pages contain an excerpt from our literate trace of Knuth’s program to compute the most frequent words in a file (Bentley et al., 1986; Knuth, 1984), originally written as an early public examples of his literate programming technique, which had the goal of inverting the relationship between comments and source code. We now suggest the reader finish reading the excerpt in full before returning to this analysis. Readers with additional time might appreciate also reading Knuth’s literate programming version for comparison (Bentley et al., 1986) and our other example traces at https://lair.masot.net/trex.
The program is not trivial, and no explanation would make it so. But the literate tracing approach has the benefit of explaining the complicated hash trie insertion routine via concrete examples and ample visualization of the state of the internal data structure. In fact, the need for a visualization of this data structure was one focus of Doug McIlroy’s critique of Knuth’s literate program (McIlroy, 1986). Our literate tracing tool, TReX, makes it easy to generate such visualizations programmatically, at document build time, from a running instance of the program using the GDB API (Section 3). This means the reader always sees a visualization of program state that is guaranteed to reflect the actual source code. Literate traces can display the same information at different levels, e.g., both the graph visualization and the underlying arrays encoding the trie in memory, to help the reader understand how the high-level visualizations connect to the code.
Literate tracing also departs from literate programming in that a literate trace need not show the reader the entirety of the codebase, only the portions that the author feels are most relevant. Our literate trace skips over the entirety of the input/output code in favor of focusing on the meaty hash trie structure; Knuth’s literate program (because it is itself the program) must describe every line of code (including input–output boilerplate and a “somewhat tedious set of assignments”) somewhere in the document. In fact, literate traces are not even tied to explaining a single program: in this very example, we found it useful to switch partway through to tracing a version with a particularly bad pseudorandom number generator in order to demonstrate the hash collision behavior. Switching between multiple different program variants was also particularly useful in our trace of Knuth’s prime number generator program (Knuth, 1984), building it up one optimization at a time from a naïve implementation.
2.1. HTML Literate Traces
In addition to static literate traces written in LaTeX, TReX supports the generation of interactive literate traces in HTML. The main benefit of the HTML version is that it supports easy creation of interactive single-steppers that the user can scrub through to see in step-by-step detail the operation of the program. In the interactive HTML version of this trace (available at https://lair.masot.net/trex), the visualization is updated every time the user steps to a new line, so they can see how the code affects the trie. Another benefit is that HTML documents do not have page breaks, so it avoids the annoyance common in PDF documents of worrying about figures, code, and prose that cross page boundaries. Finally, it frees the author from deciding exactly which steps to display to the user and instead allows them to focus on the bigger picture visualizations and structure of the document.
These benefits do come with tradeoffs. Heavy reliance on interactive single-steppers robs the reader of the ability to print and study traces offline. And the existence of the single-stepper option tempts the author into trading off prose explanations for longer and more fine-grained single-stepping traces that the reader is forced to step through themselves. This makes the author’s life easier, but gives the reader much less direction regarding what to focus on.
2.2. Other Modes of Literate Tracing
Many systems are far too large to expect any one reasonably sized document to explain every part of the program. We now discuss a few styles of literate tracing that are more applicable to such scenarios.
2.2.1. Explaining One Slice of the Program
It is often useful to focus on one specific task that the system performs rather than overwhelm the reader with a complete catalogue of its possible behavior. Understanding one slice of the program can allow the reader to make a specific change that they are interested in, and the knowledge they learn from that one slice frequently generalizes to other parts of the system as well. For example, our trace of the Git source control system (Torvalds, [n. d.]) works through examples of how the add and commit commands work; enough to get a sense of the internal structure of Git without getting bogged down in the minutiae of every single Git command and feature. The main benefit of literate tracing here is to break through abstraction barriers: the reader sees exactly where in the code actions, like a file being written to disk, occur in a way that is obscured by different layers of abstraction (such as ref transactions and file locks) in the original code.
2.2.2. Explain the Top Abstraction Level
Other times, it is more profitable to take a shallow and wide approach, where all of the important program tasks are discussed, but details of the implementation of some of those tasks are hidden. (Continued after example.)
See pages 1,2,4,5,6,7,8,9,10,11 of knuth.pdf
We used this shallow-and-wide approach to trace the MiniSAT SAT solver (Eén and Sörensson, 2003). MiniSAT contains nontrivial data structures for variable decision heuristics and boolean propagation. Our literate trace covers its main features (variable decisions, boolean propagation, and clause learning) while glossing over low-level data structure implementation details. Glossing over low-level details can frustrate readers, who need to understand the effect of the skipped-over code before understanding the higher-level design. Literate tracing ameliorates this problem: even though some low-level code is skipped over, the effects of that code are visible in the concrete state visualization. For example, when a variable is popped from the heap, the reader can immediately see how the heap changes and that the variable that was the root of the heap is now the next variable to be guessed.
2.2.3. Algorithms in the Wild: Explaining a Module
In a classroom setting, students often want to see that the concepts they are learning have meaningful applications. Literate traces can make this connection for students, allowing them to appreciate the use of a concept in the context of a production system. Here the goal is not necessarily for the student to come away with a detailed understanding of the system in question, or be able to make any meaningful changes to it. Rather, the goal is for them to see a connection between what they are learning in lecture and a real system, and give them some jumping-off points (a callstack or a few key functions) for them to explore more.
In the context of an undergraduate algorithms course we have written literate traces demonstrating both how GCC (Gough and Stallman, 2004) uses hash tables and how the Linux (Torvalds, 1991) kernel uses red-black trees in its scheduler. Beyond showing students how the algorithms they learn in class can be used in real software, the traces also proved to be a convenient place to discuss many different implementation choices (balancing strategies, hash function choice, intrusive data structures).
In an algorithms class we focus more on the data structure than the application (scheduling); a trace written to be shared with an operating systems class would instead gloss over the red-black insertion code and focus on visualizing the runqueue itself. In this way, literate traces have the freedom to focus on whatever is most important in the given context.
3. The TReX Tool
We have built a tool, TReX, that makes writing literate traces easier. TReX extends an underlying documentation language (currently, HTML and LaTeX are supported) with new commands to interact with a GDB (Stallman et al., 1988) session and output representations of a running program’s state. TReX documents thus involve a combination of three distinct languages:
-
(1)
The documentation language (HTML or LaTeX) where the prose and structure of the document are written;
-
(2)
The program language (anything supported by GDB) that the program being traced is written in; and
-
(3)
The visualization language (Python) where the author writes code to translate program states into visualizations used by the documentation language.
3.1. Basic Usage
Figures 1 and 2 show how to create basic TReX documents using both the LaTeX package and the HTML preprocessor modes supported by TReX. By default, TReX makes available commands like setExecutable (tell GDB which program to trace) and runUntil (use GDB to run the program until a given line is reached). TReX packages containing other commands can be imported using trexInitialize — in this example, we import the GDBEval module from the built_in TReX package, which gives us access to the gdbEvalInt command that reads the value of an integer expression from the program. We provide built-in commands for common visualizations: printCode pretty-prints snippets of the program’s source code, printCallStack prints a table showing the current call stack of the process, printExpressionTable prints a table containing the values of the specified expressions (most similar to a traditional debugger view), etc. One major design goal was staged complexity. Enough commands are built-in to make it easy for an author familiar with the documentation language to begin writing a first draft of their literate trace, while for more advanced visualizations and fine-grained tuning, the author can define their own program-specific TReX modules as described in Section 3.4.
3.2. LaTeX Package
The TReX LaTeX package augments LaTeX with the ability to set an executable to be debugged, set breakpoints, and read the state of the executing program. Additional plugins can be written in Python using the GDB API to generate LaTeX code from the executing program’s state.
Using the LaTeX package requires two builds of the document. The first build outputs a special file trexout.aux that contains a log of all of the TReX-related commands in the user’s document. On the second build, our LaTeX package detects that there is an existing trexout.aux file and runs TReX to process the file. The LaTeX results produced by TReX during this processing are then input into the relevant parts of the LaTeX file during this second build. This build process is automated by standard tools like latexmk and is no more complicated than the normal BibTeX double-build process.
3.3. HTML Preprocessor
We also provide a TReX frontend for HTML. It acts as a preprocessor, searching through the HTML for TeX-style commands and interpreting them as TReX commands.
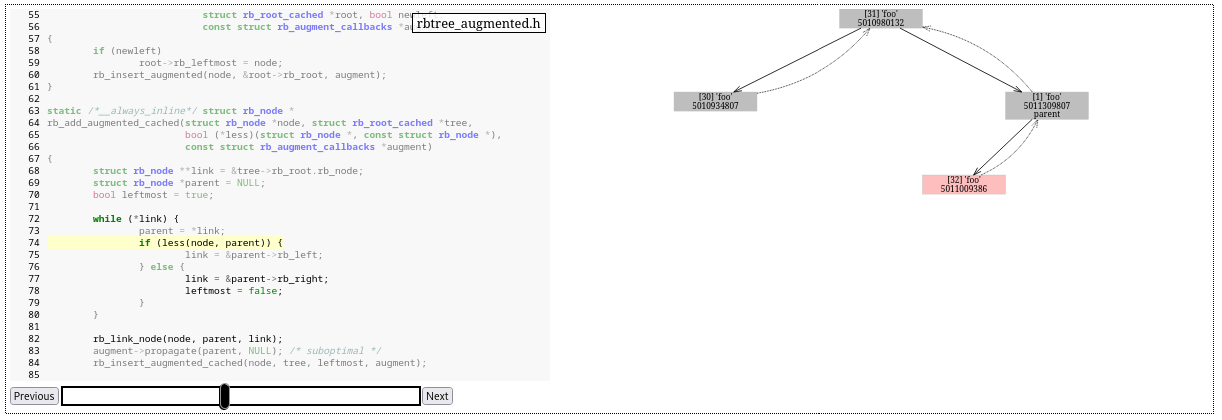
The main benefit of the HTML version is the easy creation of interactive single-stepping traces that the user can scrub through to see in detail the operation of the program (Figure 3). Under the hood, interactive single-stepping traces are implemented by running the program at build time and recording the state every time it reaches one of a user-specified set of lines. This is done entirely at preprocessing time: the reader is not running the program, instead they are seeing essentially a static slideshow of program steps.
\singleStepper[until=rbtree_augmented.h:84]{rbtree_augmented.h:63-87,rbtree.c}{
    \printProcTree{node,root,gparent,parent,old,new}
}
3.4. Writing a TReX Module
When the built-in TReX commands are insufficient, the author can write custom commands in Python using the GDB Python API (Stallman et al., 1988). TReX has its own package system shared between the LaTeX and HTML front-ends. Every TReX command belongs to a module which lives inside a package. A package is just a Python file, usually placed in the same directory as the LaTeX or HTML sources. A module is a class inside that package inheriting from the TReXModule base class. Designating a module method as a command makes it accessible from any TReX document that imports the module.
Figure 4 shows a snippet from the included built_in package, showing how the GDBEval module we used earlier can be implemented. That example is fairly simple, but in general, TReX commands can take a long time to compute (e.g., if they read every entry of a large program array). To improve build times, if the command does not modify the program state, the author can add "cache": True to the returned dictionary to tell TReX to cache the result of that command. The document author can explicitly opt out of using the cache for the next commands by calling \uncache{n}, or for the rest of the compilation using \uncache{inf}.
3.5. Unified Graph Interface
Many powerful visualizations require the ability to draw graphs. Unfortunately, there is no good graph-drawing standard shared between both LaTeX and HTML. In the LaTeX world the best graph drawing library is TikZ, while in the HTML world SVG can be used to make graphs. But the two are not quite comparable: SVG is much lower level than TikZ. We tried to compile LaTeX documents (including TikZ code) to SVG, but this slowed down build times. Graphviz, meanwhile, provides only limited control over graph layout.
We want to give TReX authors a single graph interface to target, but still have it compile down to the best possible format for the actual output target, and allow authors to fine-tune the graphs in those formats as needed. To do so, we wrote a Python graphing library that can output to both SVG and TikZ backends. The core concepts in the graphing library are nodes (boxes with text in them) and edges (between two nodes). Nodes can be positioned either absolutely (using x–y coordinates), or relatively (above, below, etc. another node). This lowering is relatively simple when targeting TikZ, but compiling to SVG was much more involved: we had to manually draw edge tip arrows, do relative positioning layouts, and infer the sizes of nodes based on the text. The result is a relatively simple but powerful graph library usable by both TReX frontends.
4. Lessons Learned
This section summarizes lessons we have learned while literate tracing, roughly structured as a step-by-step guide for writing TReX documents.
4.1. First, Finalize the Code Being Traced
When preparing the code to be traced, the following checklist is always important to consider.
Does the code take interactive input? Change it to read from a file or a hardcoded input so you do not have to interact with it every time you build the trace.
Does the build system pass -O0 -ggdb3 (or equivalent) to the compiler? Debug information for optimized code is notoriously poor, and the ggdb3 option enables special GDB-specific features like the use of macros while tracing.
Are there code paths that are hard to reach in a small trace, such as hash table rebuilds or collision handling code that only happen after a large number of items are inserted? If so, it can be helpful to have two versions of the code: one ‘real’ and one modified to make it easier to trigger such code (e.g., by decreasing the default size of the table, or using a random number generator or hash function that always returns the same number).
Does the code have enough comments? For LaTeX traces, comments are not very important because you will likely explain such things in the prose. On the other hand, HTML traces with single-steppers often leaves the user on their own while stepping through a chunk of code. Hence, comments give the user additional local context while single stepping.
Does the code put multiple statements on one line? Splitting important statements onto their own lines allows breakpoints to be set on each individually.
Does the code declare variables without defining them? Making sure variables have default values avoids accidentally visualizing uninitialized values.
4.2. Second, Decide What to Trace
The next useful step is to make an outline of the trace. For each conceptual step of the code, decide how much attention you want to pay to it and in how much detail you want to trace it. Keep in mind that your reader probably already knows how to accomplish standard programming tasks, so it makes more sense to spend time and page space focusing on the nonstandard data structures and algorithms used in the code, or nontrivial control flow interactions. This is heavily guided by the imagined reader; see Section 2 for some different paradigms. If the goal is to share a cool data structure trick inside of a scheduler (such as in the Linux red-black tree trace), there is no need to spend significant time on unimportant details of, say, how interrupts are handled.
We have found it helpful at this point to build an outline that consists only of section headers, runUntil commands, and printCallStack commands. This ensures that you know what the basic chunks of code you will need to explain are. If building an HTML document, it can also be helpful to insert single-steppers without any state visualizations: this often lets you spend the rest of the writing process looking only at the draft trace rather than the code itself.
4.3. Third, Sketch the Visualizations
You probably want about 2–3 unique classes of visualizations in your TReX document. Too many and it becomes hard for the user to keep track of what they are seeing and how it relates to the program internals. Too few and you risk shoehorning many conceptually different objects into a single visualization or, worse, boring your reader.
It helps at this stage to sketch out what the visualizations should look like on a piece of paper. The more precise your sketches, the less painful it will be to translate them into a TReX module. For example, if your visualization includes a graph, you should think about how you want to position the graph nodes, what styles you want for the edges, etc.
Keep in mind that you will probably use the same core visualization in multiple different parts of the document, so consider what parts of the visualization are common to all uses and what parts need to be configurable by options because they change at different points in the document.
4.4. Fourth, Write Python Code for Visualizations
At this point, we generally comment out everything in the document outline except for one location where a custom visualization is needed. Then implement the visualization in Python and iterate on it until it looks like the sketch. Progressively uncomment the rest of the document and add the visualizations sketched as you go. Large TReX documents can sometimes take a while to build; this strategy lets you focus on rapidly iterating and refining specific visualization code without waiting for multi-second builds to complete.
4.5. Fifth, Add the Prose
All that is left is to add the surrounding prose explaining to the reader what is going on. It is often helpful to add an overview section that walks through the program’s major steps at a high level. As visualizations become higher and higher level, it also helps to have sections that explain how those high-level visualizations link up to the low-level structures in the code (like the hash trie example).
5. Limitations and Future Work
We now discuss limitations and future work related to TReX.
5.1. Program Evolution and Program Design
One of the most frustrating tasks when updating the code behind a TReX document is that TReX documents refer to line numbers frequently, and those line numbers change when the code is updated. We have written a tool that tries to automatically update line numbers after changes, but perhaps the best ultimate solution would be to integrate understanding of the TReX document into an integrated development environment (IDE) that updates the line numbers while the user types, or use Git’s native features for tracking line movement throughout the project history.
This concrete connection to line numbers does, however, have a benefit: unlike out-of-band design docs, TReX documents are built, so if they fall out-of-sync with the main code the build will likely fail. We could imagine building TReX documents as part of CI/CD, forcing developers to update associated traces when they change the relevant code.
5.2. Debugger Limitations
TReX’s program state introspection abilities are limited to those provided the underlying debugger (GDB) and the debug information (DWARF) provided by the compiler. It is often impossible to determine whether a particular value is initialized or not, so illegal values might sometimes appear in a visualization in misleading ways. Another issue is when GDB gets line number information wrong, so the effects of a line might only appear when executing an earlier or later line. Some source lines might not have corresponding locations in the binary at all, and the exact sequence of single-step lines might change when a newer compiler is used. Thankfully, once the TReX document is compiled, it is a static HTML or PDF document, so these issues are only encountered by the trace authors (not readers). Compiler writers are actively working on improving debug information, and many programs can be built without optimizations to improve debuggability. We would also be interested in designing a compiler or source-level interpreter that makes stronger guarantees about the debuggability of its output.
5.3. Dealing with Nondeterminism
Programs with nondeterminism are difficult to trace because every time the trace is rebuilt the resulting document might change. Sometimes these issues are easy to fix by modifying the application to be deterministic, e.g., Git can be told to use a fixed timestamp. In other cases, such as timer interrupts in the Linux kernel, the nondeterminism is more fundamental to the program operation. Record-and-replay debugger features can ameliorate some of these issues. Unfortunately, the recording is often a large binary file that is difficult to share, and are generally invalidated once the code changes.
Tracing operating systems code introduced its own challenges. First, we needed to use GDB’s ability to connect to a QEMU emulation session (Bellard, 2005), since the operating system code does not run in user mode. Second, we had to deal with the fact that operating systems code makes heavy use of nondeterministic timer interrupts, so every time we built the trace, the visualizations would look different and perhaps not show what we expect them to show. To solve this problem, we were able to use QEMU’s record-and-replay feature to achieve deterministic replays of the code during tracing.
5.4. Integration with an Interactive Debugger
Literate tracing with TReX often requires the author to write program-specific state visualizers. It would be interesting to be able to reuse those visualizations in an interactive debugging session (i.e., standard GDB). We envision a future where projects come with TReX modules that are used both for building literate traces and also for adding ‘superpowers’ to GDB when loaded. Many projects, e.g., the Linux kernel, already have GDB plugins, but those tend to be less visual. It would also be interesting to allow people to record an interactive GDB session and automatically generate a skeleton literate trace based on that interactive session.
5.5. Interfaces for Literate Tracing
With TReX, the trace author must program the literate trace in a documentation language like LaTeX or HTML, and design visualizations in Python. It would be interesting to explore an interactive, what-you-see-is-what-you-get (WYSIWYG) integrated tracing environment that lets users design TReX traces and visualizations in a more graphical manner.
5.6. Software Archaeology
There has been a recent push to collect and preserve source code from the early days of computing history (swh, 2025; chm, 2025). While this is a laudable goal, it is not yet so clear what should be done with this source code. We think writing a literate trace of the code could be a useful way to study and share appreciation of such historical software.
6. Related Work
This section relates literate tracing and the TReX tool to other work in program documentation.
6.1. Literate Programming
In literate programming (Knuth, 1984; McIlroy, 1986), the program is written within a prose document that explains its structure. Literate programming allows nonlinear programming, introducing each line of code at the pedagogically perfect time for the reader’s understanding, which Knuth argues leads to better code. Unlike literate tracing, literate programming is a method of programming; it cannot help make existing monolithic codebases (GCC, Linux, etc.) more understandable. Furthermore, literate programming tools generally do not deal with runtime state at all, so they do not provide tooling for making visualizations of state and they often lack a close connection to any concrete execution of the program.
6.2. Software Design Philosophies
A number of treatises have been written on how to design software to be most understandable (Ousterhout, 2018; Martin, 2009; Lieberherr et al., 1988; Gamma et al., 1995). Like literate programming, these techniques do not help one improve the understandability of software that has already been written, which is the focus of literate tracing.
6.3. Notebooks
Often considered the popular rebirth of literate programming (Singer, 2020; Dusen, 2021), we argue that notebooks are actually closer to an instantiation of literate tracing. Notebooks often only run on a specific concrete dataset, and the notebook itself executes the code and visualizes results as you read it. There is a heavy focus on visualizations of the input, intermediate, and output data. And much of the code (e.g., the scipy library) is hidden ‘under the hood’ and not explained by the reader. TReX tries to bring the notebook experience to systems code.
6.4. In-Line Comments
Comments are perhaps the most popular way of explaining how source code works (Arafat and Riehle, 2009; He, 2019; Rani et al., 2023). They live close to the code in question and are updated frequently (Fluri et al., 2007), but comments are not perfect. It is generally much easier for a comment to explain local aspects of the code, but harder to explain how multiple different modules interact. And they are usually restricted to plaintext, limiting the ability to draw useful diagrams. We see literate tracing as complementary to in-line comments: a literate trace guides the reader through a system through the help of prose and visualizations, while comments help the reader who is already reading some particular part of the code get a sense for what it is aiming to do.
6.5. Out-of-Band Design Documentation
Out-of-band documentation and books about system architecture are popular and effective (Brown and Wilson, 2011; Bovet and Cesati, 2005; MaiZure, 2019; Nørmark et al., 2000). They avoid many of the limitations of in-code comments, and have been used to explain the architecture of many large systems. Without significant author effort, however, out-of-band documentation is frequently too high-level, not giving the reader enough information about how and where the high-level architecture is implemented in the actual code. TReX extends existing documentation tools (LaTeX and HTML) with the ability to refer to and visualize the states of a running instance of the program. This makes it easier for documentation writers to visualize program state, which in turn helps the reader follow what the code is doing at a more concrete level. It also ensure fidelity of the documentation to the actual software. We think that the best documentation strategies mix high-level design and lower-level tracing, and we believe that TReX gives authors the flexibility to do so.
6.6. Educational Tracers
Interactive single-steppers are used in educational contexts (Guo, 2013; vis, 2025). In (Guo, 2013) the goal is primarily to explain basic language features such as pointers, loops, and structs. Hence, a uniform low-level representation of the program state is often used, and every single line is steppable. In (vis, 2025) the goal is to explain high-level algorithms, so custom visualizations are used but the code is generally very short and in an English-like pseudocode. TReX shows these ideas can scale up to explain components of modern systems. Instead of focusing on generic visualizations that show all details, we allow program-specific visualizations and prose that highlight what is most important about this system in this context.
6.7. Program Comprehension and Visual Debuggers
Program comprehension and visual debugging research seeks in part to develop tools that make understanding programs easier (Rodeghero and McMillan, 2019; Storey, 2005; Maletic and Marcus, 2001; Liu et al., 2025; Zeller and Lütkehaus, 1996; Hanson and Korn, 1997). They are usually only meant to be used by one person, not to generate a document to be shared with others. TReX is a framework on which system experts can reify their understanding of a codebase into a single document (the literate trace) that can be shared with others interested in how the system works.
Acknowledgements
This project benefited greatly from insights, conversations, proofreading, and feedback from the anonymous reviewers, Zachary Yedidia, David K. Zhang, Akshay Srivatsan, Michael Paper, Dawson Engler, and attendees of the Stanford software lunch. I am generously funded by grants from the NSF DGE-1656518, Stanford IOG Research Hub, and Brown Institute.
References
- (1)
- swh (2025) 2025. Software Heritage. https://www.softwareheritage.org/
- chm (2025) 2025. Source Code - CHM. https://computerhistory.org/playlists/source-code/
- vis (2025) 2025. visualizing data structures and algorithms through animation. https://visualgo.net/en
- Arafat and Riehle (2009) Oliver Arafat and Dirk Riehle. 2009. The commenting practice of open source. In Companion to the 24th Annual ACM SIGPLAN Conference on Object-Oriented Programming, Systems, Languages, and Applications, OOPSLA 2009, October 25-29, 2009, Orlando, Florida, USA, Shail Arora and Gary T. Leavens (Eds.). ACM, 857–864. https://doi.org/10.1145/1639950.1640047
- Bellard (2005) Fabrice Bellard. 2005. QEMU, a Fast and Portable Dynamic Translator. In Proceedings of the FREENIX Track: 2005 USENIX Annual Technical Conference, April 10-15, 2005, Anaheim, CA, USA. USENIX, 41–46. http://www.usenix.org/events/usenix05/tech/freenix/bellard.html
- Bentley et al. (1986) Jon Bentley, Don Knuth, and Doug McIlroy. 1986. Programming pearls: A literate program. Commun. ACM 29, 6 (1986), 471–483.
- Bovet and Cesati (2005) Daniel P. Bovet and Marco Cesati. 2005. Understanding the Linux Kernel - from I/O ports to process management: covers version 2.6 (3. ed.). O’Reilly. http://www.oreilly.de/catalog/understandlk/index.html
- Brown and Wilson (2011) Amy Brown and Greg Wilson. 2011. The Architecture of Open Source Applications: Elegance, Evolution, and a Few Fearless Hacks. Vol. 1.
- Dusen (2021) Eric Van Dusen. 2021. Jupyter for Teaching Data Science. In SIGCSE ’21: The 52nd ACM Technical Symposium on Computer Science Education, Virtual Event, USA, March 13-20, 2021, Mark Sherriff, Laurence D. Merkle, Pamela A. Cutter, Alvaro E. Monge, and Judithe Sheard (Eds.). ACM, 1359. https://doi.org/10.1145/3408877.3439524
- Eén and Sörensson (2003) Niklas Eén and Niklas Sörensson. 2003. An Extensible SAT-solver. In Theory and Applications of Satisfiability Testing, 6th International Conference, SAT 2003. Santa Margherita Ligure, Italy, May 5-8, 2003 Selected Revised Papers (Lecture Notes in Computer Science, Vol. 2919), Enrico Giunchiglia and Armando Tacchella (Eds.). Springer, 502–518. https://doi.org/10.1007/978-3-540-24605-3_37
- Fluri et al. (2007) Beat Fluri, Michael Würsch, and Harald C. Gall. 2007. Do Code and Comments Co-Evolve? On the Relation between Source Code and Comment Changes. In 14th Working Conference on Reverse Engineering (WCRE 2007), 28-31 October 2007, Vancouver, BC, Canada. IEEE Computer Society, 70–79. https://doi.org/10.1109/WCRE.2007.21
- Gamma et al. (1995) Erich Gamma, Richard Helm, Ralph Johnson, and John Vlissides. 1995. Design patterns: elements of reusable object-oriented software. Pearson Deutschland GmbH.
- Gough and Stallman (2004) Brian J Gough and Richard Stallman. 2004. An Introduction to GCC. Network Theory Limited.
- Guo (2013) Philip J. Guo. 2013. Online python tutor: embeddable web-based program visualization for cs education. In The 44th ACM Technical Symposium on Computer Science Education, SIGCSE 2013, Denver, CO, USA, March 6-9, 2013. ACM, 579–584. https://doi.org/10.1145/2445196.2445368
- Hanson and Korn (1997) David R Hanson and Jeffrey L Korn. 1997. A simple and extensible graphical debugger. In Proceedings of the USENIX Annual Technical Conference. 183–174.
- He (2019) Hao He. 2019. Understanding source code comments at large-scale. In Proceedings of the ACM Joint Meeting on European Software Engineering Conference and Symposium on the Foundations of Software Engineering, ESEC/SIGSOFT FSE 2019, Tallinn, Estonia, August 26-30, 2019, Marlon Dumas, Dietmar Pfahl, Sven Apel, and Alessandra Russo (Eds.). ACM, 1217–1219. https://doi.org/10.1145/3338906.3342494
- Kay et al. (2006) Alan Kay, Dan Ingalls, Yoshiki Ohshima, Ian Piumarta, and Andreas Raab. 2006. Steps toward the reinvention of programming. Distinguished Lecture Series.–2008 (2006).
- Knuth (1984) Donald E. Knuth. 1984. Literate Programming. Comput. J. 27, 2 (1984), 97–111. https://doi.org/10.1093/COMJNL/27.2.97
- Lieberherr et al. (1988) Karl J. Lieberherr, Ian M. Holland, and Arthur J. Riel. 1988. Object-Oriented Programming: An Objective Sense of Style. In Conference on Object-Oriented Programming Systems, Languages, and Applications, OOPSLA 1988, San Diego, California, USA, September 25-30, 1988, Proceedings, Norman K. Meyrowitz (Ed.). ACM, 323–334. https://doi.org/10.1145/62083.62113
- Liu et al. (2025) Hanzhi Liu, Yanyan Jiang, and Chang Xu. 2025. Understanding the Linux Kernel, Visually. (2025).
- MaiZure (2019) MaiZure. 2019. Decode: GNU coreutils. https://www.maizure.org/projects/decoded-gnu-coreutils/
- Maletic and Marcus (2001) Jonathan I Maletic and Andrian Marcus. 2001. Supporting program comprehension using semantic and structural information. In Proceedings of the 23rd International Conference on Software Engineering. ICSE 2001. IEEE, 103–112.
- Martin (2009) Robert C Martin. 2009. Clean code: a handbook of agile software craftsmanship. Pearson Education.
- McIlroy (1986) Doug McIlroy. 1986. A Literate Program: A Review. Commun. ACM 29, 6 (1986), 471–483. https://doi.org/10.1145/5948.315654
- Nørmark et al. (2000) Kurt Nørmark, Max Andersen, Claus Christensen, Vathanan Kumar, Søren Staun-Pedersen, and Kristian Sørensen. 2000. Elucidative programming in Java. In Proceedings of IEEE Professional Communication Society International Professional Communication Conference and Proceedings of the 18th Annual ACM International Conference on Computer Documentation: Technology & Teamwork, Cambridge, Massachusetts, USA, September 24-27, 2000, Susan B. Jones, Beth Weise Moeller, Michael Priestley, and Bernadette Longo (Eds.). IEEE, 483–495. https://dl.acm.org/citation.cfm?id=504871
- Ousterhout (2018) John K Ousterhout. 2018. A philosophy of software design. Vol. 98. Yaknyam Press Palo Alto, CA, USA.
- Rani et al. (2023) Pooja Rani, Arianna Blasi, Nataliia Stulova, Sebastiano Panichella, Alessandra Gorla, and Oscar Nierstrasz. 2023. A decade of code comment quality assessment: A systematic literature review. J. Syst. Softw. 195 (2023), 111515. https://doi.org/10.1016/J.JSS.2022.111515
- Rodeghero and McMillan (2019) Paige Rodeghero and Collin McMillan. 2019. Detecting Important Terms in Source Code for Program Comprehension. In 52nd Hawaii International Conference on System Sciences, HICSS 2019, Grand Wailea, Maui, Hawaii, USA, January 8-11, 2019, Tung Bui (Ed.). ScholarSpace, 1–10. https://hdl.handle.net/10125/60186
- Singer (2020) Jeremy Singer. 2020. Notes on notebooks: is Jupyter the bringer of jollity?. In Proceedings of the 2020 ACM SIGPLAN International Symposium on New Ideas, New Paradigms, and Reflections on Programming and Software, Onward! 2020, Virtual, November, 2020. ACM, 180–186. https://doi.org/10.1145/3426428.3426924
- Stallman et al. (1988) Richard Stallman, Roland Pesch, Stan Shebs, et al. 1988. Debugging with GDB. Free Software Foundation 675 (1988).
- Storey (2005) M-A Storey. 2005. Theories, methods and tools in program comprehension: past, present and future. In 13th International Workshop on Program Comprehension (IWPC’05). IEEE, 181–191.
- Torvalds ([n. d.]) Linus Torvalds. [n. d.]. Git. https://git-scm.com/
- Torvalds (1991) Linus Torvalds. 1991. The Linux Kernel Archives. https://kernel.org/
- Zeller and Lütkehaus (1996) Andreas Zeller and Dorothea Lütkehaus. 1996. DDD - A Free Graphical Front-End for UNIX Debuggers. ACM SIGPLAN Notices 31, 1 (1996), 22–27. https://doi.org/10.1145/249094.249108