Measurement of the cross section near the resonance
with the SND detector
Abstract
In the experiment with the SND detector at the VEPP-2000 collider, the cross section is measured in the energy range MeV. The measurement is carried out in the decay mode. Data with an integrated luminosity of 73 pb-1 collected in 2018 and 2024 are used in the analysis. The measured cross section is the most accurate to date and is higher compared to other measurements. From the fit to the cross section data with the vector meson dominance model, the value of the product of the branching fractions has been obtained.
pacs:
13.66.Bc, 14.40.Aq, 13.40.GpI Introduction
Radiative decays of the light vector mesons , , and particularly the decay of the meson to are known as a good laboratory for testing various theoretical concepts describing the low-energy QCD dynamics. Their measured decay widths are widely used to test predictions based on the quark model quarkmodel1 ; quarkmodel2 and study the flavor symmetry breaking BHLS . They are also used to study the mixing and the possible admixture of an additional singlet state etamix1 ; etamix2 ; etamix3 , which can be attributed to the pseudoscalar glueball predicted by QCD glue and to the state ccbar .
This work is devoted to measurement of the cross section in the center-of-mass (c.m.) energy range MeV using data collected by the Spherical Neutral Detector (SND) at the collider VEPP-2000. In this energy range, the dominant contribution to the cross section comes from the decay of , which interferes with the tails of and high-lying resonances. The branching fraction can be obtained from fitting the cross section within the vector meson dominance (VMD). Near the resonance, the most accurate measurements of the cross section were made by the SND SNDetg2000 ; SNDetg2007 and CMD-2 CMDetg1999 ; CMDetg2001 ; CMDetg2005 experiments at the VEPP-2M collider.
II SND detector
The SND detectorSNDdet1 ; SNDdet2 ; SNDdet3 ; SNDdet4 is a general-purpose non-magnetic detector operating at the VEPP-2000 collider vepp2000 with the c.m. energy GeV. The main part of the SND detector is an electromagnetic calorimeter. The SND calorimeter is made of 1640 NaI(Tl) crystals. It consists of three spherical layers with the total thickness of 13.4 radiation lengths. The calorimeter covers nearly of the full solid angle: , where is the polar angle. The energy resolution of the SND calorimeter is given by the formula , while the angular resolution is . The parameters of charged particles are measured using a nine-layer drift chamber and a proportional chamber with cathode-strip readout located in a common gas volume. Its angular resolution is in polar direction, and in the azimuthal direction. The solid angle of the tracking system is 94% of . A system of aerogel threshold Cherenkov counters is located around the tracking system. The calorimeter is surrounded by a 10 cm thick iron absorber, behind which there is a muon system consisting of proportional tubes and scintillation counters.
For this work we use data collected by the SND detector at the collider VEPP-2000 in the c.m. energy range MeV. The integrated luminosity accumulated at 21 energy points in 2024 and at 8 energy points in 2018 is about 73 pb-1.
Monte-Carlo (MC) simulation of signal and background processes takes into account radiative corrections radcor . The angular distribution of a hard photon emitted from the initial state is generated according to Ref. BM . Interactions of the particles produced in annihilation with the detector materials are simulated using the GEANT4 software geant . The simulation takes into account variation of experimental conditions during data taking, in particular dead detector channels and beam-induced background. To take into account the effect of superimposing the beam background on the annihilation events, the simulation uses special background events recorded during data taking with a random trigger. These events are superimposed on the simulated events, leading to the appearance of additional tracks and photons in them.
The average beam energy and the energy spread were measured during data taking by a dedicated system using the Compton backscattering of laser photons on the electron beam compton . Energy measurements performed at a given energy point are averaged with weights proportional to the integrated luminosity. The obtained values for average energy, energy spread and their errors are listed in Table 1.
The energy errors listed in Table 1 describe the relative uncertainties of the measured energy. Additional uncertainty comes from a possible shift of the energy scale. It was estimated to be 60 keV at the c.m. energy = 1000 MeV by comparison with the energy measurement by the resonance depolarization method compton . Since the measurement of the meson mass is not a subject of this work, we only need to know the value of this shift relative to the meson mass (). The relative shift of the energy scale for the 2018 energy scan was obtained in Ref. SNDkskl by fitting the energy dependence of the cross section. The measured energies used in Ref. SNDkskl differ slightly from the ones used in this work due to slightly different calibration procedures applied to the data. With the set of measured energies used in this work, the fit of the cross section described in Ref. SNDkskl gives a common shift of all energy points in the 2018 scan MeV. Taking into account the interaction of K mesons in final state changes it to MeV. When fitting the energy dependence of the cross section, we introduce a common energy shift with a Gaussian constraint corresponding to . The energy shift is used to estimate the associated systematic uncertainty.
We use the process to measure the luminosity. For event selection, determination of systematic uncertainties and luminosity corrections, we follow the procedure developed in Ref. SNDkskl . For the coherence with the selection conditions of the events, we additionally impose selection conditions on the normalized energy deposition in the calorimeter and on the normalized transverse momentum of the event calculated using the energy depositions in the calorimeter crystals .
The process under study contains only photons in the final state. The choice of the process for the luminosity measurement allows us to cancel systematic uncertainties in the measured cross section that are common to both of these processes. The most important of them are the systematic uncertainties associated with the simulation of the hardware first-level trigger and the superimposition of beam-generated spurious tracks onto signal events. For this reason, we do not apply the correction on the superimposition of beam-generated tracks introduced in Ref. SNDkskl .
The resulted integrated luminosity for each energy point is presented in Table 1 with statistical and systematic errors. The systematic uncertainty does not exceed 0.6%.
| E, MeV | , keV | IL, nb-1 |
|---|---|---|
| 2024 energy scan | ||
| 980.189 0.010 | 470 97 | 2061.3 4.1 8.9 |
| 984.124 0.012 | 543 120 | 2205.9 4.2 7.7 |
| 990.032 0.009 | 439 77 | 1914.7 4.0 9.4 |
| 1000.039 0.018 | 340 108 | 4038.3 5.8 15.9 |
| 1002.038 0.015 | 371 128 | 1988.8 4.1 8.3 |
| 1006.034 0.026 | 435 160 | 2297.2 4.4 5.4 |
| 1010.091 0.014 | 462 74 | 2161.9 4.3 8.3 |
| 1013.099 0.008 | 449 53 | 2084.7 4.2 9.5 |
| 1016.110 0.010 | 444 69 | 3113.8 5.2 10.1 |
| 1017.073 0.009 | 439 54 | 3354.9 5.4 13.2 |
| 1018.111 0.005 | 465 39 | 3539.2 5.5 11.7 |
| 1019.073 0.004 | 444 38 | 4724.9 6.4 12.2 |
| 1020.055 0.004 | 429 40 | 4734.9 6.4 22.8 |
| 1021.005 0.005 | 449 36 | 3607.3 5.6 10.4 |
| 1023.079 0.005 | 447 43 | 3437.3 5.5 21.0 |
| 1025.003 0.008 | 355 80 | 2025.1 4.2 7.4 |
| 1025.058 0.005 | 429 48 | 2217.0 4.4 11.7 |
| 1030.072 0.006 | 409 44 | 2577.1 4.8 7.9 |
| 1040.047 0.009 | 412 48 | 2094.0 4.4 14.1 |
| 1049.992 0.009 | 438 107 | 4895.1 6.8 22.0 |
| 1060.206 0.012 | 444 56 | 599.9 2.4 3.6 |
| 2018 energy scan | ||
| 1005.999 0.021 | 359 39 | 1681.6 3.8 4.8 |
| 1016.843 0.023 | 351 64 | 1650.1 3.7 3.0 |
| 1017.959 0.023 | 375 84 | 1256.4 3.3 3.5 |
| 1019.101 0.019 | 380 36 | 2454.3 4.6 7.2 |
| 1019.982 0.019 | 380 61 | 2640.2 4.8 9.7 |
| 1020.932 0.046 | 406 26 | 1424.4 3.5 3.0 |
| 1022.114 0.030 | 372 36 | 1229.1 3.2 4.8 |
| 1022.929 0.041 | 382 43 | 821.3 2.7 1.2 |
III Selection of events
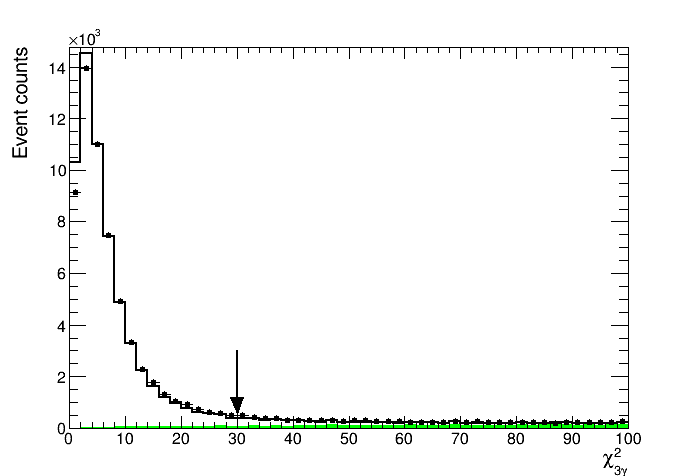
The selection of events is performed in two stages. At the first stage, we select events with at least 3 photons with energies above 20 MeV, without charged tracks, and . For events passing these selection conditions, we perform a kinematic fit to the hypotheses with the requirements of energy and momentum conservation. For kinematic fit, we choose only those photons in the event which have energy MeV and polar angle . If the number of photons in an event that meets these conditions is less than 3 or more than 8, then such event is discarded. As a result of the kinematic fit, the energies and angles of photons are refined, and the of the kinematic hypothesis is calculated (). In the kinematics fitting, all possible combinations of photons are tested, and the combination with the smallest value is retained. For further analysis, we use the refined values of photon angles and energies, and impose the following selection condition on obtained of the kinematic fit .
To reconstruct the invariant mass of two photons from the meson decay (), we employ the procedure described in Ref. CMDetg2005 . The photon energies refined after kinematic fit are sorted in descending order . If , then , otherwise . Here is the meson mass and . The following constraint is imposed on the obtained invariant mass MeV.
The dominant background for this analysis arises from the QED process of annihilation to 3 photons. For an accurate description of the background, it is also important to take into account the annihilation into 2 photons with an additional photon from the splitting of the electromagnetic shower or beam background, and the annihilation into four and more photons. To model these processes, we generate a sample of the events using the Monte Carlo event generator BabaYaga@NLO BabaYaga . For , it exploits the exact amplitude up to the contributions. In addition to this, it models the emission of an arbitrary number of additional photons using the QED Parton Shower algorithm.
The main hadronic background, which also gives a three-photon final state, is the process. In addition to it, we also study the contribution to the background from the hadronic processes with multiphoton final state , , . The cosmic ray background is studied by analysing the event time measured in the electromagnetic calorimeter and found to be negligible.
Figure 1 shows the distribution for data and MC simulation at MeV after applying the selection conditions. All distributions for the MC simulation are normalized to the expected number of events. The shares of their contributions to the signal region is following: - 60.0%, QED processes - 26.1%, - 12.4%, multiphoton hadronic processes - 1.4%. Since the and , as well as the studied process , have three photons in the final state, their distributions have a peak at low values of . For this reason, these processes give the dominant contribution to the background in the signal region.
IV Fitting the distribution
The distributions for the energy points corresponding to the maximum of the resonance and its left and right tails are shown in Fig. 2. To determine the number of signal events () at each energy point, we perform a binned likelihood fit to the distribution with a sum of signal () and background () distributions. The background distribution is composed of two components and . The distributions and are shown in Fig. 2 as stacked histograms. They content background events with and , respectively.
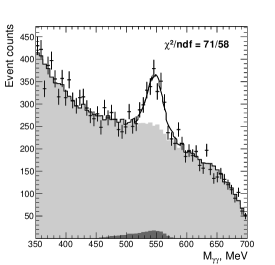
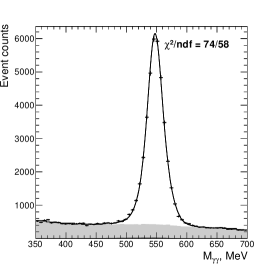
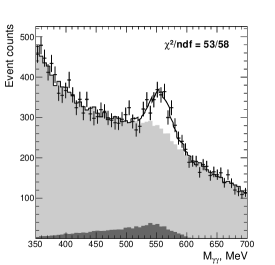
The signal distribution is obtained by fitting the mass spectra for the simulated signal events by a sum of three Gaussian functions. When fitting the data, the function obtained from the simulation is modified to account for possible difference between the data and the simulation in the detector response. A common mass shift and a smearing are added to each Gaussian mean and variance, respectively, in the following way: and . The values of and are determined by fitting the data distributions in the energy region MeV. They are found to be MeV and MeV2 for the 2024 (2018) energy scan. The parameters and are fixed at these values. The variation of these parameters within the errors is used to estimate the associated systematic uncertainty.
The background distributions and are described by histograms obtained from simulation of background processes , , , and . To model possible inaccuracies of such a description, we introduce two additional parameters and and parametrize the background distribution as follows
| (1) |
where is the ratio of numbers of expected events in and . The parameters and model the possible inaccuracy of MC predictions for the number of background events and parameter , respectively. The values of parameters and correspond to the expected background distribution.
Usually, the photon with the misreconstructed energy has the lowest energy out of the three photons selected for the kinematic fitting. Since we choose a pair of photons for depending on the energy of this photon , we cannot fully rely on simulation to determine the parameter . Instead, the parameter is determined by fitting the data distributions in the energy region out of the resonance peak MeV and MeV. For all energy points from this region, the obtained values for the parameter are consistent with unity. When we determine , the parameter is fixed at its average value and its error is used to estimate the associated systematic uncertainty. The parameter is set to be free. The obtained values for it have no visible energy dependence. It average value is .
The results of the fit for three energy points are shown in Fig. 2. The fit quality is reasonably good in the whole studied c.m. energy range. The procedure of choosing a pair of photons for notably distorts the background distribution mostly because the distribution looks like a bump at the meson mass (Fig. 2). The possible inaccuracy of modeling this distortion is parametrized by the parameter and gives the dominant contribution to the systematic uncertainty in .
The obtained numbers of signal events for each energy point are listed in Table 3 with statistical and systematic errors. The systematic error is obtained by variation of the parameters , and within their errors.
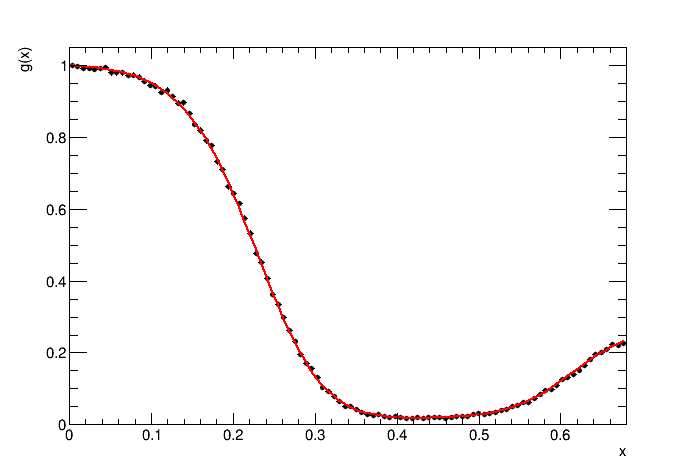
V Detection efficiency
The detection efficiency of events is determined using MC simulation as a function of and , where is the energy of the extra photon emitted from the initial state. It is parametrized as , where and . Since the studied energy region is narrow, the dependence of on can be neglected. In this case, all variations of the experimental conditions (dead calorimeter channels, beam background, etc.) are accounted for in . The dependence of on is obtained using MC simulation and then approximated by a smooth function. The result of the approximation is shown in Fig. 3. The decrease of the efficiency at is due to the requirement of energy and momentum balance in an event (the condition ). The increase near the maximum allowed value of corresponds to the radiative return to the threshold of the reaction when the photon recoiling against the meson becomes soft. The initial state radiation photon together with two photons from the decay provide a good energy-momentum balance, and such an event passes the selection conditions. In spite of this, the number of events from this kinematic region is negligible due to the low probability of emitting a hard photon and the very small cross section near the threshold.
The imperfect MC simulation of the detector response for photons leads to an inaccuracy in the detection efficiency determined using the MC simulation. To evaluate the efficiency corrections, we vary the boundaries of the selection conditions. The correction is defined as a double ratio , where () and () are the number of signal events in the data and in the signal MC simulation, respectively, for the modified (baseline) selection condition. With the correction defined in this way, the corrected efficiency is related to the efficiency obtained from the MC simulation as follows .
To estimate the systematic uncertainty associated with the condition on the polar angle of photons accepted for the kinematic fit ( with ), we change to and . The step of the variation corresponds to the angular size of the calorimeter crystal. The signal efficiency decreases by 28 (50)% for , while the maximum deviation of the correction obtained for the different does not exceed 0.6%. This deviation is taken as an estimate of the systematic uncertainty due to the condition on the photon polar angle.
The fraction of signal events rejected by the condition is 7.7% at the maximum of the resonance. When the selection condition is relaxed to , the fraction of rejected events decreases to 3.0% (0.1%). To evaluate the efficiency correction, we relax the condition from to and impose additional constraints requiring exactly three photons in an event and no signal in the muon system. In a signal event with , typically at least one photon hits the dead counter of the electromagnetic calorimeter. This leads to a misreconstruction of the photon energy and, as a consequence, to an incorrect reconstruction of the kinematics of the entire event. For this reason, the peak at the meson mass in the distribution becomes very broad, making it impossible to separate the signal events from the background. At the same time, the angles of such photons are measured with sufficient accuracy. To improve the resolution of the reconstructed meson mass for events with , we perform a special kinematic fit using only the measured photon angles and ignoring their measured energies. The variation of the correction when changing the condition on from 100 to 800 is taken as a systematic uncertainty. The efficiency correction is determined at each energy point in the energy range MeV. For the 2024 energy scan does not depend on energy point and its value is %. For the 2018 energy scan varies from % to % with systematic uncertainty estimated to be 0.6%.
A photon converted in the material before the tracking system is reconstructed as a charged track. Since events with charged tracks are rejected by our selection conditions, the data-MC simulation difference in the conversion probability leads to a systematic shift in the measured cross section. This difference was studied in Ref. SNDkskl , where the conversion probability was found to be greater than in the simulation by ()%sin, where is the photon polar angle. The efficiency correction for the process is calculated to be % and was applied to the measured luminosity. The correction for the process is calculated to be %.
The corrected detection efficiencies are listed in Table 3.
VI Fitting the measured cross section
| Parameter | Solution 1 | Solution 2 | Solution 3 | Solution 4 |
|---|---|---|---|---|
| , nb | ||||
| , deg. | ||||
| , pb | ||||
| , pb | ||||
| , deg. | ||||
| , keV | ||||
| , keV | ||||
| 35.2/37 | 37.4/37 | 37.6/37 | 36.5/37 |
The visible cross section of the process is determined as
| (2) |
where IL is the integrated luminosity and % pdg . It is related to the Born cross section as follows:
| (3) |
where is a so-called radiator function radcor describing the probability to emit an extra photon with the total energy from the initial state, . The expression (3) can be rewritten in the conventional form:
| (4) |
To take into account the beam energy spread, it is necessary to perform a convolution of the visible cross section (4) with a Gaussian function describing the c.m. energy distribution of the electron-positron pair. Since the energy spread is much smaller than the width of the resonance, we use an approximate expression for the convolution
| (5) | |||||
The uncertainty in the collider energy listed in Table 1 effectively increases the uncertainty in the measured visible cross section. When fitting the cross section energy dependence, the following term is added in quadrature to the statistical error of :
| (6) |
where is the uncertainty of the energy measurement of the corresponding energy point. In the energy range MeV, this additional uncertainty is comparable to the statistical error.
Energy dependence of the Born cross section is described using the vector meson dominance model, which, in addition to the dominant amplitude of the meson, includes the amplitudes of the and mesons as well as amplitudes describing the contribution of the high-lying vector resonances () and ():
| (7) | |||||
| (8) | |||||
| (9) | |||||
| (10) |
where is the resonance mass, is its energy-dependent total width (), is the Born cross section of the process at , are interference phases relative to the meson ().
The quark model predicts and achasov , which agrees well with measurements SNDetg2007 . Assuming that the resonances and belong to the same nonet and taking into account the lattice QCD predictions of their almost ideal mixing dudek , we can expect the same pattern for their relative phases. For these reasons, the phase between the and mesons is fixed at , and .
To determine the contribution of high-lying vector resonances, the cross section measured by SND SNDetg23 in the energy range MeV is added to the fit. The masses and widths of all vector resonances are fixed at their PDG values pdg . The parameters and are fixed at the values taken from the SND measurement SNDetg2007 ,
| (11) | |||||
| (12) |
The free fit parameters are , , , , and the shifts of the energy scale for the 2024 scan and for the 2018 scan . As was discussed above, the parameter is constrained by a Gaussian penalty term corresponding to MeV. To evaluate the systematic uncertainty associated with the energy scale, the constraint in penalty term is changed to MeV.
| , GeV | , % | , nb | |||
|---|---|---|---|---|---|
| 2024 energy scan | |||||
| 980.189 | 53.4 | 0.881 | 1.000 | ||
| 984.124 | 53.1 | 0.872 | 1.000 | ||
| 990.032 | 53.0 | 0.856 | 1.000 | ||
| 1000.039 | 52.7 | 0.823 | 1.001 | ||
| 1002.038 | 53.3 | 0.815 | 1.001 | ||
| 1006.034 | 53.3 | 0.797 | 1.002 | ||
| 1010.091 | 53.6 | 0.774 | 1.006 | ||
| 1013.099 | 53.0 | 0.752 | 1.011 | ||
| 1016.110 | 52.6 | 0.726 | 1.022 | ||
| 1017.073 | 52.9 | 0.719 | 1.018 | ||
| 1018.111 | 53.3 | 0.719 | 0.988 | ||
| 1019.073 | 52.6 | 0.740 | 0.960 | ||
| 1020.055 | 52.9 | 0.790 | 0.990 | ||
| 1021.005 | 52.8 | 0.863 | 1.015 | ||
| 1023.079 | 51.7 | 1.055 | 1.016 | ||
| 1025.003 | 51.9 | 1.257 | 1.006 | ||
| 1025.058 | 52.0 | 1.263 | 1.008 | ||
| 1030.072 | 52.5 | 1.871 | 1.003 | ||
| 1040.047 | 52.7 | 3.477 | 1.001 | ||
| 1049.992 | 52.4 | 5.672 | 1.000 | ||
| 1060.206 | 53.2 | 8.505 | 1.000 | ||
| 2018 energy scan | |||||
| 1005.999 | 52.9 | 0.797 | 1.002 | ||
| 1016.843 | 52.5 | 0.722 | 1.014 | ||
| 1017.959 | 51.2 | 0.718 | 1.003 | ||
| 1019.101 | 52.6 | 0.732 | 0.972 | ||
| 1019.982 | 52.8 | 0.770 | 0.982 | ||
| 1020.932 | 52.4 | 0.836 | 1.008 | ||
| 1022.114 | 51.7 | 0.938 | 1.012 | ||
| 1022.929 | 53.0 | 1.015 | 1.013 | ||
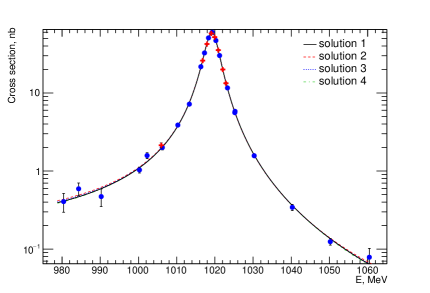
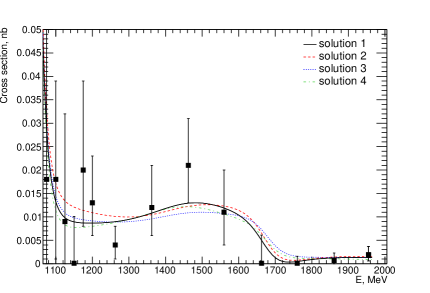
The result of the fit is presented in Table 2 and shown in Fig. 4. We found four different solutions with very close and good fit quality = (35-38)/37, where is the number of degrees of freedom. This is a consequence of the well-known problem that the interfering Breit-Wigner resonances have ambiguities in the determination of their parameters malyshev . As discussed above, the quark model predicts the relative phase . The only first solution presented in Table 2 has relative phase compatible with this value. For this reason, we choose it as a nominal one. We use this solution for all calculations with the theoretical model, unless otherwise explicitly stated. It is also worth noting that in both experimental works, where the contribution of was taken into account SNDetg2007 ; CMDetg2005 , the phase was fixed at .
The results of the fit are used to calculate the radiative correction and the energy spread correction. The difference between the corrections obtained with different fit solutions is considerable only for two energy points with MeV and MeV. For them, this difference is 1.5% and 4%, respectively, and is taken as systematic uncertainty. The value of the Born cross section at a given energy point is determined as follows
| (13) |
The values of , and the Born cross sections with statistical and systematic errors are listed in Table 3. The main contributions to the systematic uncertainty come from the uncertainties in the luminosity measurement (0.6%), the condition on the polar angle of photons (0.6%), the condition on of the kinematic reconstruction (0.3-0.6%), the accuracy of (0.5%) and the energy spread correction. The latter is due to the uncertainty in the measurement of and reaches 0.7% for the energy point with MeV. At the tails of the resonance the systematic uncertainty is dominated by the uncertainty of the number of signal events (up to 15%). The total systematic uncertainty is obtained as a sum in quadrature of all systematic uncertainties from different sources. It varies from 1% to 15% depending on the energy point and is comparable to the statistical error at the vicinity of the resonance maximum.
The obtained energy scale shift for the 2024 scan (Table 2) significantly exceeds its systematic uncertainty (60 keV) estimated in Ref. compton . Although the origin of such a shift is unclear, it does not affect the measured cross section.
The obtained values of the Born cross sections are actually numerical solutions of the integral equation (3), in which the theoretical model is used for regularization. Since the theoretical model is the same for all energy points, the Born cross sections obtained for different energy points can be correlated. To study these correlations, a series of pseudoexperiments is used. The number of signal events for each energy point is generated according to the theoretical model with a variance equal to its statistical error (Table 3) with an additional term corresponding to (6) added in quadrature. The statistical uncertainties of the Born cross section in Table 3 and in Fig. 4 correspond to the diagonal elements of the obtained covariance matrix. The full correlation matrix is given in the supplementary material.
VII Discussion
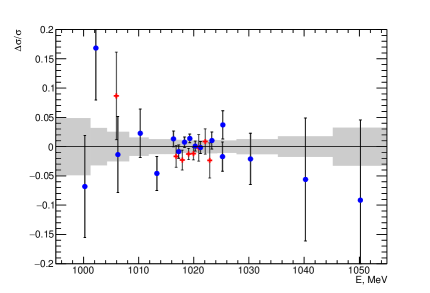
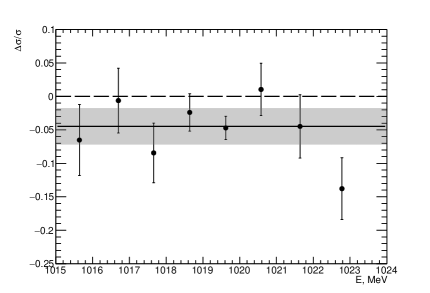
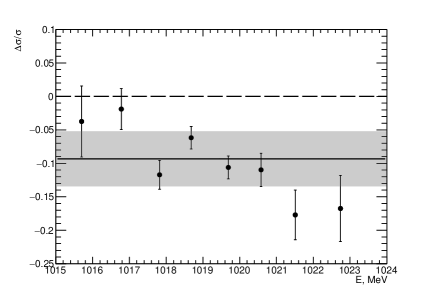
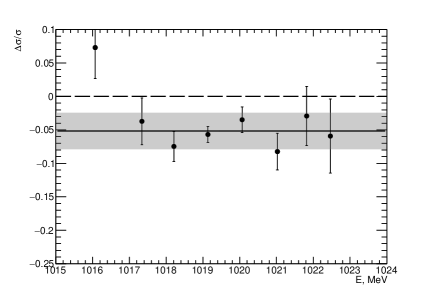
Figure 5 shows the relative differences between the measured Born cross section and the result of the fit described above for this work and data from Ref. SNDetg2000 ; CMDetg2001 ; SNDetg2007 . The solid line on each plot shows the average difference, which is ()% for the SND measurement using the decay channel in Ref. SNDetg2007 , ()% for the CMD-2 measurement in Ref. CMDetg2001 and ()% for the SND measurement in Ref. SNDetg2000 . The first quoted error is statistical and the second is systematic. It is seen that the measurement made in this work has better accuracy and is higher compared to other measurements.
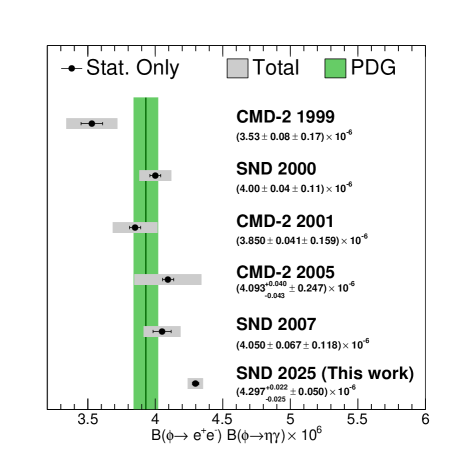
Using the relation , where is the product of the branching fractions of the decays and and is the meson mass pdg , we can obtain
The first error is statistical and the second is systematic. The systematic uncertainty varies depending on the chosen solution. The dominant contribution to it comes from the uncertainty of the measured cross section (1.1-1.2%). Variation of the parameters and within their errors is used to estimate corresponding systematic uncertainty, which are 0.4-0.6% and 0.2%, respectively. Since the obtained values for the parameters , , , are largely determined by the data from Ref.SNDkskl ; SNDetg23 , their contribution to the total error (0.1-0.3%) is included into the systematic error. The total systematic uncertainty is obtained as a sum in quadrature of all systematic uncertainties from different sources.
Comparison of the obtained product with the previous measurements makes sense only for the first solution, since the interference pattern between the resonances for other solutions is significantly different from that assumed in previous experimental works. Such a comparison is shown in Fig. 6. Our measurement is higher than all previous ones in accordance with the differences of the measured cross sections discussed above.
VIII Conclusion
In the SND experiment at the VEPP-2000 collider, the measurement of the cross section has been performed in the center-of-mass energy range from 980 to 1060 MeV. Our measurement is the most accurate to date and is higher compared to other measurements. The total error of the measured cross section at the maximum of the resonance is %. From the fit to the cross section data with the vector meson dominance model, the value of the product has been obtained.
References
- (1) P. O’Donnel, Rev. Mod. Phys. 53, 673 (1981).
- (2) G. Morpurgo, Phys. Rev. D 42, 1497 (1990).
- (3) M. Benayoun, L. Delbuono, and F. Jegerlehner, Eur. Phys. J. C 80, 81 (2020), [Erratum: Eur.Phys.J.C 80, 244 (2020)].
- (4) R. Escribano and J. Nadal, JHEP 05 (2007), 006.
- (5) F. Ambrosino et al. (KLOE Collaboration), JHEP 07 (2009) 105.
- (6) R. Escribano and E. Royo, Phys. Lett. B 807 (2020), 135534
- (7) V. Mathieu, N. Kochelev and V. Vento, Int. J. Mod. Phys. E 18 (2009), 1.
- (8) I. E. Halperin and A. Zhitnitsky, Phys. Rev. D 56 (1997), 7247.
- (9) M. N. Achasov et al. (SND Collaboration), Eur. Phys. J. C 12, 25 (2000).
- (10) M. N. Achasov et al. (SND Collaboration), Phys. Rev. D 76, 077101 (2007).
- (11) R. R. Akhmetshin et al. (CMD-2 Collaboration), Phys. Lett. B 460, 242 (1999).
- (12) R. R. Akhmetshin et al. (CMD-2 Collaboration), Phys. Lett. B 509, 217 (2001).
- (13) R. R. Akhmetshin et al. (CMD-2 Collaboration), Phys. Lett. B 605, 26 (2005).
- (14) M. N. Achasov et al., Nucl. Instrum. Meth. A 449, 125 (2000).
- (15) V. M. Aulchenko et al., Nucl. Instrum. Meth. A 598, 102 (2009).
- (16) A. Y. Barnyakov et al., Nucl. Instrum. Meth. A 598, 163 (2009).
- (17) V. M. Aulchenko et al., Nucl. Instrum. Meth. A 598, 340 (2009).
- (18) P. Y. Shatunov et al. Phys. Part. Nucl. Lett. 13, 995 (2016).
- (19) E. A. Kuraev and V. S. Fadin, Sov. J. Nucl. Phys. 41, 466 (1985).
- (20) G. Bonneau and F. Martin, Nucl. Phys. B 27, 381 (1971).
- (21) J. Allison et al. (GEANT Collaboration), Nucl. Instr. Meth. A 835, 186 (2016).
- (22) E. V. Abakumova et al., Nucl. Instrum. Meth. A 744, 35 (2014).
- (23) M. N. Achasov et al. (SND Collaboration), Phys. Rev. D 110, no.7, 072001 (2024)
- (24) G. Balossini et al., Phys. Lett. B 663, 209 (2008).
- (25) S. Navas et al. (Particle Data Group), Phys. Rev. D 110, 030001 (2024).
- (26) N. N. Achasov, M. S. Dubrovin, V. N. Ivanchenko, A. A. Kozhevnikov, and E. V. Pakhtusova, Int. J. Mod. Phys. A 07, 3187 (1992).
- (27) J. J. Dudek et al. [Hadron Spectrum], Phys. Rev. D 88 (2013) no.9, 094505
- (28) M. N. Achasov et al. (SND Collaboration), Phys. Atom. Nucl. 86, no.6, 1157 (2023).
- (29) V. M. Malyshev, arXiv:1505.01509 [physics.data-an].