Galaxy Metallicity Gradients in the Reionization Epoch from the FIRE-2 Simulations
Abstract
We employ the high-redshift suite of FIRE-2 cosmological hydrodynamic zoom-in simulations to investigate the evolution of gas-phase metallicity radial gradients in galaxies in the epoch of reionization (EoR). Our sample consists of 22 galaxies spanning the redshift range . We find that galaxies at exhibit a median metallicity gradient of with substantial scatter, which gradually flattens to at , accompanied by a reduction in scatter. In the EoR, metallicity gradients correlate positively with stellar mass: more massive galaxies display flatter gradients with smaller scatter, broadly consistent with recent JWST observations. At fixed stellar mass, galaxies with higher star formation rates (SFRs) exhibit steeper negative gradients, while sSFR shows a strong anti-correlation with gradient slope. Because EoR galaxies in FIRE-2 generally lack significant rotational support, we adopt the ratio of peak-to-peak velocity shear to twice the velocity dispersion () as a proxy for the strength of gas flows. We find a strong positive correlation between metallicity gradients and : galaxies with lower (i.e., weaker gas flows) tend to exhibit steeper negative gradients. Furthermore, galaxies with steeper gradients display higher central SFR surface densities, suggesting localized star formation with inefficient interstellar medium mixing that drives inside-out chemical enrichment in galaxy evolution in the early Universe.
1 Introduction
The spatial distribution of metals in galaxies provides an important window into their formation and evolutionary processes. Metals, primarily produced by stellar nucleosynthesis (e.g. Nomoto et al., 2013), are dispersed into the interstellar medium (ISM) through stellar winds and supernova explosions (e.g. Wang et al., 2023). Metallicity in galaxies is typically defined in two phases: gas-phase metallicity, which reflects the current chemical state of the ISM and is closely linked to ongoing star formation and feedback processes (e.g. Tremonti et al., 2004; Lee et al., 2006); and stellar metallicity, which encodes the integrated chemical enrichment history of a galaxy over cosmic time (e.g. Gallazzi et al., 2005; Kirby et al., 2013).
Previous studies have revealed a strong correlation between stellar mass and gas-phase metallicity in galaxies, commonly referred to as the mass-metallicity relation (MZR), which indicates that more massive galaxies tend to be more metal-rich in both the local universe (e.g. Tremonti et al., 2004; Zahid et al., 2012; Andrews & Martini, 2013), and cosmic noon (e.g. Erb et al., 2006; Maiolino et al., 2008; Sanders et al., 2015; Ma et al., 2016; Sanders et al., 2021; He et al., 2024a). Recent efforts have extended the study to the reionization epoch (Nakajima et al., 2023; Curti et al., 2024; Marszewski et al., 2024; Li et al., 2025a). In addition, several studies have suggested a secondary dependence on SFR, leading to the fundamental metallicity relation (FMR) (Mannucci et al., 2010; Bothwell et al., 2013; Marszewski et al., 2025). While the MZR and FMR describe global metallicity scaling relations, understanding the internal chemical structure of galaxies requires spatially resolved measurements. A widely used approach to characterize this distribution is through a linear fit to the radial metallicity profile (e.g. Jones et al., 2015; Wang et al., 2017, 2020, 2022).
The evolution of metallicity gradients has been extensively studied in simulations and observations at low redshift. Since Searle (1971), it has been well established that central regions of nearby galaxies are more metal-rich than their outskirts, leading to the typical observation of negative radial metallicity gradient (e.g. Zaritsky et al., 1994; van Zee et al., 1998). In recent years, metallicity gradients have been found to vary with galaxy morphology and mass (e.g. Carton et al. 2018; Li et al. 2025b; Hemler et al. 2021, TNG; Tissera et al. 2022, EAGLE). Stott et al. (2014); Wuyts et al. (2016); Sillero et al. (2017, TNG); Ma et al. (2017, FIRE) report a positive correlation between metallicity gradient and sSFR at , indicating that more actively star-forming galaxies tend to exhibit flatter gradients. Ju et al. (2025); Bellardini et al. (2021, 2022, FIRE); Graf et al. (2025, FIRE); Sun et al. (2025, FIRE) find that steep negative metallicity gradients are strongly maintained by significant rotational support, indicating that well-ordered disk plays a crucial role in preserving radial chemical stratification within galaxies (See also: Liang et al., 2025; Lyu et al., 2025). Ordered galactic disks are thought promote more steady and regulated star formation, leading to a radially stratified medium that suppresses the development of large-scale outflows. This stabilization helps maintain metallicity gradients and the central concentration of galaxies. By contrast, irregular systems exhibit a more pronounced redistribution of metals on galactic scales.Moreover, mergers also play an important role in redistributing gas-phase metals–particularly major mergers, which can significantly alter the spatial concentration of metals within a galaxy and trigger enhanced star formation (Ellison et al., 2013; Hopkins et al., 2013; Cortijo-Ferrero et al., 2017; Porter et al., 2022; Sun et al., 2024).
Several studies have reported the presence of positive metallicity gradients in some galaxies during cosmic noon (Cresci et al., 2010; Wang et al., 2019), suggesting that metal enrichment may not always proceed from the center outward. The spatial distribution of metallicity is shaped by a variety of processes, including gas accretion, supernova explosions, stellar winds, mergers, active galactic nuclei (AGN) feedback, and other dynamical and chemical interactions (e.g. Mo et al., 2010; King & Pounds, 2015; Thielemann et al., 2017; Maiolino & Mannucci, 2019; Wang et al., 2023; Nakajima et al., 2024; He et al., 2024b; Peng et al., 2025). Gibson et al. (2013) compared two feedback models and found that the “enhanced” feedback model (MaGICC) produces significantly flatter metallicity gradients, while the “conservative” feedback model (MUGS) results in steeper gradients (Luo et al., 2024). As mentioned in Mo et al. (2024); Chen et al. (2024, 2025), AGN and SN feedback have a certain impact on shaping galaxies and the gas dynamics within galaxies. Bellardini et al. (2021, 2022); Sun et al. (2025); Baker et al. (2025) discuss the nonlinear radial behavior of metallicity in galaxies, suggesting that beyond the gradient, additional statistical measures can be employed to more precisely characterize the spatial distribution of metals. Nevertheless, in most cases a linear fit remains the simplest approach for gradient analysis. Understanding how metals are spatially arranged within galaxies offers critical insights into the interplay between gas dynamics, stellar feedback, and galaxy morphology over cosmic time.
Recently, new data from JWST have opened up the possibility of observationally probing metallicity gradients in EoR galaxies for the first time. Recent studies (Arribas et al., 2024; Vallini et al., 2024; Venturi et al., 2024; Tripodi et al., 2024) have provided initial constraints on metallicity gradients at , revealing a diverse range of gradient behaviors in EoR galaxies. Most results suggest that EoR galaxies tend to exhibit modestly negative gradients around , and a subset of observations has also reported the presence of positive gradients. Garcia et al. (2025) present results from TNG, Illustris, and EAGLE simulations in the reionization epoch, showing that most galaxies at this epoch exhibit strong negative gradients accompanied by substantial scatter. In the early stages of galaxy evolution, galaxies exhibit evolutionary behaviors that differ markedly from those at low redshift, with feedback processes playing a correspondingly different role (e.g. Jin et al., 2024; Bassini et al., 2023; Mo et al., 2024). However, studies focusing on metallicity gradients in the reionization epoch remain limited. The lack of high-resolution observations at hinders direct measurements of spatially resolved chemical abundances. Only a few simulation suites have explored this regime with sufficient resolution and sample size, leaving the physical drivers of early metallicity gradients still incompletely understood.
The Feedback In Realistic Environments simulations (FIRE) 111See also: https://fire.northwestern.edu/ have been widely utilized to investigate the evolution of metallicity gradients under a broad range of physical conditions. These include three-dimensional abundance structures (Bellardini et al., 2021, 2022; Graf et al., 2025), the impact of stellar feedback at cosmic noon (Ma et al., 2017; Sun et al., 2025), gas inflows and turbulent mixing (Graf et al., 2024), and azimuthal variations associated with spiral structures (Orr et al., 2023), among others. Building on these studies, we conduct a detailed analysis of gas-phase metallicity gradients in galaxies in the reionization epoch using the high-redshift suite of the FIRE-2 project. This enables us to examine how chemical structures form and evolve in the earliest stages of galaxy assembly.
This paper is organized as follows. In Section 2, we describe the simulation setup and the methods used to define galaxies and compute their physical properties. Section 3 presents our main results, including comparisons with observational data and other cosmological simulations. We conclude in Section 4 with a summary of our key findings and their implications for early galaxy evolution.
2 Methodology
2.1 Simulation
| Name | Reference | ||||||
|---|---|---|---|---|---|---|---|
| (M⊙) | (M⊙) | (M⊙) | (pc) | (pc) | (pc) | ||
| z5m09a | 119 | 650 | 0.7 | 10 | 0.14 | Ma et al. (2018a) | |
| z5m09b | 119 | 650 | 0.7 | 10 | 0.14 | Ma et al. (2018a) | |
| z5m10a | 119 | 650 | 0.7 | 10 | 0.14 | Ma et al. (2020) | |
| z5m10b | 954 | 5200 | 1.4 | 21 | 0.28 | Ma et al. (2018a) | |
| z5m10c | 954 | 5200 | 1.4 | 21 | 0.28 | Ma et al. (2018a) | |
| z5m10d | 954 | 5200 | 1.4 | 21 | 0.28 | Ma et al. (2018a) | |
| z5m10e | 954 | 5200 | 1.4 | 21 | 0.28 | Ma et al. (2018a) | |
| z5m10f | 954 | 5200 | 1.4 | 21 | 0.28 | Ma et al. (2018a) | |
| z5m11a | 954 | 5200 | 1.4 | 21 | 0.28 | Ma et al. (2018a) | |
| z5m11b | 891 | 4900 | 1.4 | 21 | 0.28 | Ma et al. (2018a) | |
| z5m11i | 891 | 4900 | 1.4 | 21 | 0.28 | Ma et al. (2020) | |
| z5m11c | 891 | 4900 | 1.4 | 21 | 0.28 | Ma et al. (2020) | |
| z5m11h | 7100 | 2.1 | 42 | 0.42 | Ma et al. (2019) | ||
| z5m11d | 7100 | 2.1 | 42 | 0.42 | Ma et al. (2018a) | ||
| z5m11g | 7100 | 2.1 | 42 | 0.42 | Ma et al. (2019) | ||
| z5m11e | 7100 | 2.1 | 42 | 0.42 | Ma et al. (2018a) | ||
| z5m11f | 7100 | 2.1 | 42 | 0.42 | Ma et al. (2019) | ||
| z5m12a | 7100 | 2.1 | 42 | 0.42 | Ma et al. (2018a) | ||
| z5m12e | 7100 | 2.1 | 42 | 0.42 | Ma et al. (2019) | ||
| z5m12d | 7100 | 2.1 | 42 | 0.42 | Ma et al. (2019) | ||
| z5m12c | 7100 | 2.1 | 42 | 0.42 | Ma et al. (2019) | ||
| z5m12b | 7100 | 2.1 | 42 | 0.42 | Ma et al. (2018a) |
-
•
Parameters describing the initial conditions for our simulations (units are physical):
-
•
Name: simulation designation.
-
•
: approximate mass of the main halo at .
-
•
, : initial masses of baryonic (gas or star) and dark-matter particles.
-
•
, : force softening (Plummer equivalent) for star and dark-matter particles.
-
•
: minimum adaptive force softening for gas cells.
-
•
Reference: where the simulation is first presented.
-
•
All simulation use cosmological parameters:
-
•
P (‘Planck’: = 0.31, = 0.69, = 0.0458, = 0.68, = 0.82, = 0.97).
The simulations used in this study derive from the output of the high-redshift suite of the FIRE-2 cosmological hydrodynamic simulations in Ma et al. (2018a, 2019, 2020). All simulations were performed using the gizmo code in its meshless finite-mass (MFM) mode (Hopkins, 2015) and the FIRE-2 physics model (Hopkins et al., 2018). Our sample includes 22 zoom-in simulations of galaxies: z5m09a-b, z5m10a-f, z5m11a-i, and z5m12a-e. These galaxies are evolved down to , spanning final main halo masses ranging from to . We analyze 11 snapshots for each galaxy uniformly spaced in cosmic time over the redshift interval -5, resulting in 242 snapshots in total. For these galaxies, the initial mass of baryonic and dark matter particles are and . Gravitational force softening lengths (Plummer-equivalent) span for star particles and for dark matter. Gas follows an adaptive softening scheme, with a minimum resolution reaching . All runs adopt a standard flat cosmology with Planck2015 cosmological parameters; see Table 1 for a summary of galaxy properties.
The FIRE-2 simulations track the abundances of 11 different elements (H, He, C, N, O, Ne, Mg, Si, S, Ca, Fe, following Wiersma et al. (2009)), and span a broad temperature range from 10 to , enabling accurate modeling of gas thermodynamics across different phases of the ISM. Multiple stellar feedback processes are implemented, including radiative feedback, core-collapse supernovae, Type Ia and Type II supernovae, and stellar winds from O/B and AGB stars. These mechanisms drive metal mixing and energy transfer within the ISM. The stellar evolution model in the simulations adopts a Kroupa initial mass function (IMF; Kroupa (2001)), with feedback rates and energetics derived from starburst99 (Leitherer et al., 1999). The simulations also include a subgrid turbulent diffusion model to account for unresolved metal mixing through local gas turbulence, allowing chemical elements to diffuse between neighboring resolution elements. These FIRE-2 simulations do not model feedback from AGN.
Further details on the high-redshift simulation suite are presented in Ma et al. (2018a, 2019, 2020), while the overall FIRE-2 framework is described in Hopkins et al. (2018). A summary of the publicly released FIRE-2 data is provided in Wetzel et al. (2023).
2.2 Galaxies definition
In this section, we describe how galaxies are defined for the calculation of metallicity gradients and other physical properties. We use Amiga’s Halo Finder (ahf; Knollmann & Knebe, 2009) to identify halos.
We follow the method outlined in Fitts et al. (2017); Ma et al. (2017) to define the galaxy center as the geometric center of all stellar particles within a shrinking spherical region, iteratively reduced from to . A redshift-dependent characteristic radius is then computed based on the empirical size-redshift relation from Bouwens et al. (2004), using a baseline value of at and neglecting stellar mass dependence. Specifically, the initial radius is defined as . Within this radius, we compute the total stellar mass () and SFR of the galaxy. We identify the stellar distribution within this region and determine , defined as the radius enclosing 90% of the total mass in young stars with ages (Orr et al., 2017). This radius is subsequently used as the aperture for computing kinematic quantities and gas-phase metallicity gradients. To characterize central star formation, we further define a central region as a sphere of radius centered on the galaxy. The SFR measured within this region is used to quantify centrally concentrated star formation activity.
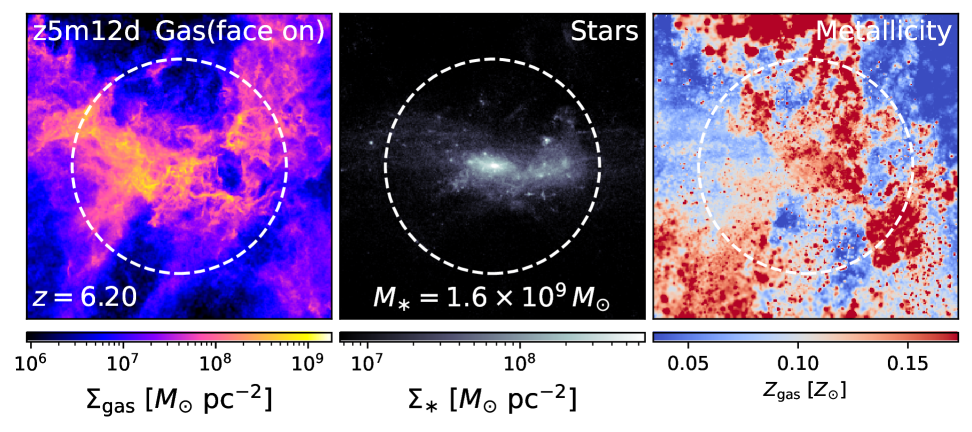
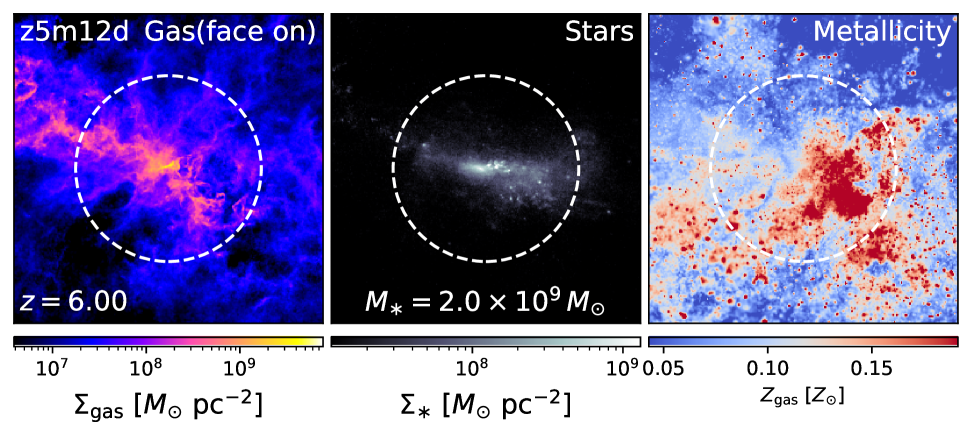
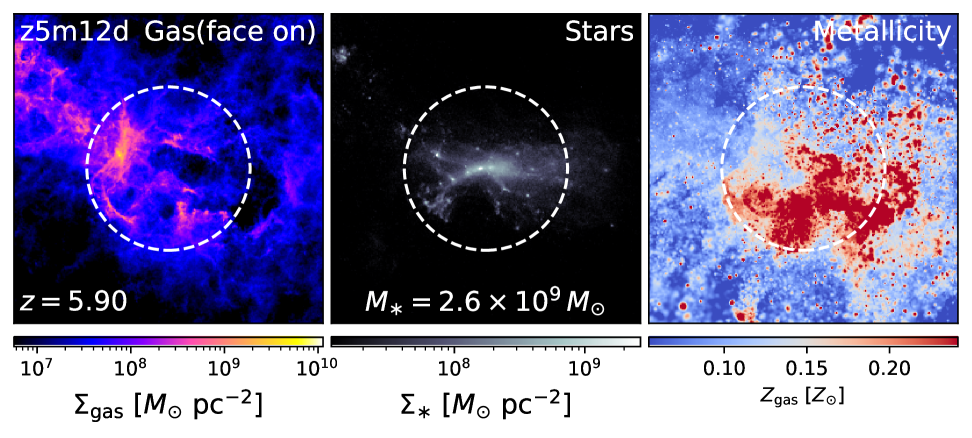
In the left panel of Fig. 1, we present three representative samples from our simulation. For each galaxy, we align the galaxy’s angular momentum with the -axis, such that directions perpendicular and parallel to the -axis correspond to the “face-on” and “edge-on” views, respectively. In all panels, a white circle marks the analysis aperture, corresponding to the previously defined . The top row of Fig. 1 shows, from left to right: the face-on gas surface density map, the face-on stellar surface density map, and the face-on gas-phase metallicity map.
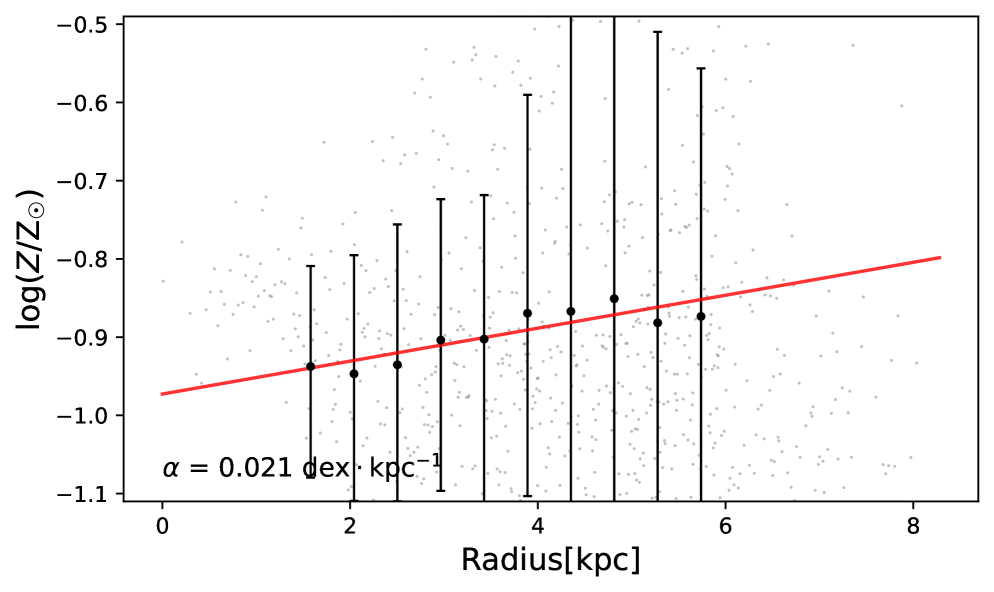
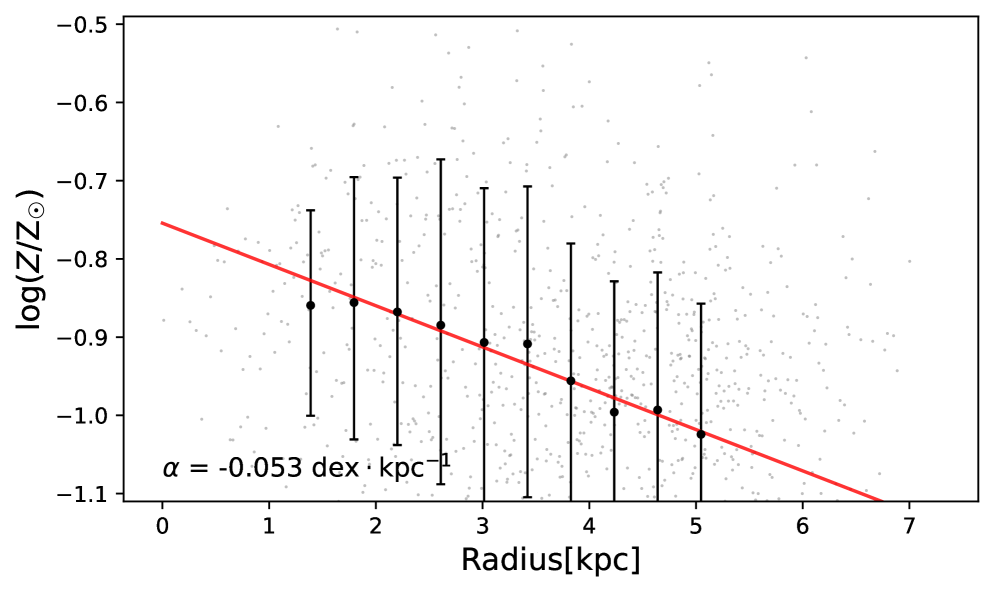
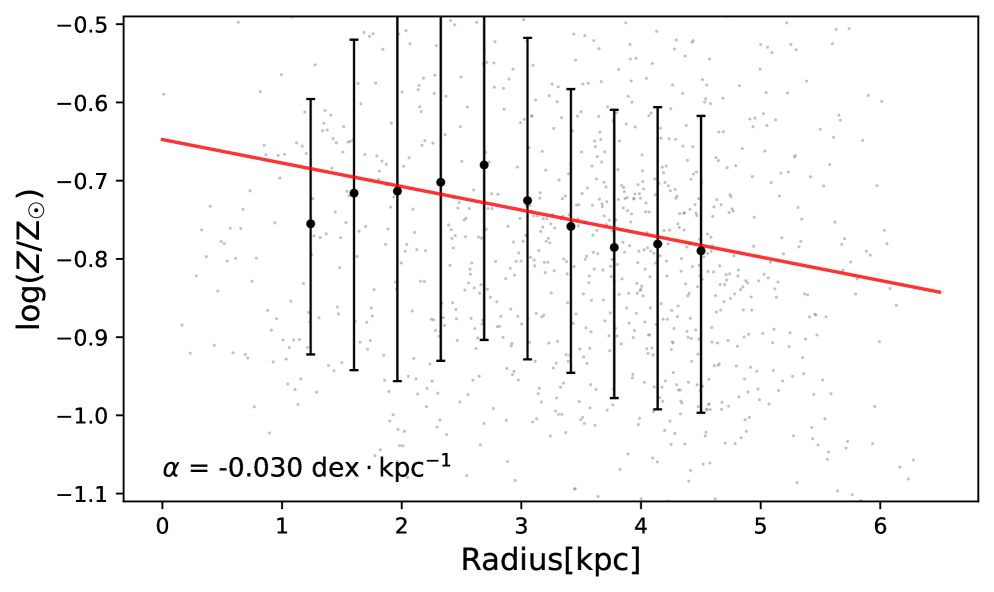
To quantify these gradients, we perform a linear fit to the radial metallicity profile over the range -:
| (1) |
where is the gas-phase metallicity and is the projected radial distance from the galaxy center. In our previous work, we use , and thus this choice has no impact on the calculation of metallicity gradients. This specific radial range is chosen to improve the robustness of gradient measurements in clumpy and morphologically irregular high-redshift galaxies (Ma et al., 2017).
To ensure uniform and adequate radial sampling for our fits, we apply a lower bound of , assigning this floor value to galaxies whose measured is below the threshold. Furthermore, only gas particles with surface densities above are included, where fragmentation and star formation are expected to occur (Orr et al., 2018). On the right of Fig. 1, we show the gradients of the same three galaxies, which exhibit positive, flat, and steep negative slopes at different redshifts. We also estimate two additional timescales. The free-fall time (Semenov et al., 2017) characterizes the duration of starburst activity, while the mixing time (Andalman et al., 2025) measures the timescale of turbulence-driven gas mixing.
2.3 Kinematics
We analyze the kinematic properties of our galaxies following Yuan et al. (2011); Ma et al. (2017). Given that galaxies in the reionization epoch often irregular, lack well-ordered rotation (Ma et al., 2018b), we adopt an wide slit to better capture their turbulent and irregular velocity fields. Specifically, a -wide slit is placed along the -axis of each galaxy, sampling gas particles within the region defined by and . All gas particles within this region are used to construct the galaxy’s kinematic profile.
For each spatial bin along the -axis, we compute the total line-of-sight momentum and divide by the total gas mass to obtain the mean line-of-sight velocity. The velocity dispersion, (or ), is defined as the maximum line-of-sight velocity dispersion measured across different azimuthal angles within the slit region, capturing the strongest turbulent motions.
We estimate the kinematic properties of each galaxy using two independent methods. The first approach follows Leethochawalit et al. (2016); Ma et al. (2017), in which we compute the peak to peak shear along the slit:
| (2) |
in three orthogonal directions: line-of-sight (), radial (), and tangential (). We use the deviation to dispersion ratio to simply refer to the ratio of the peak-to-peak maximum velocity shear and velocity dispersion . This quantity characterizes the overall velocity contrast of gas particles in early galaxies, providing a measure of the amplitude of large-scale gas motions relative to random turbulence. The method offers enhanced flexibility in capturing complex kinematic features-typical of irregular or turbulent systems without assuming symmetry or disk-like structure. These values are measured as the maximum over all azimuthal angles within the slit.
The second method fits the line-of-sight velocity profile with an arc-tangent function of the form:
| (3) |
where represents the asymptotic rotation velocity at large radii, and denotes the systemic velocity at the galaxy center (e.g., Jones et al., 2010; Swinbank et al., 2012; Stott et al., 2014; Leethochawalit et al., 2016). We restrict such that to ensure fit stability. This approach quantifies the rotational support of the galaxy. As shown in Sun et al. (2025), we classify the galaxies into three distinct categories based on these fits. However, since these EoR galaxies often lack coherent rotation, this method can introduce biases when applied to irregular systems. These two methods complement each other, providing a more comprehensive view of the dynamical state of galaxies. It should be noted that, based on Ferreira et al. (2022); Sun et al. (2024), disk-like morphology galaxies may exist in EoR, while other studies argue that these structures are prolate spheroids rather than true disks. In addition, although limited in number, a few observations have reported kinematic signatures of ordered rotation in EoR galaxies, suggesting that genuine disks may indeed form at these epochs. In this paper, we simply classify galaxy morphology using the rotational support ; a more detailed discussion of these issues is left for future work.
3 Results
3.1 Metallicity gradient versus redshift
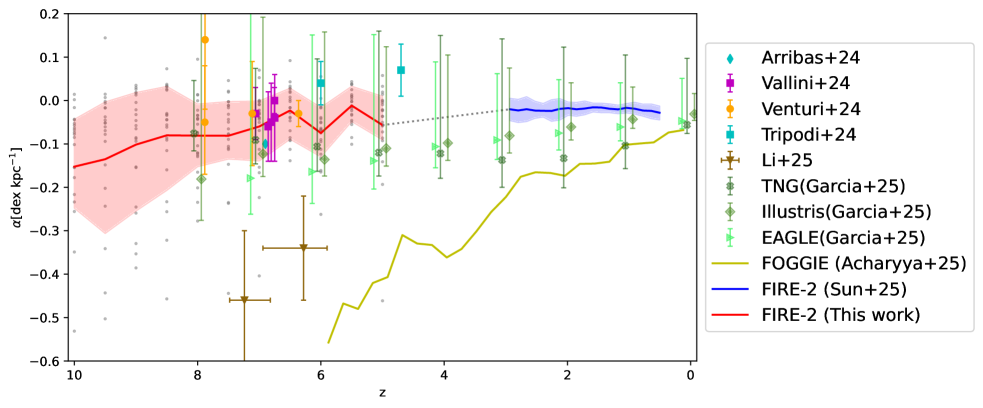
In Fig. 2, we present the redshift evolution of gas-phase metallicity gradients for all galaxies in our sample across . Individual galaxies are shown as gray points, while the red line indicates the average gradient at each redshift. For comparison, blue lines show the results from Sun et al. (2025) based on FIRE-2 galaxies at . The green points represent simulation results from Garcia et al. (2025), which include data from the TNG, Illustris, and EAGLE projects, covering a mass range of . The remaining points correspond to observation measurements from Arribas et al. (2024); Vallini et al. (2024); Venturi et al. (2024); Tripodi et al. (2024); Li et al. (2025c), with stellar masses in the range . This color and symbol scheme is used consistently in the following figures.
In the reionization epoch, FIRE-2 galaxies show negative metallicity gradients with typical slopes of about . These values are on average steeper than the mean gradients at cosmic noon, but the scatter is substantially larger, encompassing more extreme cases of both positive and negative gradients. As galaxies evolve, these gradients systematically flatten, indicating a transition toward a more chemically homogeneous internal structure. At the same time, scatter in metallicity gradients is also substantially larger at high redshift, reflecting the dynamical instability of early galaxies and allowing for more extreme metallicity gradients, with values ranging from as steep as to as positive as . Over time, however, the scatter decreases steadily, suggesting that galaxies evolve toward more stable and regulated states in both dynamical and chemical properties (Garcia et al., 2025). This evolution suppresses the occurrence of extreme gradients – either strongly positive or negative – at lower redshifts.
These trends are broadly consistent with the results from Illustris and EAGLE at (Garcia et al., 2025), although the metallicity gradients in FIRE-2 tend to be slightly flatter in comparison. This is likely due to differences in metal mixing: EAGLE locks metals in gas particles (Aguirre et al., 2005), and Illustris lack explicit modeling of unresolved turbulent mixing (Escala et al., 2018; Semenov, 2024). These differences can lead to less efficient metal redistribution and thus steeper gradients in those simulations. FOGGIE (Acharyya et al., 2024) results exhibit strongly negative gradients. As mentioned in that paper, the relatively weak supernova feedback and centrally concentrated star formation tend to retain metals in the central regions, thereby producing systematically steeper negative gradients.
By the end of our analysis at , the average metallicity gradient in FIRE-2 galaxies reaches approximately , comparable to values typically observed at lower redshifts (e.g. ).
The metallicity gradients predicted by FIRE-2 are in excellent agreement with recent high-redshift observations (Venturi et al., 2024; Vallini et al., 2024), with most simulated values falling within the range of the observed distributions. This agreement underscores the robustness of the FIRE-2 framework in reproducing key chemical features of early galaxies. A major factor contributing to this consistency is the implementation of strong stellar feedback in FIRE-2, which drives large-scale gas flows and facilitates efficient metal mixing across the ISM. This process leads to smoother metallicity distributions and more observationally consistent gradients. Furthermore, FIRE-2 reproduces a subset of galaxies with steep positive or negative gradients, consistent with the results reported in Venturi et al. (2024); Li et al. (2025c), highlighting its ability to capture the diversity of chemical structures in the early Universe.
Taken together, these results demonstrate the capability of FIRE-2 to realistically model the chemical evolution of galaxies in the reionization epoch, and affirm its value as a theoretical framework for interpreting the growing body of high redshift observational data.
3.2 Metallicity gradient versus stellar mass
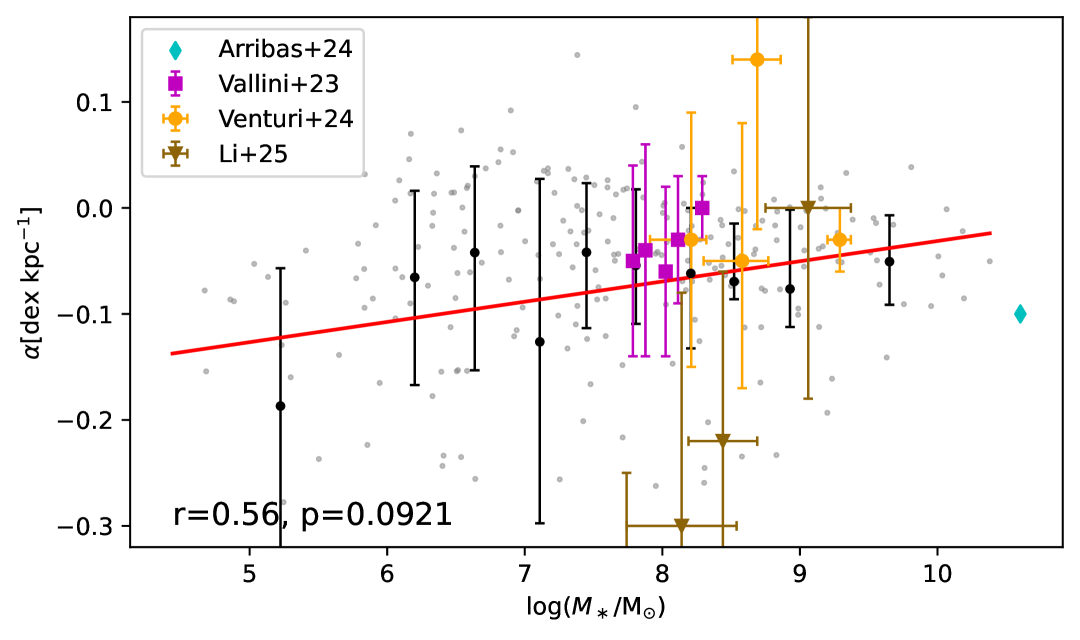
In Fig. 3, we present the relationship between gas-phase metallicity gradient and stellar mass. A clear trend emerges: more massive galaxies tend to exhibit flatter (less negative) metallicity gradients. This behavior is broadly consistent with observational results at low redshift, where a positive correlation between gradient and stellar mass is observed below Stott et al. (2014); Ma et al. (2017); Sun et al. (2025). Low-mass systems tend to show steeper gradients and larger scatter, reflecting their chaotic internal structures. In contrast, the scatter in metallicity gradients decreases significantly toward the high-mass end, suggesting that more massive galaxies develop dynamically stable configurations capable of maintaining relatively uniform chemical distributions, even in the reionization epoch.
FIRE-2 successfully reproduces the stellar mass dependence of metallicity gradients across a broad mass range, with results that are broadly consistent with current observational constraints from Vallini et al. (2024); Venturi et al. (2024). While the limited number of high-redshift measurements and the significant scatter in existing data prevent the establishment of a precise universal relation, the overall agreement between simulations and observations supports the conclusion that stellar mass is a primary driver of internal chemical structure. This trend appears to be in place even at early cosmic times, suggesting that the link between galaxy mass and metallicity distribution emerges rapidly as galaxy formation.
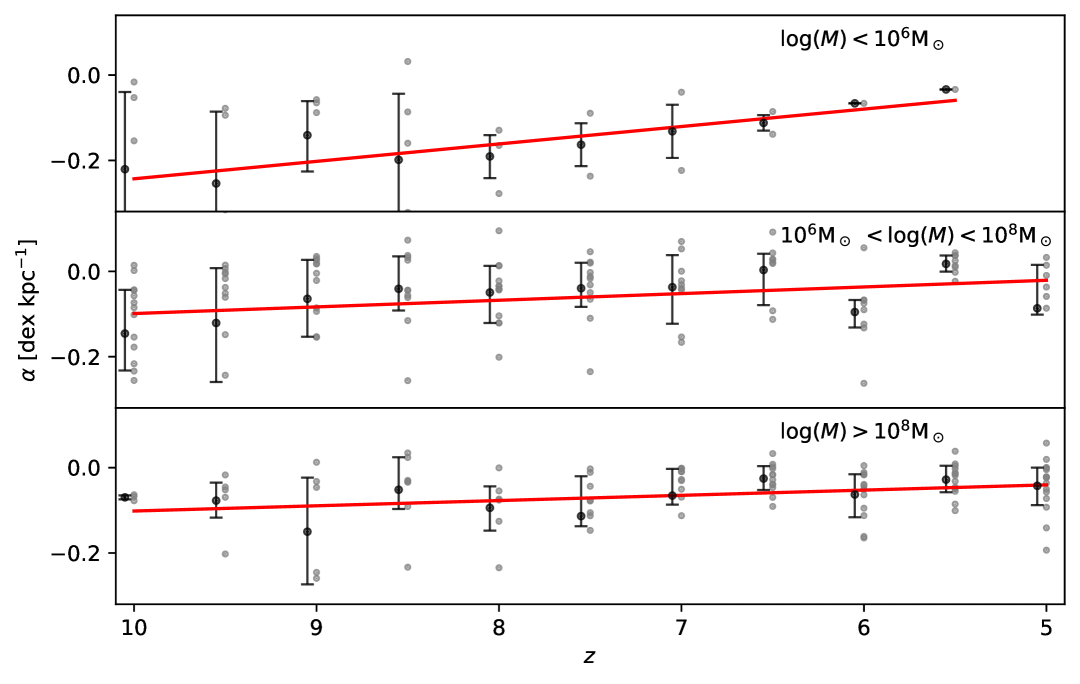
Fig. 4 further illustrates the redshift evolution of metallicity gradients as a function of stellar mass. Galaxies are grouped into three mass bins: (top), (middle), and (bottom). Here, a strong mass dependence is evident: low-mass galaxies exhibit substantial redshift evolution in their gradients, while high-mass systems maintain relatively constant gradients over time.
This mass-dependent behavior is likely linked to differences in regulatory mechanisms. In high-mass galaxies, as their physical size increases, internal feedback processes – particularly gas flows – tend to become more stable. These gas flows facilitate the redistribution of metals, resulting in more stable and flatter metallicity gradients, along with smoother and more coherent chemical evolution (Ma et al., 2017; Graf et al., 2024). In contrast, low-mass galaxies experience more bursty star formation, and their feedback processes often fail to mix metals efficiently on short timescales. This leads to steep negative metallicity gradients as metal-enriched gas remains concentrated near its origin, as seen in Fig. 3.
3.3 Metallicity gradient versus SFR
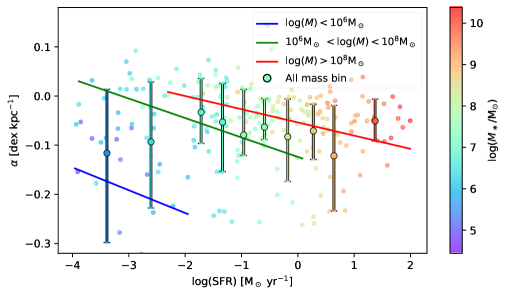
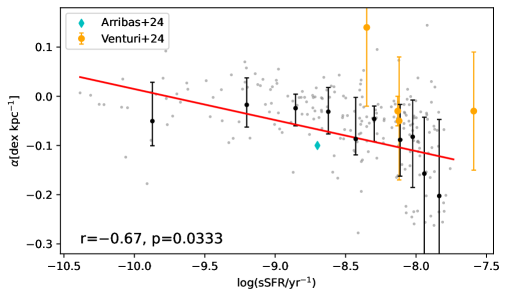
In Fig. 5, we examine the relationship between gas-phase metallicity gradients with both SFR and sSFR, measured over the past .
We find no correlation between the metallicity gradient and SFR when considering the entire galaxy sample. The left panel of Fig. 5 suggests that variations in total star formation activity have a limited effect on the overall gradient. However, this is not the case when stellar mass is taken into account. As shown in the different mass bins of Fig. 5, we still examine the relationship between metallicity gradients and SFR across three stellar mass bins: , , and . Across all mass bins, metallicity gradients show a clear negative correlation with SFR, suggesting that ongoing star formation plays a significant role in regulating the internal chemical structure of galaxies. In the highest mass bin, the correlation between metallicity gradient and SFR becomes weaker. Such regulation suppresses the development of steep gradients, even in the presence of vigorous star formation.
Metallicity gradients exhibit a similar negative correlation with sSFR, a trend similar with Venturi et al. (2024). This contrasts with the low-redshift trend reported by Stott et al. (2014); Ma et al. (2017); Sun et al. (2025), where metallicity gradients become flatter with increasing sSFR. In high-redshift sample (), the opposite behavior is observed: higher sSFR corresponds to steeper negative gradients. This reversal likely reflects differences in the relative timescales of star formation and metal mixing. At high redshift, star formation is more bursty and localized, often occurring in dense clumps where the free-fall timescale can be as short as , the metals produced by these stars are subsequently released during supernovae, leading to rapid metal enrichment in compact regions. However, the metal mixing timescale for these galaxies is typically too long to homogenize the newly enriched metals, leading to significant chemical inhomogeneities. As a result, the presence of numerous metal-enriched clumps within these galaxies are frequently observed, making them showing strong azimuthal patchiness.
By comparing the relationships between metallicity gradients and both SFR and sSFR, we find that the interplay between star formation and internal chemical structure is strongly modulated by stellar mass. While the strength of stellar feedback (as traced by SFR) contributes to shaping the metallicity gradient, the relative efficiency of feedback per unit stellar mass (sSFR) plays a more direct regulatory role.
3.4 Metallicity gradient versus kinematic parameters
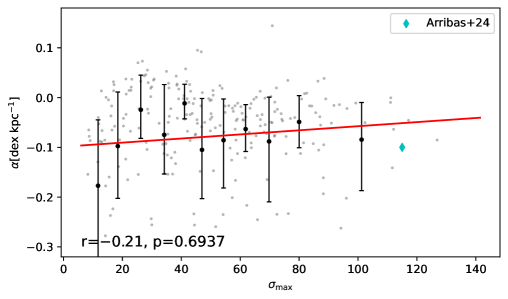
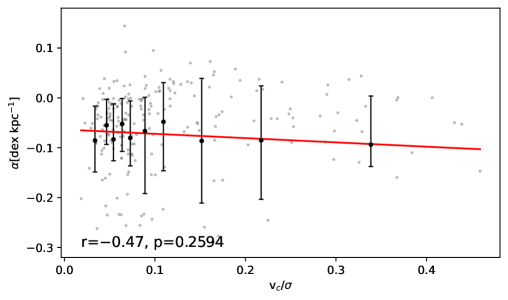
In this section, we examine the correlations between metallicity gradients and key kinematic indicators: gas velocity dispersion (), the degree of rotational support (), and the deviation to dispersion ratio (), measured within for all gas particles.
Following Kassin et al. (2012); Girard et al. (2020), galaxy with is classified as “rotationally supported”, all EoR galaxies are expected to lack well-ordered disk structures and instead exhibit irregular or clumpy morphologies. Consequently, strong correlations between structural kinematics and metallicity gradients may not yet be established. This is reflected in the left panel of Fig. 6, where metallicity gradients show no clear linear correlation with velocity dispersion. While hints of non-monotonic behavior (e.g. rise-fall-rise trends) may be present, the current sample size is insufficient to draw firm conclusions.
Similarly, the right panel of Fig. 6 shows only a very weak correlation between metallicity gradients and . Moreover, the values of are generally low, with the majority clustered at , which further limits the statistical significance of any observed trend. This reinforces the interpretation that coherent rotational support is not yet established in almost all EoR galaxies.
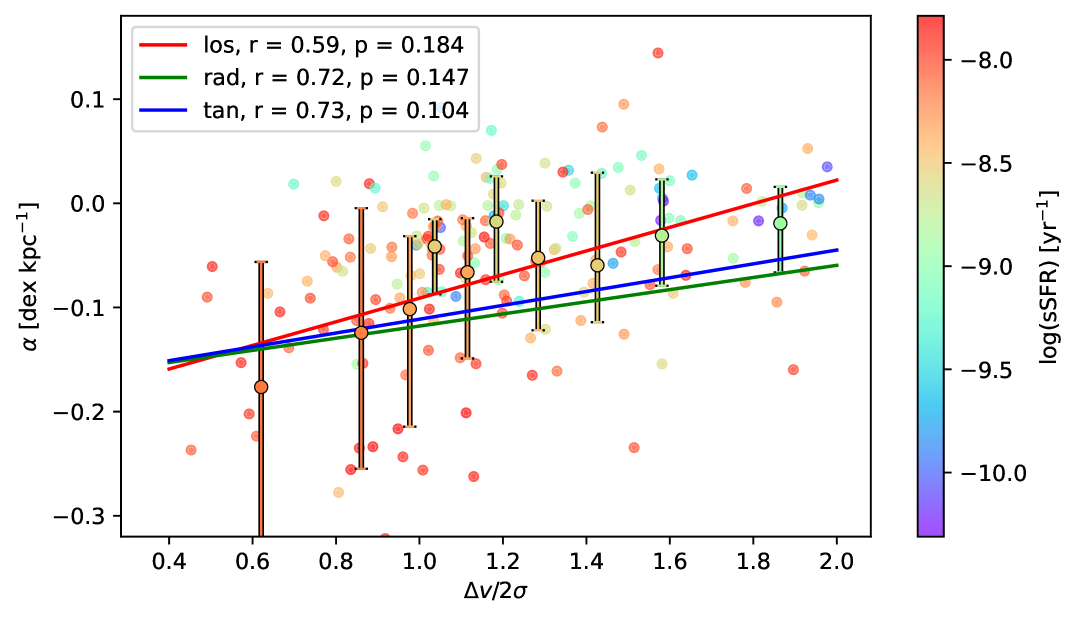
In contrast, Fig. 7 reveals a strong positive correlation between metallicity gradient and : as increases, gradients become progressively flatter. The same trend holds for the radial and tangential directions. This indicates that high-velocity gas flows play a critical role in regulating the spatial distribution of metals in irregular galaxies. Such flows can flatten gradients through a combination of metal-rich outflows, inflows of low-metallicity gas that dilute central enrichment, or enhanced turbulent mixing across large spatial scales. As previously discussed, intense starbursts rapidly enrich the dense central regions of galaxies, producing steep negative gradients. Feedback-driven winds then redistribute metals more uniformly throughout the ISM, flattening the gradient and promoting chemical homogeneity. These gas flows can also suppress star formation by reducing density and disrupting the formation of cold, dense gas clumps.
Taken together, these findings suggest that fitting high-redshift galaxies with a standard rotation curve – typically applied to well-ordered disk systems – may be inappropriate. Such models assume symmetric, rotationally supported structures that are often absent for EoR galaxies In contrast, the deviation to dispersion ratio provides a more flexible and physically meaningful tracer of the gas kinematics that regulate metal transport, especially in galaxies that have not yet developed stable disk-like structures.
3.5 Localized star formation
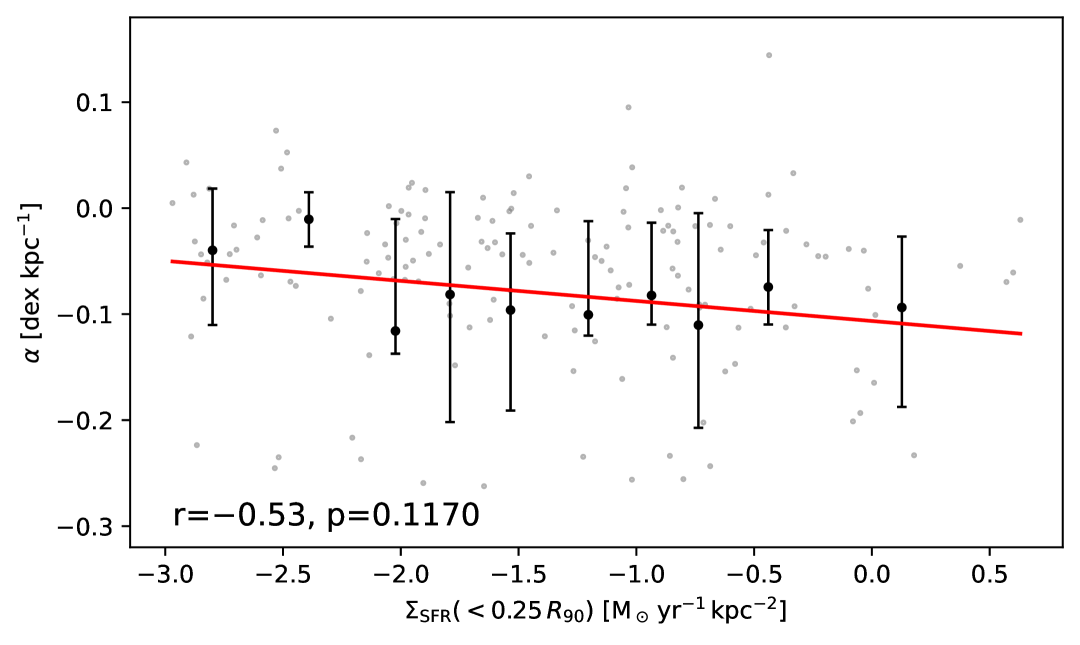
In this section, we investigate the relationship between gas-phase metallicity gradients and localized SFR surface density. Here we use the central region, defined as , as our proxy for localized density.
Fig. 8 reveals a negative correlation, similar to the previously discussed sSFR trend: galaxies with higher central star formation activity tend to exhibit steeper negative metallicity gradients. This relationship likely arises from localized enrichment processes, where intense, centrally concentrated starbursts rapidly inject metals into the galaxy’s core, creating pronounced radial contrasts in metallicity.
For these EoR galaxies, redistributing metals over galactic scales requires substantial gas flows and turbulence. These mixing timescales are comparable to () the bursty timescales of star formation episodes in young galaxies. As a result, gas motions are unable to effectively homogenize metals across the galaxy within short intervals, significantly limiting their spatial transport over large distances (See also in massive galaxies: Bassini et al., 2023). Metals remain confined near their production sites, creating numerous metal-rich clumps. Since our observational centers are intentionally defined at the highest-density cores, regions typically dominated by intense starburst activity, the steep negative metallicity gradients produced by localized enrichment become especially pronounced and readily measurable. The limited mixing efficiency in these environments enables these sharp gradients to form, persist, and be prominently detected observationally.
As shown in the first two snapshots of Fig. 1, bursty star formation episodes in the central regions drive a rapid increase in metallicity. However, mixing on galactic scales is relatively inefficient at this redshift, which limits metal redistribution and allows metals to continuously accumulate in the center, developing steep negative gradients. Feedback then becomes effective in the subsequent phase. Whether through star formation in the outskirts that releases new metals, or through powerful gas flows that redistribute existing metals, the previously steep gradients are smoothed out once again.
Thus, these EoR galaxies differ from their cosmic noon counterparts, where stronger feedback processes drive large-scale gas motions and turbulence that smooth metallicity gradients across galactic scales. At lower redshift (), once stable rotating disks are in place, secular processes inside-out growth, continuous central star formation, and bar/spiral torque-driven radial inflows-maintain the central build-up of metals and produce smooth, negative metallicity gradients.
4 Conclusions
In this paper, we utilize the high-redshift suite of the FIRE-2 cosmological hydrodynamic simulations to investigate the evolution of gas-phase metallicity gradients in galaxies from down to , spanning the reionization epoch. Our analysis is based on 22 simulated galaxies covering a wide range of stellar masses. Leveraging the detailed physical modeling and high numerical resolution of FIRE-2, we accurately characterize galaxy properties, including star formation and kinematics, and examine how these processes influence the spatial distribution of metals in early galaxies.
By systematically quantifying the relationship between metallicity gradients and global galaxy properties such as stellar mass, sSFR, and gas velocity metrics, we provide deeper insights into the physical mechanisms responsible for shaping the chemical structures of EoR galaxies.
-
•
In the reionization epoch, galaxies exhibit more extreme gas-phase metallicity gradients, significantly steeper than the typical gradients observed at lower redshifts. These gradients systematically flatten as galaxies evolve, indicating substantial chemical redistribution over cosmic time.Concurrently, the scatter among metallicity gradients is large at high redshift and gradually decreases with decreasing redshift. This reduction in scatter suggests that galaxies progressively evolve toward more dynamically stable configurations, thereby suppressing the development of extreme positive or negative metallicity gradients at later times.
-
•
Metallicity gradients exhibit a positive correlation with stellar mass across . High-mass galaxies tend to have flatter average gradients and smaller scatter, reflecting more stable internal structures. In contrast, low-mass galaxies show stronger redshift evolution in their gradients, while those of high-mass systems remain relatively constant over time. This mass dependence is linked to more bursty star formation in low-mass galaxies. The newly enriched gas tends to remain near its production sites due to inefficient mixing, which results in steeper negative metallicity gradients.
-
•
Although no significant global correlation is found between metallicity gradients and SFR, stratifying galaxies by stellar mass reveals a systematic negative correlation within each mass bin. This indicates that, even in the absence of a strong global trend, star formation relative to a galaxy’s mass remains an important factor influencing its internal chemical structure. Building on this, we find a strong correlation between metallicity gradients and sSFR: galaxies with higher sSFR tend to exhibit steeper negative gradients. This trend reflects the impact of centrally concentrated starbursts, which enrich the surrounding ISM with freshly produced metals. Such localized enrichment produces strong spatial inhomogeneities in the metal distribution, particularly in the central regions, resulting in steep metallicity gradients.
-
•
The relationship between metallicity gradients and galaxy kinematics is complex and nontrivial. We find no significant correlation between metallicity gradients and either the maximum velocity dispersion () or the degree of rotational support (). This lack of correlation is expected, as is not a robust metric in irregular high-redshift galaxies and does not reliably characterize their dynamical state. In contrast, we observe a positive correlation between metallicity gradients and the deviation to dispersion ratio (). Notably, while this ratio shows no clear evolution with redshift, its correlation with the metallicity gradient persists. This trend is related to sSFR. Intense starbursts rapidly enrich the central regions faster than feedback can redistribute the metals, creating steep negative gradients. Subsequent feedback then drives the turbulence, mixing the gas and redistributes the metals, flattening the gradients over time.
EoR galaxies differ substantially from their cosmic noon counterparts in both structural maturity and the nature of their internal physical processes, especially for low-mass systems (). In these early systems, the distribution of metals is strongly influenced by bursty, localized star formation. Starbursts typically occur in dense central regions and inject large amounts of metals into the surrounding ISM, forming localized metal-rich clumps and enriching the galactic core. However, the timescale required for large-scale metal redistribution is comparable to the duration of individual starburst episodes. As a result, metal mixing cannot proceed efficiently on short timescales (), and the enriched gas remains trapped near its origin. This leads to the formation of chemically enriched cores that stand in strong contrast to the more pristine outer regions, producing steep radial metallicity gradients and spatial inhomogeneities characteristic of early galaxy evolution. Galaxies experiencing inhomogeneous enrichment are likely to develop steep negative metallicity gradients, although these gradients are often short-lived. This localized enrichment, paired with limited internal regulation, becomes a defining characteristic of early galaxy evolution – marking a sharp contrast with the more self-regulated and chemically homogenized systems seen at later cosmic times.
Based on these results, we propose the following evolutionary framework: in the reionization epoch, galaxies undergo bursty, localized star formation while the timescale for metal mixing remains relatively long, resulting in steep negative metallicity gradients. By cosmic noon, strong and continuous feedback processes drive efficient, large-scale metal mixing, which rapidly redistributes metals across galactic scales and often flattening, or inverting gradients. As galaxies further evolve into rotationally supported disks, the overall feedback efficiency declines, enabling the gradual accumulation of metals in the central regions and leading to the re-establishment and stabilization of steep negative gradients.
The good agreement between FIRE-2 simulations and current observational data suggests that these models provide valuable guidance in interpreting the physical processes shaping metallicity gradients in early galaxies. In particular, the results provide useful insights into how feedback, gas flows, and star formation may collectively influence the chemical structure of galaxies across cosmic time, though further observational confirmation will be essential to fully test these interpretations.
Appendix A Galaxy properties evolution
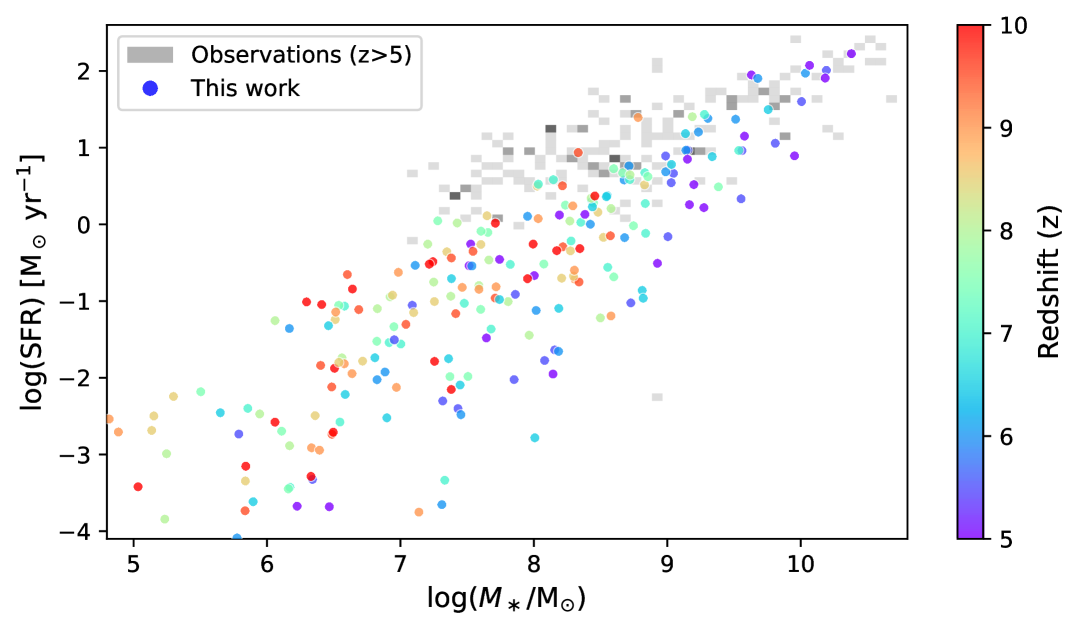
In this appendix, we investigate the relationship between SFR and stellar mass in Fig.9. We also show the observation results from Nakajima et al. (2023); Gottumukkala et al. (2024); Harikane et al. (2023); Sarkar et al. (2025); Scholtz et al. (2025); Hu et al. (2025). Our results are broadly consistent with observations, though some observed galaxies appear significantly more active than predicted by FIRE-2. This discrepancy is likely driven by upscatter effects: short-lived bursts of star formation can temporarily elevate the observed SFR (e.g. Sun et al., 2023; Shen et al., 2023; Kravtsov & Belokurov, 2024), whereas the SFR metric used in our analysis, based on a average, cannot capture such transient enhancements.
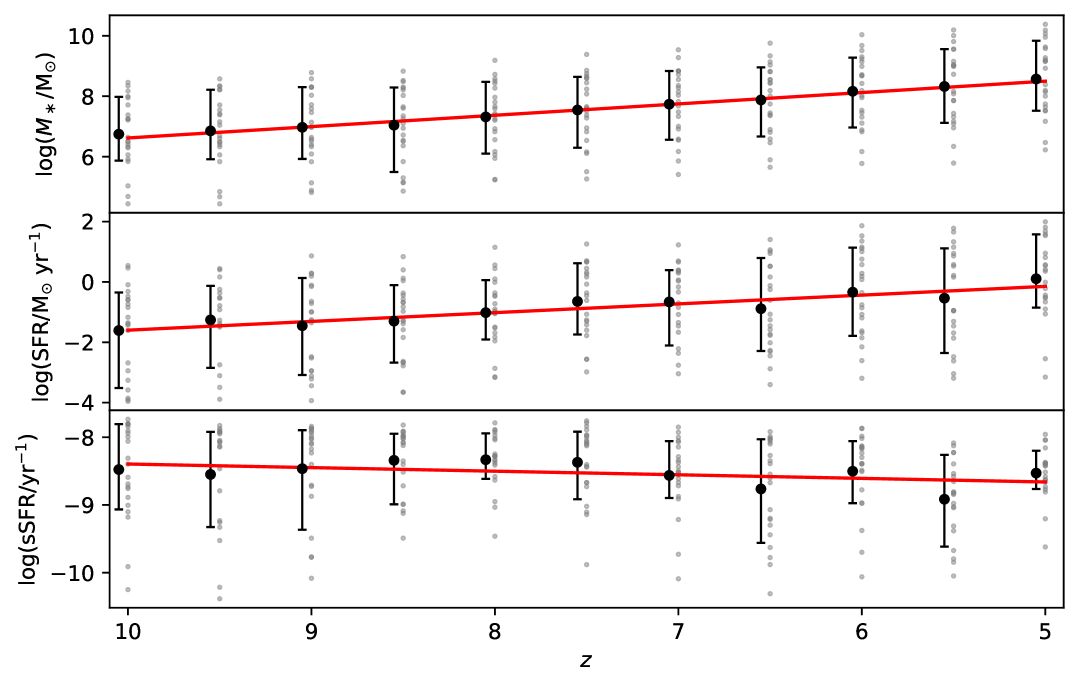
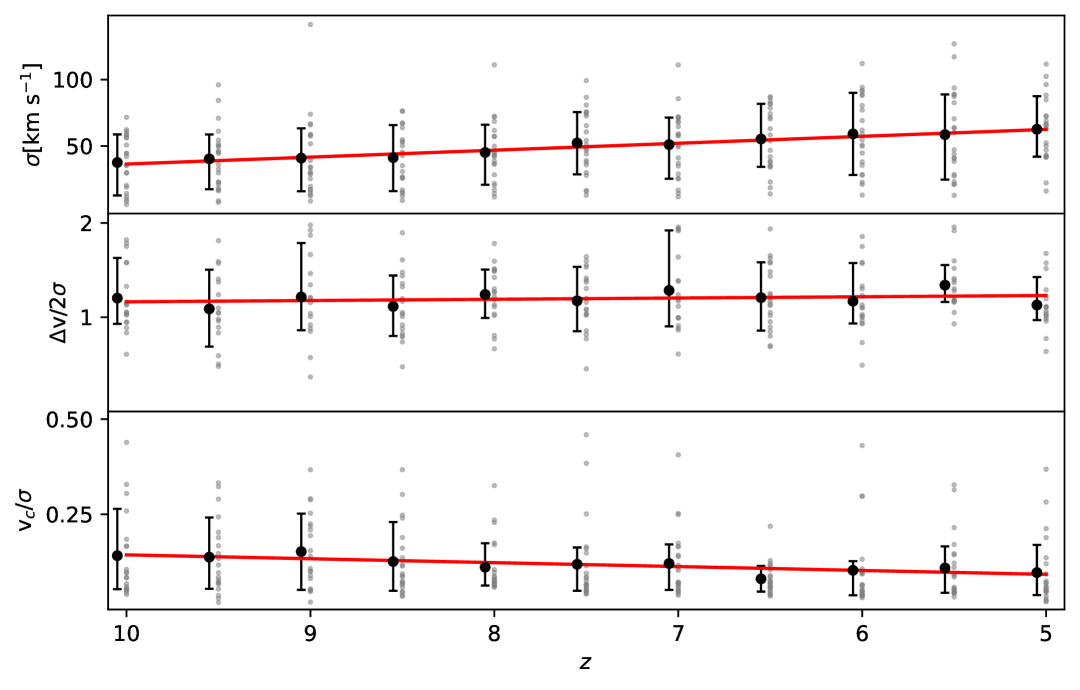
The redshift evolution of several key galaxy properties is presented in Fig. 11. Stellar mass increases significantly over time, reflecting the ongoing assembly of galaxies. The SFR also rises with decreasing redshift, but at a slower pace than the mass growth, resulting in a steady decline in sSFR. Velocity dispersion gradually increases with time, suggesting that while galaxies grow in size, they have not yet developed well-ordered structures. The rise in dispersion may be attributed to the larger gas reservoirs and more energetic feedback processes in more massive galaxies. Similarly, shows no significant evolution with redshift, implying that the value of this ratio is not strongly dependent on redshift but may be influenced by other factors, such as the number of gas particles sampled or the velocity of gas particles. Likewise, remains consistently low throughout the redshift range, indicating a persistent lack of rotational support in these dynamically unsettled high-redshift galaxies.
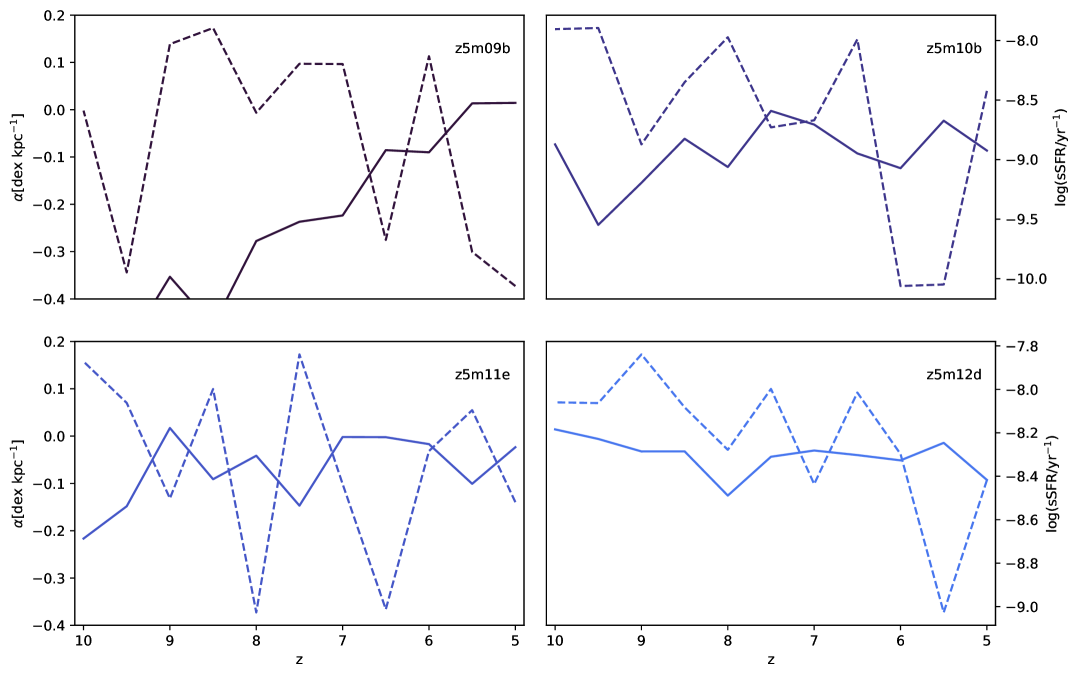
Appendix B The evolution of each galaxy
This appendix presents the evolution of four galaxies spanning a range of stellar masses in Fig. 10. Higher-mass systems exhibit weaker redshift evolution and overall flatter trends. Given the relatively short cosmic time span covered of these galaxies, the evolution of individual systems can show substantial fluctuations, which may be more apparent in some galaxies than in others, particularly in low-mass galaxies.
References
- Acharyya et al. (2024) Acharyya, A., Peeples, M. S., Tumlinson, J., et al. 2024, arXiv e-prints, arXiv:2404.06613, doi: 10.48550/arXiv.2404.06613
- Aguirre et al. (2005) Aguirre, A., Schaye, J., Hernquist, L., et al. 2005, ApJ, 620, L13, doi: 10.1086/428498
- Andalman et al. (2025) Andalman, Z. L., Teyssier, R., & Dekel, A. 2025, MNRAS, 540, 3350, doi: 10.1093/mnras/staf930
- Andrews & Martini (2013) Andrews, B. H., & Martini, P. 2013, ApJ, 765, 140, doi: 10.1088/0004-637X/765/2/140
- Arribas et al. (2024) Arribas, S., Perna, M., Rodríguez Del Pino, B., et al. 2024, A&A, 688, A146, doi: 10.1051/0004-6361/202348824
- Baker et al. (2025) Baker, W. M., Tacchella, S., Johnson, B. D., et al. 2025, Nature Astronomy, 9, 141, doi: 10.1038/s41550-024-02384-8
- Bassini et al. (2023) Bassini, L., Feldmann, R., Gensior, J., et al. 2023, MNRAS, 525, 5388, doi: 10.1093/mnras/stad2617
- Bellardini et al. (2022) Bellardini, M. A., Wetzel, A., Loebman, S. R., & Bailin, J. 2022, MNRAS, 514, 4270, doi: 10.1093/mnras/stac1637
- Bellardini et al. (2021) Bellardini, M. A., Wetzel, A., Loebman, S. R., et al. 2021, MNRAS, 505, 4586, doi: 10.1093/mnras/stab1606
- Bothwell et al. (2013) Bothwell, M. S., Maiolino, R., Kennicutt, R., et al. 2013, MNRAS, 433, 1425, doi: 10.1093/mnras/stt817
- Bouwens et al. (2004) Bouwens, R. J., Illingworth, G. D., Blakeslee, J. P., Broadhurst, T. J., & Franx, M. 2004, ApJ, 611, L1, doi: 10.1086/423786
- Carton et al. (2018) Carton, D., Brinchmann, J., Contini, T., et al. 2018, MNRAS, 478, 4293, doi: 10.1093/mnras/sty1343
- Chen et al. (2024) Chen, Y., Mo, H., & Wang, H. 2024, MNRAS, 532, 4340, doi: 10.1093/mnras/stae1757
- Chen et al. (2025) —. 2025, MNRAS, 540, 1235, doi: 10.1093/mnras/staf791
- Cortijo-Ferrero et al. (2017) Cortijo-Ferrero, C., González Delgado, R. M., Pérez, E., et al. 2017, A&A, 607, A70, doi: 10.1051/0004-6361/201731217
- Cresci et al. (2010) Cresci, G., Mannucci, F., Maiolino, R., et al. 2010, Nature, 467, 811, doi: 10.1038/nature09451
- Curti et al. (2024) Curti, M., Maiolino, R., Curtis-Lake, E., et al. 2024, A&A, 684, A75, doi: 10.1051/0004-6361/202346698
- Ellison et al. (2013) Ellison, S. L., Mendel, J. T., Patton, D. R., & Scudder, J. M. 2013, MNRAS, 435, 3627, doi: 10.1093/mnras/stt1562
- Erb et al. (2006) Erb, D. K., Shapley, A. E., Pettini, M., et al. 2006, ApJ, 644, 813, doi: 10.1086/503623
- Escala et al. (2018) Escala, I., Wetzel, A., Kirby, E. N., et al. 2018, MNRAS, 474, 2194, doi: 10.1093/mnras/stx2858
- Ferreira et al. (2022) Ferreira, L., Adams, N., Conselice, C. J., et al. 2022, ApJ, 938, L2, doi: 10.3847/2041-8213/ac947c
- Fitts et al. (2017) Fitts, A., Boylan-Kolchin, M., Elbert, O. D., et al. 2017, MNRAS, 471, 3547, doi: 10.1093/mnras/stx1757
- Gallazzi et al. (2005) Gallazzi, A., Charlot, S., Brinchmann, J., White, S. D. M., & Tremonti, C. A. 2005, MNRAS, 362, 41, doi: 10.1111/j.1365-2966.2005.09321.x
- Garcia et al. (2025) Garcia, A. M., Torrey, P., Bhagwat, A., et al. 2025, arXiv e-prints, arXiv:2503.03804, doi: 10.48550/arXiv.2503.03804
- Gibson et al. (2013) Gibson, B. K., Pilkington, K., Brook, C. B., Stinson, G. S., & Bailin, J. 2013, A&A, 554, A47, doi: 10.1051/0004-6361/201321239
- Girard et al. (2020) Girard, M., Mason, C. A., Fontana, A., et al. 2020, MNRAS, 497, 173, doi: 10.1093/mnras/staa1907
- Gottumukkala et al. (2024) Gottumukkala, R., Barrufet, L., Oesch, P. A., et al. 2024, MNRAS, 530, 966, doi: 10.1093/mnras/stae754
- Graf et al. (2024) Graf, R. L., Wetzel, A., Bailin, J., & Orr, M. E. 2024, arXiv e-prints, arXiv:2410.21377, doi: 10.48550/arXiv.2410.21377
- Graf et al. (2025) Graf, R. L., Wetzel, A., Bellardini, M. A., & Bailin, J. 2025, ApJ, 981, 47, doi: 10.3847/1538-4357/adacd7
- Harikane et al. (2023) Harikane, Y., Ouchi, M., Oguri, M., et al. 2023, ApJS, 265, 5, doi: 10.3847/1538-4365/acaaa9
- He et al. (2024a) He, X., Wang, X., Jones, T., et al. 2024a, ApJ, 960, L13, doi: 10.3847/2041-8213/ad12cd
- He et al. (2024b) He, Z., Chen, Z., Liu, G., et al. 2024b, Science China Physics, Mechanics, and Astronomy, 67, 129512, doi: 10.1007/s11433-024-2475-7
- Hemler et al. (2021) Hemler, Z. S., Torrey, P., Qi, J., et al. 2021, MNRAS, 506, 3024, doi: 10.1093/mnras/stab1803
- Hopkins (2015) Hopkins, P. F. 2015, MNRAS, 450, 53, doi: 10.1093/mnras/stv195
- Hopkins et al. (2013) Hopkins, P. F., Cox, T. J., Hernquist, L., et al. 2013, MNRAS, 430, 1901, doi: 10.1093/mnras/stt017
- Hopkins et al. (2018) Hopkins, P. F., Wetzel, A., Kereš, D., et al. 2018, MNRAS, 480, 800, doi: 10.1093/mnras/sty1690
- Hu et al. (2025) Hu, W., Papovich, C., Shen, L., et al. 2025, Nature Astronomy, doi: 10.1038/s41550-025-02636-1
- Jin et al. (2024) Jin, B., Ho, L. C., & Sun, W. 2024, arXiv e-prints, arXiv:2412.03455, doi: 10.48550/arXiv.2412.03455
- Jones et al. (2015) Jones, T., Wang, X., Schmidt, K. B., et al. 2015, AJ, 149, 107, doi: 10.1088/0004-6256/149/3/107
- Jones et al. (2010) Jones, T. A., Swinbank, A. M., Ellis, R. S., Richard, J., & Stark, D. P. 2010, MNRAS, 404, 1247, doi: 10.1111/j.1365-2966.2010.16378.x
- Ju et al. (2025) Ju, M., Wang, X., Jones, T., et al. 2025, ApJ, 978, L39, doi: 10.3847/2041-8213/ada150
- Kassin et al. (2012) Kassin, S. A., Weiner, B. J., Faber, S. M., et al. 2012, ApJ, 758, 106, doi: 10.1088/0004-637X/758/2/106
- King & Pounds (2015) King, A., & Pounds, K. 2015, ARA&A, 53, 115, doi: 10.1146/annurev-astro-082214-122316
- Kirby et al. (2013) Kirby, E. N., Cohen, J. G., Guhathakurta, P., et al. 2013, ApJ, 779, 102, doi: 10.1088/0004-637X/779/2/102
- Knollmann & Knebe (2009) Knollmann, S. R., & Knebe, A. 2009, ApJS, 182, 608, doi: 10.1088/0067-0049/182/2/608
- Kravtsov & Belokurov (2024) Kravtsov, A., & Belokurov, V. 2024, arXiv e-prints, arXiv:2405.04578, doi: 10.48550/arXiv.2405.04578
- Kroupa (2001) Kroupa, P. 2001, MNRAS, 322, 231, doi: 10.1046/j.1365-8711.2001.04022.x
- Lee et al. (2006) Lee, H., Skillman, E. D., Cannon, J. M., et al. 2006, ApJ, 647, 970, doi: 10.1086/505573
- Leethochawalit et al. (2016) Leethochawalit, N., Jones, T. A., Ellis, R. S., et al. 2016, ApJ, 820, 84, doi: 10.3847/0004-637X/820/2/84
- Leitherer et al. (1999) Leitherer, C., Schaerer, D., Goldader, J. D., et al. 1999, ApJS, 123, 3, doi: 10.1086/313233
- Li et al. (2025a) Li, S., Wang, X., Chen, Y., et al. 2025a, ApJ, 979, L13, doi: 10.3847/2041-8213/ad9eac
- Li et al. (2025b) Li, T., Zhang, H.-X., Lyu, W., et al. 2025b, A&A, 698, A208, doi: 10.1051/0004-6361/202452978
- Li et al. (2025c) Li, Z., Cai, Z., Wang, X., et al. 2025c, arXiv e-prints, arXiv:2506.12129, doi: 10.48550/arXiv.2506.12129
- Liang et al. (2025) Liang, J., Jiang, F., Mo, H., et al. 2025, MNRAS, 541, 2304, doi: 10.1093/mnras/staf947
- Luo et al. (2024) Luo, X., Wang, H., Cui, W., et al. 2024, ApJ, 966, 236, doi: 10.3847/1538-4357/ad392e
- Lyu et al. (2025) Lyu, C., Wang, E., Zhang, H., et al. 2025, ApJ, 981, L6, doi: 10.3847/2041-8213/adb4ed
- Ma et al. (2016) Ma, X., Hopkins, P. F., Faucher-Giguère, C.-A., et al. 2016, MNRAS, 456, 2140, doi: 10.1093/mnras/stv2659
- Ma et al. (2017) Ma, X., Hopkins, P. F., Feldmann, R., et al. 2017, MNRAS, 466, 4780, doi: 10.1093/mnras/stx034
- Ma et al. (2020) Ma, X., Quataert, E., Wetzel, A., et al. 2020, MNRAS, 498, 2001, doi: 10.1093/mnras/staa2404
- Ma et al. (2018a) Ma, X., Hopkins, P. F., Garrison-Kimmel, S., et al. 2018a, MNRAS, 478, 1694, doi: 10.1093/mnras/sty1024
- Ma et al. (2018b) Ma, X., Hopkins, P. F., Boylan-Kolchin, M., et al. 2018b, MNRAS, 477, 219, doi: 10.1093/mnras/sty684
- Ma et al. (2019) Ma, X., Hayward, C. C., Casey, C. M., et al. 2019, MNRAS, 487, 1844, doi: 10.1093/mnras/stz1324
- Maiolino & Mannucci (2019) Maiolino, R., & Mannucci, F. 2019, A&A Rev., 27, 3, doi: 10.1007/s00159-018-0112-2
- Maiolino et al. (2008) Maiolino, R., Nagao, T., Grazian, A., et al. 2008, A&A, 488, 463, doi: 10.1051/0004-6361:200809678
- Mannucci et al. (2010) Mannucci, F., Cresci, G., Maiolino, R., Marconi, A., & Gnerucci, A. 2010, MNRAS, 408, 2115, doi: 10.1111/j.1365-2966.2010.17291.x
- Marszewski et al. (2025) Marszewski, A., Faucher-Giguère, C.-A., Feldmann, R., & Sun, G. 2025, arXiv e-prints, arXiv:2505.22712, doi: 10.48550/arXiv.2505.22712
- Marszewski et al. (2024) Marszewski, A., Sun, G., Faucher-Giguère, C.-A., Hayward, C. C., & Feldmann, R. 2024, ApJ, 967, L41, doi: 10.3847/2041-8213/ad4cee
- Mo et al. (2024) Mo, H., Chen, Y., & Wang, H. 2024, MNRAS, 532, 3808, doi: 10.1093/mnras/stae1727
- Mo et al. (2010) Mo, H., van den Bosch, F. C., & White, S. 2010, Galaxy Formation and Evolution, doi: 10.1017/CBO9780511807244
- Nakajima et al. (2023) Nakajima, K., Ouchi, M., Isobe, Y., et al. 2023, ApJS, 269, 33, doi: 10.3847/1538-4365/acd556
- Nakajima et al. (2024) —. 2024, arXiv e-prints, arXiv:2412.04541, doi: 10.48550/arXiv.2412.04541
- Nomoto et al. (2013) Nomoto, K., Kobayashi, C., & Tominaga, N. 2013, ARA&A, 51, 457, doi: 10.1146/annurev-astro-082812-140956
- Orr et al. (2017) Orr, M. E., Hayward, C. C., Nelson, E. J., et al. 2017, ApJ, 849, L2, doi: 10.3847/2041-8213/aa8f93
- Orr et al. (2018) Orr, M. E., Hayward, C. C., Hopkins, P. F., et al. 2018, MNRAS, 478, 3653, doi: 10.1093/mnras/sty1241
- Orr et al. (2023) Orr, M. E., Burkhart, B., Wetzel, A., et al. 2023, MNRAS, 521, 3708, doi: 10.1093/mnras/stad676
- Peng et al. (2025) Peng, Y.-C., Wang, J.-M., Zhao, Y., & Ho, L. C. 2025, ApJ, 980, 22, doi: 10.3847/1538-4357/ada275
- Porter et al. (2022) Porter, L. E., Orr, M. E., Burkhart, B., et al. 2022, MNRAS, 515, 3555, doi: 10.1093/mnras/stac1958
- Sanders et al. (2015) Sanders, R. L., Shapley, A. E., Kriek, M., et al. 2015, ApJ, 799, 138, doi: 10.1088/0004-637X/799/2/138
- Sanders et al. (2021) Sanders, R. L., Shapley, A. E., Jones, T., et al. 2021, ApJ, 914, 19, doi: 10.3847/1538-4357/abf4c1
- Sarkar et al. (2025) Sarkar, A., Chakraborty, P., Vogelsberger, M., et al. 2025, ApJ, 978, 136, doi: 10.3847/1538-4357/ad8f32
- Scholtz et al. (2025) Scholtz, J., Maiolino, R., D’Eugenio, F., et al. 2025, A&A, 697, A175, doi: 10.1051/0004-6361/202348804
- Searle (1971) Searle, L. 1971, ApJ, 168, 327, doi: 10.1086/151090
- Semenov (2024) Semenov, V. A. 2024, arXiv e-prints, arXiv:2410.23339, doi: 10.48550/arXiv.2410.23339
- Semenov et al. (2017) Semenov, V. A., Kravtsov, A. V., & Gnedin, N. Y. 2017, ApJ, 845, 133, doi: 10.3847/1538-4357/aa8096
- Shen et al. (2023) Shen, X., Vogelsberger, M., Boylan-Kolchin, M., Tacchella, S., & Kannan, R. 2023, MNRAS, 525, 3254, doi: 10.1093/mnras/stad2508
- Sillero et al. (2017) Sillero, E., Tissera, P. B., Lambas, D. G., & Michel-Dansac, L. 2017, MNRAS, 472, 4404, doi: 10.1093/mnras/stx2265
- Stott et al. (2014) Stott, J. P., Sobral, D., Swinbank, A. M., et al. 2014, MNRAS, 443, 2695, doi: 10.1093/mnras/stu1343
- Sun et al. (2023) Sun, G., Faucher-Giguère, C.-A., Hayward, C. C., et al. 2023, ApJ, 955, L35, doi: 10.3847/2041-8213/acf85a
- Sun et al. (2024) Sun, W., Ho, L. C., Zhuang, M.-Y., et al. 2024, ApJ, 960, 104, doi: 10.3847/1538-4357/acf1f6
- Sun et al. (2025) Sun, X., Wang, X., Ma, X., et al. 2025, ApJ, 986, 179, doi: 10.3847/1538-4357/addab5
- Swinbank et al. (2012) Swinbank, A. M., Sobral, D., Smail, I., et al. 2012, MNRAS, 426, 935, doi: 10.1111/j.1365-2966.2012.21774.x
- Thielemann et al. (2017) Thielemann, F. K., Eichler, M., Panov, I. V., & Wehmeyer, B. 2017, Annual Review of Nuclear and Particle Science, 67, 253, doi: 10.1146/annurev-nucl-101916-123246
- Tissera et al. (2022) Tissera, P. B., Rosas-Guevara, Y., Sillero, E., et al. 2022, MNRAS, 511, 1667, doi: 10.1093/mnras/stab3644
- Tremonti et al. (2004) Tremonti, C. A., Heckman, T. M., Kauffmann, G., et al. 2004, ApJ, 613, 898, doi: 10.1086/423264
- Tripodi et al. (2024) Tripodi, R., D’Eugenio, F., Maiolino, R., et al. 2024, arXiv e-prints, arXiv:2403.08431, doi: 10.48550/arXiv.2403.08431
- Vallini et al. (2024) Vallini, L., Witstok, J., Sommovigo, L., et al. 2024, MNRAS, 527, 10, doi: 10.1093/mnras/stad3150
- van Zee et al. (1998) van Zee, L., Salzer, J. J., Haynes, M. P., O’Donoghue, A. A., & Balonek, T. J. 1998, AJ, 116, 2805, doi: 10.1086/300647
- Venturi et al. (2024) Venturi, G., Carniani, S., Parlanti, E., et al. 2024, arXiv e-prints, arXiv:2403.03977, doi: 10.48550/arXiv.2403.03977
- Wang et al. (2023) Wang, K., Wang, X., & Chen, Y. 2023, ApJ, 951, 66, doi: 10.3847/1538-4357/acd633
- Wang et al. (2017) Wang, X., Jones, T. A., Treu, T., et al. 2017, ApJ, 837, 89, doi: 10.3847/1538-4357/aa603c
- Wang et al. (2019) —. 2019, ApJ, 882, 94, doi: 10.3847/1538-4357/ab3861
- Wang et al. (2020) —. 2020, ApJ, 900, 183, doi: 10.3847/1538-4357/abacce
- Wang et al. (2022) Wang, X., Jones, T., Vulcani, B., et al. 2022, ApJ, 938, L16, doi: 10.3847/2041-8213/ac959e
- Wetzel et al. (2023) Wetzel, A., Hayward, C. C., Sanderson, R. E., et al. 2023, ApJS, 265, 44, doi: 10.3847/1538-4365/acb99a
- Wiersma et al. (2009) Wiersma, R. P. C., Schaye, J., & Smith, B. D. 2009, MNRAS, 393, 99, doi: 10.1111/j.1365-2966.2008.14191.x
- Wuyts et al. (2016) Wuyts, E., Wisnioski, E., Fossati, M., et al. 2016, ApJ, 827, 74, doi: 10.3847/0004-637X/827/1/74
- Yuan et al. (2011) Yuan, T. T., Kewley, L. J., Swinbank, A. M., Richard, J., & Livermore, R. C. 2011, ApJ, 732, L14, doi: 10.1088/2041-8205/732/1/L14
- Zahid et al. (2012) Zahid, H. J., Bresolin, F., Kewley, L. J., Coil, A. L., & Davé, R. 2012, ApJ, 750, 120, doi: 10.1088/0004-637X/750/2/120
- Zaritsky et al. (1994) Zaritsky, D., Kennicutt, Robert C., J., & Huchra, J. P. 1994, ApJ, 420, 87, doi: 10.1086/173544