A Giant Peanut-shaped Ultra-High-Energy Gamma-Ray Emitter Off the Galactic Plane
Abstract
Ultra-high-energy (UHE), exceeding 100 TeV ( electronvolts), -rays manifests extreme particle acceleration in astrophysical sources [1, 2]. Recent observations by -ray telescopes, particularly by the Large High Altitude Air Shower Observatory (LHAASO), have revealed a few tens of UHE sources, indicating numerous Galactic sources capable of accelerating particles to PeV ( electronvolts) energies[3, 4]. However, discerning the dominant acceleration mechanisms (leptonic versus hadronic), the relative contributions of specific source classes, and the role of particle transport in shaping their observed emission are central goals of modern UHE astrophysics. Here we report the discovery of a giant UHE -ray emitter at -17.5∘ off the Galactic plane a region where UHE -ray sources are rarely found. The emitter exhibits a distinctive asymmetric shape, resembling a giant “Peanut” spanning , indicative of anisotropic particle distribution over a large area. A highly aged millisecond pulsar (MSP) J0218+4232 is the sole candidate accelerator positionally coincident with the Peanut region. Its association with UHE -rays extending to 0.7 PeV, if confirmed, would provide the first evidence of a millisecond pulsar powering PeV particles. Such a finding challenges prevailing models, which posit that millisecond pulsars cannot sustain acceleration to PeV energies. The detection reveals fundamental gaps in understanding particle acceleration, cosmic-ray transport, and interstellar magnetic field effects, potentially revealing new PeV accelerator (PeVatron) classes.
The LHAASO Collaboration111A list of authors and affiliations appears at the end of the paper.”
By January 31, 2024, LHAASO had accumulated 1384 days of exposure, discovering a very unique giant region emitting UHE -rays at high Galactic latitude, , in the range of Galactic longitude between and . As the TeV -ray sky at such high latitude is quite sparse[5] and there is no preferred direction as in the Galactic plane, the concentration of these UHE -rays in this particular region indicating a strong association among them, with a chance probability 10-7 (refer to Supplementary Section 9) of several independent sources. Following separation, spectral analysis was performed on each component, indicating that the -ray flux intensities remain consistent across all divided portions (refer to Supplementary Section 3). Even more unusually, these -ray emissions exhibit highly consistent spatial alignment, as if arranged in formation. These results establish this region as a unprecedented discovery in UHE -ray all-sky observations.
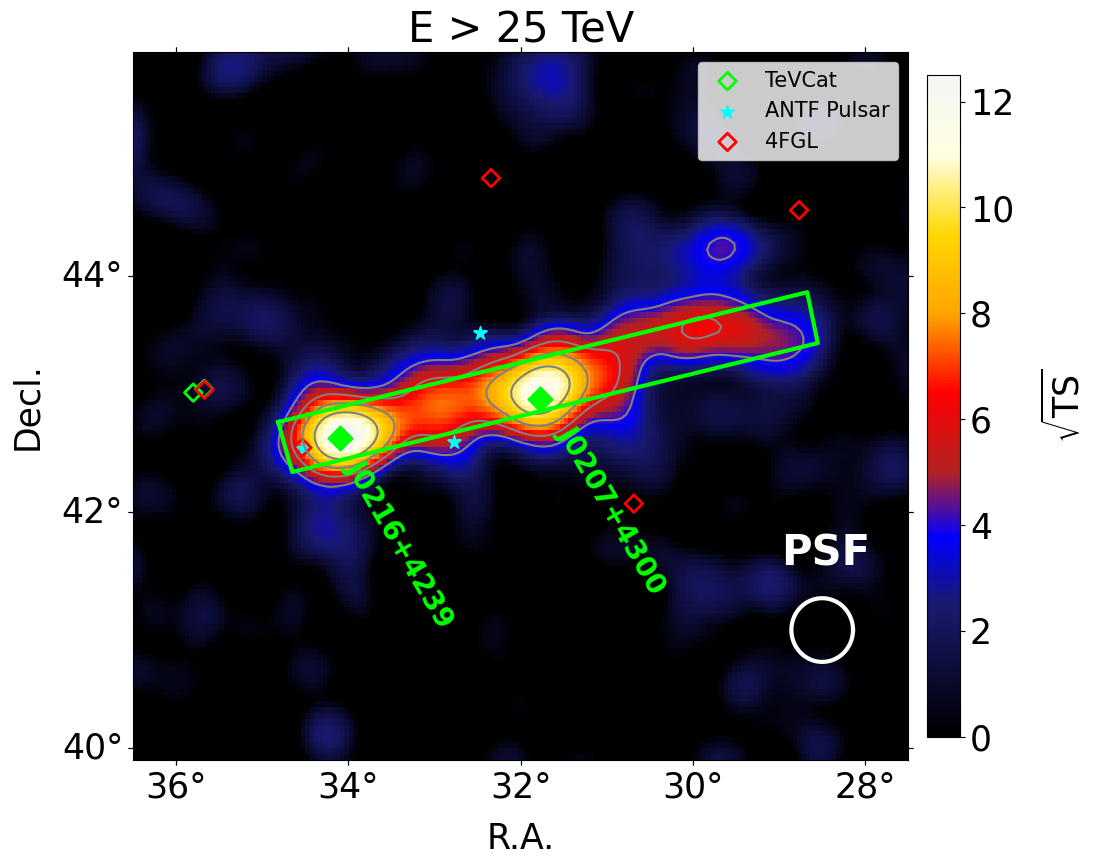
The sky maps covering the entire region for energies ranging from 25 TeV to 100 TeV, as well as above 100 TeV, are shown in Figure 1. Asymmetrically-extended -ray emissions, resembling a giant “Peanut”, are detected referring to the event excess significance. The Peanut morphology can be well described as a combination of a strip structure (modeled by a rectangular shape) and two hot spots (modeled by two point-like components, i.e. J0216+4239 and J0207+4300 for brevity), as marked in Figure 1 (refer to Supplementary Section 3). The projected -ray event profiles along the right ascension (R.A.) clearly show two peaks superposed on top of the strip. The strip has an orientation angle of north of west, a length of 4.600.44∘, and a width of 0.450.12∘, which is roughly parallel to the Galactic plane as compared with the Galactic latitude line in Figure 1. In both energy bands, the Peanut morphology is similar, and no significant variation in the spatial distribution of photons with energy is detected.
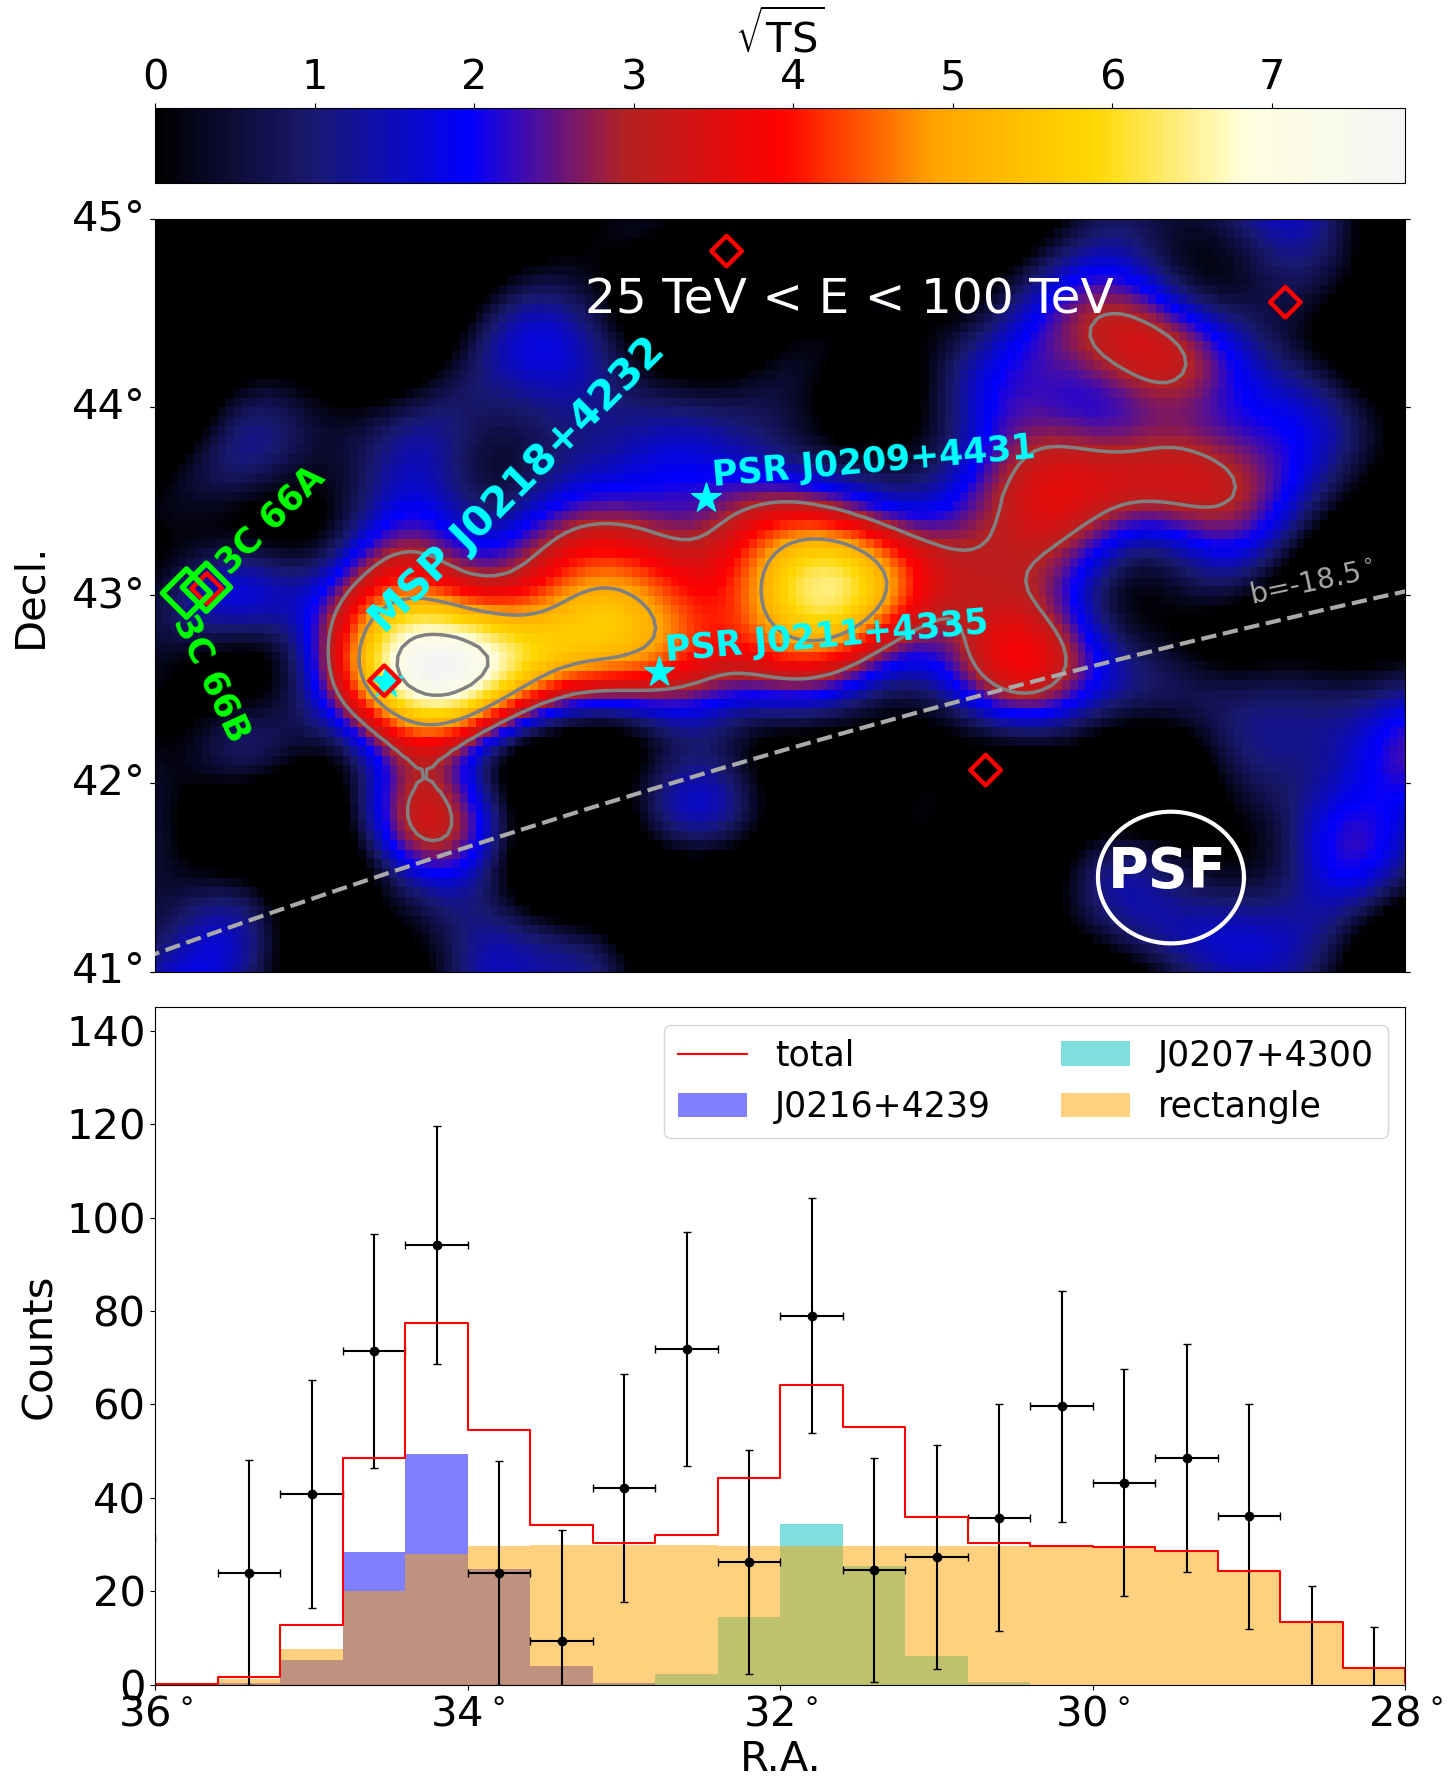

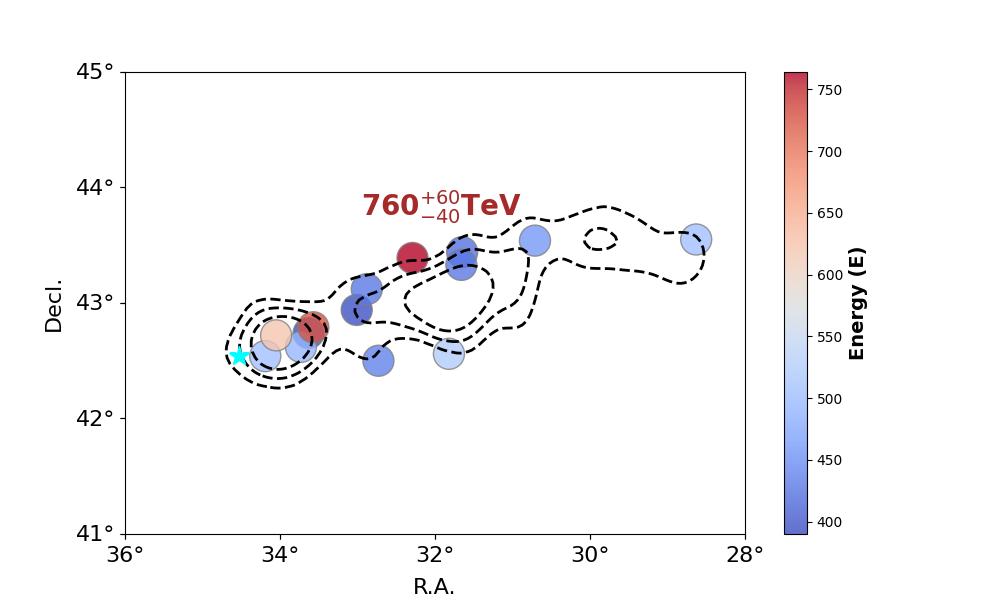
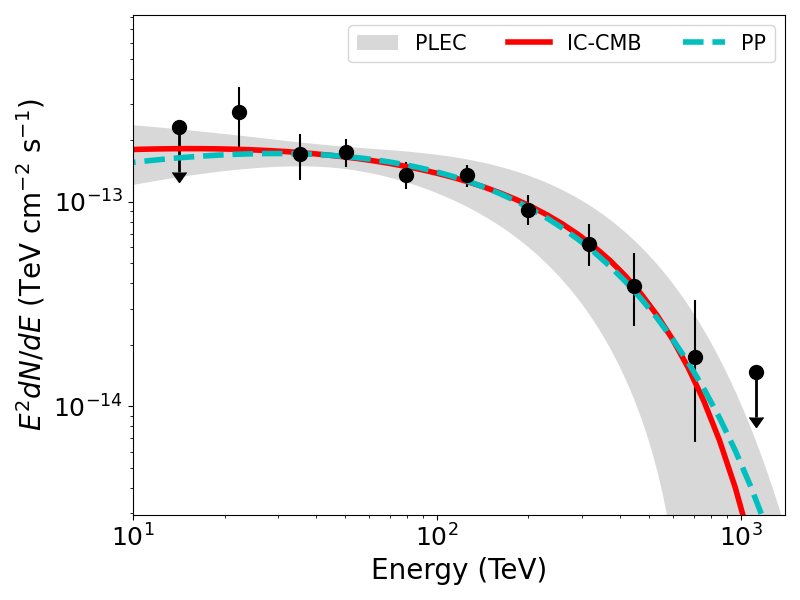
To concisely display their spatial distribution, we highlight representative 400 TeV photons distributed across the entire Peanut region (Figure 2). The highest-energy event reaches 760 TeV so far located well within Peanut (refer to Supplementary Section 6). Based on the spatial model of one strip plus two hot spots, the -ray emission yields a statistical significance of 16.0(100 TeV) and 9.7 (25–100 TeV), with the Peanut being more prominent in the energy range exceeding 100 TeV. Figure 3 shows the photon spectrum of the entire region, where the cyan dashed line represents the spectrum derived from the proton-proton (PP) interactions, and the red solid line represents the spectrum from the e± Inverse Compton (IC) scattering of cosmic microwave background (CMB) photons. The -ray energy spectrum from 10 TeV to 1 PeV can be better fitted by a power-law with an exponential cutoff (PLEC) function as compared to a single power-law function at confidence level (refer to Supplementary Section 4), implying an index and high-energy cutoff of TeV. By performing individual flux fitting using the obtained spectral index and cut-off energy, we found that these three components have distinct radiation intensities: as shown in Table 1, the strip dominates the observed -ray flux, contributing 70% of the total emission.
| Length | Width | Orientation Angle | ||||||||
|---|---|---|---|---|---|---|---|---|---|---|
| TeV | deg | deg | deg | deg | deg | deg | ||||
| the strip | 5.820.56 | 1.950.19 | 25082 | 31.70 | 43.14 | 0.11 | 4.600.44 | 0.450.12 | 13.81.2 | |
| J0216+4239 | 1.050.23 | - | - | 34.10 | 42.63 | 0.09 | - | - | - | |
| J0207+4300 | 1.200.24 | - | - | 31.77 | 42.96 | 0.12 | - | - | - |
The UHE -rays are generally produced through leptonic or hadonic mechanisms. The observed asymmetric strip morphology in UHE -ray emission provides clear evidence of anisotropic leptonic or hadronic particle distribution. In the leptonic scenario, UHE electrons undergo IC scattering with soft background photons, predominantly from the CMB. Given the isotropic nature of the CMB photon field, any observed structure in UHE -ray emission must trace the spatial distribution of the parent electron population. Alternatively, in the hadronic scenario, -rays are produced via interactions between ultra-relativistic protons and interstellar gas. The observed -ray morphology directly constrains the spatial distribution of both the target gas density and the parent proton population. Our additional interstellar gas analyses reveal no detectable compact molecular clouds, but instead a diffuse and approximately uniform atomic hydrogen within the Peanut region(see Supplementary Section 8). These findings suggest that the Peanut feature likely originates from the spatial distribution of ultra-relativistic particles, even within a hadronic framework.
UHE -rays are linked to extreme astrophysical accelerators in our Galaxy, such as supernova remnants (SNRs),pulsar wind nebulae(PWNe), Young Massive Star clusters(YMSCs), pulsars, and black holes. We cross-matched LHAASO observations with the SNR/PWN catalog (SNRCat[7]),the Fourth Fermi-LAT Catalog (4FGL)[8], TeVCat[5], ATNF pulsars catalog[9], several X-ray binary catalogs, and the counterparts listed in SIMBAD (refer to Supplementary Section 7). No SNRs/PWNe and YMSCs are identified near the Peanut region. These catalogs reveal no confirmed black hole candidates in the surveyed area. Both neighboring TeV emitters (3C66A/B) are extragalactic sources, precluding any physical connection. Two PSRs (PSR J0211+4235 and J0209+4331; 2-2.5 kpc) are spatially adjacent to Peanut, but the spin-down energies () are insufficient to drive the -ray emission of Peanut. One energetic millisecond pulsar (MSP) J0218+4232, with the chance coincident probability 10-4 (refer to Supplementary Section 9), emerges as the sole candidate accelerator positionally coincident with the Peanut. This association is partly supported by the recent identification of a UHE source with the tail of a bow-shock pulsar wind nebula[10], as well as the theoretical work[11] showing that asymmetric diffusion of cosmic rays around powerful pulsars can naturally produce both spatially offset -ray emission and morphological distortion.
Radio data analysis showed that MSP J0218+4232 orbits a helium-core white dwarf companion every days with a short spin period of [12, 13]. For the parallax, an estimated value of the distance is kpc leading to a transverse velocity of 98 kms based on the proper motion[14].
With a spin-down rate of , it appears that MSP J0218+4232 has a significant spin-down age of [15]. Additionally, it has a low surface magnetic field of about four orders of magnitude lower than most pulsars[16]. Yet, despite this, the magnetic field at the light cylinder is strong, , which is only slightly weaker than young Crab-like pulsars[17].
Adopting the distance of MSP J0218+4232 kilo-parsecs (kpc) from the Earth [14], the total luminosity of all detected -rays above 10 TeV from Peanut is estimated as , where is differential energy flux. MSP J0218+4232, with a spin-down power[12, 18, 15, 19, 20] of erg s-1, can supply the required energy if the efficiency of the conversion of the pulsar rotation losses to UHE particles is larger than 0.4% (). The -ray luminosity detected with LHAASO requires the total energy of emitting electrons or protons of erg or erg (see in Figure 3). The formation of the proton population by MSP J0218+4232 are challenged and thus we don’t take account more(see Supplementary Section 10). The time required for the formation of the population by MSP J0218+4232 is estimated as kyr, for the fiducial value of . The angular distance covered by the pulsar during the characteristic formation time of Peanut is . Thus, particle transport plays the dominant role for the formation of Peanut.
Middle-aged pulsars, upon entering the interstellar medium (ISM), can generate TeV halos caused by IC scattering of background photons[21, 22]. Considering a compatible pulsar halo model to MSP J0218+4232, though the off-center position of the pulsar relative to the Peanut structure remains a primary challenge for all pulsar-related interpretations, the morphology of Peanut implies a highly anisotropic propagation of particles. The length and width of the strip component can be estimated as and , respectively. The age of the structure, kyr, defines the efficiency of the transport mechanism. For these time and length scales, the dominant transport mechanism is diffusion, thus the source size is determined by the diffusion coefficient, . The diffusion coefficient in transverse direction is , indicating the anisotropic diffusion propagation of CR particles in the ISM. The faster diffusion coefficient can be estimated as , and the LHAASO data constrain the diffusion for – PeV electrons (refer to Supplementary Section 11). This estimation is compatible with those for the Galactic diffusion derived from cosmic ray secondaries[23]. It is worth noting that the perpendicular diffusion is roughly consistent with the estimates based on the extension of the -ray halo around Geminga pulsar[21].
The asymmetric structure in Peanut is clearly distinct from known TeV halos which usually exhibit nearly symmetric morphology and a nearby slow-diffusing region.
In contrast to the typical morphology of TeV halos, the observations in the X-ray band show that the formation of one-sided very extended structures is a rather common phenomenon seen around a number of middle-aged pulsars, manifesting as X-ray “pulsar filament” or “misaligned outflow”[24, 25, 26, 27]. Both the X-ray outflows and the Peanut share the characteristic of being misaligned with their pulsar’s proper motion; however, they exhibit a dramatic difference in physical size. Unlike typical pulsars within the Galactic plane, the Peanut resides well outside it, where the weaker magnetic fields permit a greater spatial extension of the emission. Indeed, the synchrotron cooling time of PeV electron in magnetic field is kyr, thus the extension of Peanut implies that the magnetic field in this regions doesn’t exceed , which is a consistent with the model expectation of the magnetic field strength in Galactic halo. The existence of anisotropic -ray sources was predicted from anisotropic diffusion models[28, 29]. And the related simulation[11] show that the “mirage” source, similar to two hotspots in Peanut, could potentially be attributed to the influence of the local large-scale magnetic field. Nevertheless, the -ray structure identified in this study may provide insights into the potential enhancements in emission consistent with those expected from large-scale magnetic fields or anisotropic turbulence in the ISM for this particular region.[30][16].
While the interpretation of MSP J0218+4232 as a leptonic PeVatron provides a possible origin for the Peanut’s emission, this scenario challenges conventional paradigms of particle acceleration in pulsars[31]. Pulsar rotation induces electric charge on its surface and this charge creates a gap of electric potential. The voltage of this gap, , is typically considered a limiting parameter that determines the maximum attainable energy for particles accelerated by pulsars[32]. For MSP J0218+4232, this upper limit yields 1 PeV. To generate rays with 760 TeV through IC scattering of CMB photons, the highest approximate of efficiency are required. Given the challenges from typical acceleration mechanism, the definitive origin of the Peanut’s emission remains uncertain and highlights the need for further investigation.
Alternative scenarios involving unidentified leptonic or hadronic accelerators-such as a central pulsar or microquasar—remain plausible. The detection of misaligned pulsars has been predicted and expected since the identification of the TeV halos around Geminga and Monogem[33, 34, 35] this observed Peanut complex region potentially proposes a putative, non-aligned, middle-aged pulsar near the center. This hypothesis provides a natural explanation for the location of the highest-energy photon (760TeV) close to the center, which suggests a powerful particle acceleration and injection site at that position. Additionally, Jet-ISM interactions that could produce such asymmetric UHE -ray source, as evidenced by microquasars like V4641 Sgr, in which the asymmetric UHE rays are significantly detected[36, 37]. The highest-energy photons observed from V4641 Sgr exhibit comparable energies to those detected in the Peanut structure.
Further multiwavelength observations are needed to fully constrain the origin and acceleration mechanisms of Peanut formation, including searches for X-ray, radio, and TeV counterparts across the extended region, are imperative to either confirm the MSP’s role or uncover a hidden PeVatron. Either way, this Peanut system may redefine the energetics of recycled pulsars or reveal a new class of extreme Galactic accelerators. Furthermore, advances in particle transport modeling and theoretical frameworks for MSP acceleration mechanisms are essential to elucidate the production of such extreme energies and the Peanut’s distinctive morphology.
Supplementary Material
1 Instrument and Data
Within LHAASO, the KM2A is the largest sub-array, covering an area of 1.36 km2 and composed of 5195 electromagnetic detectors (EDs) and 1188 muon detectors (MDs). Each ED contains four plastic scintillation tiles, embedded fibers, and a 1.5-inch photomultiplier tube (PMT), and is covered by a 5-mm-thick lead plate to absorb low-energy charged particles and convert -rays into electron-positron pairs. The signals from the EDs are used to reconstruct the energy and arrival direction of the primary particles. This makes the KM2A a UHE -ray telescope with an energy resolution better than 20% and an angular resolution of approximately at 100 TeV[38].
Each MD is a water Cherenkov detector housed in a cylindrical concrete tank with an inner radius of 3.4 meters and a height of 1.2 meters. An 8-inch PMT is located at the top center of the tank. The entire MD is covered by a steel lid and buried under 2.5 meters of soil to absorb secondary electrons, positrons, and -rays from the air showers. By analyzing the ratio between the number of muons detected by the MDs and the number of electromagnetic particles detected by the EDs, we can effectively veto hadronic particles, which produce extensive air showers rich in secondary muons[38]. This technique allows for the exclusion of more than 99.99% of cosmic-rays at energies above 100 TeV. Consequently, the KM2A has the world’s best sensitivity for -ray observation at energies above 100 TeV.
The KM2A detectors were constructed and operated in stages. From 27 December 2019 to 30 November 2020, half-KM2A with 2365 EDs and 578 MDs operated for approximately 300 days. From November 30 2020 to July 19 2021, three-quarters KM2A with 3978 EDs and 917 MDs operated for roughly 216 days. The full KM2A was completed on July 20 2021. Since then, data collection has been ongoing with a duty cycle of over 98% up to the present day. The long-term stability of the data performance has been thoroughly checked and monitored[39]. Only the data survive the data quality control system[39] are used for further analysis. This work uses 1384 days observation of KM2A from 27 December 2019 to 31 January 2024.
We use the same data criteria as those in a previous work [38], including the reconstruction of the direction and energy of primary particles, /hadron discrimination parameter, detector response simulation, etc. We selected -like events with energies from 10 TeV to 1 PeV in a region of interest (ROI) centered at and . All -like events are stored in spatial pixels of according to their reconstructed direction, forming the full event map. The number of backgrounds dominated by residual cosmic-rays(CRs) is estimated using the direct integration (DI) method with a integration time of 10 hours[40]. Due to the low expected -ray flux in high galactic latitude above , the Galactic diffusion emission (GDE) background is ignored in this analysis [41].
2 Maximum Likelihood Analysis
In this work, we adopted a maximum likelihood estimation method to determine both of the statistical significance and flux of -ray signals detected by LHAASO-KM2A. For these two purposes we need to build a source model, characterised by combining a spatial and spectral model. The initial spectrum is given by a simple power law
| (S1) |
where is the flux normalization, is the pivot energy, and is the spectral index.
In each pixel () of each energy bin (), observed event number follows a Poisson distribution:
| (S2) |
where is the observed -ray event number, is the observed background plus the expected -ray event number given a source model convolved with the detector response from the detector simulation. The source model with both spectral and spatial information is:
| (S3) |
where is the estimated background from the DI method, is the total predicted excess -ray event number, is the spatial morphology convolved with the point spread function (PSF). In this work, two spatial models (point-like and rectangle) were employed to fit the entire Peanut.
The log likelihood, given a parameter set in the source model, is the sum of the log likelihood:
| (S4) |
To maximize the log likelihood by varying the parameter set in the source model, we can thus find the most likely source model for a given observation. The parameter set includes the spectrum index, source position, source spatial geometric parameters.
For the purpose of getting the significance and spectrum behavior of the source, we adopted the Wilks’ theorem [6] by doing a test statistic calculation with the hypothesis testing. The null hypotheses () is background only, and the alternative hypotheses with a source model plus the background. The ratio of these two maximum likelihood defines the test statistic (TS):
| (S5) |
Based on Wilks’ theorem, the TS follows a distribution for sufficient statistics, where is the degree of freedom (dof) which equals to the difference on the number of free parameters between two nested models.
The significance map of the Peanut region, as shown in Fig.1, is made by moving a putative point-like source through each pixel, performing a maximum likelihood fit on flux normalization with spectral index fixed at 2.7. The TS value can be converted to the significance according to Wilks’ theorem by doing a square root (). We performed the maximum likelihood fitting in two combined energy ranges: to and above . The only free parameter in the likelihood fit is the for a given point-like source model.
3 Morphology analyses
We investigated the spatial shape of the Peanut using a forward-fitting approach and tested various geometrical models with events above 25 TeV. The -ray morphology was characterized using a dataset restricted to energies above 25 TeV to take advantage of the better angular resolution (the 68% containment radius is smaller than at these energies). In this analysis, we adopted the assumption that the source structure does not change with energy.
We conducted a baseline analysis using a multi-Gaussian model, following a procedure similar to that in our previous LHAASO catalog work [3]. We began with a single Gaussian component in our region of interest (ROI) and iteratively added more components, refitting all parameters simultaneously until no significant residuals remained. The significance of each added source was determined using Equation S5. A source was considered statistically significant if its TS value was greater than 27 (corresponding to for 5 degrees of freedom) in this work. This process led to the detection of four components, designated J0201+4330, J0207+4300, J0211+4255, and J0216+4239. Among these, J0207+4300, J0211+4255, and J0216+4239 correspond to three sources listed in the first LHAASO catalog, namely 1LHAASO J0206+4302u, 1LHAASO J0212+4254u, and 1LHAASO J0216+4237u, respectively. The component J0201+4330 was newly discovered in this study. The fitting results are listed in Table S1. The results listed in Table S1 indicate that these four sources exhibit similar spectral indices. This consistency may suggest a potential connection among them; therefore, we consider the spectral similarity as a tentative hint of a physical link.
The TS value of each component is assessed by considering the null hypothesis of CR background plus the presence of the other components whose parameters are re-fitted to calculate the likelihood value of the null hypothesis. TSext is the estimated TS value for the fitting with extended morphology. TS TSext deg deg deg deg deg deg J0216+4238 1.770.21 2.680.15 34.08 42.64 139.15 -17.55 0.06 0.11 58.1 0.1 J0211+4255 1.640.26 2.570.17 32.87 42.91 138.17 -17.58 0.14 0.260.05 61.5 16.1 J0207+4300 1.510.21 2.660.16 31.72 43.04 137.29 -17.72 0.09 0.19 36.7 4.9 J0201+4330 3.000.41 2.600.14 30.07 43.50 135.94 -17.63 0.27 0.550.06 74.7 35.6
The significance maps and similar spectral behavior suggest the presence of a diffuse component along the four Gaussian components. We used a rectangular template with 5 parameters (position, length, width, and orientation) to represent this strip-like diffuse component. Starting with this strip component, we successively added the Gaussian/point-like components listed in Table S1, refitting both the spectral and spatial parameters simultaneously. As indicated in Table S2, the addition of the strip diffuse component to the baseline model of four Gaussian components resulted in a significant improvement, with a significance level of 4.5 (TS - TS = 37.8, dof=7). This confirms a significant detection of the diffuse component in the Peanut region. When including the strip diffuse component, two point-like components (J0216+4238 and J0207+4300) remain significant above (TS - TS = 27 and TS - TS = 29, 4 dof). However, the components J0210+4330 and J0211+4255 become non-significant, with their significance falling below 3 (TS - TS = 4.6 and TS - TS = 16.8, 5 dof). Therefore, we conclude that a model consisting of a strip diffuse component and two Gaussian components (MD4) provides the best spatial description of the Peanut region. We also evaluated the AIC values of these models. The comparison between MD4 and MD1 reveals 22.4, strongly favoring MD4. Although MD3 exhibits the minimal AIC value, the differences between MD2, MD3, and MD4 are statistically insignificant ( between these models). Given that MD2, MD3, and MD4 are nested models, we retain MD4 as the optimal choice based on the TS value.
| Spatial Model | TS | Dof | AIC | |
|---|---|---|---|---|
| MD1 | Four components | 430.4 | 18 | 0 |
| MD2 | Four components + strip | 468.2 | 25 | -23.8 |
| MD3 | Three components + strip | 463.6 | 20 | -29.2 |
| MD4 | Two components + strip | 446.8 | 15 | -22.4 |
| MD5 | One component +strip | 417.8 | 11 | -1.4 |
| MD6 | strip | 390.8 | 7 | 17.6 |
-
•
Notes: Morphology fitting region is the ROI as described in Sec.2. MD1 is shown in Table S1. The strip is modelled with a rectangle. AIC is a statistical quantity that measures the goodness of fit of different models, defined by AIC = 2k - 2 ln, where k is the number of parameters in the model. In this formulation, the best hypothesis is considered to be the one that minimizes the AIC. The AIC value is subtracted from that of the MD1 in each model for a clear comparison.
The fitting results of the model MD4 are presented in Table S3. The components J0216+4239 and J0207+4300 are depicted as point-like sources, likely representing two hotspots. The strip diffuse component exhibits an extension of approximately 4.5 degrees in length and 0.45 degrees in width, with the long axis oriented at an angle of approximately north of west.
| Length | Width | Position Angle | TS | |||||||
|---|---|---|---|---|---|---|---|---|---|---|
| deg | deg | deg | deg | deg | deg | |||||
| Fit results above 25 TeV | 446.8 | |||||||||
| J0216+4239 | 1.090.27 | 2.640.25 | 34.06 | 42.62 | 0.09 | - | - | - | 27.0 | |
| J0207+4300 | 0.970.25 | 2.690.25 | 31.75 | 42.96 | 0.12 | - | - | - | 29.0 | |
| Strip diffuse | 5.000.66 | 2.560.11 | 31.70 | 43.14 | 0.08 | 4.600.44 | 0.450.12 | 13.81.2 | 193.8 | |
| Fit results 25-100 TeV | 147.8 | |||||||||
| J0216+4239 | 1.180.29 | 2.790.68 | 34.23 | 42.59 | 0.15 | - | - | - | - | |
| J0207+4300 | 0.780.30 | 3.290.80 | 31.70 | 42.93 | 0.29 | - | - | - | - | |
| Strip diffuse | 4.680.86 | 2.030.45 | 31.70 | 43.18 | 0.17 | 4.560.54 | 0.680.27 | 15.2 2.2 | - | |
| Fit results above 100 TeV | 313.0 | |||||||||
| J0216+4239 | 2.231.71 | 3.170.62 | 34.01 | 42.63 | 0.10 | - | - | - | - | |
| J0207+4300 | 4.573.15 | 3.790.64 | 31.77 | 42.97 | 0.12 | - | - | - | - | |
| Strip diffuse | 8.862.77 | 2.960.23 | 31.67 | 43.15 | 0.08 | 4.560.36 | 0.400.11 | 13.51.5 | - | |
To investigate the evolution of morphology with energy, we performed fits of the MD4 model in two energy bands: 25–100 TeV and ¿100 TeV. The locations of the hotspot J0207+4300 and the strip-like diffuse component, as well as the extension of the strip, show no significant change with energy and are likely energy-independent. The central coordinates (RA, Dec) of the hotspot J0216+4239 shift from (34.23∘, 42.59∘) to (34.01∘, 42.63∘) with increasing -ray energy. However, this shift is only significant at the level, which is insufficient to claim an energy-dependent structure. Nevertheless, the offset between J0216+4239 and the millisecond pulsar (MSP) J0218+4232 can be estimated, measuring approximately 0.22∘ in the 25–100 TeV energy bin and 0.39∘ above 100 TeV. More statistical data are essential to determine whether the hotspot J0216+4239 exhibits a genuine energy-dependent morphology, which would be crucial for probing the underlying electron transport mechanisms.
4 Spectrum Analysis
After determining the best-fitting morphology—composed of a strip-like diffuse component and two point-like sources (MD4)—we refitted the spectrum of all components to avoid potential biases from the preliminary models. This was done using a binned maximum likelihood analysis with 12 logarithmic energy bins spanning from 10 TeV to over 1 PeV. The spectra of all components were assumed to be identical to derive the overall energy distribution for the Peanut region. We modeled the spectrum across the entire region using standard spectral forms: a power-law (PL), a power-law with an exponential cutoff (PLEC), and a log-parabola (LP) function. The broadband fitting results are presented in Table S4.
To help identify the possible origin of the emission from the Peanut, we also tested several physically motivated spectral models. -rays can be produced through two primary mechanisms. The first is through interactions between relativistic protons and interstellar gas (proton-proton, or PP). The second mechanism involves the inverse Compton upscattering of cosmic microwave background photons by ultra-high-energy electrons and positrons (IC-CMB). We adopt a power-law function with an exponential cutoff for the spectrum of the emitting relativistic particles:
| (S6) |
where is the particle energy, is the spectral index, is the exponential cutoff energy, and is the sharpness parameter. For electrons, we account for the significant effects of escape processes and radiative cooling, which leads us to adopt a parameter value of . In contrast, for protons, radiative cooling is negligible due to their substantially longer cooling timescale; we therefore use in our fitting. Alternatively, a broken power law (BPL) could also be a plausible form for the emitting particle spectrum:
| (S7) |
where and are the spectral index, and is the break energy.
| -ray Model | TS | Ec | AIC | |||
| (cm-2 s-1 TeV -1) | (PeV) | |||||
| PL | 452.5 | 6.6 0.5 | 2.530.06 | - | 0.0 | |
| LP | 469.7 | 38.1 9.3 | 1.58 0.28 / 0.65 0.18 | - | -15.2 | |
| PLEC | 469.7 | 8.1 0.9 | 1.950.19 | 0.250.08 | -15.2 | |
| Proton Model | TS | Eb or Ec | ||||
| ( erg) | (PeV) | (PeV) | ||||
| PL | 458.0 | 4.0 0.2 | 2.490.05 | - | 0.0 | |
| PLEC | 470.0 | 3.5 0.2 | 1.450.55 | 0.860.48 | -10.0 | |
| BPL | 470.7 | 3.6 0.3 | 1.920.44/7.233.3 | 1.760.75 | -8.7 | |
| Electron Model | TS | Eb or Ec | ||||
| ( erg) | (PeV) | |||||
| PL | 461.9 | 1.5 0.2 | 2.980.04 | - | 0.0 | |
| PLSuperEC | 470.4 | 1.2 0.3 | 2.480.27 | 0.770.24 | -6.5 | |
| BPL | 469.4 | 1.3 0.3 | 2.620.23/5.352.6 | 0.600.30 | -3.5 |
-
•
Note: PL stands for the power-law model defined as . PLEC and PLSuperEC are the power-law with an exponential cutoff (refer to equation S6) with the and with , respectively. LP represents the log-parabola model defined as , where is fixed to 20 TeV. BPL refer to equation S7. For the LP model, the second value listed in column is the parameter. For the BPL model, the second value listed in column is the spectral index above . To calculate the -ray spectrum, we assumed a target gas density for hadronic process and just consider the CMB soft photon field for leptonic process. The and are the total energy assuming a distance at 3.15 kpc. AIC is a statistical quantity that measures the goodness of fit of different models, defined by AIC = 2k - 2 ln, where k is the number of parameters in the model. In this formulation, the best hypothesis is considered to be the one that minimizes the AIC. The AIC value is subtracted from that of the PL spectrum in each model for a clear comparison.
The analysis results for each model are summarized in Table S4, with the model fits compared using the Test Statistic (TS) and Akaike Information Criterion (AIC). For the observed photon flux, the bending spectral models (PLEC or LP) provide a significantly improved fit compared to the simple power-law (PL) model, with a significance of 4.1 (TS - TS = 17.2). The PLEC model is found to be superior for the Proton Model, yielding an injected proton spectral index of -1.45 0.55 and a spectral cutoff at approximately 860 TeV. Conversely, the PLSuperEC model provides the best fit for the Electron Model, resulting in an injected electron spectral index of -2.48 0.27 and a cutoff energy around 770 TeV.
The obtained bin-by-bin flux points are listed in Table S5.
| Emid | Flux() | TS | ||
|---|---|---|---|---|
| TeV | TeV cm-2 s-1 | |||
| 14.1 | 2.33 | 0.0 | -105.4 | 562699.4 |
| 22.4 | 2.74 | 9.6 | 797.7 | 127689.3 |
| 31.6 | 1.71 | 16.2 | 341.9 | 7898.1 |
| 50.1 | 1.75 | 49.6 | 195.2 | 1077.8 |
| 79.4 | 1.35 | 59.8 | 136.7 | 502.3 |
| 125.9 | 1.35 | 126.1 | 96.0 | 87.0 |
| 199.5 | 0.92 | 84.5 | 42.4 | 23.6 |
| 316.2 | 0.62 | 50.1 | 21.5 | 6.5 |
| 446.7 | 0.39 | 17.1 | 8.5 | 2.5 |
| 708.0 | 0.17 | 4.6 | 2.1 | 0.9 |
| 1122.0 | 0.15 | 0.0 | -0.3 | 0.3 |
-
•
Notes: For energy bins where the flux was not significantly detected (TS 4 ()), we computed 95% confidence flux upper limits using the likelihood profile.
5 Systematic Uncertainties
To assess the robustness of our results, we performed a number of systematic checks similar to those employed in Ref [6]. The pointing error was estimated to be less than from observations of the standard candle, the Crab Nebula, as well as the cosmic-ray Moon shadow [39]. For the extension estimation, the dominant contribution comes from the difference in the Point Spread Function (PSF) between the Monte Carlo (MC) simulation and the data. This difference was estimated to be about using observations of the point-like source Crab Nebula [3]. Taking this difference into account, the systematic error in the strip extension measurement was estimated to be in length and in width.
The systematic uncertainties in the flux primarily originate from the atmospheric model used in the Monte Carlo simulations. The actual atmospheric density profile constantly deviates from the model due to seasonal and daily variations. To estimate this effect, the data were divided into four subsets based on daily atmospheric pressure: 594 hPa, 594597 hPa, 597600 hPa, and 600 hPa. The maximum difference between these datasets was taken as a conservative estimate of the systematic error, yielding 10% in flux and 0.03 in spectral index. When adopting a Power-Law with Exponential Cutoff (PLEC) spectral model, the systematic uncertainty in the spectral index propagates to the cutoff energy (). By varying the spectral index within its uncertainty range to fit the Peanut spectrum, we derived a variation of 8% for , which we take as the conservative systematic uncertainty for this parameter. Furthermore, we assessed uncertainties related to Galactic Diffuse Emission (GDE) introduced by cosmic-rays interacting with interstellar gas. We evaluated these GDE-related uncertainties by incorporating a dust template into our spectral fitting. The impact on the extension and flux was found to be less than 2%.
6 UHE -ray events around Peanut
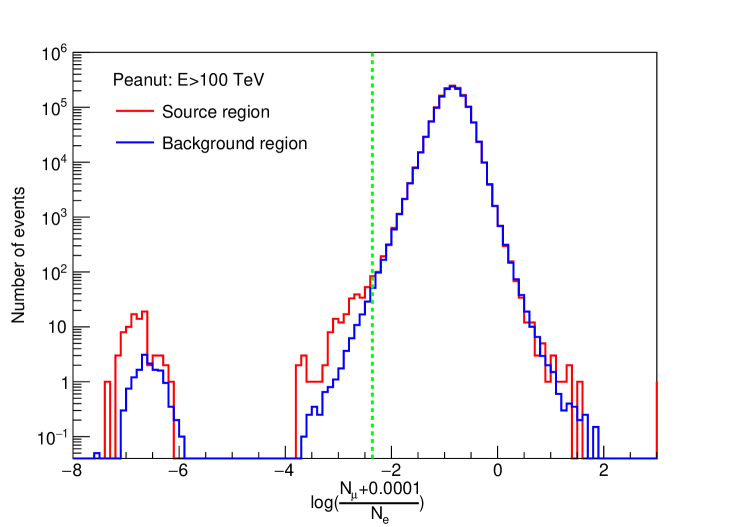
The main background for -ray observations consists of cosmic-ray induced air showers. Given that -ray induced showers are muon-poor while cosmic-ray induced showers are muon-rich, the ratio between the measured number of muons and electrons is used to select -ray-like events [38, 1, 42, 3]. Figure S1 shows the distribution of the ratio for events within the Peanut source region with energies above 100 TeV. For comparison, the average distribution of for events within 20 background regions is also shown; these background regions have the same size and zenith angles as the source region, but different azimuth angles. For , the distribution in the source region is consistent with that in the background region, indicating that these events are primarily due to cosmic rays. For , a clear excess is observed in the source region compared to the background, which is attributed to -ray events.
The -ray-like events with energies above 400 TeV from the Peanut region are shown in Figure 2. To provide detailed information on the highest-energy -ray events, we list the six -ray-like events with energies above 500 TeV in Table S6. Here, represents the zenith angle, which is required to be less than in the standard data selection. The parameter denotes the distance of the shower core from the nearest edge of the active detector array; a larger distance indicates better completeness of the shower detection. In the standard data selection, is required to be greater than 20 m. To select -ray-like events, a cut on the -ray/background discrimination parameter is applied, specifically . The energy of each event is re-estimated on an event-by-event basis using the probability distribution of the true energy for a reconstructed energy, applying Bayes’ theorem and taking into account the measured spectrum. Further details on this method can be found in [2023SciA....9J2778C]. The maximum energy of an event from the Peanut region is TeV.
| (TeV) | R.A.(deg) | DEC(deg) | (deg) | (deg) | |||
|---|---|---|---|---|---|---|---|
| 505 | 34.19 | 42.54 | 4.7 | 2433.3 | 13.6 | 63.7 | 0.13 |
| 505 | 28.63 | 43.55 | 5.1 | 3108.2 | 13.8 | 115.3 | 0.13 |
| 524 | 31.82 | 42.56 | 21.8 | 8038.8 | 49.2 | 129.9 | 0.15 |
| 622 | 34.05 | 42.72 | 13.3 | 3388.5 | 33.2 | 48.9 | 0.12 |
| 726 | 33.57 | 42.79 | 11.1 | 3315.2 | 41.7 | 130.4 | 0.13 |
| 764 | 32.29 | 43.39 | 3.8 | 3975.1 | 18.4 | 136.9 | 0.12 |
7 Multi-wavelength Observation and Association
Figure S2 marks the known astrophysical sources around the LHAASO Peanut. The GeV sources are from the Fourth Fermi-LAT Catalog (4FGL)[8], the TeV sources from TeVCat[5], and the pulsars from the ATNF catalog[9]. The closest known TeV sources are the blazar 3C 66A and the radio galaxy 3C 66B. However, these known TeV sources do not overlap with the Peanut and are extragalactic. Therefore, we can safely discard any physical connection between them and the Peanut. Five GeV sources have been detected in the region. Three of these are unidentified and located distinctly outside the primary TeV -ray emission zone. Another is the blazar 3C 66A, which is unrelated to the ultra-high-energy (UHE) gamma-ray emission. The only GeV source potentially associated with the Peanut is the -ray pulsar J0218+4232. Two other pulsars, i.e., PSR J0211+4235 (d 2.2 kpc; erg s-1) and PSR J0209+4331 (d 2.5 kpc; erg s-1), are also found nearby Peanut. However, their low spin down power results in an insufficient energy budget, so we can largely exclude their physical association with the Peanut’s -ray emission. A systematic cross-matching analysis was performed between the Peanut region and the online SNRCat database[7], which compiles supernova remnant and pulsar wind nebula (SNR–PWN) systems. No significant spatial coincidence was detected with any known SNR or PWN. To investigate potential microquasar associations, we systematically searched multiple X-ray binary catalogs: the High-Mass X-ray Binary Catalog (HMXBCAT), the Low-Mass X-ray Binary Catalog (LMXBCAT), the Ritter Catalog of Low-Mass X-ray Binaries (RITTERLMXB), and the General X-ray Binary Catalog (XRBCAT). No X-ray binary candidates were identified within the Peanut region. Additionally, to explore possible young massive star cluster (YMSC) associations, we cross-referenced SIMBAD for star-forming regions (SFRs), HII regions, and Galactic star clusters (SCs), but found no spatial coincidences.
The pulsar J0218+4232 is the sole identified accelerator candidate in our multi-wavelength association procedure. It is highly energetic and is classified as a millisecond pulsar. As mentioned in the main text, this MSP is the most likely object to be physically connected to the Peanut. Radio data analysis showed that MSP J0218+4232 orbits a helium-core white dwarf companion every days with a short spin period of ms [12, 13]. However, the broad radio pulse profile suggests that J0218 is an unusual aligned rotator. Like the Crab Pulsar, it produces giant pulses of short intrinsic duration[43, 44]. Based on a spin-down rate of , its spin-down age is yr [15]. Additionally, it possesses a low surface magnetic field of G, about four orders of magnitude lower than most pulsars. Yet, despite this, the magnetic field at its light cylinder is strong, G, a value comparable to young Crab-like pulsars [17]. This suggests that this MSP might also be able to inject PeV electrons into the ISM. According to a recent study[14], and after adjusting for the Lutz-Kelker bias in trigonometric parallax measurement, the distance to this MSP (known for being one of the brightest in the Fermi-LAT catalog) is 3.15 kpc. This distance is smaller than previously reported in other studies. Despite this, the MSP still has a spin-down power of erg/s, which is sufficiently high to power the observed gamma-ray luminosity of erg/s for reasonable acceleration efficiencies of 0.01-0.1.
8 Interstellar Gas around Peanut
The TeV emission from the Peanut region possibly comes from hadronic interactions between CRs and the ISM. Approximately 99% of the ISM mass is gas, and about 70% of this mass is hydrogen. The hydrogen gas exists in the form of neutral atoms(HI) in cold and warm phases, as neutral H2 molecules, and in an ionized state. Helium and heavier elements are considered to be uniformly mixed with the hydrogen. The warm HI medium and part of the cold HI medium are traced by 21cm line radiation.
Most of the cold molecular mass is traced by 12CO line emission; however, we found no existing CO line observations covering the Peanut region. Instead, we used the Type-2 CO foreground map from the second data release of the Planck satellite222http://irsa.ipac.caltech.edu/data/Planck/release_2/all-sky-maps/. The Planck CO data only provide the emission integrated along the entire line of sight. We show a cutout of this region in Figure S3, but most of the data are tagged as noise. Therefore, we suggest that atomic hydrogen represents the majority of the gas mass in the direction of the Peanut.
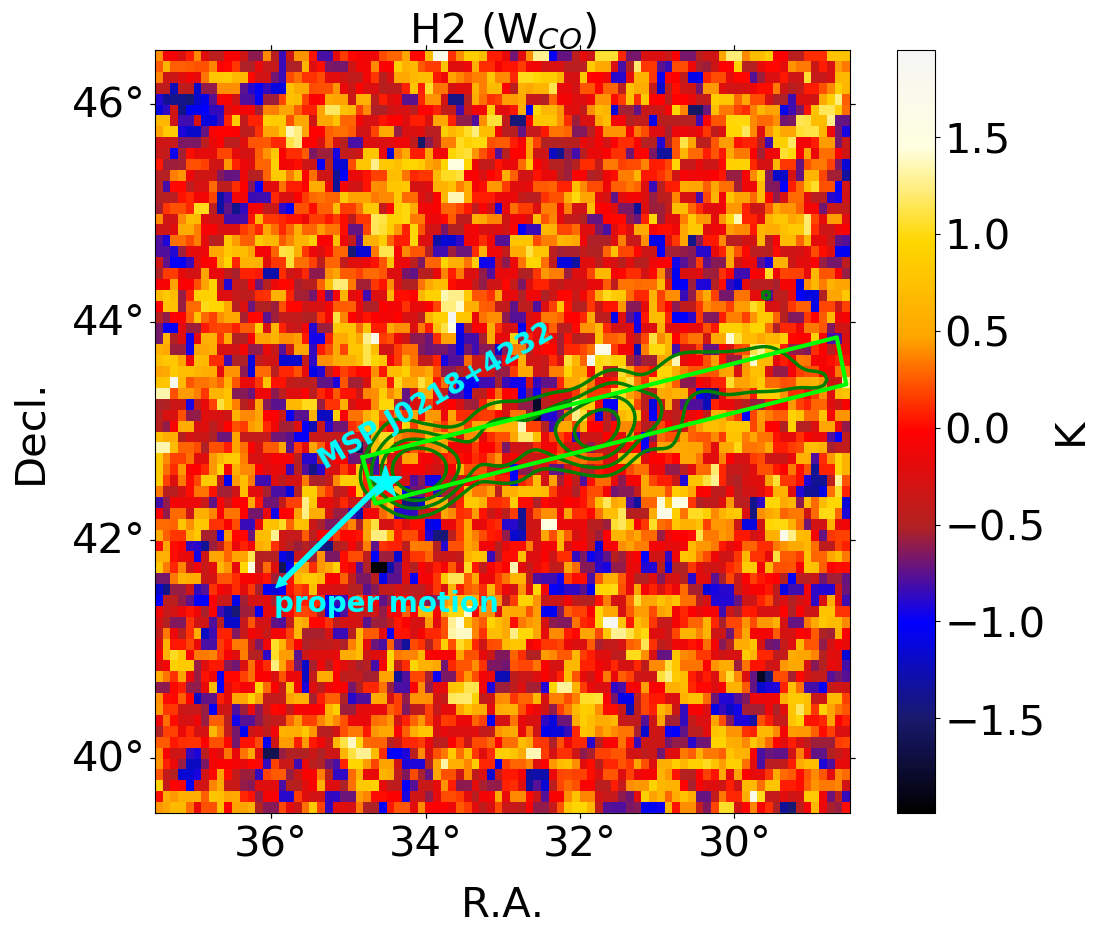
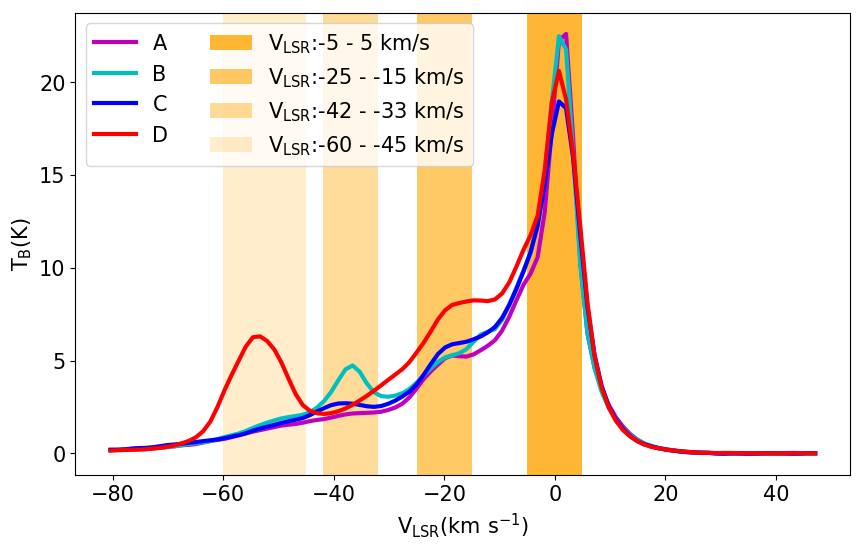
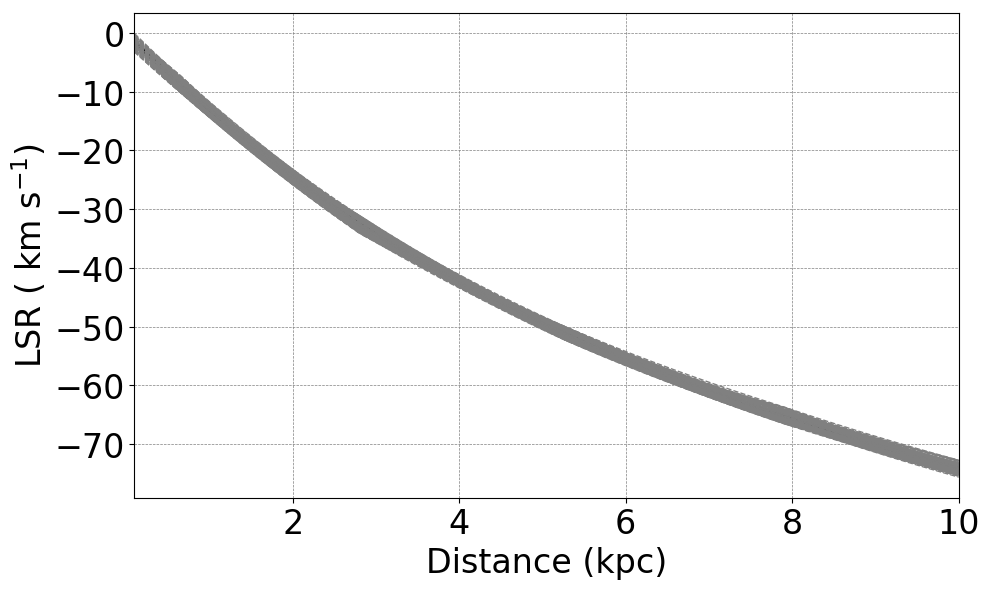
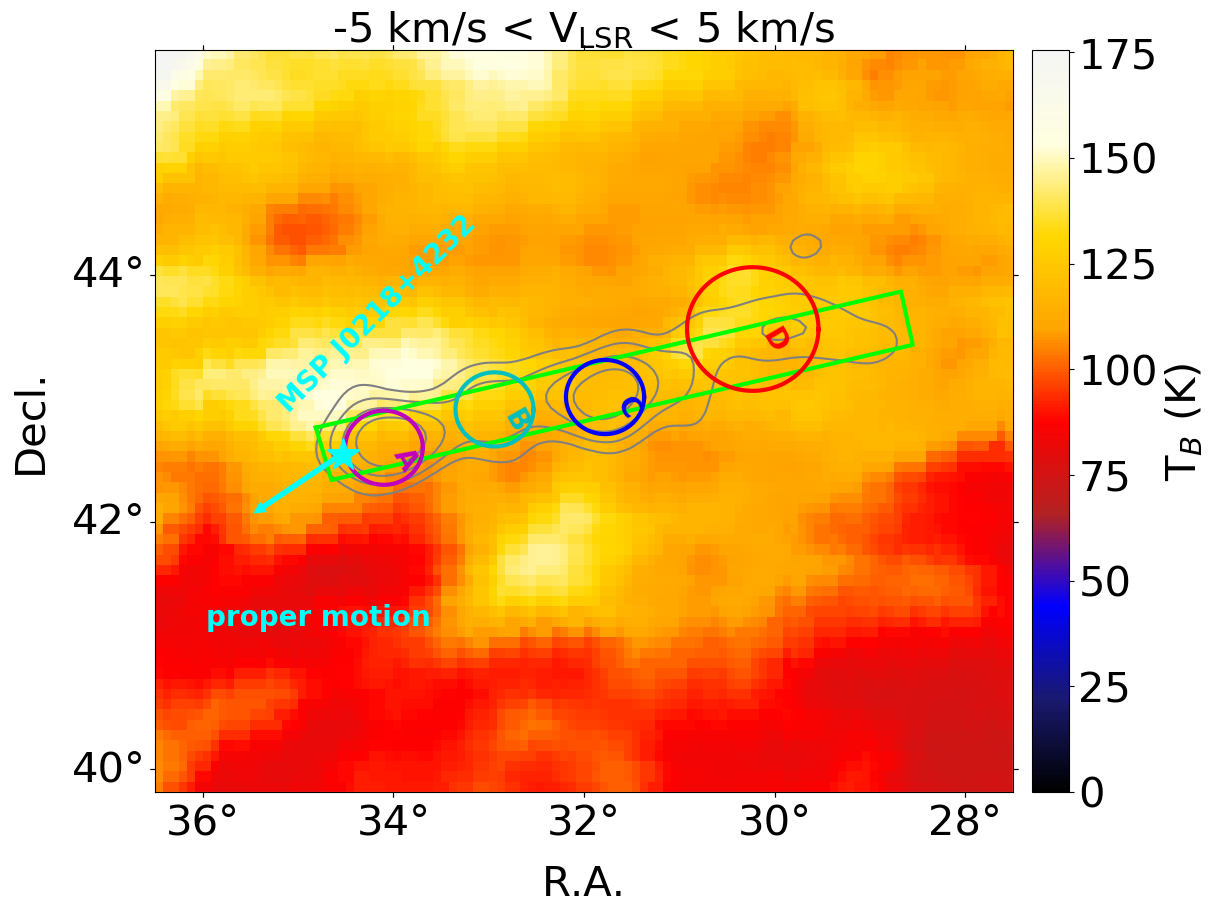
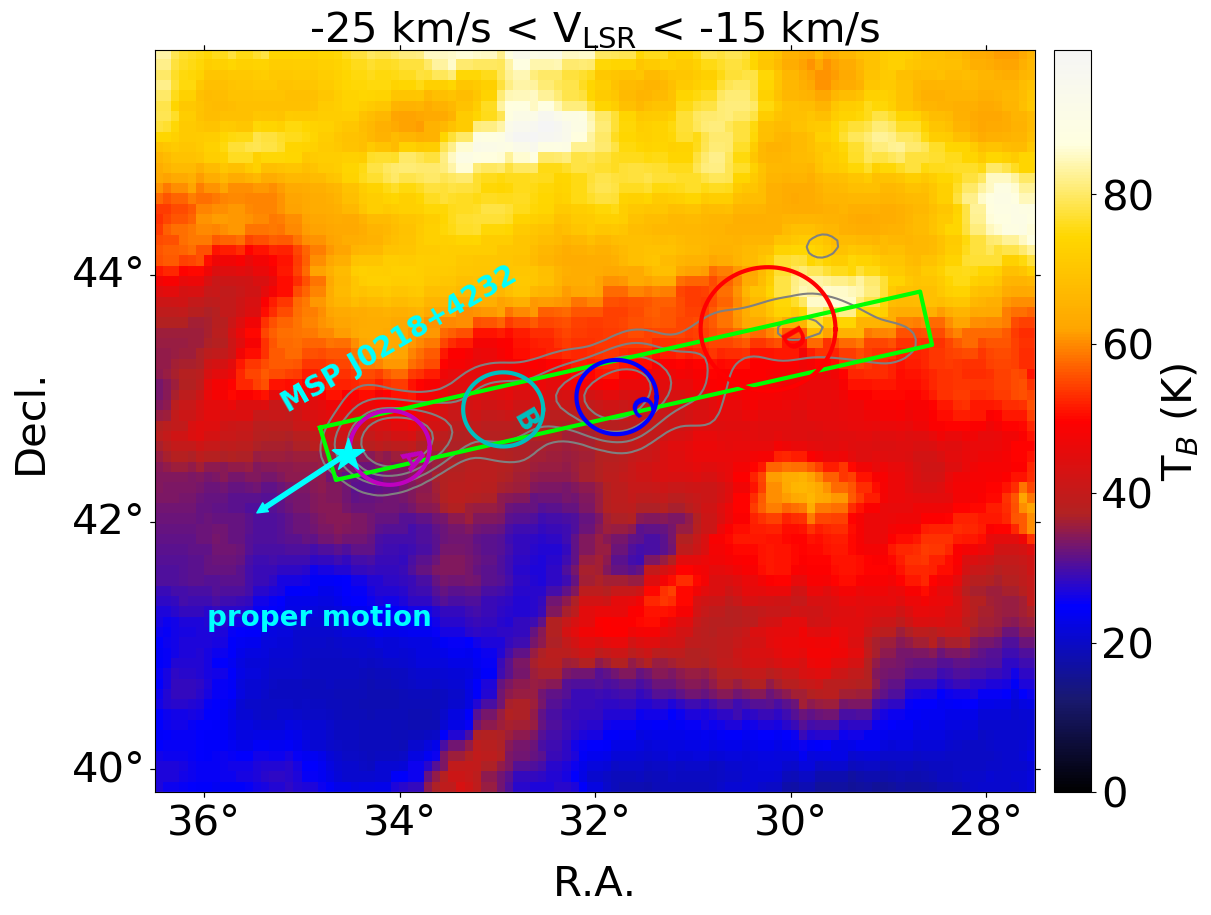
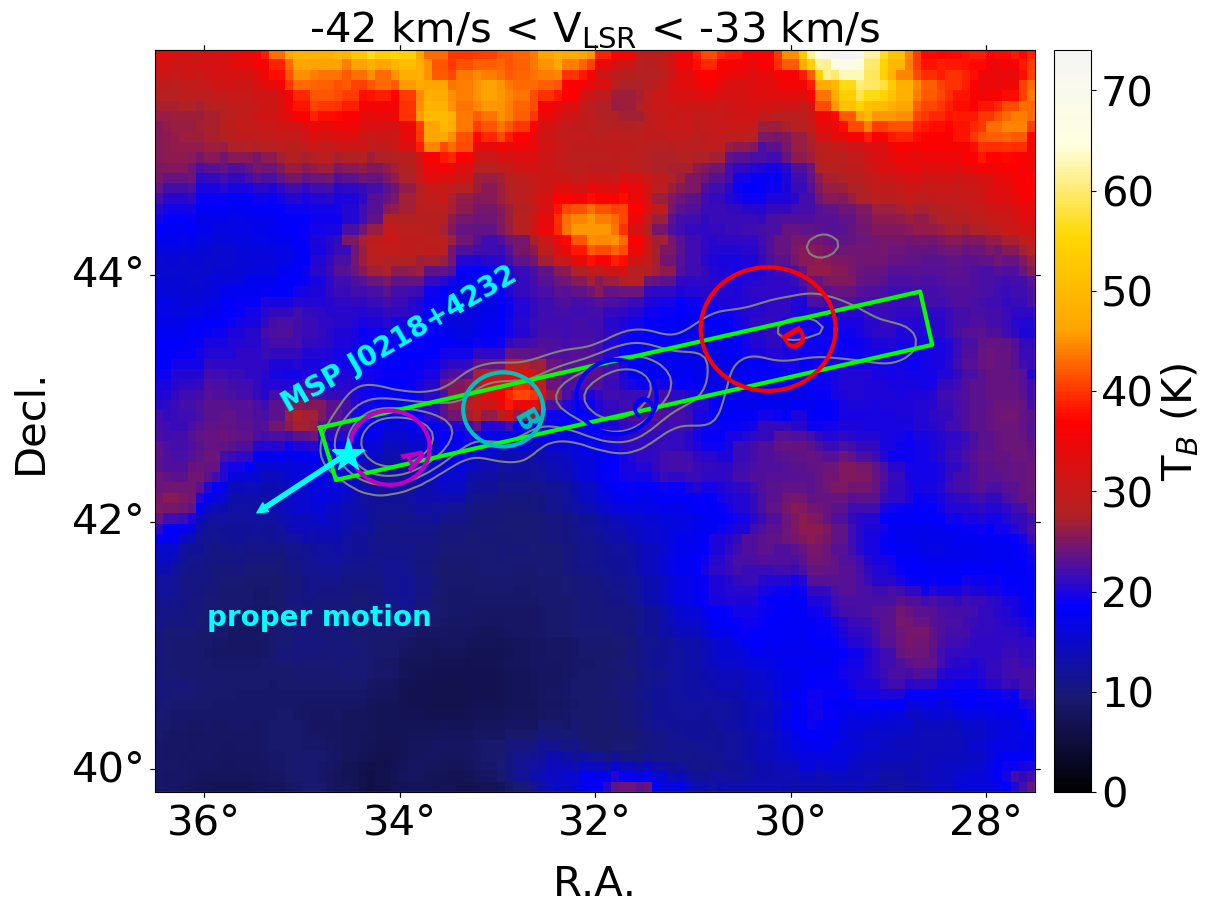
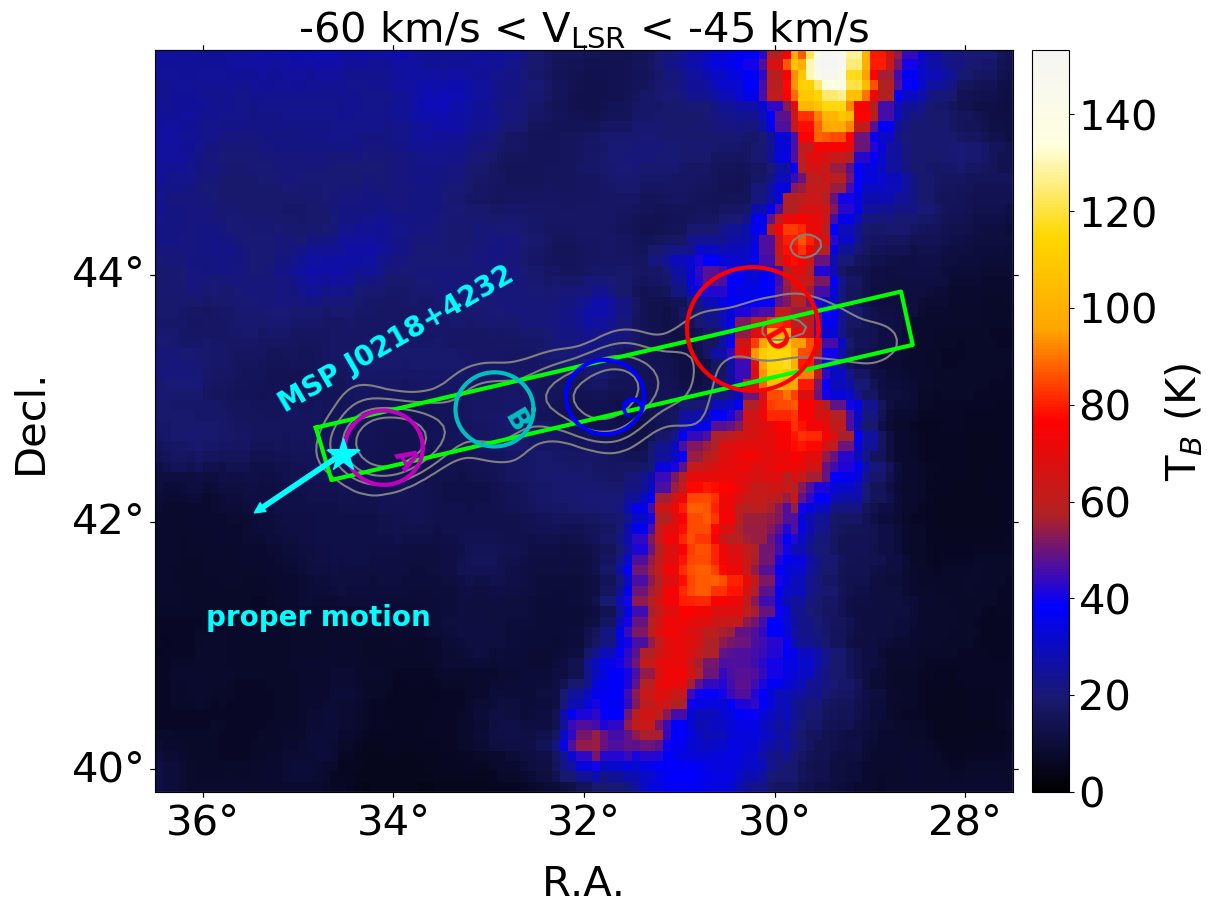
We adopted the HI4PI survey data to investigate the neutral atomic gas in the direction of the Peanut. As shown in Fig. S4, the HI gas is mainly located at distances smaller than 7 kpc, which corresponds to a velocity range from -60 to 10 km/s based on the rotation curve. We roughly divided the HI map into four distance ranges: d 1 kpc (-5 km/s to 5 km/s), d1.5 kpc (-25 km/s to -15 km/s), d 3.4 kpc (-42 km/s to -33 km/s), and d 5 kpc (-60 km/s to -45 km/s). Fig. S5 reveals no significant spatial correlation between the interstellar gas distributions and the LHAASO -ray profile.The HI distribution in the direction of the Peanut region exhibits approximately spatially uniform density profiles at various distances.
9 Chance Coincidence Probability
In the context of a Poisson distribution, the chance probability can be calculated as , where represents the probability of an event occurring less than times, and is the average number of times that the event occurs.
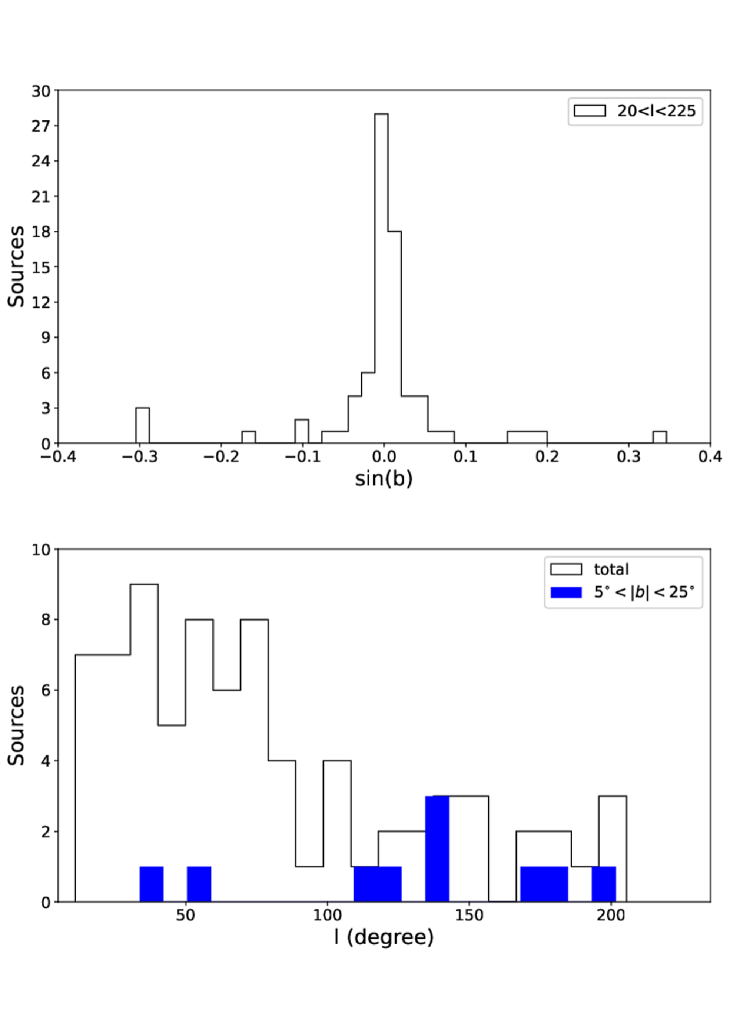
Figure S6 illustrates the distribution of 1LHAASO sources with energies above 25 TeV. It can be observed that most sources are located in the region . For , the sources approximately follow a uniform distribution. As a conservative approach, we assume a uniform distribution in the region A: and . The number of 1LHAASO sources within region A is 10, yielding a source density of 0.0012 deg-2.
In the 1LHAASO catalog, we identified three point-like sources located in region B, which has an area of approximately (1 deg2). The expected number of sources in this region is therefore deg-2 1 deg2 . The chance probability of detecting three or more independent sources in region B is . We actually found four Gaussian components in region B, which means the expected probability of finding four or more independent sources is lower than this value.
As presented in the LHAASO First Catalog[3], the majority of identified UHE -ray sources are located at low Galactic latitudes (), and their photon indices are typically soft, around . A source with a hard spectrum (e.g., ) is relatively rare in the UHE sky. The Peanut is located at a high Galactic latitude, where the population of UHE sources is sparse. The probability of three independent, rare objects (a hard-spectrum UHE source and a candidate pulsar) randomly overlapping by chance is very low. Furthermore, the spectral similarity is a key piece of evidence that strengthens the spatial coincidence. Therefore, all emissions from the Peanut should have a strong association, suggesting they may have a common origin.
Second, we calculated the chance coincidence probability to investigate whether MSP J0218+4232 is associated with the Peanut. Following the method above, we first estimated the density of pulsars with . We assumed a uniform distribution of such pulsars in region C: . The number of pulsars listed in the ATNF pulsar catalog that meet this criterion within region C is 10, yielding a number density of 0.0014 deg-2. Based on this density, we considered a diffuse strip region of . The chance probability of a pulsar similar to MSP J0218+4232 being detected within this region is . We note that the pulsar is located at the head of the LHAASO Peanut. If we consider only this head region, defined as , the chance probability decreases to .
10 Hadronic senario for MSP J0218+4232?
A major issue is the significant proper motion of the pulsar, which is inconsistent with the formation mechanism of the Peanut structure in the hadronic senario. Assuming a fiducial value of , the timescale required for the pulsar to populate the region with high-energy protons is estimated to be approximately 50 Myr, given by Myr. The adopted efficiency of 1% accounts for both the conversion of rotational energy into UHE particles and the fraction of particles that escape the system. This value is optimistic and could be increased by at most a factor of a few under extreme assumptions. Moreover, the proper motion of the pulsar, measured as mas yr-1 and oriented roughly parallel to the major axis of the strip component [45], implies an angular displacement of approximately over the characteristic formation timescale of the Peanut structure. This displacement greatly exceeds the actual angular extent of the Peanut, further undermining the plausibility of a physical association. Thus, if MSP J0218+4232 is indeed the particle accelerator associated with the Peanut structure, the proper motion of MSP would challenge the hadronic -ray production scenario for this source.
11 Diffusion coefficient measurement
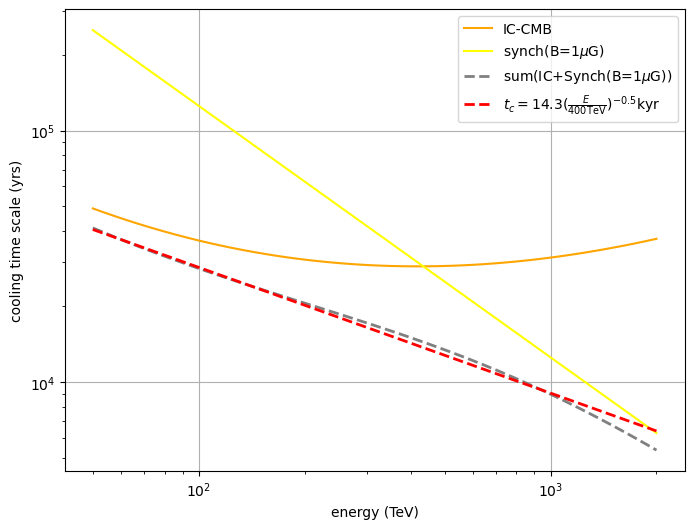
The strip size, about at a distance of 3.15 kpc, corresponds to the diffusion distances defined as , where is the diffusion coefficient in the corresponding direction, and is the lepton injection time chosen to be the cooling time of the relativistic . To generate -rays with energies of 10-760 TeV through IC scattering of CMB photons, the energy of the primary can be estimated[46] as 1.7 PeV. The energy range of -rays detected by LHAASO corresponds to the parent electron energy ranging from 50 TeV to 1.6 PeV. For electrons in this energy range, the radiative cooling time can be given by kyr, taking into account both synchrotron and inverse Compton cooling while considering a typical ISM field of 1G in the Galactic Halo[47]. Here, we investigate the cooling time related to the energies of the electrons using the open-source package GAMERA 333https://libgamera.github.io/GAMERA/docs/tutorials_main.html. The synchrotron and IC energy losses are included. In the Galactocentric coordinate system, MSP J0218+4232 is located at (10.787, -1.951, -0.922) kpc at the current epoch, placing it in the Galactic halo. The magnetic field is estimated to be 1 G based on the GMF model[47]. For the inverse Compton cooling, the dominant target photons are from the CMB. We generated the synchrotron/IC cooling time as a function of electron energy, as shown in Figure S7.
Thus, along the direction of the strip length (), the diffusion coefficient is constrained to be , where accounts for the energy dependence in the diffusion coefficient, which is close to 0.5 due to insignificant morphology changes with energy (see SM3 Table S3). We assume and obtain cm2 s-1 at 100 TeV, which is times larger than that measured from the extended halo around Geminga[21], and is compatible with values derived from cosmic-ray secondaries. In the transverse direction, the diffusion coefficient is , considering half of the strip width (), which is compatible with that measured from the TeV halo around Geminga.
References
- [1] Cao, Z. et al. Ultrahigh-energy photons up to 1.4 petaelectronvolts from 12 -ray Galactic sources. Nature 7594, 33–36 (2021).
- [2] Hinton, J. & Ruiz-Velasco, E. Multi-messenger astronomy with very-high-energy gamma-ray observations. J. Phys. Conf. Ser. 1468, 012096 (2020). 1911.06097.
- [3] Cao, Z. et al. The First LHAASO Catalog of Gamma-Ray Sources. Astrophys. J. Suppl. 271, 25 (2024). 2305.17030.
- [4] Cao, Z. et al. An ultrahigh-energy -ray bubble powered by a super PeVatron. Sci. Bull. 69, 449–457 (2024). 2310.10100.
- [5] URL http://tevcat.uchicago.edu.
- [6] Wilks, S. S. The Large-Sample Distribution of the Likelihood Ratio for Testing Composite Hypotheses. Annals Math. Statist. 9, 60–62 (1938).
- [7] Ferrand, G. & Safi-Harb, S. A census of high-energy observations of Galactic supernova remnants. Advances in Space Research 49, 1313–1319 (2012). 1202.0245.
- [8] Ballet, J., Bruel, P., Burnett, T. H. & Lott, B. Fermi Large Area Telescope Fourth Source Catalog Data Release 4 (4FGL-DR4) (2023). 2307.12546.
- [9] URL http://www.pulsarastronomy.net/wiki/Main/PulsarCatalogues.
- [10] Cao, Z. et al. Ultra-high-energy -ray emission associated with the tail of a bow-shock pulsar wind nebula. Innovation 6, 100802 (2025). 2502.15447.
- [11] Bao Yiwei, L. R.-Y., Giacinti Gwenael et al. Mirages and large tev halo-pulsar offsets from cosmic-ray propagation. Phys. Rev. Lett. – (2025). 2407.02478.
- [12] Navarro, J., de Bruyn, A. G., Frail, D. A., Kulkarni, S. R. & Lyne, A. G. A very luminous binary millisecond pulsar. The Astrophysical Journal 455, L55 (1995).
- [13] Bassa, C. G., van Kerkwijk, M. H. & Kulkarni, S. R. Temperature and cooling age of the white dwarf companion of PSR J0218+4232. Astron. Astrophys. 403, 1067–1075 (2003). astro-ph/0303439.
- [14] Verbiest, J. P. W. & Lorimer, D. R. Why the distance of PSR J0218+4232 does not challenge pulsar emission theories. Monthly Notices of the Royal Astronomical Society 444, 1859–1861 (2014).
- [15] Gotthelf, E. V. & Bogdanov, S. NuSTAR Hard X-ray Observations of the Energetic Millisecond Pulsars PSR B1821-24, PSR B1937+21, and PSR J0218+4232. Astrophys. J. 845, 159 (2017). 1704.02964.
- [16] Konar, S. Magnetic Fields of Neutron Stars. J. Astrophys. Astron. 38, 47 (2017). 1709.07106.
- [17] Saito, Y. et al. Detection of magnetospheric x-ray pulsation from the millisecond pulsar b1821–24. The Astrophysical Journal 477, L37 (1997).
- [18] Abdo, A. A. et al. A Population of Gamma-Ray Millisecond Pulsars Seen with the Fermi Large Area Telescope. Science 325, 848 (2009).
- [19] Deneva, J. S. et al. High-precision x-ray timing of three millisecond pulsars with nicer: Stability estimates and comparison with radio. The Astrophysical Journal 874, 160 (2019).
- [20] Acciari, V. A. et al. Search for Very High-energy Emission from the Millisecond Pulsar PSR J0218+4232. Astrophys. J. 922, 251 (2021). 2108.11373.
- [21] Abeysekara, A. U. et al. Extended gamma-ray sources around pulsars constrain the origin of the positron flux at Earth. Science 358, 911–914 (2017). 1711.06223.
- [22] Aharonian, F. et al. Extended Very-High-Energy Gamma-Ray Emission Surrounding PSR J 0622 +3749 Observed by LHAASO-KM2A. Phys. Rev. Lett. 126, 241103 (2021). 2106.09396.
- [23] Guo, Y.-Q., Tian, Z. & Jin, C. Spatial-dependent Propagation of Cosmic Rays Results in Spectrum of Proton, Ratios of , B/C and Anisotropy of Nuclei. Astrophys. J. 819, 54 (2016). 1509.08227.
- [24] Klingler, N. et al. Deep Chandra Observations of the Pulsar Wind Nebula Created by PSR B0355+54. Astrophys. J. 833, 253 (2016). 1610.06167.
- [25] Klingler, N. et al. Chandra Monitoring of the J1809–1917 Pulsar Wind Nebula and Its Field. Astrophys. J. 901, 157 (2020). 2008.09200.
- [26] Klingler, N., Hare, J., Kargaltsev, O., Pavlov, G. G. & Tomsick, J. A NuSTAR and Chandra Investigation of the Misaligned Outflow of PSR J1101–6101 and the Lighthouse Pulsar Wind Nebula. Astrophys. J. 950, 177 (2023). 2212.03952.
- [27] Pavan, L. et al. The long helical jet of the Lighthouse nebula, IGR J11014-6103. Astron. Astrophys. 562, A122 (2014). 1309.6792.
- [28] Giacinti, G., Kachelriess, M. & Semikoz, D. V. Anisotropic Cosmic Ray Diffusion and its Implications for Gamma-Ray Astronomy. Phys. Rev. D 88, 023010 (2013). 1306.3209.
- [29] Giacinti, G., Kachelriess, M. & Semikoz, D. V. Reconciling cosmic ray diffusion with Galactic magnetic field models. JCAP 07, 051 (2018). 1710.08205.
- [30] Carretti, E. et al. Giant Magnetized Outflows from the Centre of the Milky Way. Nature 493, 66 (2013). 1301.0512.
- [31] Wilhelmi de Oña, E., López-Coto, R., Amato, E. & Aharonian, F. On the Potential of Bright, Young Pulsars to Power Ultrahigh Gamma-Ray Sources. Astrophys. J. Lett. 930, L2 (2022). 2204.09440.
- [32] Amato, E. Particle acceleration in pulsars and pulsar wind nebulae. arXiv e-prints arXiv:2402.10912 (2024). 2402.10912.
- [33] Abeysekara, A. U. et al. Extended gamma-ray sources around pulsars constrain the origin of the positron flux at Earth. Science 358, 911–914 (2017). 1711.06223.
- [34] Fang, K., Hu, H.-B., Bi, X.-J. & Chen, E.-S. Effect of the magnetic field correlation length on the gamma-ray pulsar halo morphology under anisotropic diffusion. Phys. Rev. D 108, 023017 (2023). 2304.04570.
- [35] Albert, A. et al. Precise Measurements of TeV Halos around Geminga and Monogem Pulsars with HAWC. Astrophys. J. 974, 246 (2024).
- [36] Alfaro, R. et al. Ultra-high-energy gamma-ray bubble around microquasar V4641 Sgr. Nature 634, 557–560 (2024). 2410.16117.
- [37] Ultrahigh-Energy Gamma-ray Emission Associated with Black Hole-Jet Systems (2024). 2410.08988.
- [38] Aharonian, F. et al. The observation of the Crab Nebula with LHAASO-KM2A for the performance study. Chin. Phys. C 45, 025002 (2021). 2010.06205.
- [39] Cao, Z. et al. Data quality control system and long-term performance monitor of LHAASO-KM2A. Astroparticle Physics 164, 103029 (2025). 2405.11826.
- [40] Atkins, R. et al. Observation of TeV gamma-rays from the Crab nebula with MILAGRO using a new background rejection technique. Astrophys. J. 595, 803–811 (2003). astro-ph/0305308.
- [41] Abdo, A. A. et al. The Spectrum of the Isotropic Diffuse Gamma-Ray Emission Derived From First-Year Fermi Large Area Telescope Data. Phys. Rev. Lett. 104, 101101 (2010). 1002.3603.
- [42] Cao, Z. et al. PeV gamma-ray emission from the Crab Nebula. Science (2021).
- [43] Knight, H. S., Bailes, M., Manchester, R. N., Ord, S. M. & Jacoby, B. A. Green bank telescope studies of giant pulses from millisecond pulsars. The Astrophysical Journal 640, 941 (2006).
- [44] Joshi, B. C., Kramer, M., Lyne, A. G., Mclaughlin, M. & Stairs, I. H. Giant pulses in millisecond pulsars. IAU Symp. 218, 319 (2004). astro-ph/0310285.
- [45] Du, Y. et al. Very Long Baseline Interferometry Measured Proper Motion and Parallax of the -Ray Millisecond Pulsar PSR J0218+4232. Astrophys. J. Lett. 782, L38 (2014). 1402.2380.
- [46] Lhaaso Collaboration et al. Peta-electron volt gamma-ray emission from the Crab Nebula. Science 373, 425–430 (2021). 2111.06545.
- [47] Jansson, R. & Farrar, G. R. A New Model of the Galactic Magnetic Field. ApJ 757, 14 (2012). 1204.3662.
Data availability The authors declare that the data supporting the findings of this study are available within the paper, its supplementary information files, and the Large High Altitude Air-shower Observatory (https://english.ihep.cas.cn/lhaaso/pdl/202110/t20211026_286779.html)
Code availability The findings presented in this study are derived exclusively from LHAASO observations and standard LHAASO data analysis procedures. The analysis framework was developed by the LHAASO collaboration, and all codes used to obtain the results in this paper are publicly available on the website https://english.ihep.cas.cn/lhaaso/pdl/202110/t20211026_286779.html.
Acknowledgements The authors would like to thank all staff members working year-round at the LHAASO site above 4400 meters above sea level to maintain the detector operating smoothly. We appreciate all LHAASO data processing team members for achieving high-quality reconstructed data and air shower simulation data. We are grateful to the Chengdu Management Committee of Tianfu New Area for the constant financial support for research with LHAASO data. This work is supported by: National Natural Science Foundation of China No.12393851, No. 12261160362, No.12393852, No.12393853, No.12393854, No. 12022502, No. 12205314, No. 12105301, No. 12105292, No. 12105294, No. 12005246, No. 12173039, and No. 12375108. Department of Science and Technology of Sichuan Province, China, No.2024NSFJQ0060, Project for Young Scientists in Basic Research of Chinese Academy of Sciences No. YSBR-061, and in Thailand by the National Science and Technology Development Agency (NSTDA) and National Research Council of Thailand (NRCT): High-Potential Research Team Grant Program (N42A650868).
Author contributions Zhe Li is the convener of this project, leaded the study and drafted the manuscript; Shaoqiang Xi leaded the source spatial morphology and spectrum analysis, and contributes the multi-wavelength analysis; Songzhan Chen worked on the source estimation and UHE -ray events recording; Dmitry Khangulyan provided suggestions on millisecond pulsar interpretation and helped polishing the paper. Oscar Macias and Siming Liu actively discussed the millisecond pulsar interpretation and electron diffusion theories. For radio data around Peanut, the work group leaded by Jianli Zhang from National Astronomical Observatorie, CAS, provided the FAST survey result. The whole LHAASO collaboration contributed to the publication, with involvement at various stages ranging from the design, construction and operation of the instrument, to the development and maintenance of all software for data calibration, data reconstruction and data analysis. All authors reviewed, discussed and commented on the present results and on the manuscript.
Corresponding author emails lizhe@ihep.ac.cn; xisq@ihep.ac.cn;chensz@ihep.ac.cn
Competing interests The authors declare no competing interests.
Additional information
Correspondence and requests for materials (should be addressed to Zhe Li,Shaoqiang Xi or Songzhan Chen)
The authors
Zhen Cao1,2,3,
F. Aharonian3,4,5,6,
Y.X. Bai1,3,
Y.W. Bao7,
D. Bastieri8,
X.J. Bi1,2,3,
Y.J. Bi1,3,
W. Bian7,
A.V. Bukevich9,
C.M. Cai10,
W.Y. Cao4,
Zhe Cao11,4,
J. Chang12,
J.F. Chang1,3,11,
A.M. Chen7,
E.S. Chen1,3,
G.H. Chen8,
H.X. Chen13,
Liang Chen14,
Long Chen10,
M.J. Chen1,3,
M.L. Chen1,3,11,
Q.H. Chen10,
S. Chen15,
S.H. Chen1,2,3,
S.Z. Chen1,3,
T.L. Chen16,
X.B. Chen17,
X.J. Chen10,
Y. Chen17,
N. Cheng1,3,
Y.D. Cheng1,2,3,
M.C. Chu18,
M.Y. Cui12,
S.W. Cui19,
X.H. Cui20,
Y.D. Cui21,
B.Z. Dai15,
H.L. Dai1,3,11,
Z.G. Dai4,
Danzengluobu16,
Y.X. Diao10,
X.Q. Dong1,2,3,
K.K. Duan12,
J.H. Fan8,
Y.Z. Fan12,
J. Fang15,
J.H. Fang13,
K. Fang1,3,
C.F. Feng22,
H. Feng1,
L. Feng12,
S.H. Feng1,3,
X.T. Feng22,
Y. Feng13,
Y.L. Feng16,
S. Gabici23,
B. Gao1,3,
C.D. Gao22,
Q. Gao16,
W. Gao1,3,
W.K. Gao1,2,3,
M.M. Ge15,
T.T. Ge21,
L.S. Geng1,3,
G. Giacinti7,
G.H. Gong24,
Q.B. Gou1,3,
M.H. Gu1,3,11,
F.L. Guo14,
J. Guo24,
X.L. Guo10,
Y.Q. Guo1,3,
Y.Y. Guo12,
Y.A. Han25,
O.A. Hannuksela18,
M. Hasan1,2,3,
H.H. He1,2,3,
H.N. He12,
J.Y. He12,
X.Y. He12,
Y. He10,
S. Hernández-Cadena7,
B.W. Hou1,2,3,
C. Hou1,3,
X. Hou26,
H.B. Hu1,2,3,
S.C. Hu1,3,27,
C. Huang17,
D.H. Huang10,
J.J. Huang1,2,3,
T.Q. Huang1,3,
W.J. Huang21,
X.T. Huang22,
X.Y. Huang12,
Y. Huang1,3,27,
Y.Y. Huang17,
X.L. Ji1,3,11,
H.Y. Jia10,
K. Jia22,
H.B. Jiang1,3,
K. Jiang11,4,
X.W. Jiang1,3,
Z.J. Jiang15,
M. Jin10,
S. Kaci7,
M.M. Kang28,
I. Karpikov9,
D. Khangulyan1,3,
D. Kuleshov9,
K. Kurinov9,
B.B. Li19,
Cheng Li11,4,
Cong Li1,3,
D. Li1,2,3,
F. Li1,3,11,
H.B. Li1,2,3,
H.C. Li1,3,
Jian Li4,
Jie Li1,3,11,
K. Li1,3,
L. Li29,
R.L. Li12,
S.D. Li14,2,
T.Y. Li7,
W.L. Li7,
X.R. Li1,3,
Xin Li11,4,
Y. Li7,
Y.Z. Li1,2,3,
Zhe Li1,3,
Zhuo Li30,
E.W. Liang31,
Y.F. Liang31,
S.J. Lin21,
B. Liu12,
C. Liu1,3,
D. Liu22,
D.B. Liu7,
H. Liu10,
H.D. Liu25,
J. Liu1,3,
J.L. Liu1,3,
J.R. Liu10,
M.Y. Liu16,
R.Y. Liu17,
S.M. Liu10,
W. Liu1,3,
X. Liu10,
Y. Liu8,
Y. Liu10,
Y.N. Liu24,
Y.Q. Lou24,
Q. Luo21,
Y. Luo7,
H.K. Lv1,3,
B.Q. Ma25,30,
L.L. Ma1,3,
X.H. Ma1,3,
J.R. Mao26,
Z. Min1,3,
W. Mitthumsiri32,
G.B. Mou33,
H.J. Mu25,
A. Neronov23,
K.C.Y. Ng18,
M.Y. Ni12,
L. Nie10,
L.J. Ou8,
P. Pattarakijwanich32,
Z.Y. Pei8,
J.C. Qi1,2,3,
M.Y. Qi1,3,
J.J. Qin4,
A. Raza1,2,3,
C.Y. Ren12,
D. Ruffolo32,
A. Sáiz32,
D. Semikoz23,
L. Shao19,
O. Shchegolev9,34,
Y.Z. Shen17,
X.D. Sheng1,3,
Z.D. Shi4,
F.W. Shu29,
H.C. Song30,
Yu.V. Stenkin9,34,
V. Stepanov9,
Y. Su12,
D.X. Sun4,12,
H. Sun22,
Q.N. Sun1,3,
X.N. Sun31,
Z.B. Sun35,
N.H. Tabasam22,
J. Takata36,
P.H.T. Tam21,
H.B. Tan17,
Q.W. Tang29,
R. Tang7,
Z.B. Tang11,4,
W.W. Tian2,20,
C.N. Tong17,
L.H. Wan21,
C. Wang35,
G.W. Wang4,
H.G. Wang8,
J.C. Wang26,
K. Wang30,
Kai Wang17,
Kai Wang36,
L.P. Wang1,2,3,
L.Y. Wang1,3,
L.Y. Wang19,
R. Wang22,
W. Wang21,
X.G. Wang31,
X.J. Wang10,
X.Y. Wang17,
Y. Wang10,
Y.D. Wang1,3,
Z.H. Wang28,
Z.X. Wang15,
Zheng Wang1,3,11,
D.M. Wei12,
J.J. Wei12,
Y.J. Wei1,2,3,
T. Wen1,3,
S.S. Weng33,
C.Y. Wu1,3,
H.R. Wu1,3,
Q.W. Wu36,
S. Wu1,3,
X.F. Wu12,
Y.S. Wu4,
S.Q. Xi1,3,
J. Xia4,12,
J.J. Xia10,
G.M. Xiang14,2,
D.X. Xiao19,
G. Xiao1,3,
Y.L. Xin10,
Y. Xing14,
D.R. Xiong26,
Z. Xiong1,2,3,
D.L. Xu7,
R.F. Xu1,2,3,
R.X. Xu30,
W.L. Xu28,
L. Xue22,
D.H. Yan15,
T. Yan1,3,
C.W. Yang28,
C.Y. Yang26,
F.F. Yang1,3,11,
L.L. Yang21,
M.J. Yang1,3,
R.Z. Yang4,
W.X. Yang8,
Z.H. Yang7,
Z.G. Yao1,3,
X.A. Ye12,
L.Q. Yin1,3,
N. Yin22,
X.H. You1,3,
Z.Y. You1,3,
Q. Yuan12,
H. Yue1,2,3,
H.D. Zeng12,
T.X. Zeng1,3,11,
W. Zeng15,
X.T. Zeng21,
M. Zha1,3,
B.B. Zhang17,
B.T. Zhang1,3,
C. Zhang17,
F. Zhang10,
H. Zhang7,
H.M. Zhang31,
H.Y. Zhang15,
J.L. Zhang20,
Li Zhang15,
P.F. Zhang15,
P.P. Zhang4,12,
R. Zhang12,
S.R. Zhang19,
S.S. Zhang1,3,
W.Y. Zhang19,
X. Zhang33,
X.P. Zhang1,3,
Yi Zhang1,12,
Yong Zhang1,3,
Z.P. Zhang4,
J. Zhao1,3,
L. Zhao11,4,
L.Z. Zhao19,
S.P. Zhao12,
X.H. Zhao26,
Z.H. Zhao4,
F. Zheng35,
W.J. Zhong17,
B. Zhou1,3,
H. Zhou7,
J.N. Zhou14,
M. Zhou29,
P. Zhou17,
R. Zhou28,
X.X. Zhou1,2,3,
X.X. Zhou10,
B.Y. Zhu4,12,
C.G. Zhu22,
F.R. Zhu10,
H. Zhu20,
K.J. Zhu1,2,3,11,
Y.C. Zou36,
X. Zuo1,3,
(The LHAASO Collaboration)
and Oscar Macias37,38
1 State Key Laboratory of Particle Astrophysics & Experimental Physics Division & Computing Center, Institute of High Energy Physics, Chinese Academy of Sciences, 100049 Beijing, China
2 University of Chinese Academy of Sciences, 100049 Beijing, China
3 TIANFU Cosmic Ray Research Center, Chengdu, Sichuan, China
4 University of Science and Technology of China, 230026 Hefei, Anhui, China
5 Yerevan State University, 1 Alek Manukyan Street, Yerevan 0025, Armeni a
6 Max-Planck-Institut for Nuclear Physics, P.O. Box 103980, 69029 Heidelberg, Germany
7 Tsung-Dao Lee Institute & School of Physics and Astronomy, Shanghai Jiao Tong University, 200240 Shanghai, China
8 Center for Astrophysics, Guangzhou University, 510006 Guangzhou, Guangdong, China
9 Institute for Nuclear Research of Russian Academy of Sciences, 117312 Moscow, Russia
10 School of Physical Science and Technology & School of Information Science and Technology, Southwest Jiaotong University, 610031 Chengdu, Sichuan, China
11 State Key Laboratory of Particle Detection and Electronics, China
12 Key Laboratory of Dark Matter and Space Astronomy & Key Laboratory of Radio Astronomy, Purple Mountain Observatory, Chinese Academy of Sciences, 210023 Nanjing, Jiangsu, China
13 Research Center for Astronomical Computing, Zhejiang Laboratory, 311121 Hangzhou, Zhejiang, China
14 Shanghai Astronomical Observatory, Chinese Academy of Sciences, 200030 Shanghai, China
15 School of Physics and Astronomy, Yunnan University, 650091 Kunming, Yunnan, China
16 Key Laboratory of Cosmic Rays (Tibet University), Ministry of Education, 850000 Lhasa, Tibet, China
17 School of Astronomy and Space Science, Nanjing University, 210023 Nanjing, Jiangsu, China
18 Department of Physics, The Chinese University of Hong Kong, Shatin, New Territories, Hong Kong, China
19 Hebei Normal University, 050024 Shijiazhuang, Hebei, China
20 Key Laboratory of Radio Astronomy and Technology, National Astronomical Observatories, Chinese Academy of Sciences, 100101 Beijing, China
21 School of Physics and Astronomy (Zhuhai) & School of Physics (Guangzhou) & Sino-French Institute of Nuclear Engineering and Technology (Zhuhai), Sun Yat-sen University, 519000 Zhuhai & 510275 Guangzhou, Guangdong, China
22 Institute of Frontier and Interdisciplinary Science, Shandong University, 266237 Qingdao, Shandong, China
23 APC, Université Paris Cité, CNRS/IN2P3, CEA/IRFU, Observatoire de Paris, 119 75205 Paris, France
24 Department of Engineering Physics & Department of Physics & Department of Astronomy, Tsinghua University, 100084 Beijing, China
25 School of Physics and Microelectronics, Zhengzhou University, 450001 Zhengzhou, Henan, China
26 Yunnan Observatories, Chinese Academy of Sciences, 650216 Kunming, Yunnan, China
27 China Center of Advanced Science and Technology, Beijing 100190, China
28 College of Physics, Sichuan University, 610065 Chengdu, Sichuan, China
29 Center for Relativistic Astrophysics and High Energy Physics, School of Physics and Materials Science & Institute of Space Science and Technology, Nanchang University, 330031 Nanchang, Jiangxi, China
30 School of Physics & Kavli Institute for Astronomy and Astrophysics, Peking University, 100871 Beijing, China
31 Guangxi Key Laboratory for Relativistic Astrophysics, School of Physical Science and Technology, Guangxi University, 530004 Nanning, Guangxi, China
32 Department of Physics, Faculty of Science, Mahidol University, Bangkok 10400, Thailand
33 School of Physics and Technology, Nanjing Normal University, 210023 Nanjing, Jiangsu, China
34 Moscow Institute of Physics and Technology, 141700 Moscow, Russia
35 National Space Science Center, Chinese Academy of Sciences, 100190 Beijing, China
36 School of Physics, Huazhong University of Science and Technology, Wuhan 430074, Hubei, China
37 Department of Physics and Astronomy, San Francisco State University, San Francisco, CA 94132, USA
38 GRAPPA Institute, University of Amsterdam, 1098 XH Amsterdam, The Netherlands.