eprint
Terahertz field-induced giant symmetry modulations in a van der Waals antiferromagnet
Strong-field terahertz (THz) excitations enable dynamic control over electronic, lattice and symmetry degrees of freedom in quantum materials. Here, we uncover pronounced terahertz-induced symmetry modulations and coherent phonon dynamics in the van der Waals antiferromagnet MnPS3, in which inversion symmetry is broken by its antiferromagnetic spin configuration. Time-resolved second harmonic generation measurements reveal long-lived giant oscillations in the antiferromagnetic phase, with amplitudes comparable to the equilibrium signal, driven by phonons involving percent-level atomic displacements relative to the equilibrium bond lengths. The temporal evolution of the rotational anisotropy patterns indicate a dynamic breaking of mirror symmetry, modulated by two vibrational modes at 1.7 THz and 4.5 THz, with the former corresponding to a hidden mode not observed in equilibrium spectroscopy. We show that these effects arise in part from a field-induced charge rearrangement mechanism that lowers the local crystal symmetry, and couples to the phonon modes. A long-lived field-driven response was uncovered with a complex THz polarization dependence which, in comparison to theory, indicates evidence for an antiferromagnetic-to-ferrimagnetic transition. Our results establish an effective field-tunable pathway for driving excitations otherwise weak in equilibrium, and for manipulating magnetism in low-dimensional materials via dynamical modulation of symmetry.
Tailored intense laser pulses have emerged as a versatile tool to dynamically study quantum phenomena [1, 2, 3, 4, 5, 6] that are otherwise inaccessible by static tuning parameters such as pressure, voltage, strain, and temperature. Particularly, strong-field THz excitation of materials has attracted considerable interest for its unique ability to selectively drive low-energy collective modes. This includes THz-induced superconductivity [7, 8], ferroelectricity [9, 10], metal-insulator transition [11], topological phase transition [12], chirality [13], and ferromagnetism [14, 15]. Thus, harnessing coherent THz control could shed light on open questions in condensed matter and unlock a wide array of opportunities for next-generation photonics [16, 17].
A major theme in the study of correlated systems is magnetism, and advances in ultrafast laser sources facilitate optical manipulation of exotic magnetic phases on pico- or femtosecond timescales [14, 15, 18, 19]. Antiferromagnets (AFM) are promising candidates for ultrafast spintronic applications since their zero net magnetization, originating from antiparallel spin configuration, enables much faster magnetic dynamics than ferromagnets (FM). Recently, honeycomb van der Waals (vdW) AFMs from the group PS3 ( = Mn, Ni or Fe) have gained popularity for their layered structure, permitting tunable interlayer coupling, integration into heterostructures, and access to low-dimensional magnetism [20, 21, 22, 23, 24, 25, 26, 27]. Depending on the transition metal , distinct AFM orders can emerge, giving rise to unconventional on-demand functionalities that are amenable to optical stimuli. Accordingly, experimental efforts using various time-resolved techniques have been made to uncover how ultrafast optical excitations disentangle lattice, charge, and magnetic degrees of freedom in these systems [28, 29, 30, 31, 32, 33].
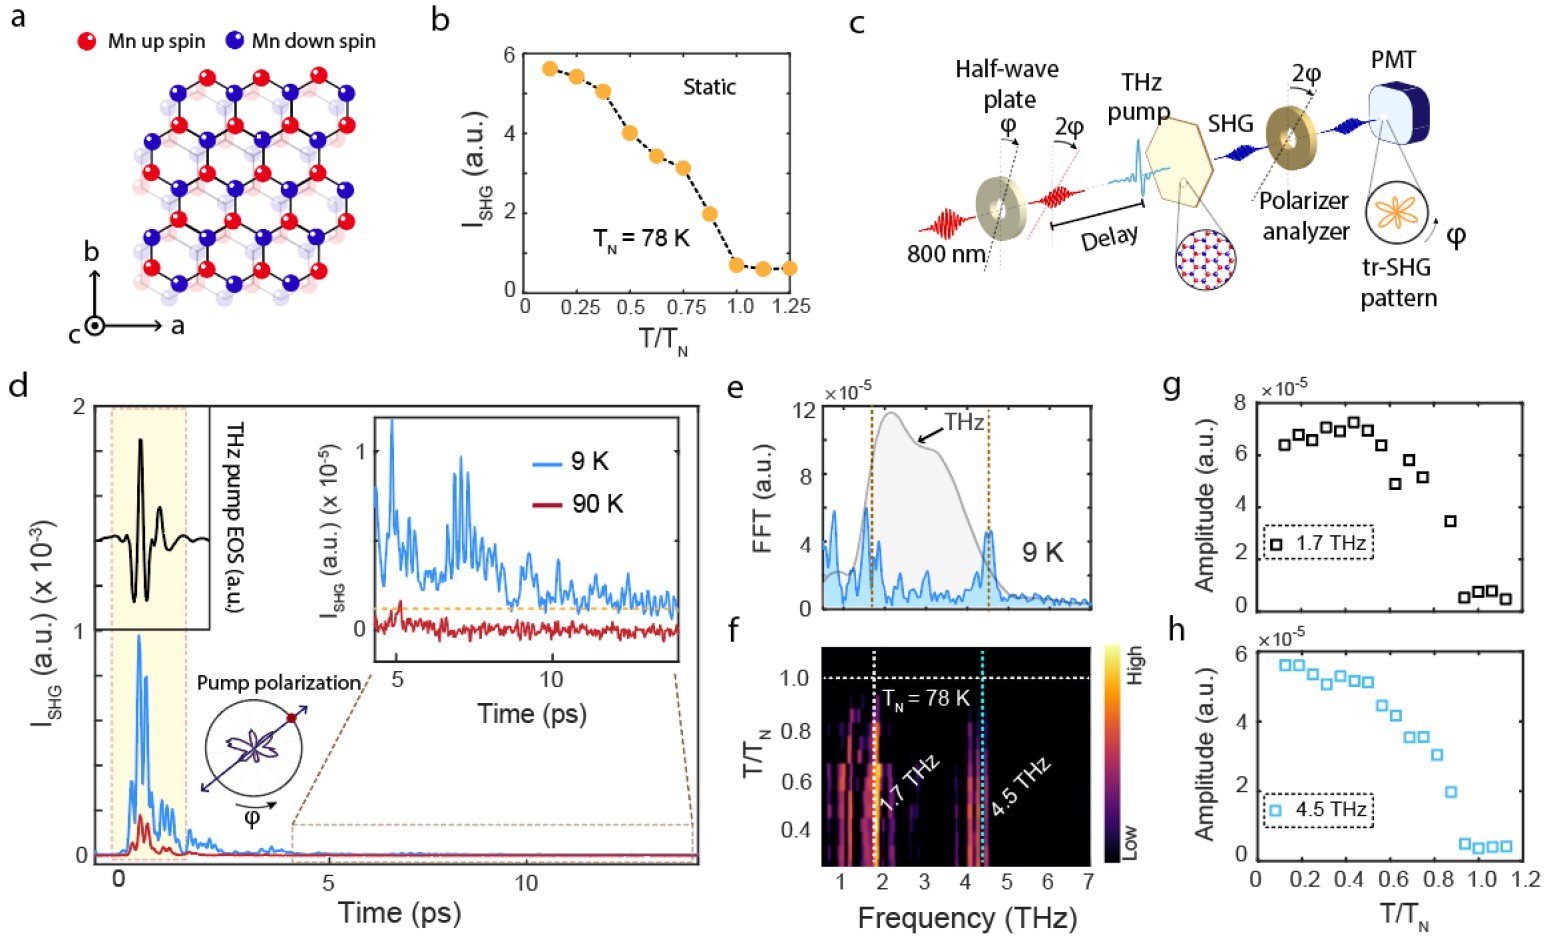
In MnPS3, a honeycomb lattice in the plane is formed by Mn atoms with alternating out-of-plane spins (Fig. 1a), resulting in a Néel AFM order below K [34, 35, 36, 37]. A crucial feature that makes this material distinct from zigzag AFMs FePS3 and NiPS3 is that the AFM ordering in MnPS3 breaks inversion symmetry which leads to non-zero second harmonic generation (SHG) below (Fig. 1b–c) [25, 38, 39, 40]. Essentially, the SHG in MnPS3 is primarily linked with its spin texture since the structure remains centrosymmetric at all temperatures [41, 37, 42]. Owing to this unique property, SHG combined with ultrafast techniques is well-suited for monitoring collective dynamics of magnetic order together with symmetry, structural distortion and electronic reconfiguration under strong-field laser excitation [43, 44, 33].
Terahertz-induced dynamics and giant oscillations
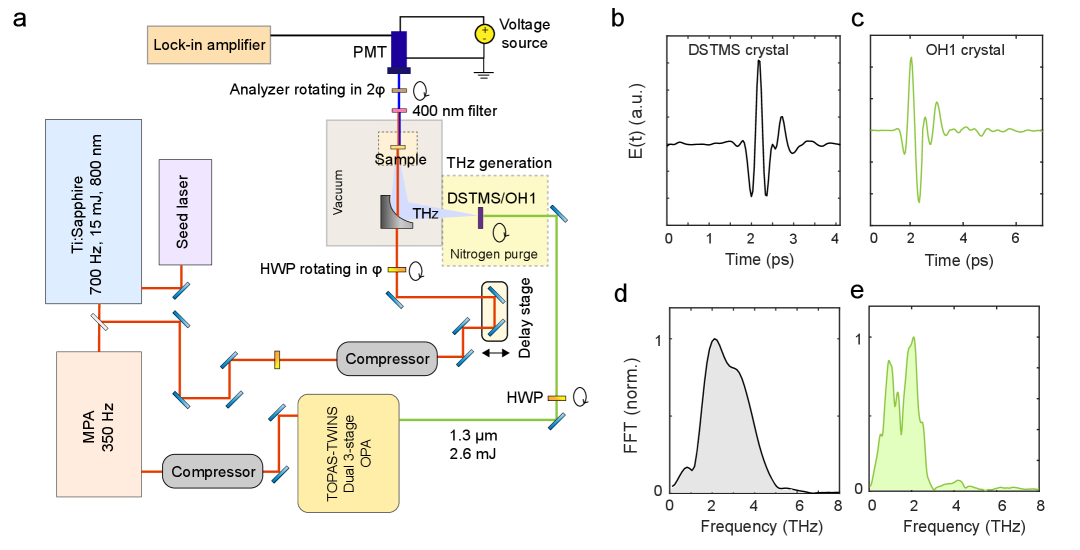
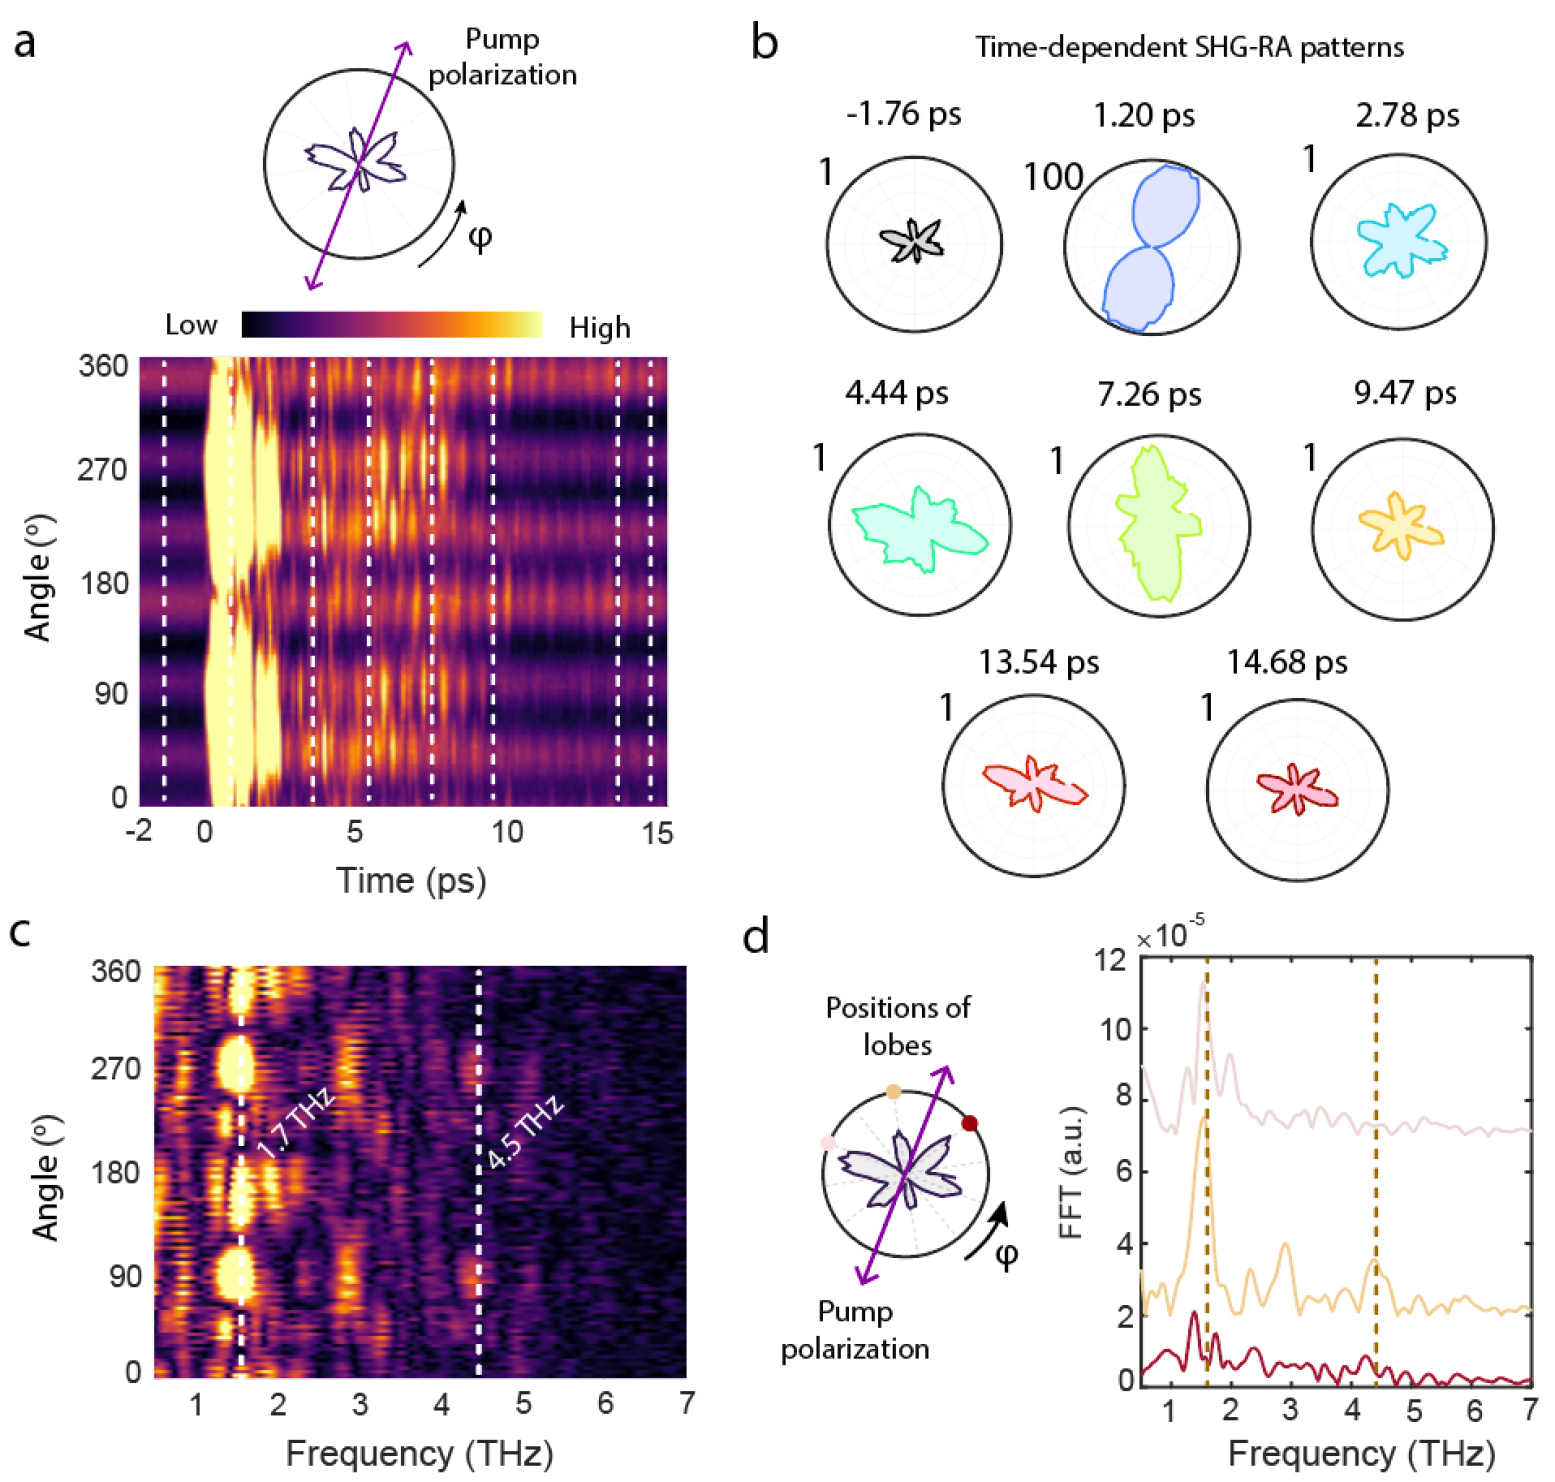
We use an 800 nm optical probe pulse, time-delayed with respect to a THz excitation (pump) pulse, to generate the SHG signal at 400 nm. By utilizing a time- and angle-resolved SHG system (Fig. 1d), we track the pump-induced dynamics in the SHG response of as a function of the pump–probe delay and the polarizer analyzer angle . Fig. 1e presents the temporal evolution of the THz-induced SHG intensity , measured at a lobe position of the static SHG rotational anisotropy (SHG-RA) pattern (red circle), with the THz pump polarization (peak field 500 kV/cm) aligned along the same lobe direction (dark blue arrow). Data are shown for temperatures below (9 K, blue) and above (90 K, red) the Néel temperature . The earlier-time dynamics (0–2 ps, yellow-shaded region) which is dominated by a sharp increase in SHG when the THz field is on, corresponds to THz field-induced second harmonic – TFISH [45, 46]. This is an instantaneous response and is predominantly quadratic in THz field. For comparison, the temporal profile of the pump pulse is depicted with a vertical offset (black curve). We note that while the 90 K signal remains featureless at later times, the 9 K signal exhibits pronounced oscillations with amplitudes on the same order as the equilibrium SHG intensity (inset). The fast Fourier transform (FFT) of the signal in Fig. 1f reveals two pronounced peaks: one at 1.7 THz, attributed to a theoretically predicted weakly Raman-active phonon with symmetry that has not been observed in equilibrium Raman spectroscopy [34, 35], and another at 4.5 THz, associated with modes that are both infrared- (IR) and Raman-active (symmetry: ), as seen in equilibrium spectra (Supplementary Fig. 1) [35, 44].
The intensity colormap in Fig. 1g plots the FFT spectra as a function of temperature. It is observed that as the temperature increases, the 1.7 THz and 4.5 THz mode amplitudes decrease, vanishing near (dashed horizontal line). Vertical linecuts highlight the order parameter-like temperature dependence of the 1.7 THz (Fig. 1h) and 4.5 THz (Fig. 1i) modes. These results unambiguously indicate that the observed giant coherent phonon signal emerges only in the AFM phase, underscoring the role of magnetically-induced inversion symmetry-breaking to enable coupling to the THz field.
Spectral fingerprints of symmetry modulation
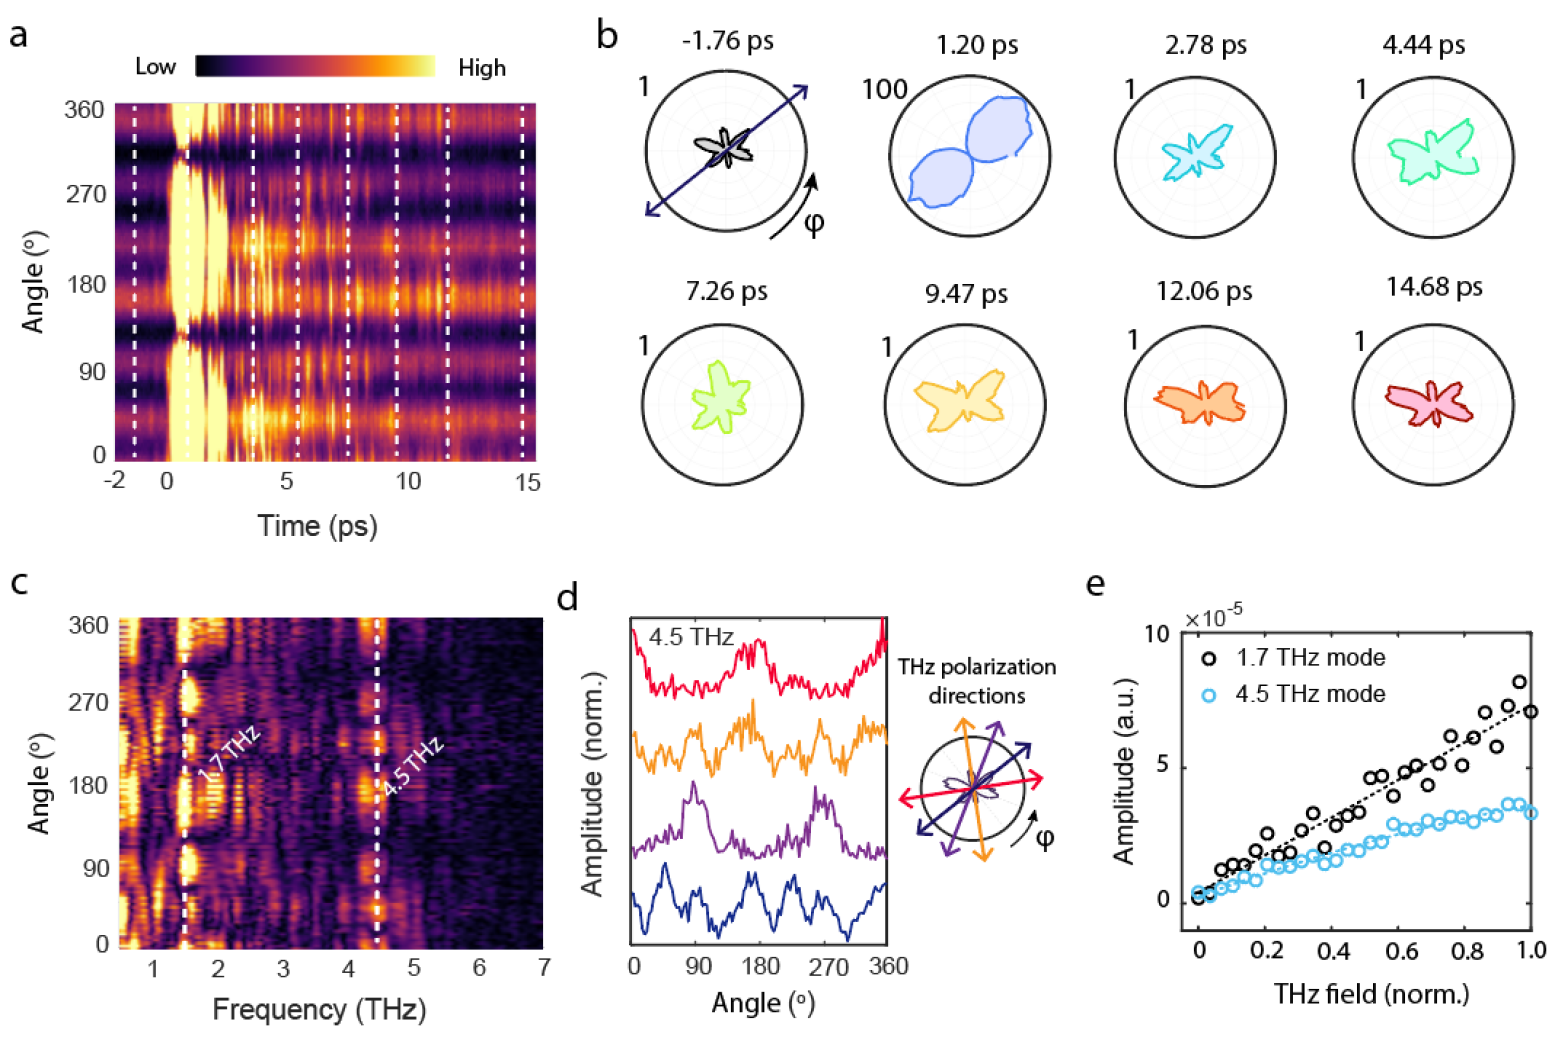
Figure 2a presents the full time evolution of the SHG signal at 9 K as a function of analyzer angle, displayed as a 2D intensity colormap. In equilibrium (i.e., at negative time delays), a periodicity is observed, consistent with the six-lobe structure of the static SHG-RA pattern (Fig. 1b). As the THz pulse (polarized along a lobe of the SHG-RA pattern) arrives at ps, the signal is initially dominated by the TFISH response. At later times, beyond the TFISH regime, clear long-lived coherent oscillations appear, persisting up to 15 ps. Vertical linecuts (dashed white lines) plot SHG-RA patterns at different pump-probe delays as illustrated in Fig. 2b. Although six-lobe SHG-RA patterns reappear at later times ( ps), they show notable deviations from the nearly-symmetric equilibrium pattern observed at ps (black polar plot), exhibiting unequal lobe intensities and distortions that break the original mirror symmetry (see the movies in the Supplementary Materials).
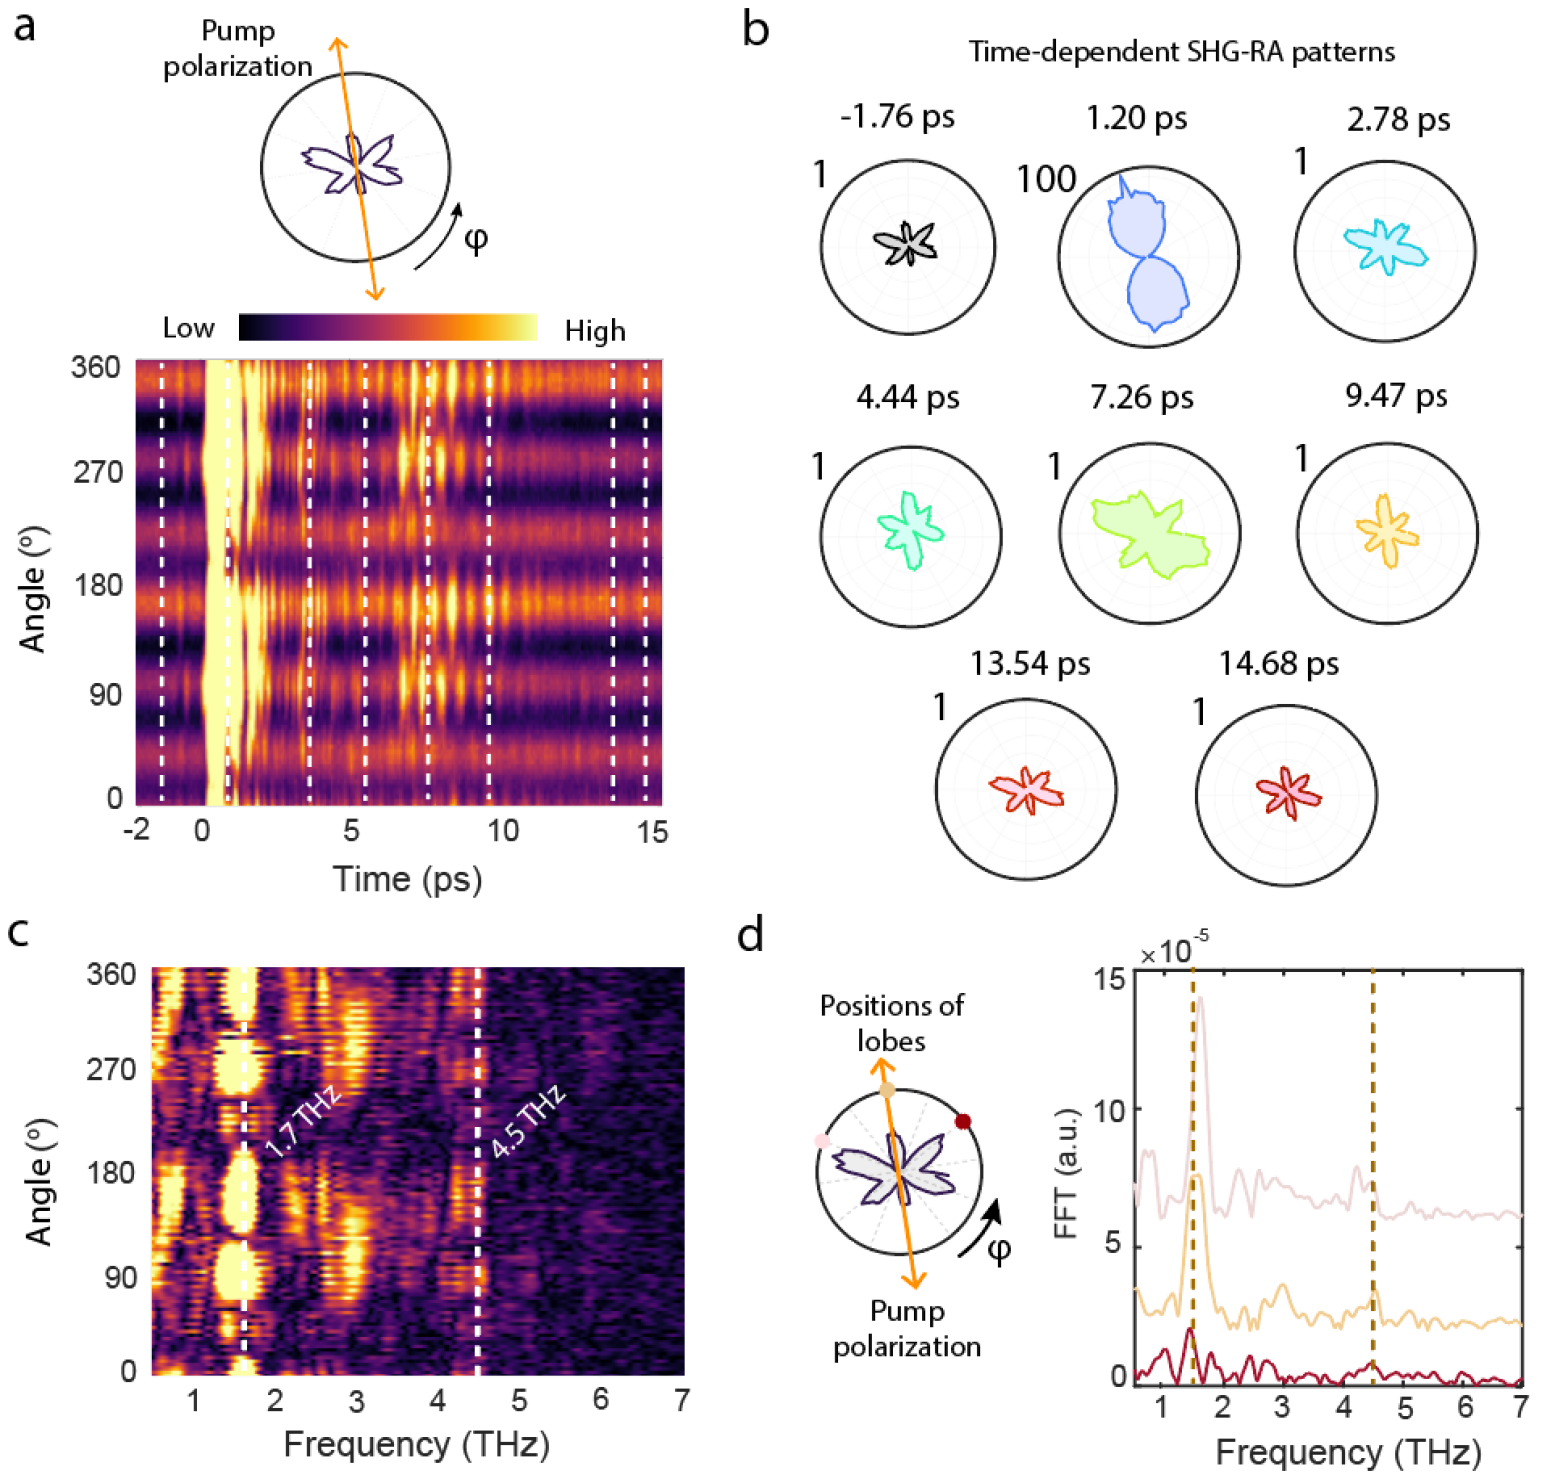
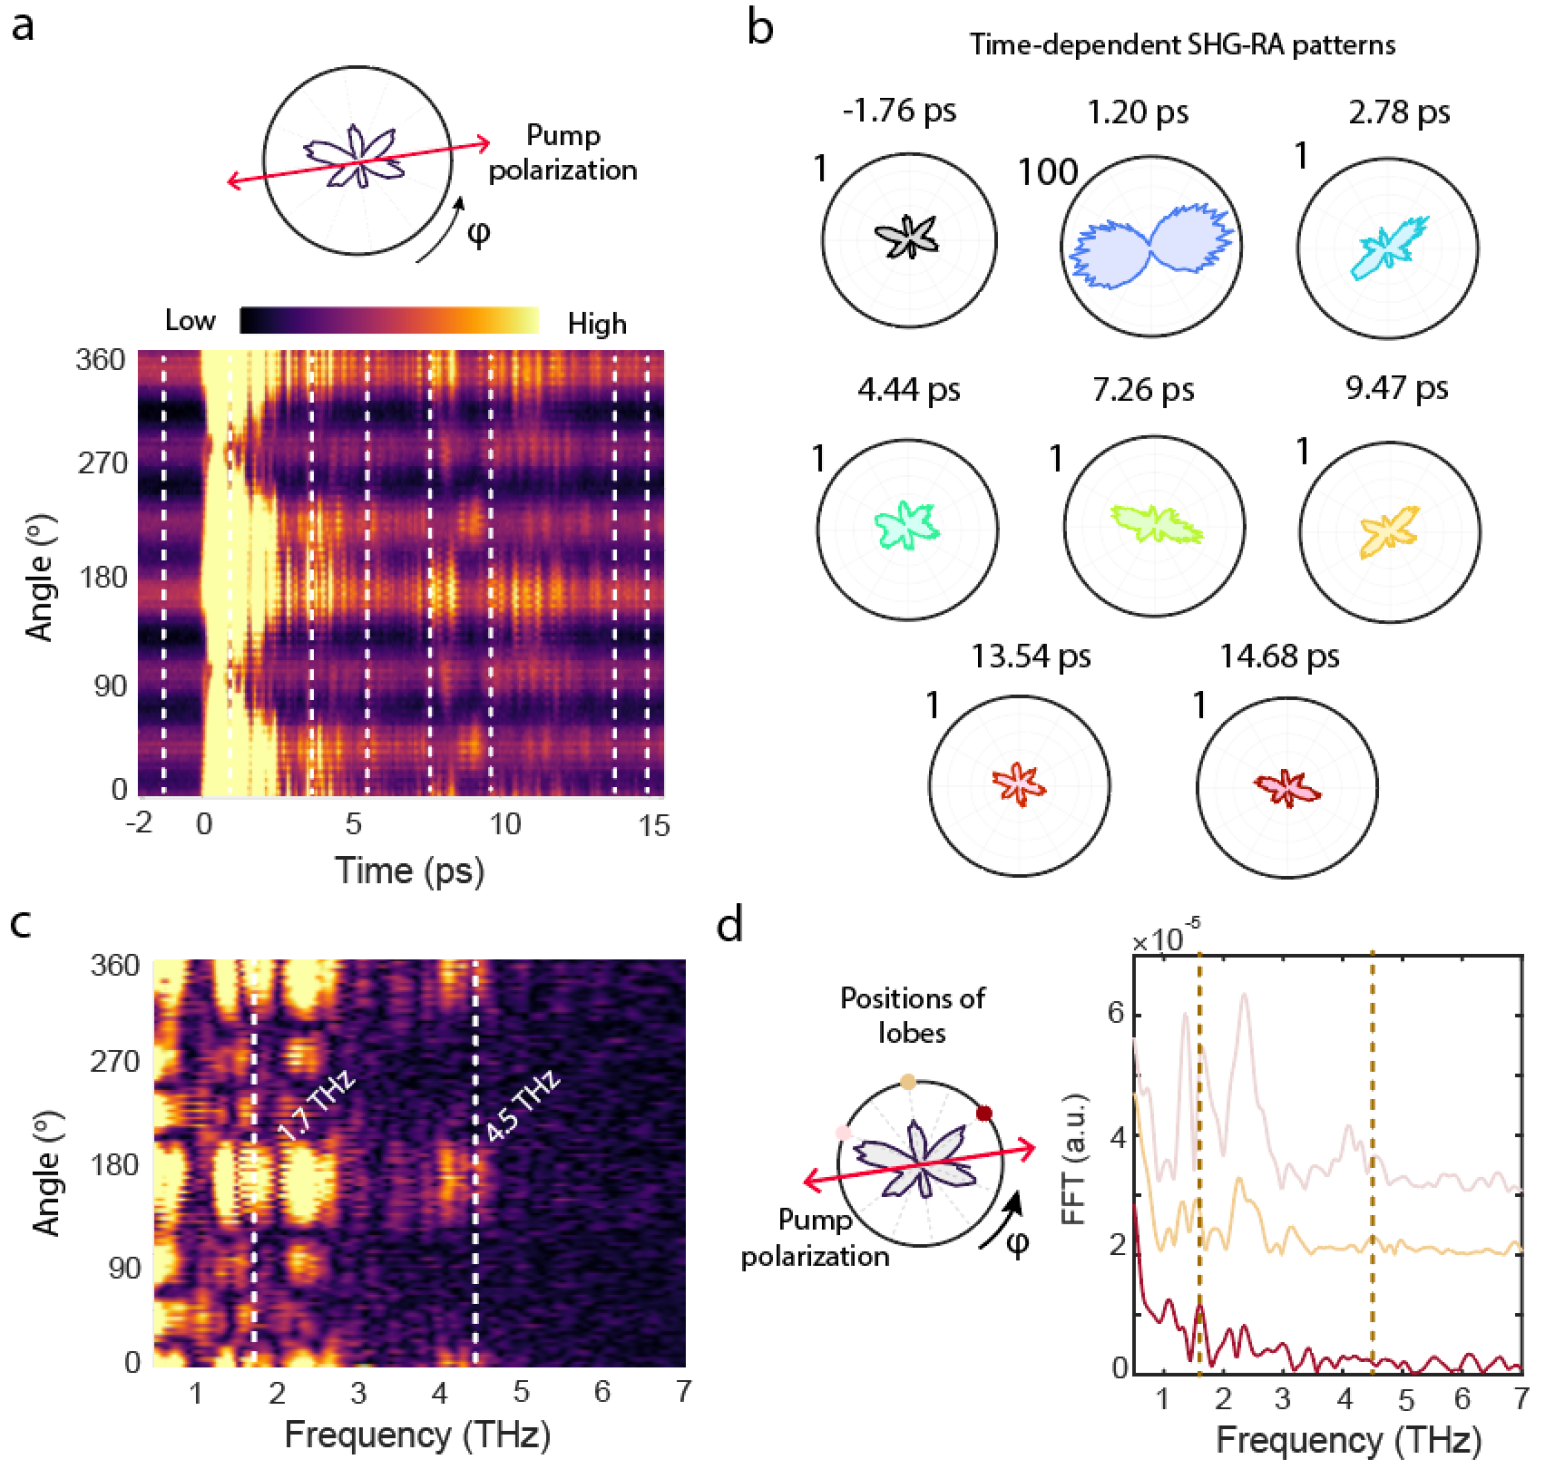
Coherent modes at 1.7 THz and 4.5 THz are detected in the FFT spectra (Fig. 2c). When the THz field is applied along a lobe of the SHG-RA pattern, the mode amplitudes exhibit a periodicity, mirroring the angular dependence shown in Fig. 2a. Strikingly, when the THz pulse is polarized along the nodes of the SHG-RA pattern, the 4.5 THz mode shows a periodicity outlined in Fig. 2d (more details in Extended Data Figs. 2–4), inferring a strong dependence of mode symmetry upon the pump polarization. As shown in Fig. 2e, both 1.7 THz and 4.5 THz mode signals exhibit a notable linear dependence on the THz field strength, indicative of a linear excitation process (see also Extended Data Fig. 5).
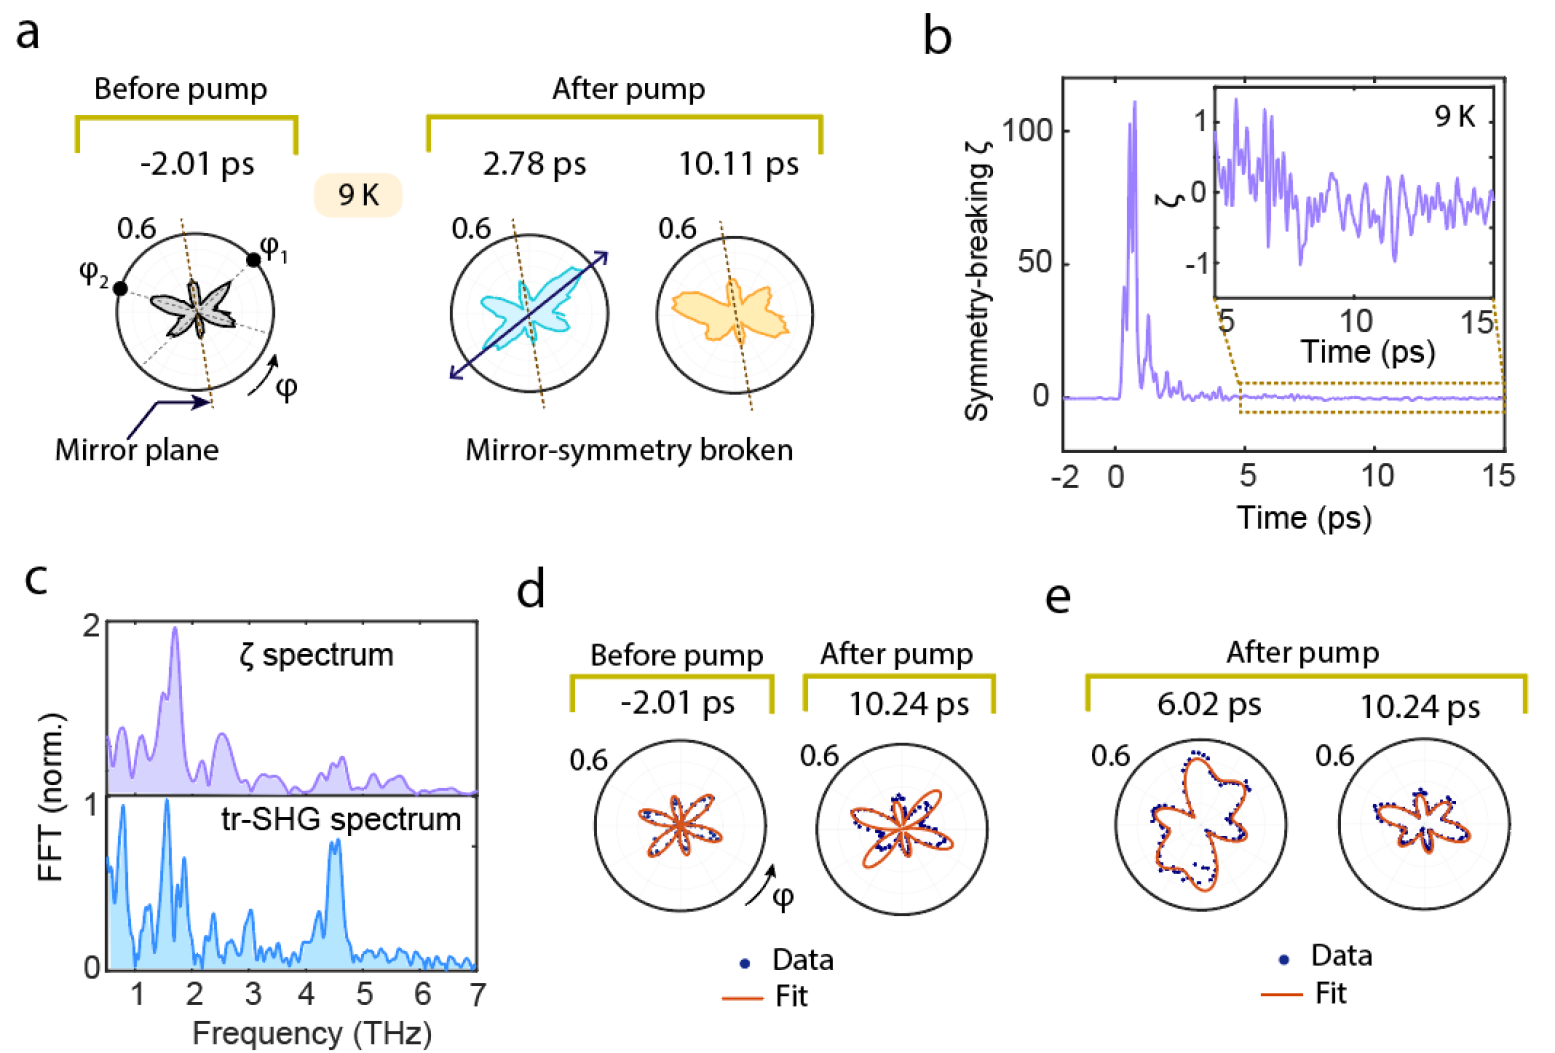
Figure 3a demonstrates that the equilibrium SHG-RA pattern measured at ps is symmetric with respect to its mirror plane (brown dashed line corresponding to the -plane) [38]. In contrast, the nonequilibrium patterns at later times – i.e., ps and ps – show a clear breaking of mirror symmetry, manifested in unequal intensities between lobes connected by the mirror plane. To quantify the degree of mirror symmetry modulation in the SHG-RA patterns, we define a normalized asymmetry parameter . Here, is the time-resolved SHG (tr-SHG) intensity, is the static SHG intensity, and are mirror-symmetric angles, and defines the angular integration window. The dynamics of at 9 K is displayed in Fig. 3b, with oscillatory signal emerging at later times (inset). Fig. 3c shows the FFT spectrum which shows the 1.7 THz and 4.5 THz modes (top), in accord with the tr-SHG spectrum (bottom). Overall, this striking resemblance in spectral fingerprints identifies the phonons as key contributors to the dynamical symmetry-breaking process.
We examine the possibility of phenomenologically fitting the tr-SHG patterns as a function of analyzer angle using the fitting function which corresponds to the expected functional form of the polar patterns based on the equilibrium symmetry [25]. Here, and are complex fit parameters, and depend on the elements of susceptibility tensor. Although the model accurately describes the equilibrium SHG-RA patterns, it falls short in capturing the symmetry-breaking features present in the nonequilibrium data (Fig. 3d), necessitating the inclusion of additional terms. To address this, we introduce two new complex time-dependent parameters and , which account for nonlinear susceptibility components that become symmetry-allowed in the reduced-symmetry nonequilibrium state. This leads to an extended fitting function: , yielding a good agreement with the nonequilibrium SHG-RA patterns at later times as shown in Fig. 3e (for details, see Supplementary Materials).
Importantly, the nonequilibrium parameters ( and ) are comparable in magnitude to the equilibrium ones ( and ), substantiating a strong and distinctive dynamical modulation of symmetry mediated by driven coherent phonons. A similar analysis for THz polarization along a node is presented in Supplementary Fig. 5.
Phonon-mediated magnetic manipulation via field-induced charge rearrangement
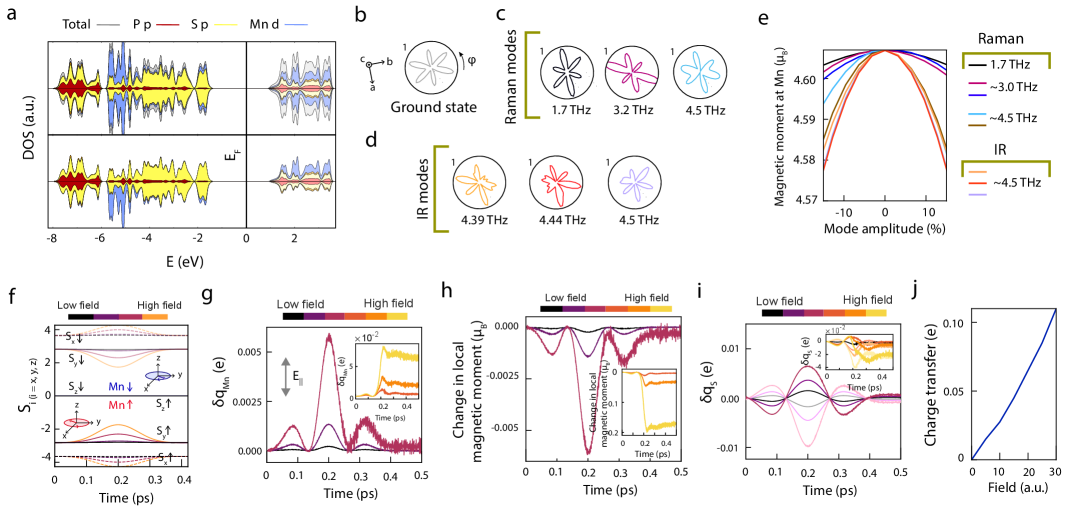
Insight into the SHG response of MnPS3 can be gained using real-time time-dependent density functional theory (rt-TDDFT) simulations based on our proposed tight-binding model. The model includes hopping processes between Mn–-Mn, Mn–-S, and S–-S atomic pairs, involving Mn 3 and S 3 orbitals, as well as electronic interactions among Mn 3 electrons (Extended Data Fig. 6a). The effect of the probe field (frequency ) is embedded into the model through light-matter coupling, using the Peierls substitution method [47]. The SHG yield is extracted from the peak at in the Fourier transform of the current density computed using rt-TDDFT along the probe polarization direction (see Methods). Repeating this procedure across all polarization angles allows for the reconstruction of the static SHG-RA pattern, as displayed in Fig. 4a (gray polar plot).
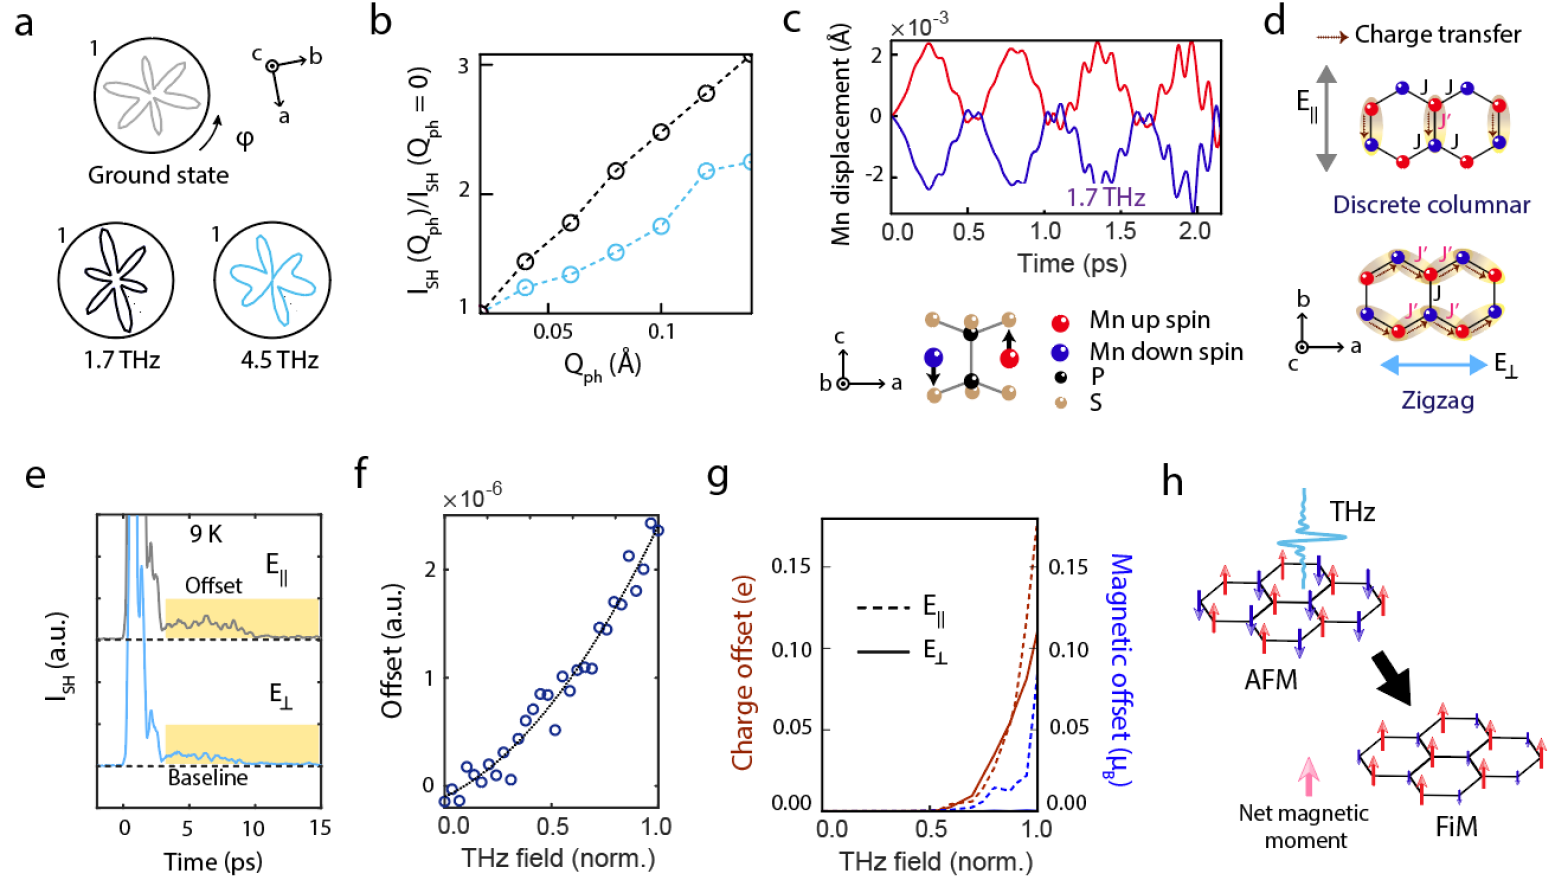
Introducing atomic displacements corresponding to low-frequency phonons into the equilibrium SHG structure can delineate how phonon modes influence the SHG-RA pattern and its mirror symmetry. Figure 4a shows the computed SHG-RA patterns with atomic displacements frozen along the 1.7 THz and 4.5 THz Raman-active modes. Each mode induces pronounced deviations from the ground state pattern, exhibiting distinct modulations of the SHG symmetry (see Methods and Extended Data Fig. 6b–e). We note that the SHG-RA patterns show uneven mirror-connected lobes, in concert with our experimental observations of dynamical symmetry modulation, further supporting the role of select Raman-active phonons. The calculated SHG intensity at a lobe as a function of phonon amplitude is shown in Fig. 4b, revealing a linear scaling for all Raman modes. At sufficiently large phonon amplitudes (i.e., 2% of the equilibrium Mn–S bond length), the SHG intensity modulation closely matches that observed in experiment.
Given the importance of phonons in the SHG symmetry, we examine the microscopic mechanism by which these modes are coherently driven by the THz field and exhibit linear field dependence. While there is a known IR-active 4.5 THz mode that can be resonantly excited by the tail of the THz pump pulse spectrum (Extended Data Table 2), the 1.7 THz mode is largely optically inactive, not observed in equilibrium spectroscopy (Supplementary Fig. 1), and therefore requires a unique field-driven interaction. We can further rule out excitation via the THz magnetic field , since it only drives in-phase Mn spin precession without exciting any phonons or magnons, as confirmed by the rt-TDDFT calculations with external magnetic field (Extended Data Fig. 6f). Hence, the THz electric field provides the viable excitation pathway for the phonon modes.
shifts the on-site energies of Mn and S orbitals, modifying Mn–S hybridization and enabling charge transfer between Mn and S atoms [48]. This charge redistribution modulates the local magnetic moments at Mn sites and dynamically distorts the crystal field environment of the surrounding S atoms, in turn driving phonons through electron–phonon coupling. To investigate this possibility, we performed constrained DFT calculations in which 0.2% of the electrons were transferred from the top of the valence band to the bottom of the conduction band, primarily populating minority-spin Mn orbitals. This setup captures essential features of the electronic response induced by a THz pulse – namely, hybridization between valence and conduction states, and a reduction in the magnitude of the local magnetic moments. Relaxing the atomic structure under this fixed electron distribution reveals distortions consistent with Raman-active modes, including those at 1.7 THz and 4.5 THz. At 4.5 THz frequency, IR-active modes can also be directly driven by the THz field. However, the eigenvectors of the 4.5 THz IR-active and modes feature pronounced displacements of P atoms, whereas the Raman-active and modes display minimal phosphorus involvement (Extended Data Fig 7a–b). In contrast, according to our calculations, the SHG response in MnPS3 is primarily sensitive to the Mn–S bond current. This, together with the small THz pump spectral weight around 4.5 THz (see Extended Data Fig. 1), suggests that the 4.5 THz response in tr-SHG measurement contains comparable contributions from both the IR-active modes directly excited by the THz field and Raman-active modes excited via the field-induced charge transfer mechanism (see also Supplementary Fig. 12).
Having clarified the 4.5 THz feature, we next consider the more subtle 1.7 THz response. The constrained DFT calculations show that the THz-induced reduction of the local Mn magnetic moments is accompanied by out-of-plane displacements of the opposite-spin Mn atoms in opposite directions, as depicted in Fig. 4c. This motion is reminiscent of the the 1.7 THz eigendisplacement [34], thereby suggesting a possible pathway to exciting this mode. Although multiple Raman- and IR-active modes are coherently driven under THz excitation, the 1.7 THz mode is particularly distinctive due to its absence in equilibrium spectra as well as in THz-induced birefringence/magneto-optic measurements (Supplementary Figs. 1 and 4). However, its appearance in tr-SHG underscores that its visibility under THz excitation requires sensitivity to the symmetry modulation at play. While the 1.7 THz mode is, in principle, weakly Raman-active, its linear field dependence also implies that a purely Raman-driven pathway alone cannot fully account for the experimental observations. Instead, its excitation may be better understood within the charge transfer framework, with weak IR activity – enabled by inversion symmetry breaking due to AFM order and potentially enhanced by imperfections or defects – offering an additional channel for coupling to the THz field [49, 50].
Thus, our work reveals an excitation mechanism based on a symmetry-selective, field-driven process that enables tr-SHG to access vibrational modes otherwise inaccessible via conventional linear spectroscopic techniques. Moreover, the appearance of the 1.7 THz mode, which is sensitive to change in magnetic moment, serves as a signature of dynamical magnetic manipulation by the THz field.
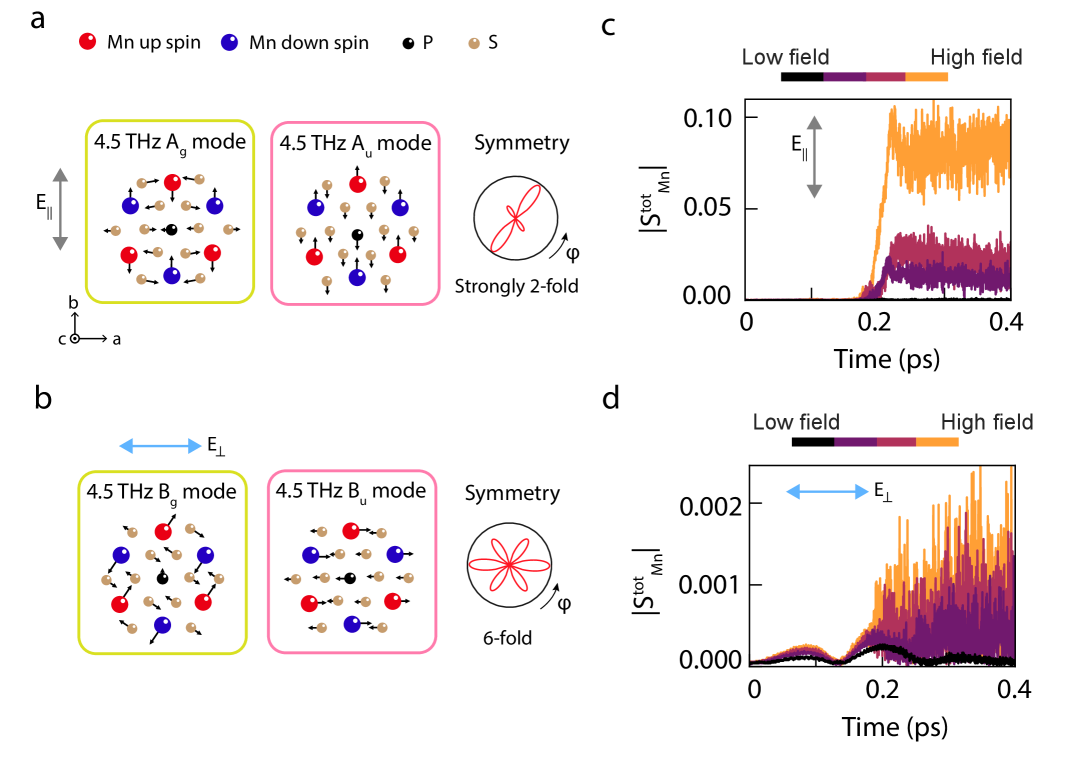
Additional support for the charge rearrangement process is found in the THz polarization dependence as showcased in Fig. 4d. In the AFM phase, when the THz field is polarized along nearest-neighbor Mn sites (), charge is transferred between Mn atoms with opposite spins in a discrete pattern. In comparison, for the THz field polarized perpendicular to Mn–Mn bonds (), the charge rearrangement occurs along Mn–Mn zigzag chains and contributions from neighboring Mn sites cancel out, resulting in zero net charge transfer. Therefore, distinct THz-induced dynamics may arise depending on the field polarization direction. In fact, this is exactly what is observed: a six-fold symmetry of the 4.5 THz mode appears in the tr-SHG spectrum when the THz field is polarized along a lobe of the SHG-RA pattern (analogous to ), and a two-fold symmetry emerges when the field is aligned along a node (), as shown in Fig. 2d. This behavior can be understood as a polarization-dependent preferential excitation of 4.5 THz IR- and Raman-active modes with different symmetries – (excited by ) and (excited by ) – accompanied by the anisotropic renormalization of specific Mn–S bonds. With applied, the bonding strength and hybridization of the six Mn–S bonds surrounding each Mn atom are altered along a single Mn–S bond direction giving rise to a two-fold response; in contrast, for , this is modulated along all three Mn–S directions, resulting in a six-fold response (more details in Methods and Extended Data Fig. 7). The IR modes (, ) are directly excited by the THz field whereas the charge rearrangement process drives the Raman modes (, ). Since the and modes are known to be sensitive to AFM ordering [37, 35], we argue that the observed dynamics arise from polarization-selective modulation of the AFM exchange interaction, activated via charge redistribution pathways.
Toward a photoinduced magnetic phase
Simulations corroborate several key features of this mechanism. As presented in Extended Data Fig. 6g, notable charge transfer from S to Mn atoms leads to an increased charge density at Mn sites. Temporal modulation of the local Mn magnetic moments was also observed (Extended Data Fig. 6h). Moreover, the degree of charge transfer from S to Mn atoms increases monotonically with pump field strength in the low-field regime (Extended Data Fig. 6i–j), compatible with an excitation process that is linear in field as observed experimentally. In particular, at higher fields, the simulations predict a long-lived offset (rectification) in the response (insets of Extended Data Fig. 6g–h), consistent with the experiments (Fig. 4e). The magnitude of the offset is strongly polarization-dependent, reaching higher values for (gray curve in Fig. 4e) than for (blue curve). As sketched in Fig. 4f, the offset grows nonlinearly with the pump field. Likewise, Fig. 4g shows simulated long-lived offsets in charge transfer from S to Mn (red curves) and net magnetic moment (blue curves), both exhibiting nonlinear dependence on the THz field. Dashed and solid lines correspond to and polarizations, respectively. Remarkably, a net magnetic moment on the Mn atoms emerges only for (dashed blue line), signaling a field-induced tendency towards ferrimagnetic (FiM) order (Extended Data Fig. 7c–d). Appearance of this net moment for may also explain the enhanced offset measured in Fig. 4e, pointing to a correspondence between the simulated magnetic transition and the polarization-sensitive SHG signal. Simulations further predict that the net magnetic moment increases with field strength which suggests a possible transition to ferromagnetic order at sufficiently high fields. Together, these results establish the pivotal role of charge rearrangement in THz-induced magnetic transitions, linking field-dependent charge and spin dynamics to dynamical symmetry modulation in MnPS3. Further experiments under controlled magnetic fields will be an important future step to conclusively establish the FiM phase.
Outlook
Our results demonstrate new mechanisms by which atomic and magnetic degrees of freedom in vdW antiferromagnetics can be dynamically controlled by THz fields. Time-resolved SHG measurements show that specific Raman-active phonons are efficiently excited via linear-in-field mechanisms linked to charge redistribution. This modifies the nonlinear susceptibility in a manner that breaks mirror symmetry and launch large-amplitude oscillations in the SHG-RA patterns. The polarization dependence of the symmetry modulation dynamics, the observation of new phonon modes (specifically at 1.7 THz), and correlated first principles theory provides support for this and points towards the possibility of accessing new metastable magnetic phases. Extending this framework to other quantum magnets or inversion symmetry-broken systems may enable targeted control of phase transitions, coherent switching between magnetic states, or the design of advanced nonlinear optical functionalities. More broadly, our findings provide a roadmap for strong-field vibrational control as a versatile tool for tailoring symmetry and magnetism in quantum materials.
Methods
Sample preparation
For the time-resolved measurements, 4 mm × 3 mm MnPS3 single crystals with 100 thickness were used (2D Semiconductors). For the infrared measurements, millimeter-scale single crystals were grown using a chemical vapor transport (CVT) method. A mixture of high-purity elements, namely manganese (Mn), phosphorus (P), and sulfur (S) in the ratio of 1:1:3.03, along with 0.05 g of iodine as the transport agent was sealed in an evacuated quartz ampoule. The tube was then placed in a horizontal two-zone furnace. Initially, the temperature was raised up to 400°C within 6 hours at the source zone (containing the reactants ) and to 450°C in the growth zone and held at these temperatures for an additional 6 hours. Subsequently, the temperature was increased up to 650°C at the source zone and to 600°C in the growth zone within 3 hours. After a week, the tube was removed from the furnace and allowed to cool in air. The resulting crystals, measuring between 1 and 10 mm, were washed in isopropanol to remove the halogen from their surface.
THz pump – time-resolved SHG probe experiment
Extended Data Fig. 1a shows a schematic of our experiment. We employed a Coherent Legend Elite regenerative amplified Ti:sapphire laser system generating pulses with 3–5 mJ energy, 70 fs duration, and 800 nm central wavelength at a repetition rate of 700 Hz. The output beam was split into two paths using a beam splitter: one arm was directed towards generation of the terahertz (THz) pump pulses, while the other was used to produce probe pulses.
The pump arm of the beam passed through a custom-made multi-pass amplifier, yielding 16 mJ pulses at 800 nm with a reduced repetition rate of 350 Hz. These pulses were coupled into a TOPAS-TWINS-HE system (Light Conversion), composed of two tunable 2-stage optical parametric amplifiers (OPA). For THz generation, we used the signal output of one OPA tuned to 1.3 , delivering 2.5 mJ pulses ( 70 fs duration). This beam was used to pump a 500 -thick DSTMS crystal (4-N,N-dimethylamino-4’-N’-methyl-stilbazolium 2,4,6-trimethylbenzenesulfonate) in a nitrogen-purged environment to generate broadband THz radiation via optical rectification, having peak field amplitude of 500 kV/cm and beam spot diameter of 380 (FWHM). Note that the generation crystal is on a rotatable mount and a half-wave plate is placed in the 1.3 beam path, allowing for THz polarization control. The THz beam was then focused onto the sample inside a vacuum chamber using off-axis parabolic mirrors in a normal incidence geometry. Additional measurements were also performed using an OH1 generation crystal (2-[3-(4- hydroxystyryl)-5, 5-dimethylcyclohex-2-enylidene] malononitrile) for comparison. In order to characterize the THz pump, the time-domain THz signals in vacuum were acquired using electro-optic sampling (EOS) method. The EOS signal as well as the corresponding FFT for DSTMS (OH1) cystal are displayed in Extended Data Fig. 1b and 1d (1c and 1e), respectively.
For the SHG probe, the 800 nm pulse was passed through a zero-order quartz half-wave plate (HWP) for polarization control and was focused normally onto the sample. The transmitted beam contained both the fundamental and the second harmonic (400 nm). To isolate the SHG signal, we used a narrowband filter stack (FGB39M + FBH-400-40) to block the fundamental, followed by a rotating Glan-Thompson polarizer acting as an analyzer. This analyzer was rotated at twice the frequency of the HWP to enable full 360° SHG-RA mapping.
The SHG signal was detected using a photomultiplier tube (Hamamatsu H10722-110) using a Stanford Research Systems lock-in amplifier (Model SR830) which was triggered by a 700 Hz TTL reference signal. We limited the probe energy to 1.3 to prevent sample heating or damage. Throughout this work, only the SHG signal parallel to the 800 nm probe polarization was considered since the cross-polarized SHG yield was several orders of magnitude weaker.
THz field-induced SHG signal and phonon modulation
For an inversion symmetry-broken crystal, the second-order polarization response to an input light (probe) with frequency can be written as . Here, and are the second-order nonlinear susceptibility and probe field, respectively. The corresponding equilibrium SHG intensity will be .
Now, we consider the material to be subjected to a THz pump excitation. As the THz pump is incident upon the sample, the initial dynamics (first few picoseconds) is dominated by a sharp peak and an incoherent background (Fig. 1e). This response is termed as THz field-induced second harmonic (TFISH), and is attributed to instantaneous inversion symmetry-breaking by the THz field . As a result, the renormalized second-order polarization is given by , where is the third-order nonlinear susceptibility. The SHG intensity is
| (1) |
From these relations, pump-induced change in SHG intensity is expressed as:
| (2) | ||||
| (3) |
From Eq. (3), it appears that response contains terms both linear and quadratic in . At earlier times, while is present, the pump-probe signal is dominated by the first term in Eq. (3) [44]. This term accounts for the TFISH response characterized by a quadratic dependence in . However, at later times where , the dynamics is dominated by phonon modes, manifesting in long-lived coherent oscillations. Along this line, is replaced by phonon coordinate leading to the pump-probe signal
| (4) |
Here, denote the phonon-induced change in static second-order susceptibility and for a material with very large . Thus, the first term in Eq. (4) can be dropped and we argue that the second term will be the dominant contribution in the detected signal.
Theoretical formulation: multiband tight-binding model
We construct a multiband tight-binding model for bulk MnPS3, where ten degenerate Mn 3 spin orbitals and six degenerate S 3 orbitals are taken into account. The electrons are described by a set of one-particle wave functions. To capture noncollinear magnetic structures, each wave function is treated as a two-component spinor. The one-particle wave function with band index is expressed as
| (5) |
In Eq. (5), are local spin orbitals characterized by spin and orbital index . The orbitals are centered on Mn atoms and the orbitals on the surrounding S atoms. The total energy of the model is given by
| (6) |
where corresponds to bare atomic energies of the S orbitals
| (7) |
Notably, consists of the bare atomic energies of electrons at Mn sites and Coulomb interaction contribution . This is expressed by
| (8) |
Here, are the diagonal matrix elements of the local reduced density matrix centered at -th Mn site which is defined as
| (9) |
where is the occupation of the wavefunction . Now, we consider on-site Coulomb interaction on the Hartree-Fock level [51, 52] having the following form:
| (10) |
Here, and denote Coulomb parameters. This expression contains terms similar to the local repulsion terms in Kanamori Hamiltonian [53, 54]. The first three terms, with prefactors , , and , correspond to interactions between electrons with opposite spins in the same orbital, parallel spins in different orbitals, and opposite spins in different orbitals, respectively. The last two terms correspond to pair-hopping and spin-flip interactions. This expression for is rotationally invariant in both the orbital and spin spaces of the Mn -electrons.
The energy represents the kinetic contribution from hopping processes, and is given by
| (11) |
where and denote the Mn or S site while and represent the or orbital indices. The hopping contribution are evaluated for all atomic pairs with interatomic distances up to 4.00 Å. The hopping between sites are parameterized using directional-dependent Slater-Koster two-center integrals: , ,, , , . These parameters correspond to the - and -bonding overlaps for the Mn–S, Mn–Mn, and S–S bonds. In the subscripts, , represent the , orbitals on the Mn atom and six surrounding S sites, respectively. Following Harrison’s approach, we introduce a distance dependence for the hopping amplitudes: , , and . The direction-cosine-dependent Slater–Koster two-center integrals are computed using atomic positions obtained from DFT. The hopping terms are then expressed as , , and , where is a proportionality constant. We assume , , and .
To extract the model parameters, we first determine the on-site energy levels of the Mn and S states in terms of the model parameters , , , and from the and parts of the Hamiltonian. Next, we consider: (1) the energy difference ; and (2) the energy difference between the majority and minority Mn d spin states, . A comparison between the model-predicted values of and , and the corresponding quantities extracted from the DFT-calculated density of states (DOS) — namely, and — provides conditions to determine the values of the model parameters. Here and are estimated from the first moments (centers of mass) of the spin-resolved projected DOS. Furthermore, we consider . The comparison of the energy difference between the AFM and FM states predicted by the full model with the corresponding DFT values yields the hopping constant . Details of the model parameters are given in Extended Data Table 1.
Ab-initio electronic structure calculations
We performed density functional theory (DFT) calculations for bulk MnPS3 using the projector augmented wave (PAW) method [55]. A 1×2×1 supercell of the space group, containing 40 atoms (eight formula units) and the high-temperature experimental lattice constants, Å, Å, and Å are used. The calculations employed a 4×2×4 -point grid and a plane-wave cut-off energy of 35 . The DFT calculations were carried out using the PBE0r hybrid functional used previously for studying other transition-metal compounds [52, 56, 57]. The PBE0r functional is a range-separated extension of the global hybrid PBE0 functional [58] where the Hartree-Fock exchange is calculated by restricting the evaluation to on-site exchange contributions within a local orbital basis set. To obtain mixing factors for on-site exchange, only on-site exchange terms are included, while off-site and long-range exchange interactions are neglected in PBE0r. We choose % mixing factor for on-site exchange for Mn, S, and P atoms. Our calculation predicts band-gap of 2.36 eV.
The results are illustrated in Extended Data Fig. 6a where we plot the total DOS of bulk MnPS3 (gray) as well as its projections onto Mn (blue), S (yellow) and P orbitals (red). The Fermi level () is marked by the solid vertical line while solid and transparent colors designate occupied and unoccupied states, respectively. From the figure, it is noted that Mn and S are the dominant states near the Fermi level, implying that SHG from MnPS3 is primarily sensitive to Mn-S hybridization.
Ab-initio phonon calculations
Phonon calculations were carried out using density functional perturbation theory (DFPT) as implemented in QUANTUM ESPRESSO package [59, 60]. Calculations were performed in the primitive cell with Å and Å. The spin-polarized Kohn-Sham equations were solved on -point mesh with a 80 plane-wave cutoff. We used an LDA exchange-correlation functional with norm-conserving pseudopotentials sourced from Pseudo-Dojo and applied an on-site Hubbard eV to Mn 3 orbitals.
Mode symmetries and IR activities are summarized in Extended Data Table 2 for phonons 4–11. Below , AFM ordering reduces the crystal symmetry, and the modes are classified by how they transform under the reduced symmetry (, ). Above , the modes are classified according to the irreducible representations of the parent point group (, , , ). While our calculations assume AFM order and thus use the classification, we also include the parent symmetry labels, since they are useful for deriving approximate selection rules.
The calculated eigenvectors and frequencies for phonon modes 4-11 from our calculations are broadly consistent with earlier theoretical studies [35], in addition to the small variations arising from the sensitivity of these modes to the choice of computational parameters. Modes 4, 10, and 11 are particularly relevant, as their frequencies closely match the 1.7 THz and 4.5 THz coherent oscillations observed in time-resolved SHG. The 4.5 THz modes (10 and 11) exhibit measurable IR activity, suggesting that they can be directly excited by the THz pump. Mode 10 () couples to polarization, whereas mode 11 () couples to . In contrast, the 1.7 THz mode has negligible IR activity. Above , its symmetry forbids IR coupling; although AFM order formally relaxes this restriction below , our calculations show that the coupling remains very weak. We therefore rule out direct excitation of this mode by the THz pump.
Next, we examine the efficiency with which this mode can couple to light through second-order Raman processes. For modes, symmetry ensures that the and components are zero. However, the components may be finite. To estimate the efficiency of this coupling, we compute the Raman tensor using finite difference: , where is the optical dielectric tensor and the derivative is with respect to freezing in an atomic displacement of mode with amplitude . Using this approach, we find that component of the Raman tensor for mode 8 is 20.7 times larger than that of mode 4. This suggests that the Raman coupling for the 1.7 THz mode is intrinsically weak, thereby providing a plausible explanation for why it has not been observed in equilibrium experiments to date.
THz field-induced magnetic and electronic response
To investigate the pump-induced electronic and magnetic response of the bulk MnPS3, we simulate the charge dynamics under a THz excitation using the real-time time-dependent density functional theory (rt-TDDFT) framework based on the above proposed tight-binding model. The one-particle wavefunctions of electrons evolve according to time-dependent Schrödinger equation
| (12) |
where is defined in Eq. (6). The effect of the pump electric field is incorporated into the hopping term via Peierls substitution [47]. Further, we introduce the THz magnetic field in the model via an additional term accounting for Zeeman coupling at Mn sites
| (13) |
Here, is defined in Eqs. (8) and (9), while and represent the coupling constant and Bohr magneton, respectively. Simulations predict that the magnetic field component of a THz pulse with an electric field amplitude varying from 0 to 15 MV/cm drives only in-phase precession of Mn spins, without generating magnon excitations. Extended Data Fig. 6f shows the evolution of the spin components , , and for the two Mn sites with opposite spin orientations, highlighting spin precession about the -axis under a THz magnetic field applied along the -direction. The spin vectors for Mn spin-up and spin-down sites in the ground state at are and , respectively.
The driving frequency is fixed at 2.5 THz in our simulations, while the peak-electric-field strength is varied from 0 to 15 MV/cm. The electric field polarization is in the plane, and is oriented either (1) parallel to the line connecting first nearest-neighbor Mn sites ( Mn–Mn bonds, denoted as ), or (2) perpendicular to it, along the line connecting second nearest-neighbor Mn sites (denoted as ). The simulation cell contains 2 Mn atoms and 6 S atoms. We use 4×4×4 -centered -grid. Extended Data Fig. 6g show the evolution of local charge density at Mn sites, while Extended Data Fig. 6h displays the corresponding changes in the magnetic moment at Mn sites as a function of field strength.
In both the polarization cases ( and ), our simulations reveal charge transfer between Mn and S atoms during the presence of the pump field (Extended Data Fig. 6i). This transfer is driven by field-induced shifts in the on-site energy levels of Mn and S orbitals, which enhance the hybridization between majority-spin Mn and S states. As a result, the local magnetic moments at Mn sites are modulated, and the magnitude of the charge rearrangement scales linearly at lower field strengths (Extended Data Fig. 6j).
When a THz field is applied, the hybridization along the field polarization direction is enhanced, realizing in an anisotropic modulation in effective AFM exchange , where , between Mn atoms. Here, denotes the on-site spin-splitting at Mn sites. In contrast, the interaction between Mn pairs whose bond directions are not aligned with the field polarization remains largely unchanged. The field with polarization parallel to Mn–Mn bonds () modifies for one-third of the Mn–Mn pairs, while affects for two-thirds of the Mn–Mn pairs. For , the induced charge transfer occurs along the Mn–Mn zigzag chains. However, at any given Mn site, the contributions from neighboring Mn atoms on either side are symmetric and cancel each other out. Consequently, there is no net charge transfer between Mn atoms. However, for , the Mn–Mn connectivity is discontinuous, manifesting an imbalance and a net charge transfer between Mn sites (Fig. 4d).
The observed linear field dependence of both the average reduction in magnetic moment and the S-to-Mn charge transfer (Extended Data Fig. 6h and 6j) is consistent with a linear Stark effect, which scales proportionally with the field. We note that the charge rearrangement mechanism is valid only below where the Mn spins are antiferromagnetically ordered, allowing for coherent charge transfer. On the contrary, above , due to lack of spin order, contributions from randomly oriented Mn spins will average to zero. This is echoed in our experimental observation that no coherent oscillations were detected above (90 K, Supplementary Fig. 6).
Excitation of phonon modes
First-principles phonon calculations reveal a low-frequency mode at 1.7 THz that has been theoretically predicted but not reported in prior experimental studies. We identify the 1.7 THz peak in our experimental FFT spectrum as this mode, which involves out-of-plane displacements of Mn atoms with opposite spin orientations moving in opposite directions. Its excitation arises from changes in Mn-–Mn bond hybridization that reduce the magnetic moment and enhance on-site electronic repulsion, thereby generating out-of-plane forces that drive the Mn atoms apart. The excitation of the 1.7 THz mode is further corroborated by our constrained DFT calculations. Specifically, we employed the ground-state wavefunctions (obtained in the absence of the THz field) as the reference basis, and then characterized how the strong THz field modulates these wavefunctions within the constrained DFT framework. We found that the modulation of valence state could be described approximately as mixing of 0.2% of conduction band state, primarily minority-spin Mn orbitals, to almost completely occupied (99.8%) valence band. This setup captures essential features of the electronic response induced by a THz pulse – namely, hybridization between valence and conduction states, and a reduction in the magnitude of the local magnetic moments.
On the other hand, the polarization-dependent field-induced change in exchange interaction preferentially couples to the 4.5 THz phonon modes via magnetoelastic interaction. This is supported by previous studies that report changes in these modes across the Néel temperature, suggestive of their sensitivity to the magnetic exchange parameter [35, 37].
Symmetry of the 1.7 THz and 4.5 THz modes
As displayed in Fig. 2d, the 4.5 THz mode exhibits distinct symmetry depending on the THz polarization. When the THz field is aligned along the lobes of the SHG-RA pattern (), a six-fold symmetry is observed (dark blue and orange curves). On the other hand, a two-fold pattern appears (purple and red curves) when the field is polarized along the nodes (). We associate this difference in the FFT spectra of the pump–probe SHG signal at 4.5 THz with anisotropic modifications in the hybridization of the six Mn–-S bonds surrounding each Mn atom. To gain further insights, we analyze the time-dependent quantity , which quantifies the bonding strength between the Mn site and its six neighboring S atoms computed from the off-site elements of the single-particle reduced density matrix. The applied THz field induces highly asymmetric changes in among the six Mn–S bonds surrounding each Mn atom (Supplementary Fig. 11), with the response strongly dependent on the field polarization. These asymmetries in bond strength exert directional forces on the atoms, selectively exciting specific phonon modes.
We attribute the observed pump polarization dependence of the 4.5 THz mode to the selective excitation of IR- and Raman-active phonons with different symmetries. The five phonons near 4.5 THz show , , and symmetries. With applied, the and modes dominate the response (Figure 7a), strongly altering along a single Mn–S bond direction, while the bonds in other two directions remain largely unaffected. This manifests in a strongly two-fold symmetry pattern at 4.5 THz, in agreement with the experimental observation. By contrast, for the excitation, the 4.5 THz and modes are excited (Figure 7b). These modes induce modifications in along all three Mn–S directions, consistent with the experimentally observed uniform six-fold response.
At 4.5 THz, the eigenvectors of the IR-active and modes feature pronounced displacements of P atoms, whereas the Raman-active and modes display minimal phosphorus involvement (Extended Data Fig. 7a–b). However, according to our calculations, the SHG response in MnPS3 is primarily sensitive to the Mn–S bond current. This, together with the small THz pump spectral weight around 4.5 THz (see Extended Data Fig. 1), suggests that the 4.5 THz response in tr-SHG measurement contains comparable contribution from both the IR-active modes directly excited by the THz field and Raman-active modes excited via field-induced charge transfer mechanism.
The six-fold symmetry of the 1.7 THz mode observed in the experiment arises from out-of-plane displacements of Mn atoms with opposite spins moving in opposite directions. This motion alternately modulates three of the six Mn–S bonds around each Mn site. The combined effect on hybridization at the two opposite-spin Mn sites yields a symmetric pattern across all six directions, producing the six-fold symmetry observed in the FFT signal.
Long-lived changes and magnetic phase transition
For stronger THz field , our simulations predict long-lived changes in the local charge densities and magnetic moments, which persist even after the electric field is turned off. These changes in the local charge densities and magnetic moments scale nonlinearly with as presented in Fig. 4g. Extended Data Fig. 7c–d plots the simulated temporal evolution of net magnetic moment as a function of field for different pump polarizations. Especially, in the case, a finite net magnetization remains after the pulse (Extended Data Fig. 7c), hinting at a transition from the antiferromagnetic (AFM) to a ferrimagnetic (FiM) phase, characterized by unequal magnetic moments at opposite-spin Mn sites. These long-lived changes and the field-induced phase transition suggest that the system evolves through nonlinear and nonperturbative dynamics, which explains the experimentally observed rectification (offset) in the pump-probe signal. The excited electronic subsystem partially relaxes into specific phonon modes, as discussed in the “Excitation of phonon modes” section, by transferring energy via electron–phonon coupling.
We distinguish between the instantaneous charge transfer from S to Mn, which scales linearly with the THz field (Extended Data Fig. 6j) and reflects transient hybridization-driven redistribution during the pulse, and the long-lived offset observed in the SHG response, which scales nonlinearly with field. The offset represents the amount of charge that remains after the field is gone and builds up over the course of the excitation, indicating a rectified, cumulative effect rather than a direct linear response.
SHG predicted by the tight-binding model
The AFM bulk MnPS3 lacks inversion symmetry, and exhibits SHG and other even-order harmonics. As such, we employ the rt-TDDFT method based on the above tight-binding model to simulate the SHG. The electromagnetic field effect is incorporated utilizing the Peierls substitution method [47] where the hopping amplitude is multiplied by a phase factor. We define a instantaneous current density on each bond connecting atoms and where :
| (14) | |||||
Here, is the unit vector along the direction joining sites and . The total current in a particular spatial direction is obtained by summing the contributions from all bonds, each weighted by the component of the displacement vectors between the sites in that direction. For a probe optical field with frequency , SHG yields are computed by analyzing the Fourier components of the current density , with longitudinal () and transverse () components taken along the directions parallel and perpendicular to the field, respectively. The SHG yield can be written as: , where is the Fourier transform of current density . Two different field strengths were tested for the simulations: 0.005 V/Å and 0.5 V/Å.
To examine the polarization dependence of the SHG response, we calculated the longitudinal and transverse SHG yields for electric fields polarized along various directions relative to the Mn–Mn bond axis. Extended Data Fig. 6b presents the simulated longitudinal SHG-RA pattern for bulk MnPS3 in its AFM ground state. The polarization dependence of the simulated SHG-RA is consistent with previous experimental observations. The SHG intensity shows maxima every , reflecting the approximate three-fold rotational symmetry of the point group. In contrast, transverse SHG yields were weaker by several orders of magnitudes, congruent with the experimental results.
We now investigate how phonon modes influence the SHG-RA pattern by introducing atomic displacements corresponding to select low-frequency phonons into the equilibrium DFT structure. For each displaced configuration, we extract updated hopping parameters for the tight-binding model, optimize the electronic structure of bulk MnPS3, and compute the SHG-RA pattern using rt-TDDFT. For Raman-active modes, the unequal intensities of mirror-related lobes indicate mirror symmetry breaking as depicted in Extended Data Fig. 6c. Contrarily, for the IR-active phonon modes, the SHG-RA lobes become asymmetric, distorting the six-fold symmetry (Extended Data Fig. 6d).
To explore how phonon mode amplitude impacts the SHG yield, we calculate the SHG signal along one of the lobe directions in the ground-state SHG-RA pattern across a range of mode amplitudes. Figure 4b in the main text displays the corresponding relative change in SHG signal.
Data availability
The data presented in this manuscript can be available from the corresponding authors upon reasonable request. Correspondence should be addressed to Sheikh Rubaiat Ul Haque, Tony F. Heinz or Aaron M. Lindenberg.
References
- Stojchevska et al. [2014] L. Stojchevska, I. Vaskivskyi, T. Mertelj, P. Kusar, D. Svetin, S. Brazovskii, and D. Mihailovic, Ultrafast switching to a stable hidden quantum state in an electronic crystal, Science 344, 177 (2014).
- Zhang et al. [2016] J. Zhang, X. Tan, M. Liu, S. W. Teitelbaum, K. W. Post, F. Jin, K. A. Nelson, D. N. Basov, W. Wu, and R. D. Averitt, Cooperative photoinduced metastable phase control in strained manganite films, Nature Materials 15, 956 (2016).
- Mitrano et al. [2016] M. Mitrano, A. Cantaluppi, D. Nicoletti, S. Kaiser, A. Perucchi, S. Lupi, P. Di Pietro, D. Pontiroli, M. Riccò, A. Subedi, S. R. Clark, D. Jaksch, and A. Cavalleri, Possible light-induced superconductivity in at high temperature, Nature 530, 461 (2016).
- Haque et al. [2024] S. R. U. Haque, M. H. Michael, J. Zhu, Y. Zhang, L. Windgätter, S. Latini, J. P. Wakefield, G.-F. Zhang, J. Zhang, A. Rubio, J. G. Checkelsky, E. Demler, and R. D. Averitt, Terahertz parametric amplification as a reporter of exciton condensate dynamics, Nature Materials 23, 796 (2024).
- Kogar et al. [2020] A. Kogar, A. Zong, P. E. Dolgirev, X. Shen, J. Straquadine, Y.-Q. Bie, X. Wang, T. Rohwer, I.-C. Tung, Y. Yang, R. Li, J. Yang, S. Weathersby, S. Park, M. E. Kozina, E. J. Sie, H. Wen, P. Jarillo-Herrero, I. R. Fisher, X. Wang, and N. Gedik, Light-induced charge density wave in , Nature Physics 16, 159 (2020).
- Wang et al. [2013] Y. H. Wang, H. Steinberg, P. Jarillo-Herrero, and N. Gedik, Observation of - states on the surface of a topological insulator, Science 342, 453 (2013).
- Rowe et al. [2023] E. Rowe, B. Yuan, M. Buzzi, G. Jotzu, S. Fava, D. Nicoletti, M. Budden, P. Narang, and A. Cavalleri, Resonant enhancement of photo-induced superconductivity in , Nature Physics 19, 1821 (2023).
- Budden et al. [2021] M. Budden, T. Gebert, M. Buzzi, G. Jotzu, E. Wang, T. Matsuyama, G. Meier, Y. Laplace, D. Pontiroli, M. Riccò, F. Schlawin, D. Jaksch, and A. Cavalleri, Evidence for metastable photo-induced superconductivity in , Nature Physics 17, 611 (2021).
- Li et al. [2019] X. Li, T. Qiu, J. Zhang, E. Baldini, J. Lu, A. M. Rappe, and K. A. Nelson, Terahertz field–induced ferroelectricity in quantum paraelectric , Science 364, 1079 (2019).
- Nova et al. [2019] T. F. Nova, A. S. Disa, M. Fechner, and A. Cavalleri, Metastable ferroelectricity in optically strained , Science 364, 1075 (2019).
- Liu et al. [2012] M. Liu, H. Y. Hwang, H. Tao, A. C. Strikwerda, K. Fan, G. R. Keiser, A. J. Sternbach, K. G. West, S. Kittiwatanakul, J. Lu, S. A. Wolf, F. G. Omenetto, X. Zhang, K. A. Nelson, and R. D. Averitt, Terahertz-field-induced insulator-to-metal transition in vanadium dioxide metamaterial, Nature 487, 345 (2012).
- Sie et al. [2019] E. J. Sie, C. M. Nyby, C. D. Pemmaraju, S. J. Park, X. Shen, J. Yang, M. C. Hoffmann, B. K. Ofori-Okai, R. Li, A. H. Reid, S. Weathersby, E. Mannebach, N. Finney, D. Rhodes, D. Chenet, A. Antony, L. Balicas, J. Hone, T. P. Devereaux, T. F. Heinz, X. Wang, and A. M. Lindenberg, An ultrafast symmetry switch in a semimetal, Nature 565, 61 (2019).
- Zeng et al. [2025] Z. Zeng, M. Först, M. Fechner, M. Buzzi, E. B. Amuah, C. Putzke, P. J. W. Moll, D. Prabhakaran, P. G. Radaelli, and A. Cavalleri, Photo-induced chirality in a nonchiral crystal, Science 387, 431 (2025).
- Disa et al. [2020] A. S. Disa, M. Fechner, T. F. Nova, B. Liu, M. Först, D. Prabhakaran, and A. Cavalleri, Polarizing an antiferromagnet by optical engineering of the crystal field, Nature Physics 16, 937 (2020).
- Disa et al. [2023] A. S. Disa, J. Curtis, M. Fechner, A. Liu, A. von Hoegen, M. Först, T. F. Nova, P. Narang, A. Maljuk, A. V. Boris, B. Keimer, and A. Cavalleri, Photo-induced high-temperature ferromagnetism in , Nature 617, 73 (2023).
- Basov et al. [2011] D. N. Basov, R. D. Averitt, D. van der Marel, M. Dressel, and K. Haule, Electrodynamics of correlated electron materials, Review of Modern Physics 83, 471 (2011).
- Basov et al. [2017] D. N. Basov, R. D. Averitt, and D. Hsieh, Towards properties on demand in quantum materials, Nature Materials 16, 1077 (2017).
- Afanasiev et al. [2021a] D. Afanasiev, J. R. Hortensius, B. A. Ivanov, A. Sasani, E. Bousquet, Y. M. Blanter, R. V. Mikhaylovskiy, A. V. Kimel, and A. D. Caviglia, Ultrafast control of magnetic interactions via light-driven phonons, Nature Materials 20, 607 (2021a).
- Zong et al. [2023] A. Zong, Q. Zhang, F. Zhou, Y. Su, K. Hwangbo, X. Shen, Q. Jiang, H. Liu, T. E. Gage, D. A. Walko, M. E. Kozina, D. Luo, A. H. Reid, J. Yang, S. Park, S. H. Lapidus, J.-H. Chu, I. Arslan, X. Wang, D. Xiao, X. Xu, N. Gedik, and H. Wen, Spin-mediated shear oscillators in a van der antiferromagnet, Nature 620, 988 (2023).
- Sivadas et al. [2015] N. Sivadas, M. W. Daniels, R. H. Swendsen, S. Okamoto, and D. Xiao, Magnetic ground state of semiconducting transition-metal trichalcogenide monolayers, Physical Review B 91, 235425 (2015).
- Takano et al. [2004] Y. Takano, N. Arai, A. Arai, Y. Takahashi, K. Sekizawa, and K. Takeda, Magnetic properties and specific heat of (=, , ), Journal of Magnetism and Magnetic Materials 272–276, e593 (2004).
- Kim et al. [2019a] K. Kim, S. Y. Lim, J.-U. Lee, S. Lee, T. Y. Kim, K. Park, G. S. Jeon, C.-H. Park, J.-G. Park, and H. Cheong, Suppression of magnetic ordering in -type antiferromagnetic monolayer , Nature Communications 10, 345 (2019a).
- Kang et al. [2020] S. Kang, K. Kim, B. H. Kim, J. Kim, K. I. Sim, J.-U. Lee, S. Lee, K. Park, S. Yun, T. Kim, A. Nag, A. Walters, M. Garcia-Fernandez, J. Li, L. Chapon, K.-J. Zhou, Y.-W. Son, J. H. Kim, H. Cheong, and J.-G. Park, Coherent many-body exciton in van der antiferromagnet , Nature 583, 785 (2020).
- Lee et al. [2016] J.-U. Lee, S. Lee, J. H. Ryoo, S. Kang, T. Y. Kim, P. Kim, C.-H. Park, J.-G. Park, and H. Cheong, Ising-type magnetic ordering in atomically thin , Nano Letters 16, 7433 (2016).
- Chu et al. [2020] H. Chu, C. J. Roh, J. O. Island, C. Li, S. Lee, J. Chen, J.-G. Park, A. F. Young, J. S. Lee, and D. Hsieh, Linear magnetoelectric phase in ultrathin probed by optical second harmonic generation, Physical Review Letters 124, 027601 (2020).
- Cui et al. [2023] J. Cui, E. V. Boström, M. Ozerov, S. Zhang, Y. Zhang, Y. Wang, J. Zhang, L. Wang, X. Zhang, and J. Wang, Chirality selective magnon–phonon hybridization and magnon-induced chiral phonons in a layered zigzag antiferromagnet, Nature Communications 14, 3396 (2023).
- Bae et al. [2022] Y. J. Bae, J. Wang, A. Scheie, J. Xu, D. G. Chica, G. M. Diederich, J. Cenker, M. E. Ziebel, Y. Bai, H. Ren, C. R. Dean, M. Delor, X. Xu, X. Roy, A. D. Kent, and X. Zhu, Exciton-coupled coherent magnons in a 2 semiconductor, Nature 609, 282 (2022).
- Belvin et al. [2021] C. A. Belvin, E. Baldini, I. O. Ozel, D. Mao, H. C. Po, C. J. Allington, S. Son, B. H. Kim, J. Kim, I. Hwang, J. H. Kim, J.-G. Park, T. Senthil, and N. Gedik, Exciton-driven antiferromagnetic metal in a correlated van der insulator, Nature Communications 12, 4837 (2021).
- Afanasiev et al. [2021b] D. Afanasiev, J. R. Hortensius, M. Matthiesen, S. Mañas-Valero, M. Šiškins, M. Lee, E. Lesne, H. S. J. van der Zant, P. G. Steeneken, B. A. Ivanov, E. Coronado, and A. D. Caviglia, Controlling the anisotropy of a van der waals antiferromagnet with light, Science Advances 7, eabf3096 (2021b).
- Ergeçen et al. [2022] E. Ergeçen, B. Ilyas, D. Mao, H. C. Po, M. B. Yilmaz, J. Kim, J.-G. Park, T. Senthil, and N. Gedik, Magnetically brightened dark electron-phonon bound states in a van der antiferromagnet, Nature Communications 13, 98 (2022).
- Zhou et al. [2022] F. Zhou, K. Hwangbo, Q. Zhang, C. Wang, L. Shen, J. Zhang, Q. Jiang, A. Zong, Y. Su, M. Zajac, Y. Ahn, D. A. Walko, R. D. Schaller, J.-H. Chu, N. Gedik, X. Xu, D. Xiao, and H. Wen, Dynamical criticality of spin–shear coupling in van der antiferromagnets, Nature Communications 13, 6598 (2022).
- Ilyas et al. [2024] B. Ilyas, T. Luo, A. von Hoegen, E. Viñas Boström, Z. Zhang, J. Park, J. Kim, J.-G. Park, K. A. Nelson, A. Rubio, and N. Gedik, Terahertz field-induced metastable magnetization near criticality in , Nature 636, 609 (2024).
- Matthiesen et al. [2023] M. Matthiesen, J. R. Hortensius, S. Mañas-Valero, I. Kapon, D. Dumcenco, E. Giannini, M. Šiškins, B. A. Ivanov, H. S. J. van der Zant, E. Coronado, A. B. Kuzmenko, D. Afanasiev, and A. D. Caviglia, Controlling magnetism with light in a zero orbital angular momentum antiferromagnet, Physical Review Letters 130, 076702 (2023).
- Babuka et al. [2020] T. Babuka, P. Fuentealba, C. Olea, H. Aguilar-Bolados, N. Audebrand, R. C. de Santana, C. Doerenkamp, H. Eckert, P. Jara, A. Muñoz, and G. Soto, Electronic and optical properties of monolayer : A first-principles study, Computational Materials Science 177, 109592 (2020).
- Václavková et al. [2020] D. Václavková, A. Delhomme, C. Faugeras, M. Potemski, A. Bogucki, J. Suffczyński, P. Kossacki, A. Wildes, B. Gremaud, and A. Saúl, Magnetoelastic interaction in the two-dimensional magnetic material studied by first principles calculations and experiments, 2D Materials 7, 035030 (2020).
- Wildes et al. [1998] A. R. Wildes, B. Roessli, B. Lebech, and K. W. Godfrey, Spin waves and the critical behaviour of the magnetization in , Journal of Physics: Condensed Matter 10, 6417 (1998).
- Sun et al. [2019] Y.-J. Sun, Q.-H. Tan, X. L. Liu, Y.-F. Gao, and J. Zhang, Probing the magnetic ordering of antiferromagnetic by spectroscopy, The Journal of Physical Chemistry Letters 10, 3087 (2019).
- Ni et al. [2021] Z. Ni, H. Zhang, D. A. Hopper, A. V. Haglund, N. Huang, D. Jariwala, L. C. Bassett, D. G. Mandrus, E. J. Mele, C. L. Kane, and L. Wu, Direct imaging of antiferromagnetic domains and anomalous layer-dependent mirror symmetry breaking in atomically thin , Physical Review Letters 127, 187201 (2021).
- Wang et al. [2024] Z. Wang, M. Wang, J. Lehmann, Y. Shiomi, T.-h. Arima, N. Nagaosa, Y. Tokura, and N. Ogawa, Electric-field-enhanced second-harmonic domain contrast and nonreciprocity in a van der antiferromagnet , Nature Communications 15, 7542 (2024).
- Muthukumar et al. [1995] V. N. Muthukumar, R. Valentí, and C. Gros, Microscopic model of nonreciprocal optical effects in , Physical Review Letters 75, 2766 (1995).
- Grasso et al. [1991] V. Grasso, F. Neri, P. Perillo, L. Silipigni, and M. Piacentini, Optical-absorption spectra of crystal-field transitions in at low temperatures, Physical Review B 44, 11060 (1991).
- Kim et al. [2019b] K. Kim, S. Y. Lim, J. Kim, J.-U. Lee, S. Lee, P. Kim, K. Park, S. Son, C.-H. Park, J.-G. Park, and H. Cheong, Antiferromagnetic ordering in van der 2 magnetic material probed by spectroscopy, 2D Materials 6, 041001 (2019b).
- Shan et al. [2021] J.-Y. Shan, M. Ye, H. Chu, S. Lee, J.-G. Park, L. Balents, and D. Hsieh, Giant modulation of optical nonlinearity by engineering, Nature 600, 235 (2021).
- Luo et al. [2024] T. Luo, B. Ilyas, A. von Hoegen, Y. Lee, J. Park, J.-G. Park, and N. Gedik, Time-of-flight detection of terahertz phonon-polariton, Nature Communications 15, 2276 (2024).
- Cook et al. [1999] D. J. Cook, J. X. Chen, E. A. Morlino, and R. M. Hochstrasser, Terahertz-field-induced second-harmonic generation measurements of liquid dynamics, Chemical Physics Letters 309, 221 (1999).
- Chen et al. [2015] F. Chen, J. Goodfellow, S. Liu, I. Grinberg, M. C. Hoffmann, A. R. Damodaran, Y. Zhu, P. Zalden, X. Zhang, I. Takeuchi, A. M. Rappe, L. W. Martin, H. Wen, and A. M. Lindenberg, Ultrafast terahertz gating of the polarization and giant nonlinear optical response in thin films, Advanced Materials 27, 6371 (2015).
- Peierls [1933] R. Peierls, Zur theorie des diamagnetismus von leitungselektronen, Zeitschrift für Physik 80, 763 (1933).
- Yamakawa et al. [2021] H. Yamakawa, T. Miyamoto, T. Morimoto, N. Takamura, S. Liang, H. Yoshimochi, T. Terashige, N. Kida, M. Suda, H. M. Yamamoto, H. Mori, K. Miyagawa, K. Kanoda, and H. Okamoto, Terahertz-field-induced polar charge order in electronic-type dielectrics, Nature Communications 12, 953 (2021).
- Cortijo-Campos et al. [2021] S. Cortijo-Campos, P. Kung, C. Prieto, and A. de Andrés, Forbidden and second-order phonons in raman spectra of single and few-layer close to exciton resonance, Journal of Physical Chemistry C 125, 23904 (2021).
- Sander et al. [2014] T. Sander, C. T. Reindl, M. Giar, B. Eifert, M. Heinemann, C. Heiliger, and P. J. Klar, Correlation of intrinsic point defects and the raman modes of cuprous oxide, Physical Review B 90, 045203 (2014).
- Rajpurohit et al. [2024a] S. Rajpurohit, C. Jooss, S. Techert, T. Ogitsu, P. E. Blöchl, and L. Z. Tan, Characteristic terahertz emissions induced by optically excited collective orbital modes, Physical Review B 110, 104309 (2024a).
- Sotoudeh et al. [2017] M. Sotoudeh, S. Rajpurohit, P. Blöchl, D. Mierwaldt, J. Norpoth, V. Roddatis, S. Mildner, B. Kressdorf, B. Ifland, and C. Jooss, Electronic structure of , Physical Review B 95, 235150 (2017).
- Kanamori [1963] J. Kanamori, Electron correlation and ferromagnetism of transition metals, Progress of Theoretical Physics 30, 275 (1963).
- Georges et al. [2013] A. Georges, L. de’ Medici, and J. Mravlje, Strong correlations from ’s coupling, Annual Review of Condensed Matter Physics 4, 137 (2013).
- Blöchl [1994] P. E. Blöchl, Projector augmented-wave method, Physical Review B 50, 17953 (1994).
- Eckhoff et al. [2020] M. Eckhoff, P. E. Blöchl, and J. Behler, Hybrid density functional theory benchmark study on lithium manganese oxides, Physical Review B 101, 205113 (2020).
- Rajpurohit et al. [2024b] S. Rajpurohit, V. Vennelakanti, and H. J. Kulik, Improving predictions of spin-crossover complex properties through calculations with a local hybrid functional, The Journal of Physical Chemistry A 128, 9082 (2024b).
- Perdew et al. [1996] J. P. Perdew, M. Ernzerhof, and K. Burke, Rationale for mixing exact exchange with density functional approximations, The Journal of Chemical Physics 105, 9982 (1996).
- Giannozzi et al. [2017] P. Giannozzi, O. Andreussi, T. Brumme, O. Bunau, M. Buongiorno Nardelli, M. Calandra, R. Car, C. Cavazzoni, D. Ceresoli, M. Cococcioni, N. Colonna, I. Carnimeo, A. Dal Corso, S. de Gironcoli, P. Delugas, R. A. J. DiStasio, A. Ferretti, A. Floris, G. Fratesi, G. Fugallo, R. Gebauer, U. Gerstmann, F. Giustino, T. Gorni, J. Jia, M. Kawamura, H. Ko, A. Kokalj, E. Kücükbenli, M. Lazzeri, M. Marsili, N. Marzari, F. Mauri, N. L. Nguyen, H. V. Nguyen, A. Otero‑De‑La‑Roza, L. Paulatto, S. Poncé, D. Rocca, R. Sabatini, B. Santra, M. Schlipf, A. P. Seitsonen, A. Smogunov, I. Timrov, T. Thonhauser, P. Umari, N. Vast, X. Wu, and S. Baroni, Advanced capabilities for materials modelling with , Journal of Physics: Condensed Matter 29, 465901 (2017).
- Giannozzi et al. [2009] P. Giannozzi, S. Baroni, N. Bonini, M. Calandra, R. Car, C. Cavazzoni, D. Ceresoli, G. L. Chiarotti, M. Cococcioni, I. Dabo, A. Dal Corso, S. de Gironcoli, S. Fabris, G. Fratesi, R. Gebauer, U. Gerstmann, C. Gougoussis, A. Kokalj, M. Lazzeri, L. Martin‐Samos, N. Marzari, F. Mauri, R. Mazzarello, S. Paolini, A. Pasquarello, L. Paulatto, C. Sbraccia, S. Scandolo, G. Sclauzero, A. P. Seitsonen, A. Smogunov, P. Umari, and R. M. Wentzcovitch, : a modular and open-source software project for quantum simulations of materials, Journal of Physics: Condensed Matter 21, 395502 (2009).
- Shen [1984] Y.-R. Shen, The Principles of Nonlinear Optics (Wiley-Interscience, New York, 1984).
- Boyd [2008] R. W. Boyd, Nonlinear Optics, 3rd ed. (Academic Press, Amsterdam, 2008).
Acknowledgements
We thank Keith A. Nelson, Richard D. Averitt, Eugene Demler, Angel Rubio, Peter E. Blöchl, David A. Reis, Dragan Mihailovic, Liuyan Zhao, Alfred Zong, Shengxi Huang, Oleg Shpyrko, Roopali Kukreja, Keshav M. Dani, Ralph H. Page, Yuan Ping, Yuki Kobayashi, Jiaojian Shi, Qitong Li and Christian Heide for fruitful discussions. The experimental effort was primarily supported by the US Department of Energy (DOE), Office of Science, Office of Basic Energy Sciences (BES), Materials Sciences and Engineering Division under contract DE-AC02-76SF005. Use of the facilities at Linac Coherent Light Source (LCLS), SLAC National Accelerator Laboratory, is supported by the US Department of Energy, Office of Science, Office of Basic Energy Sciences under Contract No. DE-AC02-76SF00515. Theory and simulation were supported by the Computational Materials Sciences Program funded by the US Department of Energy, Office of Science, Basic Energy Sciences, Materials Sciences and Engineering Division. Additional data analysis and interpretation was provided by the User Program of the Molecular Foundry, supported by the Office of Science, Office of Basic Energy Sciences, of the US Department of Energy under Contract No. DE-AC02-05CH11231. This research used resources of the National Energy Research Scientific Computing Center (NERSC), a Department of Energy User Facility using NERSC award BES-ERCAP0032784. M.J.C, M.C.H, and J.D.K. were supported by the Department of Energy, Laboratory Directed Research and Development program at SLAC National Accelerator Laboratory, under contract DE-AC02-76SF00515. L.B. and V.K. are supported by DOE-BES through the award DE-SC0002613. The National High Magnetic Field Laboratory (NHMFL) acknowledges support from the US-NSF Cooperative Agreement grant no. DMR-2128556 and the State of Florida. D.S. also acknowledges the support from the US Department of Energy (No. DE-FG02-07ER46451) for Raman spectroscopy measurements.
Author contribution
S.R.U.H. conceived the project along with A.M.L. and T.F.H. V.K. performed the sample growth under the supervision of L.B. A.C.Z and M.T. characterized the samples for Raman measurements. I.J.S. measured the Raman spectra under the guidance of D.S. The infrared absorption spectrum was measured by M.O. S.R.U.H., H.W. and S.S.P. carried out the static SHG characterization of the sample. M.C.H. and M.J.C. designed and built the THz pump experiments. S.R.U.H. and M.J.C. performed the time-resolved measurements and analyzed the data with contribution from C.S. J.D.K. provided further support in data analysis. S.R., J.B.H. and C.J.C. performed the first-principles density functional theory (DFT) calculations under the guidance of T.O. and F.H.d.J., with support from L.Z.T. A.M.L. and T.F.H. supervised the project. S.R.U.H., S.R., J.B.H. and A.M.L. wrote the manuscript with input from all the authors.
Competing interests
The authors declare no competing interests.
| ()/2 | 6.15 | eV | ()/2 | 7.66 | eV |
|---|---|---|---|---|---|
| 7.016 | eV | 0.10 | eV | ||
| 0 | eV | -1.51 | eV | ||
| 3.01 | eV | 1.00 | eV | ||
| 0.90 | eV | -0.45 | eV |
| Mode | Frequency (THz) | Symmetry | IR activity |
|---|---|---|---|
| 4 | 2.0519 | 0.0000 | |
| 5 | 3.0134 | 0.0000 | |
| 6 | 3.0361 | 0.0000 | |
| 7 | 4.1364 | 0.0001 | |
| 8 | 4.1708 | 0.0001 | |
| 9 | 4.3633 | 0.4813 (z-polarized) | |
| 10 | 4.4734 | 1.5398 (x-polarized ) | |
| 11 | 4.4888 | 1.7042 (y-polarized ) |
Supplementary Materials
Infrared spectrum
Far-infrared measurements were performed at the National High Magnetic Field Laboratory, using a Bruker Vertex 80v vacuum Fourier Transform Infrared (FTIR) spectrometer coupled to a vertical-bore superconducting 17.5 T magnet. Transmission spectra of a single crystal of MnPS3 were recorded in the spectral range from 10 cm-1 to 205 cm-1, with a resolution of 0.3 cm-1.
Broadband far-infrared radiation, generated by a mercury lamp, was guided through an evacuated beamline connecting the spectrometer to the top of a brass lightpipe. A 90∘ off-axis parabolic mirror located at the bottom of the lightpipe directed the beam toward a second, identical confocal mirror, which collimated the radiation through a short secondary lightpipe ending at a Si bolometer detector. The sample, mounted at the focal point of the mirrors, fully covered a clear aperture of 3 mm and was maintained at a fixed temperature of approximately 5.5 K.
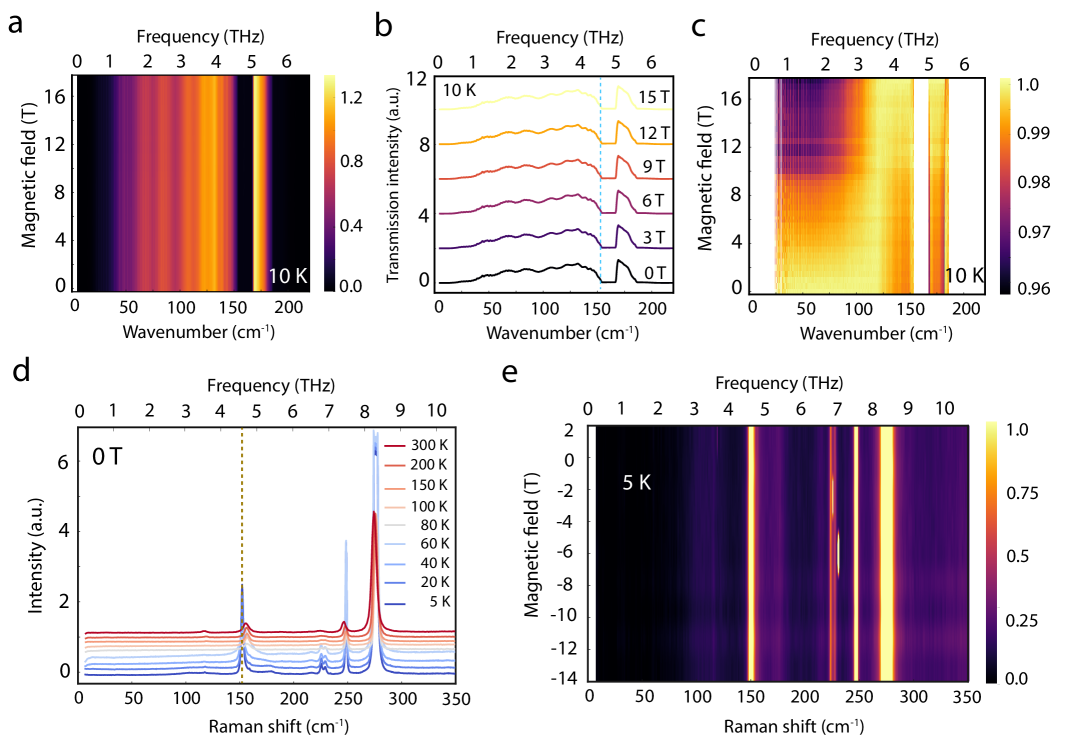
The magnetic field was applied in the plane of the sample and perpendicular to the propagation direction of the incident radiation (Voigt geometry). A cold low-pass filter blocked infrared radiation above 200 cm-1. The transmission spectra were acquired in 0.5 T magnetic field increments and are presented as an intensity colormap in Supplementary Fig. 1a while corresponding horizontal line cuts, taken at every 3 T, are shown in Supplementary Fig. 1b. A dip in transmission intensity was observed at THz (150 cm-1), matching the frequency of an IR-active mode. To improve the signal-to-noise ratio, each measurement was repeated twice at every field step. The reproducibility between repeated scans was better than 0.5%, though slightly degraded near phonon peak regions due to reduced intensity.
To isolate field-dependent spectral features from field-independent background effects, each spectrum was divided by a reference spectrum, defined as the average of all measured spectra with statistical outliers removed. This normalization effectively suppressed instrumental artifacts and yielded a flat baseline, while preserving field-responsive changes.
The resulting normalized spectra were presented as a colormap in Supplementary Fig. 1c, with black and yellow representing the minimum and maximum deviations from the reference, respectively. White regions indicate frequencies where the spectral reproducibility exceeded 1%, typically coinciding with diminished transmission intensity. A broad purple-black band below 100 cm-1 reflects a known 3% reduction in source intensity under high magnetic fields in this experimental configuration.
Raman spectrum
For low-temperature Raman spectroscopy measurements at National High Magnetic Field Laboratory, a 0.6 W 532 nm laser excitation was employed with a 2400 grooves/mm grating in a 0.75 FL spectrometer. To ensure better spectral resolution over a spectral window centered at 180 cm-1, a 30 entrance slit was used. For each set of measurement, high signal-to-noise ratio was obtained upon averaging over 3 acquisitions (360 s acquisition time). Moreover, the averaging would also eliminate the cosmic ray effects. The experiments were performed under unpolarized light conditions using a polarization scrambler. To perform high-temperature ( K) measurement, the laser power and grating were changed to 0.2 W and 1200 grooves/mm, respectively. In addition, the spectral window was centered at 470 cm-1.
Supplementary Fig. 1d plots the temperature-dependent Raman spectrum under zero magnetic field. A sharp peak is visible at 4.5 THz ( cm-1), consistent with previous studies [35, 37, 42]. Interestingly, as the temperature is lowered, a broadband feature around 3 THz ( cm-1) and a sharp feature at 3.5 THz ( cm-1) appear below 60 K, potentially suggesting an onset of inversion symmetry-breaking. Upon applying an in-plane magnetic field, no change in the Raman spectrum at 5 K was recorded as described in the 2D colormap in Supplementary Fig. 1e, ruling out the possibilities of magnon or magneto-phonon coupling.
Phenomenological fit of the SHG-RA patterns
For a normally incident probe beam, the SHG intensity as a function of the analyzer angle is given by the expression
| (S1) |
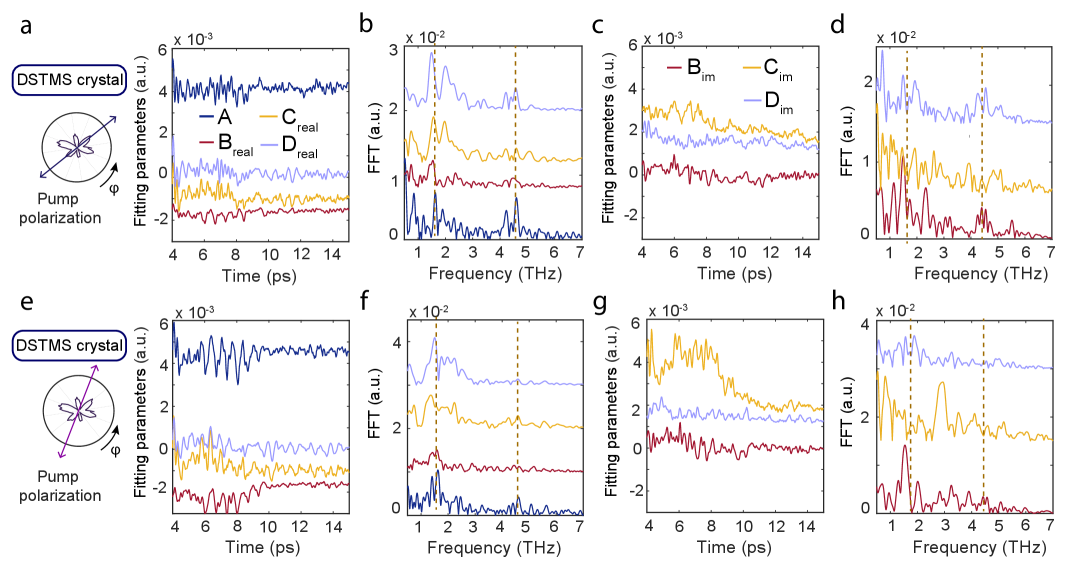
where and are phenomenological fit parameters, and can be written as a linear combination of the susceptibility tensor elements: , . All other components of the SHG tensor vanish within the electric dipole approximation as a consequence of the mirror plane perpendicular to -axis [25]. For convenience, we take to be a real number while is a complex quantity, i.e., [25, 38]. Using this formulation allows for a reasonable fit of the equilibrium SHG-RA patterns. However, this model breaks down for pumped SHG-RA patterns since and alone are unable to capture the THz field-induced large symmetry modulations as seen in Fig. 3d. To resolve this, we add extra terms in (S1):
| (S2) |
Here, and . Eq. (S2) enables us to fit the nonequilibrium SHG-RA patterns as a function of pump-probe delay time (Fig. 3e). A full derivation of Eqs. (S1)-(S2) is provided in the next section. To avoid complications, we restrict our analysis to the nonequilibrium SHG-RA patterns at time delays well beyond the TFISH response (see the phenomenological fitting movies in the Supplementary Materials).
For the pump polarization described in Supplementary Fig. 2a (THz is generated from a DSTMS source), the temporal evolution of the real and imaginary parts of the fitting parameters and are displayed in Supplementary Figs. 2a and 2c, respectively. The corresponding Fourier transform spectra are shown in Supplementary Figs. 2b and 2d, revealing pronounced phonon peaks at 1.7 and 4.5 THz. These results are consistent with other pump polarizations (Supplementary Fig. 2e–h) as well as different THz generation crystal (OH1, Supplementary Figs. 9–10).
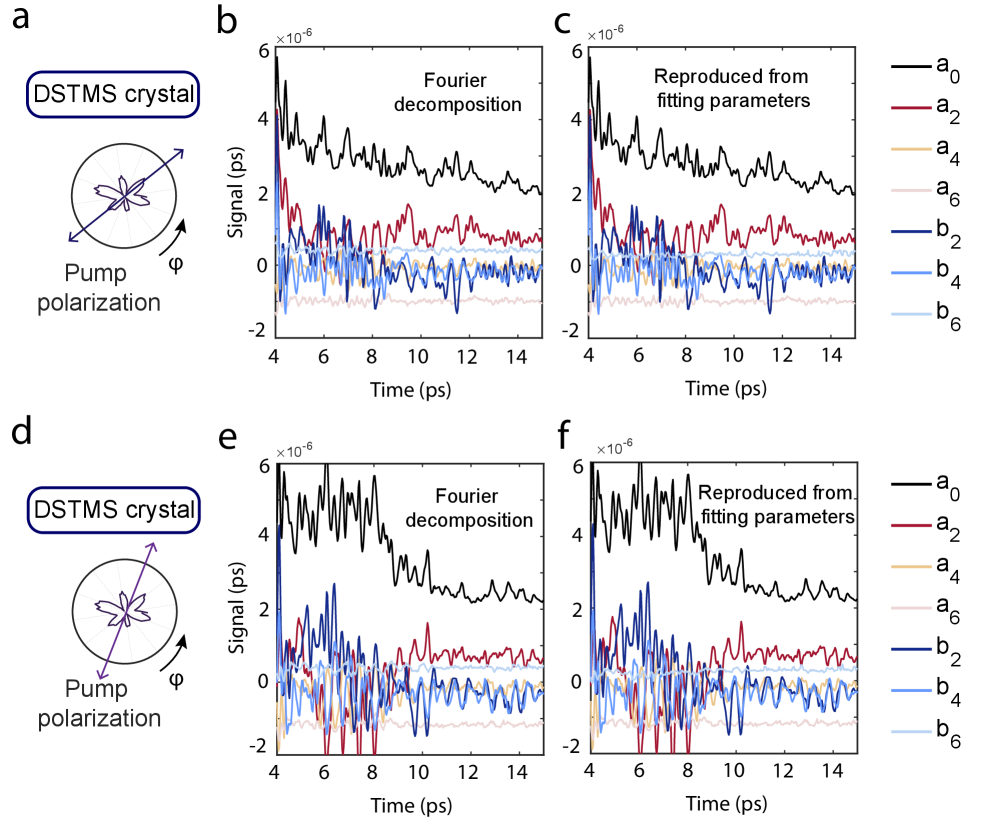
Alternatively, instead of fitting the data with Eq. (S2), we can Fourier decompose the nonequilibrium signal in the following form:
| (S3) |
where are the Fourier decomposition coefficients. Now, equating Eqs. (S2) and (S3) yields the following relations:
| (S4) | ||||
| (S5) | ||||
| (S6) | ||||
| (S7) | ||||
| (S8) | ||||
| (S9) | ||||
| (S10) |
Equations (S4)–(S10) imply that the Fourier coefficients can be reconstructed from the complex fit parameters . For the THz pump polarized along a lobe, the Fourier coefficients, obtained directly from the data and reconstructed from the fit parameters using Eqs. (S4)–(S10), are shown in Supplementary Figs. 3b and 3c, respectively. A similar analysis is presented in Supplementary Figs. 3e and 3f, where the THz pump is polarized along a node. From the figures, it is clear that the coefficients acquired from both methods exhibit strikingly similar trends, supporting the validity of our phenomenological fit analysis as well as the accuracy of the fit parameters.
SHG intensity derivation: symmetry-allowed tensor components
Although the atomic positions in MnPS3 are centrosymmetric, the onset of magnetic order breaks inversion symmetry, enabling a -type SHG response [39, 25, 38]. Below the Néel temperature , the magnetic point group reduces to , equivalent to monoclinic [61, 62]. Assuming the mirror plane lies in the plane, the non-vanishing elements of the second-order susceptibility tensor include:
Symmetry constraints further impose that . In the contracted 3×6 matrix notation used for in-plane excitation, the effective susceptibility tensor becomes:
We consider a normally incident electric field polarized at an angle with respect to the -axis
For convenience, we use . The components of second-order polarization can be written as,
| (S11) |
where . Using the above relation, the SHG polarization is expressed as
| (S12) |
From (S12), we obtain
| (S13) | ||||
| (S14) | ||||
| (S15) |
Here, we used the convention . Assuming the detector is aligned with the incident polarization direction
the detected SHG signal is thus the projection of the SHG polarization along the detector direction which gives
| (S16) | ||||
| (S17) | ||||
| (S18) |
SHG intensity derivation: lower symmetry case
In the photoinduced case, we consider a symmetry-lowered scenario where all elements may be nonzero. The susceptibility tensor is expressed as
Following the similar mathematical operations discussed earlier, we obtain the SHG polarization
| (S21) | ||||
| (S22) |
The detected signal can be written as
| (S23) | ||||
| (S24) | ||||
| (S25) |
Now, we compute the SHG intensity
| (S26) | ||||
| (S27) |
THz pump – magneto-optic probe measurements
Using the same laser source as tr-SHG measurements, we performed dynamic magneto-optic experiments under THz excitation. These measurements, which track changes in the polarization state of a transmitted 800 nm probe, include both THz-induced ellipticity change () and polarization rotation (). A quarter-wave plate (QWP) and a half-wave plate (HWP) were used to measure and , respectively. In both configurations, a Wollaston prism was placed after the waveplates in the beam path, splitting the beam into orthogonally-polarized components to be detected by two Thorlabs DET100A Si-based balanced detectors (Supplementary Fig. 4a-c). We note that for each temperature and experimental configuration, 60 individual measurements were acquired and averaged to improve the signal-to-noise ratio.
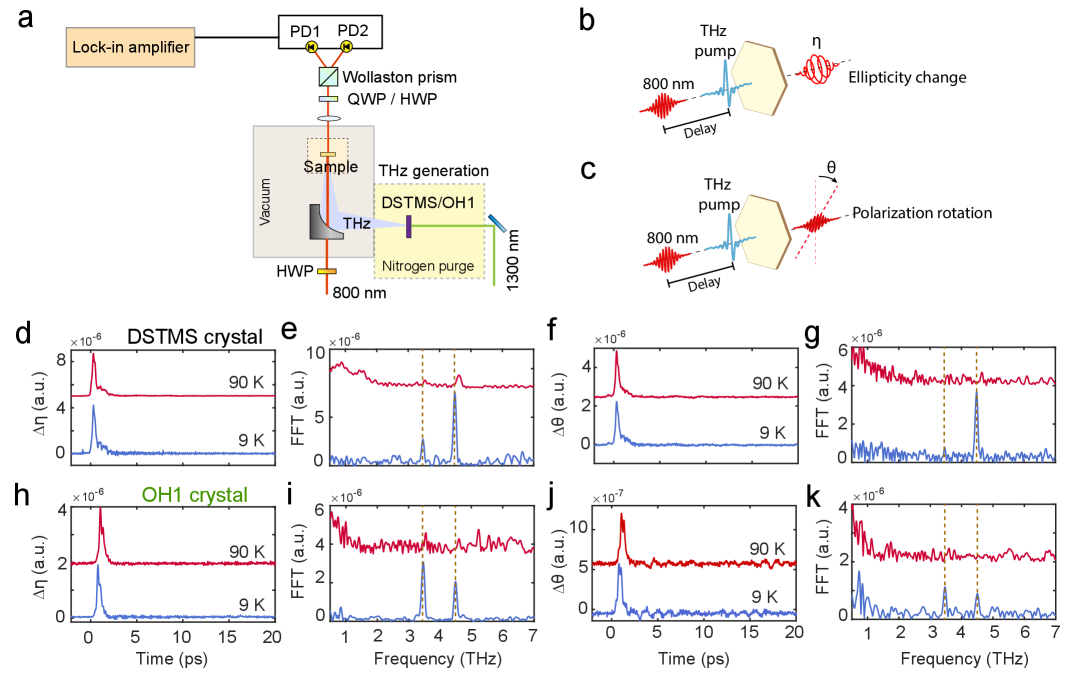
The time trace of THz-induced ellipticity change is shown in Supplementary Fig. 4d at below (9K, blue) and above (90 K, red) the . A DSTMS crystal was used for THz generation. The signals are vertically offset for clarity. A sharp peak appears near time zero which is followed by fast oscillations. The peak feature is ascribed to THz Kerr effect. Fourier transform of the oscillatory signal at 9 K reveals two Raman-active phonons at 3.5 THz and 4.5 THz (Supplementary Fig. 4e). At 90 K, both modes exhibit a blueshift and a marked reduction in amplitude, consistent with prior Raman measurements [37], and indicative of their coupling to the AFM order. In addition, temperature-dependent THz-induced polarization rotation signals are shown in Supplementary Fig. 4f, with the associated FFT spectra presented in Supplementary Fig. 4g. While the signal amplitude is notably weaker compared to the ellipticity response, both phonon modes are still resolved at 9 K. The phonon features also diminish in strength and exhibit a blueshift at 90 K, in tandem with the ellipticity change data.
Similar measurements were performed using a THz pump generated from an OH1 crystal (Supplementary Fig. 4h–k), yielding results consistent with the DSTMS data. The same Raman-active phonons at 3.5 THz and 4.5 THz were observed in both ellipticity change and polarization rotation channels, with comparable temperature-dependent behavior.
Symmetry modulation analysis when THz is polarized along a node
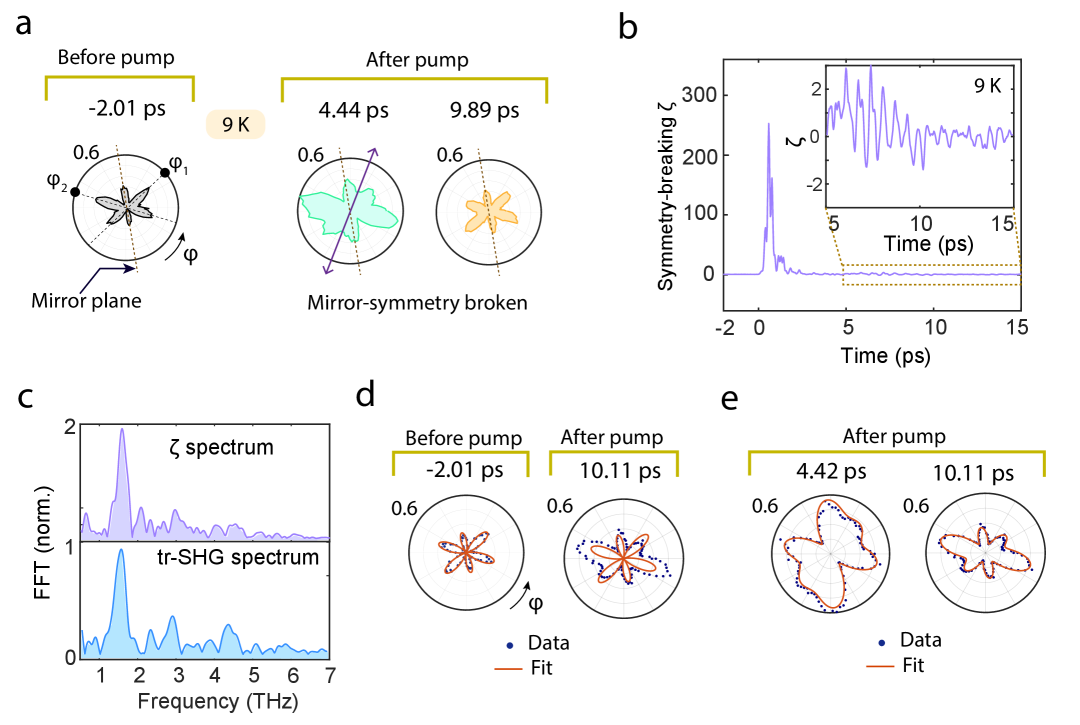
Time-resolved SHG dynamics above the AFM transition temperature
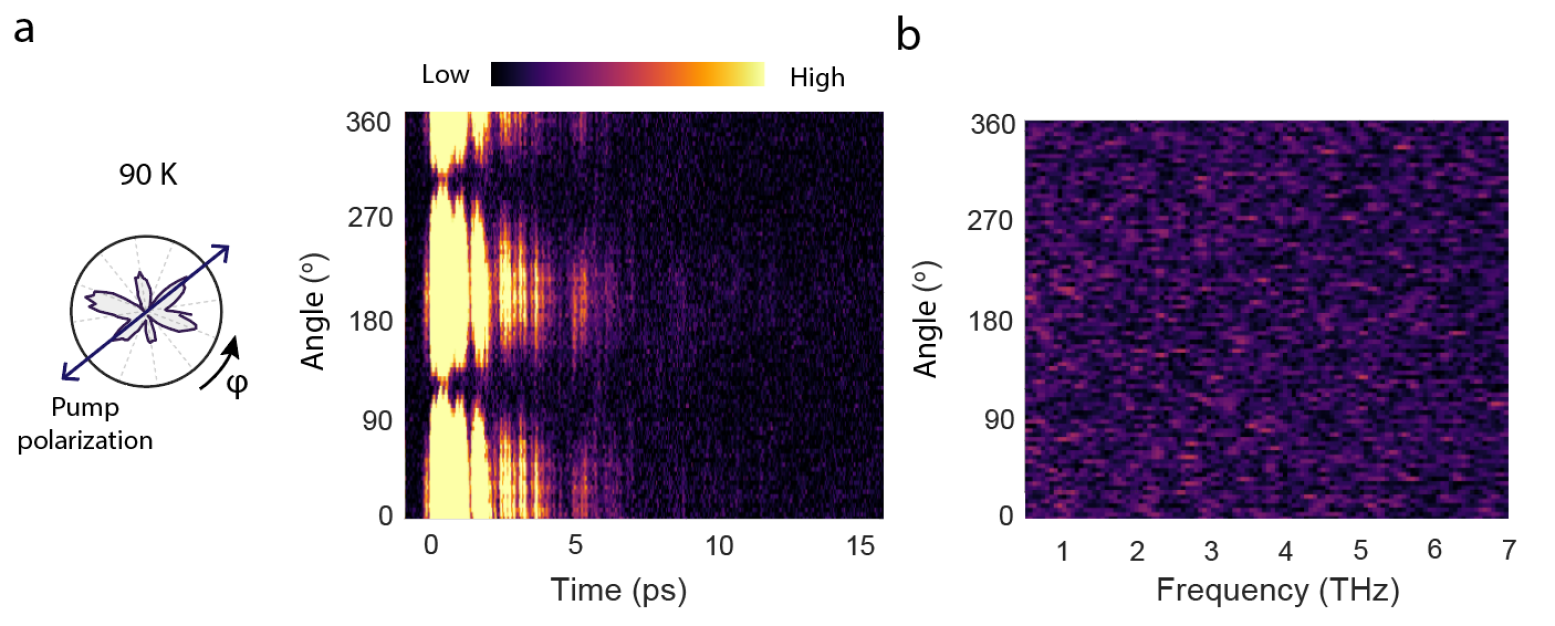
Dynamics with THz pump generated from OH1 crystal
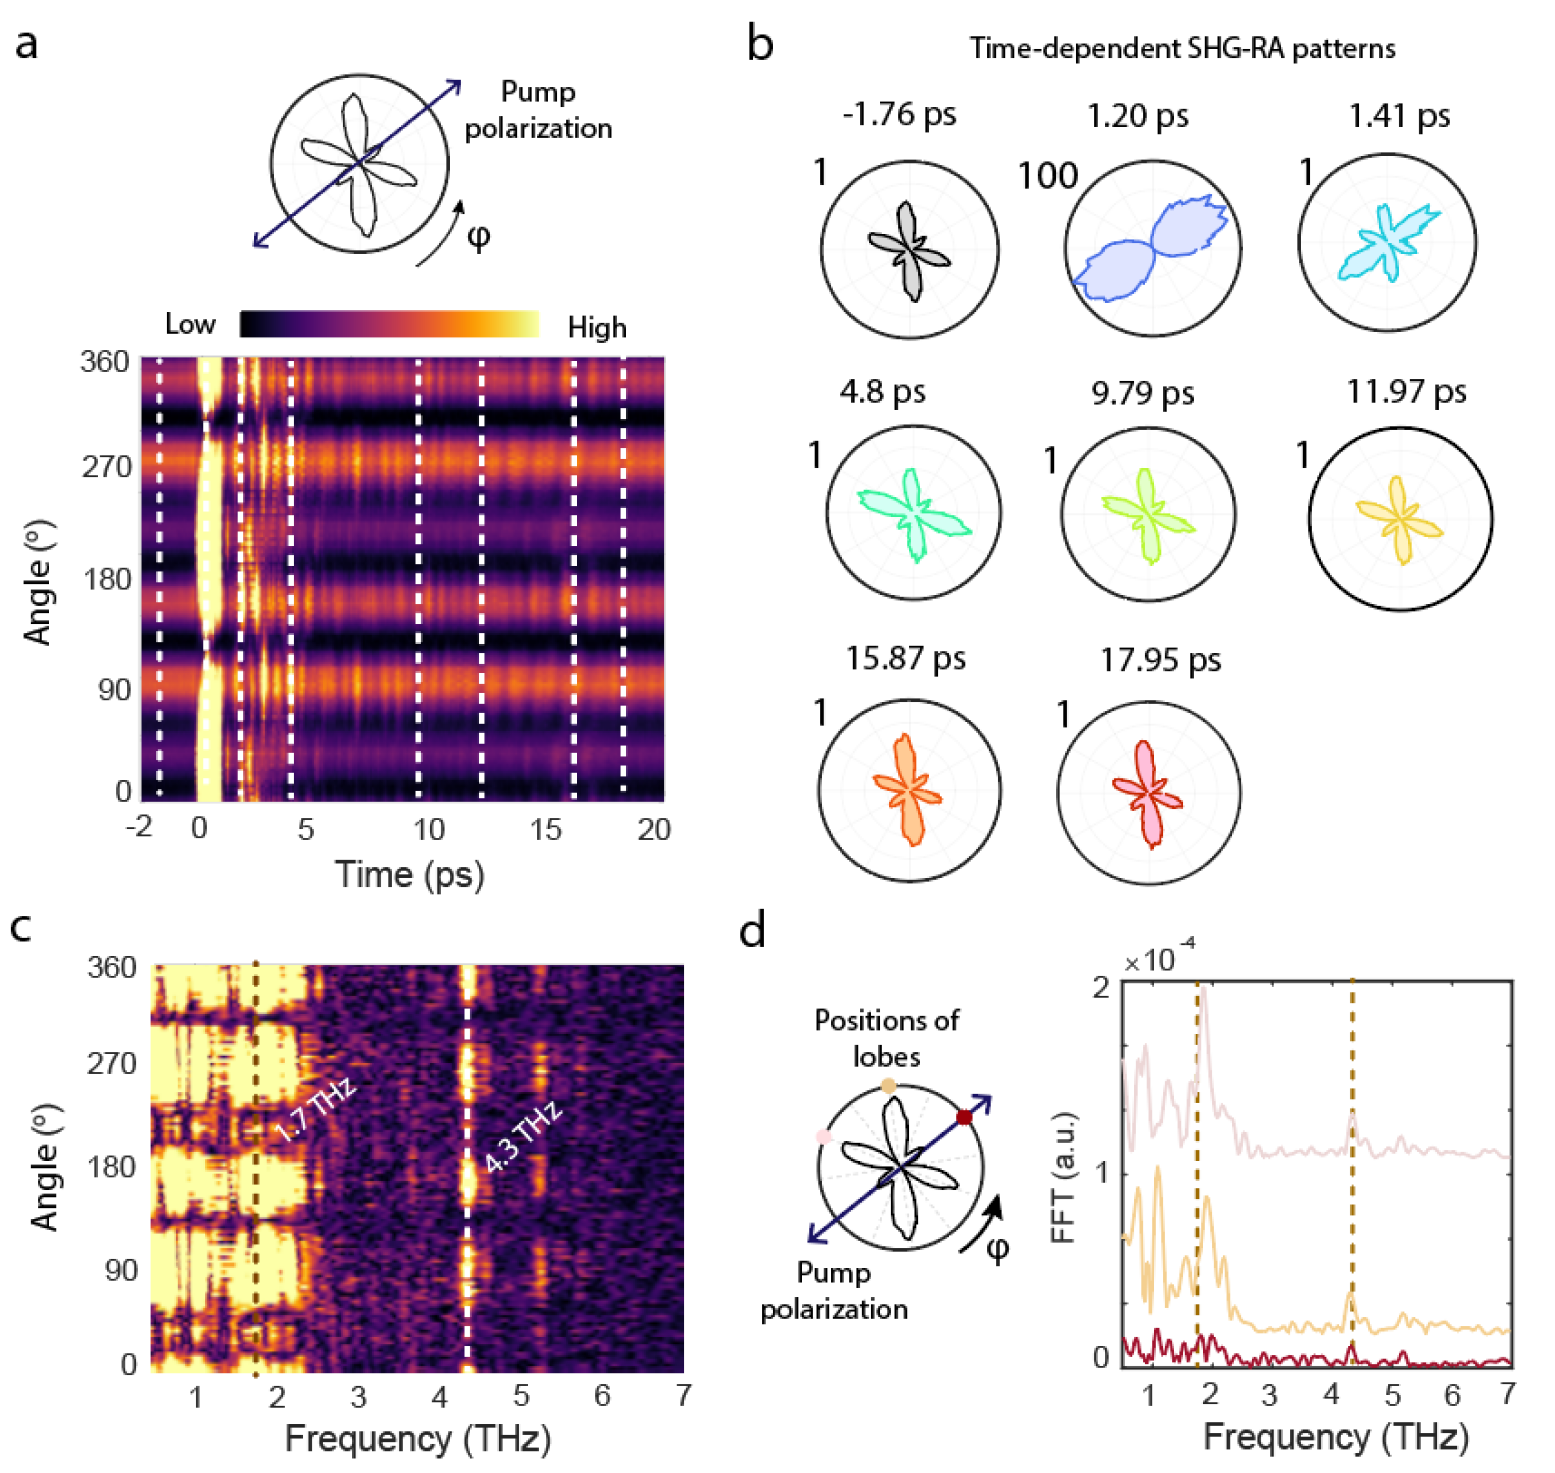
Field dependence of the coherent modes when THz is generated from OH1 crystal
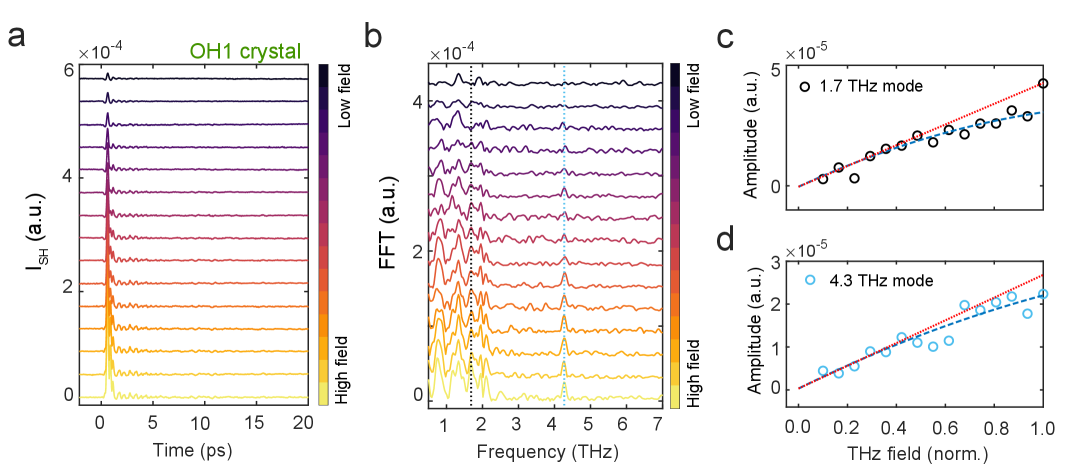
Symmetry modulation analysis when THz is generated from OH1 crystal
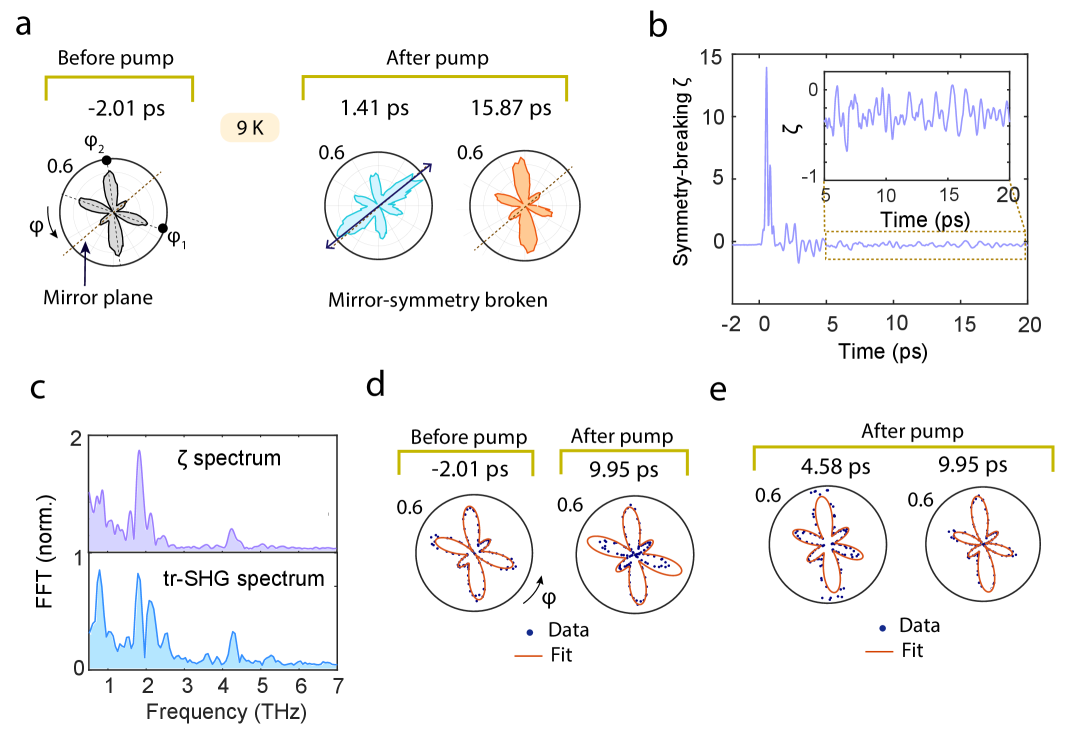
Dynamics of phenomenological fitting parameters (OH1 generation crystal)
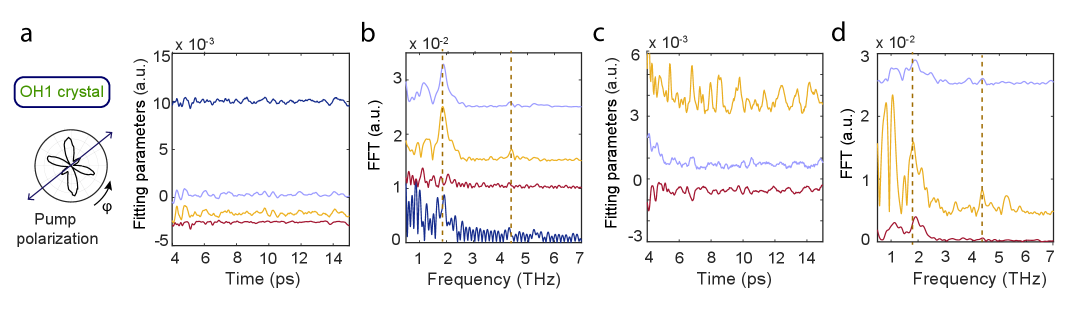
THz-induced modification of bond strength derived from tight-binding model calculation
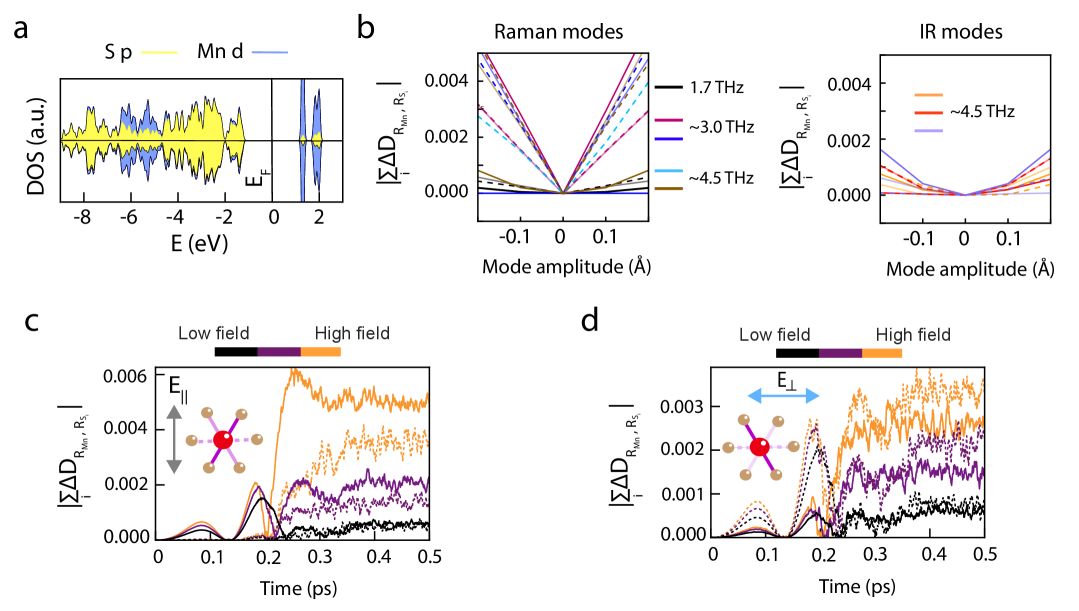
Constrained DFT simulation of 4.5 THz Raman mode driving under charge transfer condition
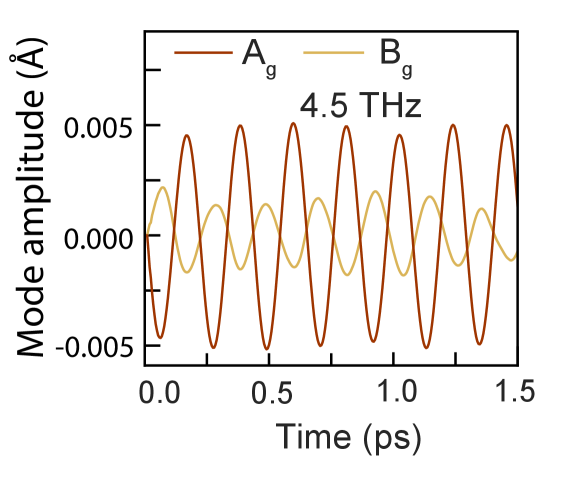
Movies showing temporal evolution of SHG-RA patterns
We provide four movies visualizing the time evolution of SHG-RA patterns under strong-field THz excitation (peak field strength kV/cm) at 9 K, using a DSTMS crystal for THz generation:
-
•
Movie S1: THz field is polarized along a lobe (equivalent to ) of the static SHG-RA pattern, displayed with a fixed radial scale (capped at ) to enable direct temporal comparison.
-
•
Movie S2: THz field is polarized along a node (equivalent to ), also shown with a fixed radial scale for consistent comparison across delay times.
-
•
Movie S3: Same configuration as Movie S1 (THz field polarized along a lobe), but using a dynamic radial scale that adjusts to the signal magnitude in each frame.
-
•
Movie S4: Same configuration as Movie S2 (THz field polarized along a node), also displayed with a dynamic radial scale.
All four movies are provided as individual .mp4 files.
Movies showing dynamical phenomenological fitting
Two additional movies present time-resolved phenomenological fitting of SHG-RA patterns at 9 K under THz excitation:
-
•
Movie S5: THz field is polarized along a lobe. Experimental SHG-RA patterns (solid blue circles) are fitted at each time step using the expression in Eq. (S27) in Supplementary Materials, with red curves representing the phenomenological fits using complex fitting parameters , , , and . For better visibility, the fixed radial scale is capped at .
-
•
Movie S6: THz field is polarized along a node, with experimental data and fitting displayed in the same format as in Movie S5.
These fitting dynamics are also provided as separate .mp4 files.