Two-component diffuse Galactic gamma-ray emission revealed with Fermi-LAT
Abstract
The enigma of cosmic ray origin and propagation stands as a key question in particle astrophysics. The precise spatial and spectral measurements of diffuse Galactic gamma-ray emission provide new avenues for unraveling this mystery. Based on 16 years of Fermi-LAT observations, we find that the diffuse gamma-ray spectral shapes are nearly identical for low energies (below a few GeV) but show significant dispersion at high energies (above a few GeV) across the Galactic disk. We further show that the diffuse emission can be decomposed into two components, a universal spectral component dominating at low energies which is consistent with the expectation from interactions of background cosmic rays and the interstellar matter, and a spatially variant component dominating at high energies which is likely due to local accelerators. These findings suggest that there is dual-origin of the Galactic diffuse emission, including the “cosmic ray sea” from efficient propagation of particles and the “cosmic ray islands” from inefficient propagation of particles, and thus shed new light on the understanding of the propagation models of Galactic cosmic rays.
Galactic cosmic rays (CRs) are believed to be accelerated by extreme accelerators in the Milky Way, such as the remnants of supernova explosions or jets from black hole accreting systems. These energetic particles are then injected into the Milky Way, propagate diffusively and interact with the interstellar medium (ISM) and radiation field (ISRF), producing secondary particles and radiation. Measurements of the spectra of primary and secondary CRs, as well as diffuse rays, verify that, at the zeroth order approximation, this conventional paradigm can hold (at least for the low-energy band with TeV/n) [1].
Recent new observations indicate that this conventional paradigm needs to be refined or revised. Direct measurements of spectra of primary CRs revealed spectral hardenings around hundreds of GV and subsequent softenings around TV [2, 3, 4, 5, 6, 7, 8, 9, 10]. Combined with the correlated structures in the large-scale anisotropies, a nearby source contribution seems to be a natural explanation of these features in both the spectra and anisotropies [11, 12, 13]. On the other hand, observations of secondary spectra of CRs show more prominent hardenings than the primary particles [14, 15, 16]. Furthermore, measurements of diffuse -ray emission in the very to ultra high-energy bands [17, 18, 19, 20, 21] and also the diffuse Galactic neutrino emission [22] also show excesses compared with the conventional CR propagation model predictions. These secondary CRs and radiation excesses may indicate that more grammages of high energy particles experience than expected in the conventional transport scenario, possibly due to confinement of particles around the acceleration sources [23, 24, 25]. The above primary and secondary spectral features may be unified in the sense that, the nearby source close to the Earth may exist generally in the Milky Way, leaving imprints on the secondary nuclei and diffuse emission.
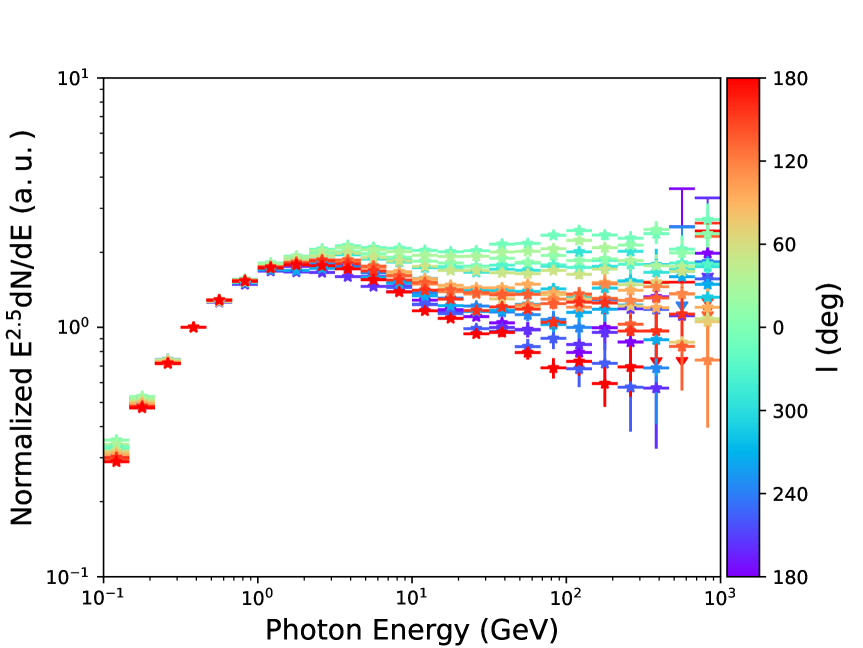
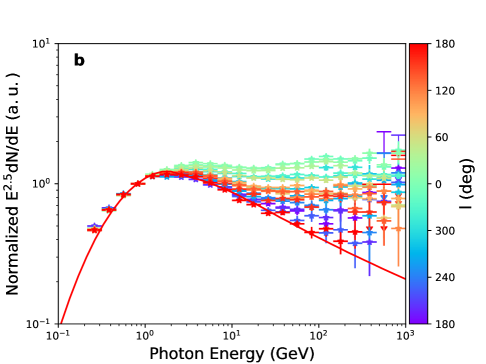
Here we report the analysis of the diffuse -ray emission from the Galactic plane with 16 years of Fermi-LAT data, to test the new propagation and interaction scenario of Galactic CRs. We divide the Galactic plane (with ) into 18 regions, each spanning a longitude range of . The resolved sources in the 4th Fermi-LAT catalog [26, 27] and the isotropic diffuse emission have been subtracted, and the spectra and spatial distributions of the Galactic diffuse component are derived. See the Methods for more details of the data analysis. The obtained spectral energy distribution (SEDs) of the 18 regions, normalized at 0.6 GeV, are shown in Figure 1. One can see that at low-energies ( GeV), the SEDs of all these regions are highly consistent with each other, suggesting a uniform origin of the emission. However, for energies above a few GeV, significant variations of the fluxes and spectral shapes are present. We can also find a trend that the high energy spectra are harder in the Galactic center regions than in the anti-center regions. A spectral index close to in the inner Galaxy region is also consistent with previous results by the Fermi-LAT collaboration [28].
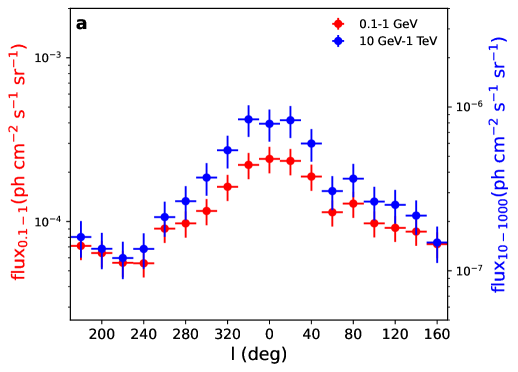
To better see the variations of the emission accross the Galactic plane, we show in Figure 2 the fluxes (panel a) and power-law indices (panel b) obtained through fitting the SEDs in the GeV and GeV bands, respectively. The fluxes in both energy bands show clear spatial variations in different regions, with higher fluxes in the inner Galaxy regions and lower fluxes in the outer regions. However, the high energy fluxes show more prominent variations than the low energy ones. The spectral indices are distinct in these two energy bands, as shown in panel b. In the low energy band, the indices are almost constant, , across the Galactic plane. The fitting with a constant yields a over degree-of-freedom (dof) of . For the high energy part, the spectral indices fluctuate significantly. A constant fitting gives , indicating that the data deviate from the constant assumption at a significance of .
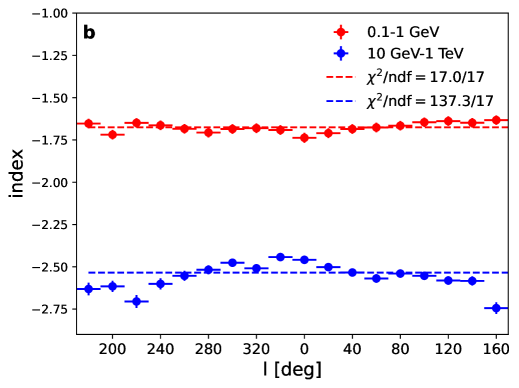
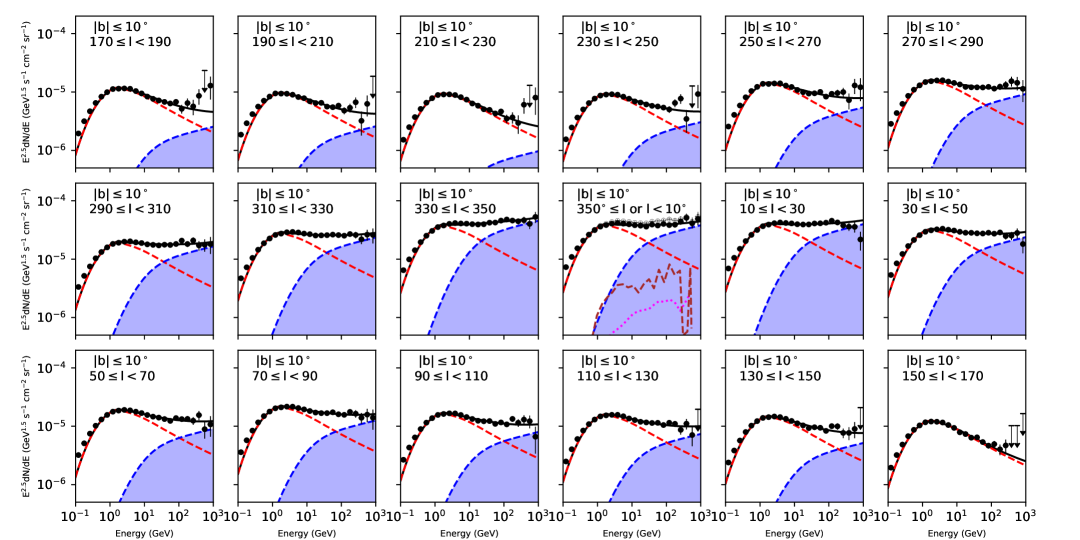
The spectral variations indicate that the low-energy and high-energy parts of the diffuse emission may have different origin. We decompose the emission into two components: the A component which dominates in the low-energy band and the B component which is more significant at high energies. We further note that the diffuse emission in the low-energy band is close to the expected -ray spectrum from hadronic interactions between the measured proton fluxes and the ISM, as shown in Figure A1. Therefore we fix the spectrum of component A to be the expected one from locally measured proton spectrum, leaving only the flux normalizations free to be fitted. For component B, we also assume it has a hadronic origin, and parameterize the corresponding proton spectrum as a power-law with low-energy cutoff. The low-energy cutoff is phenomenologically employed to avoid over-shooting the data at low energies. The spectral index and cutoff energy of component B are assumed to be the same in the 18 regions, and the flux normalizations are free to vary. We fit the spectra in the 18 regions for GeV since at low energies there should be contribution from CR electrons and positrons. The derived fluxes of the two components, integrated in an energy band of GeV, are shown in Figure 3, and the best-fitting spectra compared with the measurements of the 18 regions are given in Figure A2. For comparison, we overplot in Figure 3 the gas distribution from the PLANCK dust opacity measurements [33] and the distributions of several candidate CR source populations including supernova remnants [29], pulsars [30, 31], and OB stars [32]. It is very interesting to find that the longitude distribution of component A is close to that of the gas distribution, while component B is closer to those of CR sources. For the four types of source distributions, the pulsars given in Ref. [31] and supernova remnants seem to match with the data better than the others.
The findings obtained in this work thus point to a paradigm with dual-origin of the Galactic diffuse -ray emission. Component A is more smoothly distributed in the Galaxy with a universal spectral shape, which may correspond to a “background sea” due to CRs experiencing adequate propagation. Component B has a harder spectrum and is more concentrated to the inner Galaxy region with a possible association with the source distribution, which may be due to recently accelerated particles not adequately propagate throughout the Galaxy. In contrast to the low-energy “sea” component, we define component B as “CR island”. This dual-component of the diffuse emission reflects the natural expectation of the time-dependence of the production and propagation of CRs. For particles freshly accelerated, they may get trapped in the source region and interact with the ISM surrounding the sources. With the increase of time, those particles would diffuse out and interact with the diffuse ISM throughout the Galaxy. For those sources compact and bright enough, they may be identified (as pointlike or extended source) and subtracted in the analysis. The rest sources form an unresolved population of low surface brightness sources and a truly diffuse component, which give the measured “diffuse” emission of this work.
Our results are likely correlated with the excesses of the diffuse -ray emission above TeV revealed by several experiments [18, 19, 20, 21]. Compared with the model prediction from the CR sea, the data show excesses from several GeV to TeV which could be explained by an exponential cutoff power-law component with spatial distribution being consistent with the assumed source distribution [34]. One of the most natural explanations is the unresolved sources [35, 36, 37]. Remarkably extended sources in the very high energy rays have been detected [38], which may just reflect the fact that they are due to particles not propagating far away from the acceleration sites. Considering that sources like the Cygnus bubble may exist in general in the Galaxy, the diffuse -ray excesses can be well accounted for [23, 24, 25].
The two-component Galactic diffuse -ray emission offers new insights in understanding the long-standing puzzle of the origin and propagation of Galactic CRs. It indicates that the traditional steady-state calculation of the propagation of CRs and the production of secondary particles and radiation needs to be refined to include the time evolution [39]. Further tests of this paradigm may include precise measurements of the diffuse emission above TeV energies without source masks, as well as multi-messenger observations of CRs and neutrinos.
Acknowledgements.
This work is supported by the National Natural Science Foundation of China (No. 12220101003, No. 12333006, No. 12263004) and the Project for Young Scientists in Basic Research of Chinese Academy of Sciences (No. YSBR-061).Appendix A Fermi-LAT data analysis
We select 16 years of the Fermi-LAT data, from August 4, 2008 to August 4, 2024 in the analysis. The reconstruction version of the data is P8R3_SOURCE_V3. To reduce the effect from the Earth atmosphere, we exclude the events with zenith angles larger than . The energy range of GeV is selected. The data are binned into 6 logarithmically even energy bins per decade, and angular bins. We use Fermipy v1.4.0 to analyze the data. Detected sources are modelled based on the 4FGL-DR4 catalog [27]. The region of interest (ROI) of the analysis is , and the whole Galactic plane is further divided into 18 sub-regions, each with span in longitudes. The source map has a size of covering each sub-region to reduce the edge effect due to the point spread function (PSF). The Galactic background model used is gll_iem_v07.fits, and the isotropic diffuse background used is iso_P8R3_SOURCE_V3.txt. For each ROI, we re-fit the normalization parameters of all the sources and the diffuse backgrounds. After the fitting, we subtract the detected sources and the isotropic background from the data, and ascribe the rest as Galactic diffuse emission. The Galactic diffuse fluxes are then computed with the residual number of photons divided by the energy interval of each bin, the mean exposure, and the solid angle of the ROI. Due to the large PSF for energies below 500 MeV, we apply an energy-dependent PSF correction using the instrument response model provided in gll_iem_v07.fits, i.e., to estimate the fractions of photons entering and leaking out of the ROI for given spatial template.
For the region including the Galactic center, the emission of Fermi bubbles and the Galactic center excess (GCE), which may have different origin from the CR interactions, need to be subtracted. For the Fermi bubbles, we employ the spectrum derived for region [40], and re-scale to our ROI of , according to the bubble template given in Ref. [41], assuming uniform emission of the bubbles. As for the GCE, we adopt the results given in Ref. [42], and again apply a re-scaling according to the spatial profile of the GCE. The fluxes of Fermi bubbles and GCE are over-plotted in the central-most panel of Figure A2.
Appendix B Two-component model fitting of the spectra
The -ray spectrum from inelastic hadronic interactions between high-energy CR protons and the ISM (assumed to be pure hydrogen) can be derived as
| (1) |
where and are the (kinetic) energy of CR protons and secondary -ray photons, is the velocity of protons and is the speed of light, is the number density of the ISM, is the differential cross section of -ray production, and is the flux of protons. For the cross section, we use the interpolation routine AAfrag based on simulation generated tables [43].
We use two components of CRs to fit the diffuse -ray emission, as
| (2) |
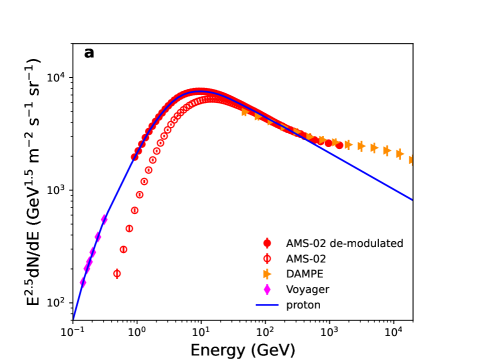
For component A, we use an interpolation of the direct measurements of proton fluxes by Voyager [44], AMS-02 [6], and DAMPE [7]. The AMS-02 data are de-modulated to correct the solar modulation effect, based on a force-field model [45] with modulation potential of 0.43 GV. See the left panel of Figure A1 for the measurements and the interpolated flux of CR protons. Since the high-energy spectrum of protons deviate from the power-law form, which may be due to the contribution from a nearby source [11, 12, 13], the interpolation is done based on the data below 200 GeV. The -ray spectrum derived by this component is shown in the right panel of Figure A1.
The spectrum of component B, , is assumed to be a power-law with a low-energy cutoff
| (3) |
where is the spectral index, and is the cutoff energy.
When fitting to the data, the normalizations of component A and B in each ROI are left free, while the index and cutoff energy of component B are assumed to be uniform among all ROIs. Fitting results of the spectra in the 18 ROIs are shown in Figure A2.
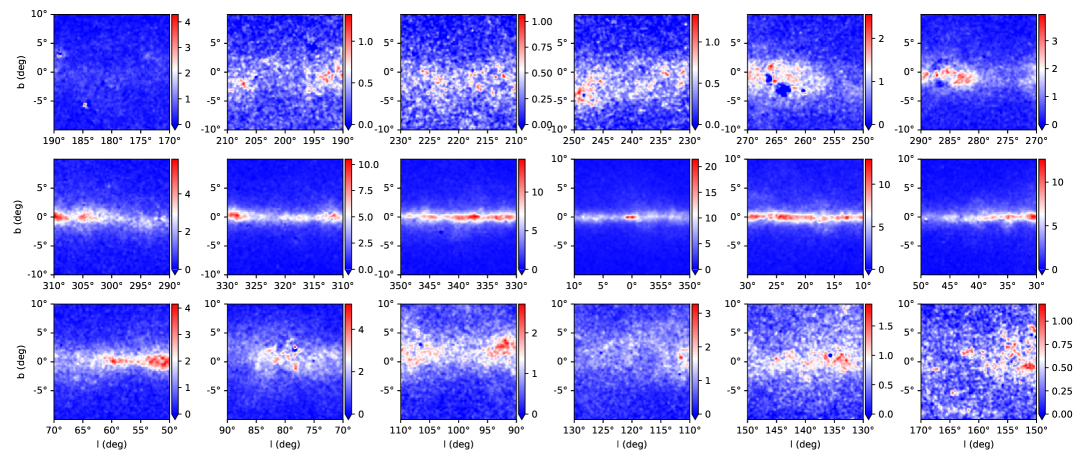
In Figure A3, we plot the two-dimensional residual maps for energies higher than 10 GeV, which are expected to be mainly from component B. To obtain the residual maps, we subtract component A using its best-fitting spectrum times the spatial distribution (as given by the model gll_iem_v07.fits) at 1 GeV. The maps are smoothed with Gaussian kernels with a width of 0.16 degrees. This plot reflects approximately the spatial distributions of component B in the sky.
References
- Strong et al. [2007] A. W. Strong, I. V. Moskalenko, and V. S. Ptuskin, Cosmic-ray propagation and interactions in the Galaxy, Ann. Rev. Nucl. Part. Sci. 57, 285 (2007), arXiv:astro-ph/0701517 .
- Adriani et al. [2011] O. Adriani et al. (PAMELA), PAMELA Measurements of Cosmic-ray Proton and Helium Spectra, Science 332, 69 (2011), arXiv:1103.4055 [astro-ph.HE] .
- Aguilar et al. [2015] M. Aguilar et al. (AMS), Precision Measurement of the Proton Flux in Primary Cosmic Rays from Rigidity 1 GV to 1.8 TV with the Alpha Magnetic Spectrometer on the International Space Station, Phys. Rev. Lett. 114, 171103 (2015).
- Yoon et al. [2017] Y. S. Yoon et al., Proton and Helium Spectra from the CREAM-III Flight, Astrophys. J. 839, 5 (2017), arXiv:1704.02512 [astro-ph.HE] .
- Atkin et al. [2018] E. Atkin et al., New Universal Cosmic-Ray Knee near a Magnetic Rigidity of 10 TV with the NUCLEON Space Observatory, JETP Lett. 108, 5 (2018), arXiv:1805.07119 [astro-ph.HE] .
- Aguilar et al. [2021] M. Aguilar et al. (AMS), The Alpha Magnetic Spectrometer (AMS) on the international space station: Part II — Results from the first seven years, Phys. Rept. 894, 1 (2021).
- An et al. [2019] Q. An et al. (DAMPE), Measurement of the cosmic-ray proton spectrum from 40 GeV to 100 TeV with the DAMPE satellite, Sci. Adv. 5, eaax3793 (2019), arXiv:1909.12860 [astro-ph.HE] .
- Alemanno et al. [2021] F. Alemanno et al., Measurement of the cosmic ray helium energy spectrum from 70 GeV to 80 TeV with the DAMPE space mission, Phys. Rev. Lett. 126, 201102 (2021), arXiv:2105.09073 [astro-ph.HE] .
- Adriani et al. [2022] O. Adriani et al. (CALET), Observation of Spectral Structures in the Flux of Cosmic-Ray Protons from 50 GeV to 60 TeV with the Calorimetric Electron Telescope on the International Space Station, Phys. Rev. Lett. 129, 101102 (2022), arXiv:2209.01302 [astro-ph.HE] .
- Adriani et al. [2023] O. Adriani et al. (CALET), Direct Measurement of the Cosmic-Ray Helium Spectrum from 40 GeV to 250 TeV with the Calorimetric Electron Telescope on the International Space Station, Phys. Rev. Lett. 130, 171002 (2023), arXiv:2304.14699 [astro-ph.HE] .
- Savchenko et al. [2015] V. Savchenko, M. Kachelrieß, and D. V. Semikoz, Imprint of a 2 Million Year old Source on the Cosmic-ray Anisotropy, Astrophys. J. Lett. 809, L23 (2015), arXiv:1505.02720 [astro-ph.HE] .
- Ahlers [2016] M. Ahlers, Deciphering the Dipole Anisotropy of Galactic Cosmic Rays, Phys. Rev. Lett. 117, 151103 (2016), arXiv:1605.06446 [astro-ph.HE] .
- Liu et al. [2019] W. Liu, Y.-Q. Guo, and Q. Yuan, Indication of nearby source signatures of cosmic rays from energy spectra and anisotropies, JCAP 10, 010, arXiv:1812.09673 [astro-ph.HE] .
- Aguilar et al. [2018] M. Aguilar et al. (AMS), Observation of New Properties of Secondary Cosmic Rays Lithium, Beryllium, and Boron by the Alpha Magnetic Spectrometer on the International Space Station, Phys. Rev. Lett. 120, 021101 (2018).
- Alemanno et al. [2022] F. Alemanno et al. (DAMPE), Detection of spectral hardenings in cosmic-ray boron-to-carbon and boron-to-oxygen flux ratios with DAMPE, Sci. Bull. 67, 2162 (2022), arXiv:2210.08833 [astro-ph.HE] .
- Alemanno et al. [2025] F. Alemanno et al. (DAMPE, (DAMPE Collaboration)*), Observation of a Spectral Hardening in Cosmic Ray Boron Spectrum with the DAMPE Space Mission, Phys. Rev. Lett. 134, 191001 (2025), arXiv:2412.11460 [astro-ph.HE] .
- Atkins et al. [2005] R. Atkins et al. (Milagro), Evidence for TeV gamma-ray emission from the galactic plane, Phys. Rev. Lett. 95, 251103 (2005), arXiv:astro-ph/0502303 .
- Amenomori et al. [2021] M. Amenomori et al. (Tibet ASgamma), First Detection of sub-PeV Diffuse Gamma Rays from the Galactic Disk: Evidence for Ubiquitous Galactic Cosmic Rays beyond PeV Energies, Phys. Rev. Lett. 126, 141101 (2021), arXiv:2104.05181 [astro-ph.HE] .
- Cao et al. [2023] Z. Cao et al. (LHAASO), Measurement of Ultra-High-Energy Diffuse Gamma-Ray Emission of the Galactic Plane from 10 TeV to 1 PeV with LHAASO-KM2A, Phys. Rev. Lett. 131, 151001 (2023), arXiv:2305.05372 [astro-ph.HE] .
- Cao et al. [2025] Z. Cao et al. (LHAASO), Measurement of Very-High-Energy Diffuse Gamma-Ray Emissions from the Galactic Plane with LHAASO-WCDA, Phys. Rev. Lett. 134, 081002 (2025), arXiv:2411.16021 [astro-ph.HE] .
- Alfaro et al. [2024] R. Alfaro et al. (HAWC), Galactic Gamma-Ray Diffuse Emission at TeV Energies with HAWC Data, Astrophys. J. 961, 104 (2024), arXiv:2310.09117 [astro-ph.HE] .
- Abbasi et al. [2023] R. Abbasi et al. (IceCube), Observation of high-energy neutrinos from the Galactic plane, Science 380, adc9818 (2023), arXiv:2307.04427 [astro-ph.HE] .
- Zhang et al. [2022] P.-p. Zhang, B.-q. Qiao, Q. Yuan, S.-w. Cui, and Y.-q. Guo, Ultrahigh-energy diffuse gamma-ray emission from cosmic-ray interactions with the medium surrounding acceleration sources, Phys. Rev. D 105, 023002 (2022), arXiv:2107.08280 [astro-ph.HE] .
- Sun et al. [2024] D.-X. Sun, P.-P. Zhang, Q. Yuan, W. Liu, and Y.-Q. Guo, Multimessenger observations support cosmic ray interactions surrounding acceleration sources, Phys. Rev. D 110, 103039 (2024), arXiv:2307.02372 [astro-ph.HE] .
- Yang and Aharonian [2025] R.-z. Yang and F. Aharonian, Confinement of relativistic particles in the vicinity of accelerators: A key for understanding the anomalies in secondary cosmic rays, Phys. Rev. D 111, 083040 (2025), arXiv:2410.22199 [astro-ph.HE] .
- Abdollahi et al. [2020] S. Abdollahi et al. (Fermi-LAT), Large Area Telescope Fourth Source Catalog, Astrophys. J. Suppl. 247, 33 (2020), arXiv:1902.10045 [astro-ph.HE] .
- Abdollahi et al. [2022] S. Abdollahi et al. (Fermi-LAT), Incremental Fermi Large Area Telescope Fourth Source Catalog, Astrophys. J. Supp. 260, 53 (2022), arXiv:2201.11184 [astro-ph.HE] .
- Ackermann et al. [2012] M. Ackermann et al. (Fermi-LAT), Fermi-LAT Observations of the Diffuse Gamma-Ray Emission: Implications for Cosmic Rays and the Interstellar Medium, Astrophys. J. 750, 3 (2012), arXiv:1202.4039 [astro-ph.HE] .
- Case and Bhattacharya [1998] G. L. Case and D. Bhattacharya, A new sigma-d relation and its application to the galactic supernova remnant distribution, Astrophys. J. 504, 761 (1998), arXiv:astro-ph/9807162 .
- Lorimer et al. [2006] D. R. Lorimer et al., The Parkes multibeam pulsar survey: VI. Discovery and timing of 142 pulsars and a Galactic population analysis, Mon. Not. Roy. Astron. Soc. 372, 777 (2006), arXiv:astro-ph/0607640 .
- Yusifov and Kucuk [2004] I. Yusifov and I. Kucuk, Revisiting the radial distribution of pulsars in the galaxy, Astron. Astrophys. 422, 545 (2004), arXiv:astro-ph/0405559 .
- Bronfman et al. [2000] L. Bronfman, S. Casassus, J. May, and L. A. Nyman, The radial distribution of ob star formation in the galaxy, Astron. Astrophys. 358, 521 (2000), arXiv:astro-ph/0006104 .
- Aghanim et al. [2016] N. Aghanim et al. (Planck), Planck intermediate results. XLVIII. Disentangling Galactic dust emission and cosmic infrared background anisotropies, Astron. Astrophys. 596, A109 (2016), arXiv:1605.09387 [astro-ph.CO] .
- Zhang et al. [2023] R. Zhang, X. Huang, Z.-H. Xu, S. Zhao, and Q. Yuan, Galactic Diffuse -Ray Emission from GeV to PeV Energies in Light of Up-to-date Cosmic-Ray Measurements, Astrophys. J. 957, 43 (2023), arXiv:2305.06948 [astro-ph.HE] .
- Linden and Buckman [2018] T. Linden and B. J. Buckman, Pulsar TeV Halos Explain the Diffuse TeV Excess Observed by Milagro, Phys. Rev. Lett. 120, 121101 (2018), arXiv:1707.01905 [astro-ph.HE] .
- Yan et al. [2024] K. Yan, R.-Y. Liu, R. Zhang, C.-M. Li, Q. Yuan, and X.-Y. Wang, Insights from LHAASO and IceCube into the origin of the Galactic diffuse teraelectronvolt–petaelectronvolt emission, Nature Astron. 8, 628 (2024), arXiv:2307.12363 [astro-ph.HE] .
- Vecchiotti et al. [2022] V. Vecchiotti, F. Zuccarini, F. L. Villante, and G. Pagliaroli, Unresolved Sources Naturally Contribute to PeV Gamma-Ray Diffuse Emission Observed by Tibet AS, Astrophys. J. 928, 19 (2022), arXiv:2107.14584 [astro-ph.HE] .
- Cao et al. [2024] Z. Cao et al. (LHAASO), An ultrahigh-energy -ray bubble powered by a super PeVatron, Sci. Bull. 69, 449 (2024), arXiv:2310.10100 [astro-ph.HE] .
- Marinos et al. [2025] P. D. Marinos, T. A. Porter, G. P. Rowell, G. Jóhannesson, and I. V. Moskalenko, On the Temporal Variability of the Galactic Multi-TeV Interstellar Emissions, Astrophys. J. 981, 93 (2025), arXiv:2411.03553 [astro-ph.HE] .
- Ackermann et al. [2014] M. Ackermann et al. (Fermi-LAT), The Spectrum and Morphology of the Bubbles, Astrophys. J. 793, 64 (2014), arXiv:1407.7905 [astro-ph.HE] .
- Su et al. [2010] M. Su, T. R. Slatyer, and D. P. Finkbeiner, Giant Gamma-ray Bubbles from Fermi-LAT: AGN Activity or Bipolar Galactic Wind?, Astrophys. J. 724, 1044 (2010), arXiv:1005.5480 [astro-ph.HE] .
- Ackermann et al. [2017] M. Ackermann et al. (Fermi-LAT), The Fermi Galactic Center GeV Excess and Implications for Dark Matter, Astrophys. J. 840, 43 (2017), arXiv:1704.03910 [astro-ph.HE] .
- Kachelrieß et al. [2019] M. Kachelrieß, I. V. Moskalenko, and S. Ostapchenko, AAfrag: Interpolation routines for Monte Carlo results on secondary production in proton-proton, proton-nucleus and nucleus-nucleus interactions, Comput. Phys. Commun. 245, 106846 (2019), arXiv:1904.05129 [hep-ph] .
- Cummings et al. [2016] A. C. Cummings, E. C. Stone, B. C. Heikkila, N. Lal, W. R. Webber, G. Jóhannesson, I. V. Moskalenko, E. Orlando, and T. A. Porter, Galactic Cosmic Rays in the Local Interstellar Medium: Voyager 1 Observations and Model Results, Astrophys. J. 831, 18 (2016).
- Gleeson and Axford [1968] L. J. Gleeson and W. I. Axford, Solar Modulation of Galactic Cosmic Rays, Astrophys. J. 154, 1011 (1968).