When Ads Become Profiles: Large-Scale Audit of Algorithmic Biases and LLM Profiling Risks
Abstract.
Automated ad targeting on social media is opaque, creating risks of exploitation and invisibility to external scrutiny. Users may be steered toward harmful content while independent auditing of these processes remains blocked. Large Language Models (LLMs) raise a new concern: the potential to reverse-engineer sensitive user attributes from exposure alone. We introduce a multi-stage auditing framework to investigate these risks. First, a large-scale audit of over 435,000 ad impressions delivered to 891 Australian Facebook users reveals algorithmic biases, including disproportionate Gambling and Politics ads shown to socioeconomically vulnerable and politically aligned groups. Second, a multimodal LLM can reconstruct users’ demographic profiles from ad streams, outperforming census-based baselines and matching or exceeding human performance. Our results provide the first empirical evidence that ad streams constitute rich digital footprints for public AI inference, highlighting urgent privacy risks and the need for content-level auditing and governance.
1. Introduction
Automated advertising systems are central within the contemporary digital media ecosystem. Platforms such as Facebook and Google deploy complex, dynamic, and opaque algorithms for ad targeting based on inferred profiles and behaviours (Pan et al., 2025). While personalisation can enhance user experience, it also creates a privacy-personalization dilemma (Panjwani et al., 2013), challenges for auditing, accountability (Angus et al., 2024a), and understanding their societal impact (Boonprakong et al., 2023). This opacity enables measurable biases in ad delivery, with demographic skews emerging from platform optimisation, even with neutral targeting (Ali et al., 2019). Moreover, advertisers can circumvent platform policies by using seemingly innocuous “proxy” interests to target protected groups (Sapiezynski et al., 2024), leading to tangible harms, such as discriminatory exclusion from opportunities in housing and employment (Imana et al., 2021a), and exposing vulnerable populations to potentially harmful content (Ali et al., 2022, 2023). These systems can inflict a “slow violence” on users through psychological distress, loss of autonomy, and algorithmic marginalization (Wu et al., 2023). Unsurprisingly, users perceive such practices as “creepy” and express significant concern upon realising the extent of tracking and inference (Reitinger et al., 2024; Dolin et al., 2018; Zeng et al., 2021a).
Platform transparency tools, such as “Why am I seeing this ad?” explanation, are often incomplete and misleading (Burgess et al., 2024; Andreou et al., 2018), while associated privacy controls are frequently hidden and lack actionability (Im et al., 2023). Existing auditing approaches are also limited, often relying on inaccessible platform data or uncertain inferred demographics (Imana et al., 2024). Few methods directly examine the semantic and sequential nature of advertisements themselves, which is a critical gap that obscures how platforms dynamically profile users. The sequence of ads delivered to a user offers a unique, content-level proxy for the platform’s evolving perception and categorisation of individuals.
This research gap becomes particularly critical in light of the rapid democratisation of powerful generative AI like Large Language Models (LLMs). Such technologies demonstrate remarkable abilities to understand and generate nuanced, human-like content (Hurst et al., 2024; OpenAI, 2025), reason about complex contexts (Jaech et al., 2024; Guo et al., 2025), adapt to user-specific preferences (Zhang et al., 2025; OpenAI, 2024), and even integrate multimodal information (Hurst et al., 2024; OpenAI, 2025; Anthropic, 2025; Comanici et al., 2025), bringing immense convenience but also raising new privacy concerns in domains like online advertising (He et al., 2024). As these models become increasingly accessible and capable (Pan et al., 2025), not only through APIs or open-source implementations but also via free, public-facing web interfaces to some of the most advanced proprietary models (Comanici et al., 2025; Hurst et al., 2024; OpenAI, 2025; Anthropic, 2025; Guo et al., 2025), which dramatically lower the barrier for conducting sophisticated analyses at scale, including those with potentially harmful intent. Today, even individuals with only basic technical skills can leverage these models to perform such inferences, making the threat of misuse both more probable and more accessible, this trend exemplified by the rise of no-code platforms for creating custom LLM applications (Ma et al., 2025a). While it is well-established that a user’s digital footprint can reveal sensitive demographic attributes (Hinds and Joinson, 2018; Mariani et al., 2024), the widespread accessibility of LLMs raises an urgent concern: can these powerful tools be used by malicious actors to infer sensitive user information from seemingly innocuous digital footprints (Li et al., 2024)? Answering this question is critical for understanding the next frontier of digital privacy risks.
Our investigation centers on the Facebook advertising ecosystem, whose global dominance and opaque targeting algorithms have produced societal impacts like algorithmic discrimination (Ali et al., 2019), even as its transparency tools remain insufficient (Burgess et al., 2024; Andreou et al., 2018). Consequently, it has become central for auditing research (Angus et al., 2024a; Imana et al., 2021a), making it an essential case for understanding emergent, AI-driven privacy threats. In this work, we directly tackle this emerging challenge by investigating whether multimodal ad streams presented to a user can be reverse-engineered by multimodal LLMs to reconstruct user demographics. This leads to our research questions:
-
•
RQ1: Algorithmic Biases in Ad Targeting. What biases are systematically embedded in Facebook’s ad targeting system?
-
•
RQ2: Feasibility of LLM-based Profile Reconstruction. Can a multimodal LLM effectively reconstruct a user’s demographic profile solely from the sequence of advertisements they are shown?
-
•
RQ3: Characterizing Reconstruction Risks. How does the LLM’s reconstruction performance compare to human capabilities, and what are the tangible privacy risks posed by its current level of performance?
To answer these questions, we propose a novel auditing framework leveraging the zero-shot capabilities (i.e., the ability to correctly perform a task without having been explicitly trained on examples of that specific task) of multimodal LLMs to reconstruct user profiles from ad sequences collected from 891 Australian Facebook users. We benchmark LLM performance against census-based prior and human evaluators. Our filtered dataset spans over 435,000 individual ads across more than 63,000 sessions, each comprising multimodal content (images, text) processed through a multimodal understanding pipeline to produce structured semantic features. We first conduct a statistical audit to quantify demographic skews in ad delivery for sensitive categories, revealing significant inappropriate targeting in gambling and political ads toward socioeconomically vulnerable groups. We then evaluate the ability of state-of-the-art multimodal LLMs to reconstruct six demographic attributes from ad streams at both the session and user levels. Our results show that LLMs consistently outperform strong census-based priors and often rival or exceed human inference capabilities, frequently making “directionally correct” predictions into adjacent brackets. Longer chronological sequences further boosts accuracy, indicating that the temporal ad evolution provides an exploitable signal. These findings provide the first empirical demonstration that multimodal LLMs can reverse-engineer user profiles from ads alone, highlighting the scale of privacy risks and the urgent need for safeguards in the era of accessible, high-capacity generative AI.
Our work makes the following contributions:
-
•
A novel auditing framework combining statistical analysis and LLM-based inference. We introduce a multi-stage framework that first quantifies algorithmic biases in ad targeting (RQ1) and then evaluates the feasibility and nature of user profile reconstruction by LLMs (RQ2 & RQ3).
-
•
Empirical evidence of harmful algorithmic biases in a real-world ad ecosystem. We provide a large-scale, user-level statistical audit of Facebook’s ad delivery, revealing significant inappropriate targeting (RQ1).
-
•
Systematic evaluation and risk characterisation of LLM-based profile reconstruction from ad content. We present the first large-scale evaluation of a multimodal LLM’s ability to infer user demographics from real-world ad sequences from 891 users, benchmarking its performance against strong baselines and human annotators (RQ2). Through in-depth comparative analysis, we further characterise the model’s inferential capabilities and delineate the specific privacy risks these capabilities entail (RQ3).
2. Related Works
In this section, we review two complementary fields. Prior work in ad auditing confirms that ad streams contain systemic demographic signals. Meanwhile, advances in LLM-based user profiling demonstrate the power to decode such signals into nuanced profiles.
2.1. Content-Level Ad Analysis and Bias Auditing Techniques
Researchers have developed sophisticated auditing methodologies beyond platform-provided data. A significant body of this work focuses on analysing the ad creatives, the text and images themselves. This content-level analysis is crucial, as creative elements heavily influence ad delivery, independent of the advertiser’s explicit targeting choices (Ali et al., 2019). Large-scale measurement studies have utilised web crawlers and browser extensions to collect real-world ad data from users’ perspectives (Zeng et al., 2025, 2021b; Angus et al., 2024a, b), characterising the prevalence of different ad types, including problematic political ads (Zeng et al., 2021b), misinformation during geopolitical events (Sapiezynski et al., 2024; Yeung et al., 2023; Capozzi et al., 2023), and harmful content such as influencer-marketed VPNs on YouTube (Akgul et al., 2022). These efforts often involve creating taxonomies to classify “bad” or problematic ads based on user perceptions, identifying categories like clickbait or deceptive content (Zeng et al., 2021a). A key challenge in observational audits is disentangling advertiser intent from platform-driven bias, this bias is particularly pernicious because it can emerge not merely as a reflection of user engagement, but as a direct result of both the platform’s own optimization mechanisms and the pre-existing structural biases within its underlying data (Ali et al., 2019; Johnson et al., 2017). Different methodologies have been developed to audit for discrimination by controlling for confounding variables, such as by comparing ads for similar jobs with different de facto demographic distributions (Imana et al., 2021b). Some platforms like Twitter, provide user-level ad data, enabling studies of targeting and user perceptions without crawlers (Wei et al., 2020). These auditing efforts highlight the necessity of robust, independent data collection and analysis. The creation of public ad archives (Edelson et al., 2019) was a step forward, but their limitations require complementary methods. The data collected from these diverse sources, from mobile app usage (Mariani et al., 2024) to web tracking logs (Dambra et al., 2022), confirms that digital footprints are rich sources for inferring a wide array of sensitive user attributes (Hinds and Joinson, 2018). This established link between digital behaviour and demographic inference forms the technical foundation for our investigation into whether ad sequences can be similarly decoded.
Prior work has firmly established that a wide range of user attributes can be inferred from digital footprints, long before the advent of modern LLMs. A systematic review of the field confirms that demographic attributes are highly predictable from various online traces (Hinds and Joinson, 2018), for example, Facebook Likes can infer sensitive traits including sexual orientation and political views (Kosinski et al., 2013), researchers had to develop complex cross-domain transfer models to bridge disparate data sources like Facebook Likes and search logs (Bi et al., 2013). Furthermore, extensive web tracking allows third parties to profile users through browsing histories (Dambra et al., 2022). Critically, users often misunderstand how online behavioral advertising ecosystem functions, creating a significant gap between the technical reality of data collection and users’ perception of risk (Yao et al., 2017). This landscape has been fundamentally altered by the advent of powerful, publicly accessible LLMs, unlike traditional methods requiring extensive feature engineering, large labeled datasets for training, and complex, bespoke models for cross-domain tasks (Bi et al., 2013), modern LLMs possess strong zero-shot and multimodal reasoning capabilities out of the box. This shift raises urgent, human-centered privacy questions (Li et al., 2024), motivating our review of LLM-based user profiling and its risk.
2.2. LLM-Based User Profiling
The rise of LLMs has catalysed new approaches in recommender systems and user modelling, where a key trend is the move from opaque, vector-based user representations to transparent, language-based profiles. Balog et al. (2019) first propose scrutable user models, suggesting that a user’s preferences could be summarised with human-readable tags or statements. This template-based approach aimed to make recommendations (e.g., for movies or products) explainable. Radlinski et al. (2022) extend this to free-form natural language user profiles that a user can read and even edit. The motivation is that explaining what the system believes a user’s interests to be, using natural language improves transparency and trust, as opposed to dealing with inscrutable embedding vectors. The advent of large-scale LLMs has accelerated this trend. Ramos et al. (2024) demonstrated that LLMs can summarise a user’s activity history into a coherent textual profile. In their framework, interactions (e.g., movies watched, articles read) are fed to a prompt, generating a paragraph describing the user’s tastes. This profile can drive a recommendations with accuracy comparable to traditional collaborative filtering while being more interpretable. Zhou et al. (2024) similarly showed that language-based profiles, when derived by LLM fine-tuning or using an encoder-decoder model, can match the accuracy of conventional user representations on recommendation tasks, while providing human-understandable rationale.
Recent works further demonstrate the versatility of LLM-based profiling beyond dense interaction histories. Wongso et al. (2025) propose GenUP, which constructs natural language user profiles from sparse Point of Interest (POI) (i.e. a specific location such as a restaurant, gas station that people may find useful) check-ins and uses them as prompts for LLM-based POI recommendations. By replacing long historical trajectories with concise, interpretable profiles grounded in behavioural theory and personality traits, their approach performs well in low-data regimes with reduced computational cost. Ren et al. (2024) introduce RLMRec, aligning LLM-generated textual context with traditional ID-based embeddings to learn more robust user profiles by bridging language and collaborative signals. Moving from alignment to augmentation, Xi et al. (2024) further use LLMs to generate and integrate external knowledge, enabling open-world recommendation where long-tail or emerging user interests can be inferred even without direct interaction history. Beyond recommendation, Tan and Jiang (2023) survey boarder applications of LLM-based user modeling, from conversational agents (where the system maintains a profile of the user’s preferences) to education and content moderation, highlighting how LLMs inject external knowledge and reasoning, e.g., inferring that a user who likes two seemingly unrelated niche hobbies might have a broader interest in creativity. Our work extends this line of research by using LLMs to build user profiles from an entirely new type of signal: advertisement sequences. Unlike prior profiling inputs such as user interactions, POI check-ins, or explicit preferences, ad streams are externally curated by opaque targeting algorithms and arrive as multimodal, temporally ordered content. This introduces unique challenges in modelling noisy, heterogeneous inputs while preserving sequential dependencies. We address these challenges by proposing and evaluating a specialised multi-stage pipeline. Our study assesses the feasibility of such LLM-based profiling from ads while also quantifying its privacy risks by systematically evaluating how accurately sensitive demographic attributes can be reconstructed. We compare this to human annotators and strong baselines derived from national census data. In a complementary direction, Meguellati et al. (2024) investigate How Good are LLMs in Generating Personalized Advertisements?, evaluating the ability of LLMs to produce tailored ad content. While their work focuses on using LLMs for ad personalisation, our study takes the inverse perspective, examining how LLMs can exploit delivered ads to reconstruct user profiles, together highlighting the bidirectional interplay between LLMs and advertising systems.
3. Methodology
Our multi-stage research procedure is illustrated in Figure 2.
3.1. Multimodal Ad Understanding
To prepare the ad content for both the user profile reconstruction and the bias audit, we employ an LLM-driven process to transform raw, multimodal ad data into a structured feature set. For each advertisement in our dataset, which consists of visual images and all associated textual information (e.g., title, body, call-to-action), we provide this multimodal input to Gemini 2.0 Flash (Google DeepMind, 2025). The model is prompted to act as an expert advertisement analyst and extract four types of structured, textual features. We selected Gemini 2.0 Flash for this large-scale task for its balance of multimodal understanding, performance, speed, and cost, which was essential for feasibly processing over 435,000 ad impressions. Using more powerful but costly models for this would have been prohibitively expensive, while less capable models might not have adequately captured the semantic richness of the ad content. The full prompt used for this process is detailed in Figure 10, and the full parameter settings for all models are provided in Appendix C.
As illustrated in Figure 3, this process extracts four types of structured textual features: a Caption summarising the ad, Descriptive Categories for its tone, style and communication strategy, IAB Categories from a controlled vocabulary of 45 options via multi-label zero-shot classification (one or more results) (IAB Technology Laboratory, [n. d.]), and Key Entities like brands or products. This structured feature set forms the basis for all subsequent analyses. To ensure that these model-generated features were of sufficient quality to support downstream reconstruction and auditing tasks, we conducted a Gemini quality evaluation, the details of which are provided in Appendix D. We also include in Appendix E an illustrative example of Human–Gemini disagreement, which highlights where the model’s interpretations may diverge from human judgment while remaining adequate for downstream use.
3.2. Algorithmic Biases and Risks Auditing
To investigate algorithmic biases and risks in ad targeting (RQ1), we developed a two-stage auditing framework.
Firstly, we conduct a descriptive analysis of ad-delivery disparities across two constructs: Opportunity Exclusion, refers to cases where certain demographic groups are systematically less exposed to beneficial, life-altering advertisements, in our study, we proxy this construct using the Education and Careers ad category, as access to education and employment are foundational life opportunities. The second construct, Inappropriate Targeting: the disproportionate exposure of vulnerable populations to potentially harmful or exploitative ad content. We proxy this by auditing ad delivery for Gambling, Alcohol, and Politics, categories widely recognised in public policy and prior research as carrying risks of addiction and public health harms (Ali et al., 2023, 2022), or undue political persuasion (Sapiezynski et al., 2024; Zeng et al., 2021b). We operationalise ad exposure for each target category (e.g., Gambling) using two metrics: Coverage, measures the breadth of exposure and is defined as the proportion of active users within a given demographic group (e.g., age 18-24) who were shown at least one ad from the target category; and Average Intensity, measures the frequency of exposure and is defined as the mean number of ads from the target category shown per active user in that same demographic group. An active user is defined as an individual shown at least three ads of any category within a 7-day window. Since our observation period spans two years, it comprises approximately 100 non-overlapping 7-day windows per user. This initial descriptive analysis allows us to identify directly observable differences in ad exposure across demographic groups. These initial findings set the stage for our subsequent regression models, which then statistically control for interrelated factors.
Secondly, to isolate the independent contribution of each demographic factor while controlling for others, we conduct Negative Binomial Regressions (NBR) (Hilbe, 2011; Cameron and Trivedi, 2013; Mirbabaie et al., 2021) at the user-week level. We specify two model formulations. Our primary model estimates the main effect of each demographic attribute while controlling for all others. The conditional mean for this model is expressed as:
| (1) |
where is the count of target ads for user in time window , and is the total ad count for that user-week, which serves as an offset. is a vector of dummy variables representing the -th demographic attribute (gender, age, income, education, employment, political party) for user , which are time-invariant in our dataset. is the corresponding vector of coefficients. We chose the Negative Binomial Regression model because it is well-suited for count data, such as the number of ads a user sees. Unlike the simpler Poisson model, which assumes the mean and variance of the counts are equal, the NBR model includes an additional parameter () to handle cases where the variance is greater than the mean, a common characteristic of real-world behavioral data. We adopt the negative binomial parameterization, where the variance is a quadratic function of the mean: , with .
To probe intersectional effects where main effects are most pronounced, we augment this specification with screened two-way interactions (e.g., gender income). The results are reported as Incidence Rate Ratios (IRR), , where is the coefficient from a log link on the expected count (rate) for the target group relative to a specified reference group; 95% confidence intervals are computed as . With the log link and the exposure offset, the IRR represents the multiplicative change in the expected ad rate per unit exposure when moving from the reference group to the target group, holding all other variables constant. For example, an IRR of 2.0 for men (compared to women as the reference group) means that men are expected to have twice the rate of target-category ads as women; conversely, an IRR of 0.5 means half the rate. An IRR of 1.0 indicates no difference between the groups. We use robust standard errors clustered at the user level to account for intra-person correlation over time.
3.3. Session-Level User Profile Reconstruction
Our reconstruction process begins at the most granular level: the user session. A session is defined as a chronologically ordered sequence of advertisements a user is exposed to during a continuous period of platform usage; the detailed definition is in Section 4.2. For each session, we compile the structured textual features, comprising the generated caption, descriptive categories, IAB categories, and key entities, which are extracted from every ad as described in Section 3.1. These feature sets are concatenated in the same temporal order as the ads appeared, forming a rich, text-based representation of the session’s ad stream. This text-based approach is a deliberate methodological choice. Directly inputting all raw ad images from a session presents practical challenges: token costs for multiple high-resolution images are prohibitive, sessions contain a variable number of ads (3-50), and presenting a collage of disparate images could confuse the model. To avoid that, we begin by processing each ad with the multimodal LLM through our multimodal understanding pipeline, which distils and amplifies its core semantic information. The resulting structured text provides a more coherent and token-efficient input for the subsequent reconstruction task.
For each session, we provide this time-ordered textual representation to the LLM and prompt it to perform a zero-shot classification for each of the six demographic attributes (gender, age, income, education, employment, political party). In addition to predicting a category for each attribute, the model is also instructed to generate a concise summary of its reasoning for its predictions for that session. This summary encapsulates the key signals the LLM identified within the session’s ad content that led to its demographic inferences.
3.4. User-Level User Profile Reconstruction
While session-level analysis provides insights into short-term ad content, a user’s full ad exposure history offers a much richer and more stable signal for profile reconstruction. To leverage this, we construct a user-level profile by aggregating the outputs from the session-level analysis. Specifically, for each of the users in our dataset, we collect all the session summaries generated in the previous step. These summaries are then concatenated in chronological order, creating a longitudinal narrative of the LLM’s evolving perception of the user over their entire two-year observation period. This complete, time-ordered text, which represents a condensed history of the key demographic signals identified by the LLM over time, is then provided to the model in a final step. The LLM is tasked with performing a holistic, user-level classification for each demographic attribute based on this comprehensive narrative. This methodology allows the model to base its final user-level prediction on a synthesis of cumulative evidence (i.e., the aggregate semantic signals from all ads seen over time) and temporal patterns (i.e., shifts or trends in the types of ads shown), while remaining computationally tractable.
4. Results
4.1. Dataset
For this study, we utilise a large-scale, longitudinal dataset from a data donation project. The project recruits volunteer participants from the Australian public to donate data about the advertisements they encounter on Facebook. This data is collected via a custom-built, privacy-preserving browser plugin that participants install, which automatically captures sponsored posts from their News Feeds. Participants in the original study joined by installing the browser plugin and completing a demographic questionnaire. Once installed, the plugin automatically detects and collects sponsored posts from the participant’s Facebook News Feed as they browse the platform on a desktop or laptop computer. The collected data for each ad includes the ad creative (image and text), associated metadata, and a link to the de-identified demographic profile of the participant who observed it. This methodology provides a unique, user-centric view of the ad ecosystem, capturing the personalised ads that are otherwise inaccessible to public scrutiny. The full dataset made available to us comprises over 700,000 ad observations collected between 2021 and 2023 from over 2,000 Australian Facebook users who provided demographic information. This extensive, real-world dataset allows us to conduct a robust, large-scale audit of both the ad targeting systems and the potential for user profile reconstruction by LLMs.
4.2. Preprocessing
Since our data captures a continuous stream of ad exposures from desktop browsing, we must first segment it into meaningful user sessions. We use a data-driven, principled way to define what counts as a “session” in our dataset, instead of arbitrarily choosing a cutoff. Users’ ad exposures arrive as a continuous, non-uniform timeline of events over days and weeks. To segment each user’s ad viewing history into coherent sessions, we identify a robust threshold for the maximum time interval that can elapse between consecutive ads such that they still belong to the same session.
Given a user with a sequence of ad timestamps , we compute the inter-ad time intervals:
| (2) |
Since these intervals are often highly skewed, with short gaps reflecting within-session activity and long gaps reflecting offline periods, we apply a logarithmic transformation to better capture the underlying multimodal structure:
| (3) |
We then fit a kernel density estimator (KDE) over the set to obtain a smooth estimate of the gap distribution. The KDE curve typically reveals two prominent modes: (1) the first local maximum , corresponding to frequent short gaps within sessions, and (2) the first local minimum , marking the transition to between-session gaps. We define a session threshold as the midpoint between these extrema in log-space, exponentiated back to the time domain:
| (4) |
We compute a session threshold by averaging the per-user KDE-derived midpoints, resulting in a global threshold of seconds. Thus, two consecutive ads are considered to belong to different sessions if .
This data-driven approach allows us to transform the continuous variable of time gaps into a principled categorical distinction (same session vs. new session) based on real user behavioral patterns observed in the data.
Following temporal segmentation, we apply additional filtering steps to ensure data quality and modelling tractability:
-
•
Source filtering: We retain only ad impressions sourced from Facebook, excluding other platforms and modalities such as video-only content.
-
•
Session length bounds: We discard sessions with fewer than 3 or more than 50 ads to eliminate sparse sessions and abnormally long sequences.
-
•
User filtering: We exclude users who contributed fewer than 3 ad session impressions, as such short histories are insufficient for meaningful profiling.
| Demographic | Count | % |
| Gender | ||
| Male | 554 | 62.18 |
| Female | 318 | 35.69 |
| Prefer not to say | 13 | 1.46 |
| Other | 6 | 0.67 |
| Age Range | ||
| 18–24 | 113 | 12.68 |
| 25–34 | 184 | 20.65 |
| 35–44 | 112 | 12.57 |
| 45–54 | 112 | 12.57 |
| 55–64 | 152 | 17.06 |
| 65–74 | 158 | 17.73 |
| 75 and over | 52 | 5.84 |
| Prefer not to say | 8 | 0.90 |
| Income Bracket | ||
| $1–$15,599 | 59 | 6.62 |
| $15,600–$20,799 | 47 | 5.27 |
| $20,800–$25,999 | 58 | 6.51 |
| $26,000–$33,799 | 55 | 6.17 |
| $33,800–$41,599 | 59 | 6.62 |
| $41,600–$51,999 | 55 | 6.17 |
| $52,000–$64,999 | 67 | 7.52 |
| $65,000–$77,999 | 56 | 6.29 |
| $78,000–$90,999 | 72 | 8.08 |
| $91,000–$103,999 | 49 | 5.50 |
| $104,000–$155,999 | 129 | 14.48 |
| $156,000 or more | 77 | 8.64 |
| Prefer not to say | 108 | 12.12 |
| Education Level | ||
| Postgraduate degree level | 315 | 35.35 |
| Bachelor degree level | 366 | 41.08 |
| Year 12 or equivalent | 145 | 16.27 |
| Less than year 12 or equivalent | 45 | 5.05 |
| Prefer not to say | 20 | 2.24 |
| Employment Status | ||
| Employed full time | 359 | 40.29 |
| Employed part time | 199 | 22.33 |
| Unemployed and looking for work | 34 | 3.82 |
| Unemployed and not looking for work | 41 | 4.60 |
| Retired | 224 | 25.14 |
| Prefer not to say | 34 | 3.82 |
| Party Preference | ||
| Labor | 331 | 37.15 |
| Liberal (National Coalition) | 28 | 3.14 |
| Greens | 315 | 35.35 |
| None | 166 | 18.63 |
| Other | 51 | 5.72 |
After filtering, the dataset contains: unique users, total ad sessions and total ad impressions. To further prepare the ad text for subsequent processing, we remove all HTML elements and markup, resulting in clean plain-text representations free from formatting artifacts. The demographic composition of the final filtered user cohort is detailed in Table 1. This table provides the operational definitions for all demographic categories, such as age ranges (older or younger), income brackets and education levels (higher or lower), used throughout our subsequent analyses. All monetary values, including income brackets, are reported in Australian Dollars (AUD). The distribution of ad content across IAB categories, which forms a core feature for our subsequent analyses, is visualised in Figure 4. These distributions provide the foundational context for both our algorithmic bias audit and the user profile reconstruction experiments.
4.3. Empirical Evidence of Algorithmic Biases and Risks in Ad Targeting
Our analysis of ad-delivery disparities begins with a descriptive overview, with detailed visualizations for all demographic dimensions appearing in Appendix B. These preliminary findings reveal pronounced and systematic differences across our categories of interest. For Gambling, we observe strong signals of targeting towards socioeconomically vulnerable groups, i.e., users with lower educational attainment or unemployed status exhibit substantially higher coverage and intensity; male users also experience markedly higher exposure than female users, a pattern similarly observed for Alcohol. Politics ads show distinct concentration among older age groups, retired individuals, and users with declared party preferences. For Education and Careers, patterns align with expectations: coverage and intensity are broadly consistent across demographic strata, with no evidence of systematic opportunity exclusion in ad delivery.
While these descriptive results suggest that content is not distributed uniformly, they cannot differentiate correlated attributes. To address this limitation, we employ Negative Binomial Regression models, which quantify these disparities more rigorously. The following sections present the statistically significant findings () for each construct.
| Attribute | Target Group | Reference Group | IRR | CI_low | CI_high | value |
|---|---|---|---|---|---|---|
| Age | 18–24 | 25–34 | 1.88 | 1.45 | 2.45 | 0.000 |
| Education | Postgraduate degree | Bachelor degree | 1.35 | 1.16 | 1.56 | 0.000 |
| Income | $52,000–$64,999 | $156,000 or more | 0.72 | 0.56 | 0.91 | 0.007 |
| Employment | Employed part time | Employed full time | 1.29 | 1.06 | 1.56 | 0.011 |
| Age | 65–74 | 25–34 | 0.74 | 0.56 | 0.97 | 0.030 |
| Employment | Retired | Employed full time | 0.77 | 0.59 | 0.99 | 0.042 |
| Income | $26,000–$33,799 | $156,000 or more | 1.49 | 1.00 | 2.21 | 0.048 |
| Income | $78,000–$90,999 | $156,000 or more | 1.36 | 1.00 | 1.84 | 0.049 |
| Employment | Unemployed & looking | Employed full time | 1.49 | 1.00 | 2.23 | 0.049 |
4.3.1. Opportunity Exclusion
In this section, we focus our analysis of opportunity exclusion on the Education and Careers category, as it represents the most explicit form of career and training‐related advertising. This category directly reflects the availability of economic and educational opportunities, making it a natural lens to examine whether ad delivery systematically excludes certain groups.
Table 2 presents the statistically significant main effects from our Negative Binomial Regression model. Consistent with the descriptive results, the model does not reveal evidence of systematic opportunity exclusion. Exposure patterns are broadly aligned with plausible variation in career- and education-related ad delivery. For example, younger users (18-24) exhibit higher exposure relative to the 25-34 reference group, which is expected given their increased likelihood of engaging with educational opportunities. Similarly, part‐time employees show moderately higher exposure than full‐time employees, potentially reflecting increased availability for training or upskilling. At the other end of the spectrum, retired users and older age groups receive fewer such ads, which is consistent with a lower market relevance of career‐focused content for these demographics. Income effects are mixed but remain within a plausible range: for example, lower-middle‐income groups such as $26,000–$33,799 show somewhat higher exposure relative to the highest income bracket, whereas some upper‐middle‐income brackets have slightly lower exposure.
Descriptive coverage and intensity plots (Figure 5) reinforce these patterns: across gender, education, and income strata, differences are modest, and high‐coverage groups (e.g., unemployed and looking for work) correspond to demographics where targeting is intuitively relevant. Taken together, both univariate and multivariate evidence suggest that ad delivery in Education and Careers follows patterns consistent with its intended audience, without indications of systematic exclusion from opportunities.
4.3.2. Inappropriate Targeting
We focus our inappropriate targeting analysis on Gambling, Alcohol, and Politics for three reasons. First, these categories are widely designated as sensitive in industry policies and regulatory guidance, given their potential to exacerbate addiction and financial harm (gambling), public-health risks (alcohol), and unequal persuasive reach or civic manipulation (politics). Second, they represent distinct mechanisms of harm, from encouragement of risky behaviours to targeted political persuasion, allowing us to probe different modes within a single framework. Third, in our data, they occur with sufficient base rates across demographic levels and weeks to support well-powered user–week Negative Binomial Regression models and screened interaction terms; other sensitive categories were too sparse for reliable estimation.
| Attribute | Target Group | Reference Group | IRR | CI_low | CI_high | value |
|---|---|---|---|---|---|---|
| Gender | Male | Female | 2.25 | 1.63 | 3.10 | 0.000 |
| Education | ¡ year 12 or equivalent | Bachelor degree | 2.48 | 1.28 | 4.80 | 0.007 |
| Employment | Unemployed & looking | Employed full time | 2.89 | 1.32 | 6.33 | 0.008 |
| Income | $104,000–$155,999 | $156,000+ | 2.19 | 1.20 | 4.02 | 0.011 |
| Income | $91,000–$103,999 | $156,000+ | 1.95 | 1.09 | 3.47 | 0.024 |
| Income | $65,000–$77,999 | $156,000+ | 1.97 | 1.08 | 3.58 | 0.026 |
| Income | $20,800–$25,999 | $156,000+ | 2.02 | 1.03 | 3.94 | 0.040 |
| Income | $26,000–$33,799 | $156,000+ | 1.98 | 1.03 | 3.80 | 0.041 |
| Employment | Unemployed & not looking | Employed full time | 2.02 | 1.02 | 3.97 | 0.043 |
| Attribute | Target Group | Reference Group | IRR | CI_low | CI_high | value |
|---|---|---|---|---|---|---|
| \rowcolorgray!20 Conditional Main Effects (Significant in this model) | ||||||
| Gender (at $156,000+) | Male | Female | 16.87 | 6.37 | 44.65 | 0.000 |
| Income (for Females) | $104,000–$155,999 | $156,000+ | 26.52 | 9.42 | 74.67 | 0.000 |
| Income (for Females) | $20,800–$25,999 | $156,000+ | 21.15 | 6.77 | 66.02 | 0.000 |
| Income (for Females) | $33,799–$41,599 | $156,000+ | 18.04 | 5.34 | 60.93 | 0.000 |
| Income (for Females) | $65,000–$77,999 | $156,000+ | 12.76 | 4.35 | 37.42 | 0.000 |
| Income (for Females) | $52,000–$65,000 | $156,000+ | 12.20 | 3.80 | 39.16 | 0.000 |
| Income (for Females) | $25,999–$33,799 | $156,000+ | 11.95 | 4.15 | 34.40 | 0.000 |
| Income (for Females) | $1–$15,999 | $156,000+ | 11.03 | 3.44 | 35.33 | 0.000 |
| Income (for Females) | $41,599–$52,000 | $156,000+ | 10.22 | 3.04 | 34.30 | 0.000 |
| Income (for Females) | $91,000–$104,000 | $156,000+ | 6.54 | 2.07 | 20.66 | 0.001 |
| Education | ¡ year 12 or equivalent | Bachelor degree | 2.55 | 1.32 | 4.90 | 0.005 |
| Income (for Females) | $15,999–$20,800 | $156,000+ | 4.42 | 1.49 | 13.08 | 0.007 |
| Employment | Unemployed & looking | Employed full time | 2.87 | 1.27 | 6.50 | 0.011 |
| Age | 18–24 | 25–34 | 1.78 | 1.10 | 2.87 | 0.018 |
| \rowcolorgray!20 Two-way interaction (Ratio of Gender Effects across Income levels) | ||||||
| Gender Income | Gender effect in $104,000–$155,999 | Gender effect in $156,000+ | 0.07 | 0.02 | 0.22 | 0.000 |
| Gender Income | Gender effect in $20,800–$25,999 | Gender effect in $156,000+ | 0.06 | 0.02 | 0.22 | 0.000 |
| Gender Income | Gender effect in $1–$15,599 | Gender effect in $156,000+ | 0.09 | 0.02 | 0.34 | 0.000 |
| Gender Income | Gender effect in $52,000–$64,999 | Gender effect in $156,000+ | 0.11 | 0.03 | 0.37 | 0.000 |
| Gender Income | Gender effect in $33,800–$41,599 | Gender effect in $156,000+ | 0.08 | 0.02 | 0.34 | 0.001 |
| Gender Income | Gender effect in $65,000–$77,999 | Gender effect in $156,000+ | 0.16 | 0.04 | 0.56 | 0.004 |
| Gender Income | Gender effect in $26,000–$33,799 | Gender effect in $156,000+ | 0.17 | 0.05 | 0.59 | 0.005 |
| Gender Income | Gender effect in $41,600–$51,999 | Gender effect in $156,000+ | 0.22 | 0.05 | 0.98 | 0.048 |
Gambling advertisements show evidence of heightened targeting toward socioeconomically vulnerable populations. In the main effects specification (Table 3(a)), people without upper-secondary qualifications are exposed at substantially higher rates than those with bachelor’s degrees (IRR ), and those out of work receive markedly more gambling ads than full-time workers (IRR and IRR ). Men also receive more such ads than women (IRR ). Several middle and lower income ranges show higher exposure than the highest-income reference, consistent with greater delivery to people with fewer economic resources (e.g., IRR for $20,800–$25,999).
To probe this more nuanced, intersectional question, we introduce screened two-way interactions between gender and income (Table 3(a)). In this parameterisation, the reported interaction entries are ratios of the male–female effect at each income level relative to the top-income bracket. The conditional gender effect at $156,000+ is large (IRR ). The interaction ratios show that this gap is considerably smaller at most other income levels. For example, among people earning roughly $41,600–$51,999, the ratio is , implying a male–female IRR of for that income band. Taken together, the gender disparity is strongest among the highest-income users and attenuates across most lower and middle-income ranges. Nevertheless, it often remains directionally present, i.e., men are still ahead of women, not the other way around.
The descriptive plots (Figure 6) reinforce these regression findings. Men are more likely than women to encounter at least one gambling ad and receive more such ads on average (coverage vs. ; intensity vs. ads per active user–week). People who left school before completing upper-secondary education experience notably higher reach and intensity than those with postgraduate qualifications (coverage vs. ; intensity vs. ). Individuals actively seeking work stand out with both high coverage and the highest average intensity among employment categories (coverage , intensity ), substantially exceeding full-time workers (coverage , intensity ). Several lower and lower-middle income ranges also show elevated intensity relative to the highest-income group.
Overall, both the univariate and multivariate evidence indicate that gambling ads are disproportionately delivered to people with fewer educational credentials and to those outside full-time employment, with a persistent (though income-dependent) male advantage in exposure. These patterns align with well-documented risk factors for gambling-related harm, underscoring the need for stronger safeguards around the delivery of this content.
| Attribute | Target Group | Reference Group | IRR | CI_low | CI_high | value |
|---|---|---|---|---|---|---|
| Gender | Male | Female | 1.63 | 1.32 | 2.02 | 0.000 |
| Education | Postgraduate degree | Bachelor degree | 1.43 | 1.15 | 1.78 | 0.001 |
| Income | $91,000–$103,999 | $156,000 or more | 1.88 | 1.28 | 2.77 | 0.001 |
| Party | Greens | None | 1.49 | 1.15 | 1.92 | 0.002 |
| Income | $26,000–$33,799 | $156,000 or more | 1.92 | 1.25 | 2.95 | 0.003 |
| Party | Labor | None | 1.51 | 1.14 | 2.00 | 0.004 |
| Age | 55–64 | 25–34 | 1.54 | 1.12 | 2.12 | 0.008 |
| Income | $41,600–$51,999 | $156,000 or more | 2.01 | 1.19 | 3.41 | 0.009 |
| Employment | Unemployed & looking | Employed full time | 1.84 | 1.08 | 3.12 | 0.024 |
| Party | Other | None | 1.70 | 1.06 | 2.75 | 0.029 |
| Income | $20,800–$25,999 | $156,000 or more | 1.54 | 1.01 | 2.36 | 0.046 |
| Age | 65–74 | 25–34 | 1.44 | 1.00 | 2.06 | 0.049 |
| Attribute | Target Group | Reference Group | IRR | CI_low | CI_high | value |
|---|---|---|---|---|---|---|
| \rowcolorgray!20 Conditional Main Effects (Significant in this model) | ||||||
| Education | Postgraduate degree level | Bachelor degree level | 1.39 | 1.12 | 1.73 | 0.003 |
| Party | Greens | None | 1.45 | 1.13 | 1.86 | 0.003 |
| Age | 55–64 | 25–34 | 1.57 | 1.15 | 2.16 | 0.005 |
| Party | Labor | None | 1.47 | 1.12 | 1.93 | 0.005 |
| Employment | Unemployed & looking for work | Employed full time | 1.91 | 1.13 | 3.21 | 0.015 |
| Income (for Females) | $104,000–$155,999 | $156,000+ | 0.50 | 0.28 | 0.90 | 0.020 |
| Party | Other | None | 1.57 | 1.01 | 2.46 | 0.046 |
| \rowcolorgray!20 Two-way interaction (Ratio of Gender Effects across Income levels) | ||||||
| Gender Income | Gender effect in $104,000–$155,999 | Gender effect in $156,000+ | 2.13 | 1.10 | 4.13 | 0.025 |
| Gender Income | Gender effect in $33,800–$41,599 | Gender effect in $156,000+ | 2.37 | 1.03 | 5.46 | 0.042 |
Political advertising concentrates among older audiences and politically engaged users, with a persistent male tilt. According to the main–effects model (Table 3(d)), men receive more political ads than women (IRR ). People with postgraduate degrees see more such ads than those with bachelor’s degrees (IRR ), consistent with higher political engagement among highly educated users. Exposure also rises for several mid–income bands relative to the highest–income reference. Older adults show higher delivery than those in their late twenties and early thirties (IRR for people in their late fifties to early sixties; IRR for those in their mid–sixties to early seventies). Those actively seeking work also receive more political ads than full–time workers (IRR ). Finally, users who report a party preference, particularly supporters of the Labor or Greens parties, see more political ads than those reporting no affiliation (IRR and , respectively).
To probe the intersectional structure, we also add screened gender–by–income interactions (Table 4.3.2). The interaction entries are ratios of the male–female effect at each income level relative to the top–income bracket. We observe such amplification around upper–middle incomes and in the lower–middle band. While the exact implied male–female IRR by income requires the baseline gender effect from this interaction model, these ratios clearly indicate that the gender disparity in political ad delivery is larger in those bands than among the highest–income users.
The descriptive evidence (Figure 7) mirrors these patterns. Men are more likely than women to encounter political ads and to receive them more frequently (coverage vs. ; intensity vs. ads per active user–week). Reach and frequency climb steadily with age, peaking among the oldest users (coverage , intensity for those in the oldest group). People reporting a party affiliation—across major parties—also show higher coverage and intensity than those reporting none. And outside the labour force, especially among those actively looking for work, delivery is notably higher (intensity vs. for full–time workers).
Taken together, both the univariate and multivariate results indicate that political messaging is not distributed uniformly: it skews toward men, older adults, users with strong partisan identities, and several mid–income segments, with gender gaps that widen at specific income levels. Notably, people currently out of work also receive elevated volumes of political advertising, a group likely to be especially sensitive to policy promises and trade-offs, raising additional concerns about disproportionate persuasive reach.
| Attribute | Target Group | Reference Group | IRR | CI_low | CI_high | value |
|---|---|---|---|---|---|---|
| Gender | Male | Female | 2.19 | 1.64 | 2.92 | 0.000 |
| Age | 75 and over | 25–34 | 0.22 | 0.09 | 0.52 | 0.001 |
| Age | 65–74 | 25–34 | 0.41 | 0.23 | 0.73 | 0.002 |
Alcohol advertising shows a clear male tilt and a midlife concentration. In the main–effects model (Table 3), men receive substantially more alcohol ads than women (IRR ). Delivery declines among older adults relative to those in their late twenties and early thirties, lower for people in their mid–sixties to early seventies (IRR ) and lowest for the oldest group (IRR ). No other attributes reach statistical significance, indicating that the most robust patterns are a persistent gender gap and late–life attenuation.
The descriptive evidence (Figure 8) aligns with these model results. Men are more likely than women to encounter at least one alcohol ad and to receive them more frequently (coverage vs. ; intensity vs. ads per active user–week). By age, reach and frequency peak in midlife and taper at older ages (e.g., intensity for those in their mid–forties to early fifties, declining to at ages – and for the oldest group). Across education and party affiliation, coverage and frequency are broadly similar; income heterogeneity in the descriptive plots does not persist as statistically significant in the multivariate model. This means that, although income seemed to matter at first glance, it does not actually explain the differences once we controlled for other variables in a multivariate model. Meanwhile, education and party affiliation do not show any real disparities either.
Overall, the alcohol category in our data appears more preference‐driven than exclusive. Delivery tracks a stable male tilt and life-stage differences commonly associated with alcohol consumption, without the concentrated reach to socioeconomically vulnerable groups seen for gambling or the partisan/age amplifications observed for politics. After adjusting for covariates, only gender and late-life attenuation remain robust; other demographic contrasts are small and unstable. We therefore interpret these patterns as reflecting audience interest, rather than clear indications of inappropriate targeting, as the observed skews align with broad (Table 8), established consumption patterns rather than targeting legally or ethically defined vulnerable groups. While this distinction does not eliminate all potential harms, it differentiates alcohol ad delivery in our data from the patterns observed for gambling, where targeting aligns with known socioeconomic risk factors for addiction. We still emphasise the importance of routinely monitoring frequency and creative placement for sensitive subgroups.
In summary, the evidence indicates heterogeneous risk across sensitive categories: clear inequities for gambling, substantial demographic skews for politics, and comparatively limited concern for alcohol. These findings motivate category-specific safeguards and continuous fairness auditing of targeting and frequency, especially where harms or civic impacts are plausible.
4.4. User Profile Reconstruction
| Method | Gender | Age | Income | Education | Employment | Party | |
|---|---|---|---|---|---|---|---|
| Random Guessing | Acc | 50.00 | 14.29 | 8.33 | 25.00 | 20.00 | 20.00 |
| F1 | 50.00 | 14.29 | 8.33 | 25.00 | 20.00 | 20.00 | |
| Gemini 2.0 Flash | Acc | 59.13 | 20.41 | 9.94 | 42.70 | 48.38 | 35.13 |
| F1 | 58.85 | 15.62 | 4.56 | 18.04 | 19.92 | 20.99 |
The preceding analysis demonstrates that ad-delivery systems on Facebook do not operate uniformly; instead, they generate ad streams with systematic and statistically significant skews along demographic lines. For sensitive categories like Gambling, Alcohol, and Politics, the sequence of ads a user sees is not random but is correlated with their gender, age, education, and employment status. This finding establishes a critical precondition for our second research question (RQ2): if an ad stream contains discernible demographic signals, can a powerful, general-purpose inference engine like a Large Language Model (LLM) detect and exploit these signals to reconstruct a user’s demographic profile? In this section, we empirically evaluate this possibility. We treat the sequence of multimodal advertisements delivered to a user as a rich, content-level digital footprint. Our objective is to determine whether a state-of-the-art multimodal LLM, given only this ad stream, can infer sensitive demographic attributes without any access to the platform’s underlying targeting data. To do so, we develop a novel auditing framework where the LLM performs zero-shot classification for each demographic attribute based on the ad content. We then benchmark the LLM’s reconstruction accuracy against both a prior distribution baseline and human evaluators to rigorously assess its effectiveness.
4.4.1. Session-Level Reconstruction
We first conduct our analysis at the most granular level: the user session. A user session is defined as the sequence of ads a user is exposed to within a single, continuous period of platform usage. This session-level analysis allows us to test the LLM’s inference capabilities on short, contextually coherent ad sequences. To ensure data quality and meaningful classification, we excluded responses where users selected “prefer not to say” for any given attribute. We also excluded the “other” category for gender due to its small sample size (N=6 users), which is insufficient for a reliable model evaluation. We then tasked Gemini 2.0 Flash, a state-of-the-art multimodal LLM, with performing zero-shot classification for six demographic attributes across the remaining 63,864 user sessions from our dataset. The full prompt used for session-level reconstruction is provided in Figure 11. The model’s performance, measured by accuracy and macro F1-score, is benchmarked against a random guessing baseline, with the results presented in Table 4. As shown in the table, this baseline varies for each attribute, as it is determined by the number of possible categories (i.e., 1 divided by the number of classes). For example, with seven age brackets, the random guessing accuracy for Age is 14.29% (1/7). The results demonstrate that the LLM consistently outperforms the random guessing baseline in terms of accuracy across all demographic attributes. For instance, Gemini achieves an accuracy of 59.13% for Gender classification, a notable improvement over the 50% chance baseline. The most substantial gains are observed for Education and Employment, where the model’s accuracy reaches 42.70% and 48.38%, respectively, more than doubling the random guess performance. This indicates that ad sequences, even at the session level, contain sufficient demographic signals for the LLM to make inferences that are better than chance. However, a closer look at the macro F1-scores reveals a more nuanced picture. While accuracy measures the overall correctness of predictions, the F1-score provides a more robust evaluation, especially in the presence of class imbalance, by balancing precision and recall. For attributes with many categories, such as Age and Income, the F1-scores are considerably lower (15.62% and 4.56%, respectively) and show only marginal improvement over the baseline. This suggests that while the LLM can often correctly identify the majority class, its ability to reliably distinguish between the multiple fine-grained categories within these attributes is limited at the session level. For attributes with fewer classes, like Employment and Party, the F1-scores are closer to their corresponding accuracies, indicating a more balanced performance. In summary, our session-level analysis provides initial evidence that LLMs can indeed extract demographic signals from ad streams to reconstruct user profiles with better-than-random accuracy. Nevertheless, the low F1-scores for multi-class attributes highlight the challenge of making reliable, fine-grained inferences from the limited information contained within a single user session. This motivates our subsequent analysis at the user level, where aggregating information across multiple sessions may provide a richer and more stable signal for reconstruction.
4.4.2. User-Level Reconstruction
| Method | Gender | Age | Income | Education | Employment | Party | |
|---|---|---|---|---|---|---|---|
| Prior-Mode (Majority Class) | Acc | 36.47 | 20.84 | 9.25 | 21.81 | 56.71 | 3.14 |
| F1 | 26.72 | 4.93 | 1.54 | 11.94 | 24.13 | 1.22 | |
| Prior-Sampling | Acc | 49.891.68 | 14.851.22 | 8.261.01 | 26.631.24 | 46.901.79 | 19.851.25 |
| F1 | 49.031.68 | 14.011.18 | 7.680.96 | 24.201.38 | 32.771.77 | 16.201.13 | |
| Gemini 2.0 Flash | Acc | 74.88 | 41.18 | 9.11 | 44.87 | 61.95 | 39.91 |
| F1 | 74.87 | 34.57 | 5.46 | 34.13 | 34.66 | 23.90 | |
| Gemini 2.0 Flash† | Acc | 76.38 | 40.84 | 8.99 | 44.41 | 62.46 | 41.60 |
| F1 | 76.35 | 34.39 | 5.76 | 34.37 | 35.63 | 25.82 |
To create a more stable and comprehensive signal, we aggregate information across all sessions for each of the 891 users in our dataset. For each user, we first generate a textual summary of the LLM’s inference and reasoning for every individual session. We then concatenate these session summaries in chronological order, creating a longitudinal narrative of the LLM’s evolving perception of the user over time. This complete, time-ordered text is then provided to the LLM in a final step to perform a holistic, user-level classification for each demographic attribute. This method allows the model to leverage not only the cumulative evidence but also any temporal patterns or shifts in the ad content a user is shown, preserving the temporal nature of a user’s ad exposure history. For this more rigorous user-level evaluation, we introduce two stronger baseline models derived from Australian census data, which reflect the prior demographic distribution of the population (Table LABEL:tab:all_stats). The Prior-Mode baseline always predicts the majority class for each attribute. The Prior-Sampling baseline provides a more robust chance-level comparison by making predictions through random sampling from the census distribution; we report the mean and standard deviation of its performance over 1,000 independent runs in Table 5. To ensure a fair comparison, we harmonised our dataset with the census data. For all attributes, we excluded responses where users selected “prefer not to say.” We excluded gender-diverse respondents from this analysis because the census prior reports only male and female categories. For education, we aligned with the higher education census distribution by merging all non-degree categories in our data into a single “No Degree” class. Census data for individual income, reported weekly, was annualised (i.e., multiplied by 52) and aligned perfectly with our income brackets. For employment, we merged our two “unemployed” categories to match the census, which does not distinguish between looking for work or not; we also excluded “retired” individuals from this specific attribute’s evaluation, as the census employment data pertains only to the labour force. Detailed statistics of the demographics of the Australian Census and Australian Federal Election Study are provided in Appendix LABEL:tab:all_stats. We evaluate two versions of LLM: the standard Gemini 2.0 flash model and an augmented version, Gemini†, which was provided with a prompt about the Australian cultural context. The user-level reconstruction prompt is provided in Figure 12, and the augmented Australian context prompt is provided in Figure 13. This augmentation is designed to create a more equitable comparison with our census-derived baselines. Since the Prior-Sampling baseline inherently incorporates “Australian context” by drawing from national demographic data, providing the LLM with similar high-level contextual information ensures that our evaluation more accurately assesses the model’s ability to infer information from ad content, rather than simply penalising it for a lack of geographical and cultural knowledge.
The user-level reconstruction performance is presented in Table 5. The results at the user-level show a marked improvement over the session-level analysis and demonstrate the LLM’s strong capability to reconstruct user profiles. Gemini significantly outperforms both the Prior-Mode and Prior-Sampling baselines across nearly all attributes in both accuracy and F1-score. The most striking performance is in Gender reconstruction, where Gemini† achieves 76.38% accuracy and a 76.35% F1-score, far exceeding the baselines and indicating a very strong and reliable signal in the ad streams. Substantial gains are also evident for attributes that were challenging at the session level. For Age, Gemini’s accuracy (41.18%) is double that of the Prior-Mode baseline (20.84%), and its F1-score (34.57%) shows a seven-fold improvement over the majority class F1 (4.93%), indicating that the model is not merely guessing the most common age bracket but is successfully distinguishing between multiple categories. A similar pattern holds for Education, where the F1-score jumps to 34.37%, nearly tripling the baseline performance. For Party preference, the LLM’s accuracy (41.60%) and F1-score (25.82%) are dramatically better than the baselines, suggesting that political orientation is encoded in ad content. The model’s performance on Employment is also noteworthy. While the Prior-Mode baseline achieves a high accuracy of 56.71% due to a large majority class (employed full-time), its F1-score is low (24.13%). Gemini, in contrast, achieves a higher accuracy (62.46%) and a significantly better F1-score (35.63%), demonstrating a superior ability to correctly identify users in non-majority employment categories. The only attribute where the LLM does not show a clear advantage is Income, where both accuracy and F1-score remain low and comparable to the baselines. This suggests that while other demographic signals are robustly embedded in the ads, providing high-level contextual information can further refine the model’s inferential capabilities. Overall, these user-level results confirm that aggregating ad sequences provides a powerful signal, enabling LLMs to reconstruct a user’s demographic profile with a strong performance for most attributes, posing significant privacy risks.
4.4.3. Human Evaluation
| Method | Gender | Age | Income | Education | Employment | Party | |
|---|---|---|---|---|---|---|---|
| Random guessing | Acc | 50.00 | 14.29 | 8.33 | 25.00 | 20.00 | 20.00 |
| F1 | 50.00 | 14.29 | 8.33 | 25.00 | 20.00 | 20.00 | |
| Human | Acc | 73.675.13 | 21.835.34 | 2.173.49 | 33.675.43 | 37.835.78 | 25.006.10 |
| F1 | 73.054.95 | 15.644.34 | 1.812.84 | 25.106.41 | 20.423.95 | 16.684.54 | |
| GPT 4o | Acc | 60.00 | 36.00 | 14.00 | 46.00 | 49.00 | 26.00 |
| F1 | 59.86 | 27.56 | 11.36 | 25.29 | 22.87 | 16.15 | |
| Gemini 2.0 Flash | Acc | 60.00 | 30.00 | 6.00 | 47.00 | 51.00 | 32.00 |
| F1 | 59.86 | 20.03 | 2.31 | 26.10 | 23.31 | 15.24 | |
| Gemini 2.5 Flash | Acc | 64.00 | 30.00 | 7.00 | 43.00 | 49.00 | 25.00 |
| F1 | 63.99 | 26.31 | 3.30 | 24.14 | 22.90 | 13.73 | |
| \rowcolorgray!20 Thinking Models | |||||||
| GPT 5 Mini | Acc | 69.00 | 29.00 | 9.00 | 43.00 | 49.00 | 26.00 |
| F1 | 68.97 | 19.72 | 6.60 | 23.59 | 22.62 | 15.81 | |
| GPT 5 | Acc | 76.00 | 31.00 | 11.00 | 46.00 | 51.00 | 25.00 |
| F1 | 75.65 | 24.82 | 5.91 | 27.12 | 24.11 | 14.37 | |
| Gemini 2.5 Pro | Acc | 75.00 | 30.00 | 8.00 | 51.00 | 53.00 | 31.00 |
| F1 | 74.80 | 26.45 | 5.80 | 30.54 | 26.33 | 21.72 | |
To contextualise LLM performance, we conducted a human evaluation study. We randomly sampled 100 user sessions, stratified to match the demographic distribution of our dataset as detailed in Table 1. As with our main analysis, sessions from users who selected “prefer not to say” for an attribute or chose a gender category not represented in the census prior were excluded from the sample for those respective evaluations. We recruited six human annotators (2 female, 4 male) with diverse professional backgrounds, including legal and privacy expertise, computer science, and human resources. Each annotator was tasked with inferring the six demographic attributes for each of the 100 sessions, based solely on the same ad content shown to the LLM. To best capture intuitive human inference in a realistic and tractable manner, annotators were shown the raw, human-readable visual images of the ads within each session, as processing the full structured textual captions, categories, key entities from all ads in 100 sessions would be cognitively overwhelming. In contrast, the LLM received the structured textual input generated by our multimodal understanding pipeline (as described in Section 3.1) as in our session-level analysis. Our research design was reviewed and approved by our university’s Human Research Ethics Board.
This design allows for an ecologically valid comparison between intuitive human inference and systematic algorithmic inference. The final human performance metrics reported in Table 4.4.3 are the average of the individual performances of six annotators, compared against both the random guessing baseline and the performance of LLMs in the exact same 100 sessions.
The results reveal an interesting dynamic between human intuition and algorithmic inference. For Gender, human annotators demonstrated remarkable proficiency, achieving an average accuracy of 73.67%. This performance is higher than most of the tested LLMs, though the most advanced model (GPT 5, Gemini 2.5 Pro) approached or even exceeded human-level accuracy at 76.00% and 75.00%. This suggests that humans are particularly adept at decoding the subtle gendered cues embedded in advertising content. However, for most other attributes, the top-performing LLMs consistently matched or surpassed human capabilities. For Education and Employment, the best model, Gemini 2.5 Pro, achieved significantly higher accuracies (51.00% and 53.00% respectively) compared to the human average (33.67% and 37.83%). This indicates that LLMs are more effective at identifying the complex and non-obvious correlations between ad content and a user’s professional or educational background. For Age, the leading LLM (GPT 4o) also showed a clear advantage over human annotators (36.00% vs. 21.83% accuracy). Both humans and all tested LLMs struggled with Income, with human performance falling below the random baseline, reinforcing our finding that this attribute is not reliably encoded in ad content in a way that is easily decodable by either human or machine intelligence. For Party preference, the top-performing LLM (Gemini 2.0 Flash and Gemini 2.5 Pro) and humans achieved comparable accuracy, although the inter-rater variability for humans was high, as indicated by the standard deviation.
In summary, this evaluation highlights that while humans excel at inferring certain socially-cued attributes like gender, state-of-the-art LLMs demonstrate a competitive or even superior ability to reconstruct more complex, multi-class attributes like education, employment, and age from ad sequences. This underscores the power of LLMs as inference engines that can match or exceed human capabilities in decoding demographic signals from digital footprints, further amplifying the privacy risks we identified
4.4.4. Random Control Group
| Level | Method | Gender | Age | Income | Education | Employment | Party | |
|---|---|---|---|---|---|---|---|---|
| Session | Random Control | Acc | 58.80 | 20.56 | 10.07 | 42.76 | 48.29 | 34.63 |
| F1 | 58.50 | 15.88 | 4.59 | 18.13 | 19.72 | 21.07 | ||
| Sequential | Acc | 59.13 | 20.41 | 9.94 | 42.70 | 48.38 | 35.13 | |
| F1 | 58.85 | 15.62 | 4.56 | 18.04 | 19.92 | 20.99 | ||
| User | Random Control | Acc | 70.39 | 38.00 | 10.27 | 42.56 | 57.09 | 39.12 |
| F1 | 70.38 | 32.02 | 6.31 | 24.20 | 31.01 | 23.81 | ||
| Sequential | Acc | 74.88 | 41.18 | 9.11 | 44.18 | 58.15 | 39.91 | |
| F1 | 74.87 | 34.57 | 5.46 | 24.76 | 31.98 | 23.90 | ||
| Sequential† | Acc | 76.38 | 40.84 | 8.99 | 43.71 | 57.80 | 41.60 | |
| F1 | 76.35 | 34.39 | 5.76 | 25.21 | 32.04 | 25.82 |
Our reconstruction framework is predicated on the hypothesis that the sequence of advertisements contains meaningful temporal signals that the LLM can leverage. To isolate and quantify the value of this sequential information, we introduce a random control group. For this experiment, we create a “shuffled” version of our dataset where, for each user session, the chronological order of the ads is randomised. This process preserves the exact same set of ads within each session but disrupts any temporal patterns. We then task the LLM with performing profile reconstruction on both the original, chronologically ordered data (Sequential) and this shuffled version (Random Control). By comparing the performance between these two conditions, we can directly measure the contribution of the ad sequence order to the model’s inferential accuracy. The full prompt used for this experiment is provided in Figure 14.
For this analysis, we evaluate performance at both the session and user levels. Unlike the comparison against census priors, this experiment does not require harmonisation with external datasets. Accordingly, we use the full set of demographic categories present in our original data, providing a more complete picture of performance. However, we applied the same exclusion criteria as in the main analysis, removing responses where users selected “prefer not to say” for any attribute and excluding those who chose their gender as “other”. The results are presented in Table 7.
At the session level, the performance difference between the Sequential and Random Control groups remains minimal across all attributes. For most metrics, the accuracies and F1-scores are nearly identical, with negligible variations that are likely attributable to model stochasticity. This finding confirms that at the granular level of a single, short user session, the specific order of ads provides little to no additional signal for the LLM. The model’s inferences appear to be based primarily on the aggregate semantic content of the ads present in the session, rather than their temporal arrangement.
However, a clear and significant pattern emerges at the user level. When information is aggregated across a user’s entire history, the Sequential model consistently outperforms the Random Control group on most attributes, demonstrating the value of temporal information in long-term profile reconstruction. For instance, the accuracy for Age improves from 38.00% in the control group to 41.18% in the sequential model, with a corresponding increase in F1-score from 32.02% to 34.57%. A similar, though more modest, trend is visible for Education, Gender, and Employment. The notable improvement is seen in Party preference, where the F1-score for the augmented sequential model (Sequential†) rises to 25.82% from the control group’s 23.81%, suggesting that the evolution of a user’s ad stream over time is a useful signal for inferring their political affiliation. Finally, consistent with our previous findings, augmenting the LLM with Australian-specific context (Sequential†) provides a small but consistent performance boost over the standard sequential model, particularly for Party preference. This confirms that providing high-level contextual information can further refine the model’s inferential capabilities on top of the signals derived from ad content and sequence.
In conclusion, this control experiment validates that the temporal sequence of advertisements is a valuable source of signal for user profile reconstruction, particularly for nuanced attributes like age and political preference. While strong signals like gender can be inferred effectively from the mere aggregation of ad content, preserving the chronological order allows the LLM to achieve a higher level of inferential accuracy and robustness across a broader range of demographic characteristics.
4.4.5. Misprediction Analysis
| Level | Method | Age Acc | Age F1 | Income Acc | Income F1 |
|---|---|---|---|---|---|
| GPT 4o* | Exact | 36.00 | 27.56 | 14.00 | 11.36 |
| Lenient | 63.00 ( 75.00%) | 54.76 ( 98.69%) | 32.00 ( 128.57%) | 30.56 ( 169.01%) | |
| GPT 5 Mini* | Exact | 29.00 | 19.72 | 9.00 | 6.57 |
| Lenient | 63.00 ( 117.24%) | 56.62 ( 187.12%) | 26.00 ( 188.89%) | 21.81 ( 231.96%) | |
| GPT 5* | Exact | 31.00 | 24.82 | 11.00 | 5.91 |
| Lenient | 66.00 ( 112.90%) | 61.64 ( 148.35%) | 38.00 ( 245.45%) | 25.48 ( 331.13%) | |
| Gemini 2.0 Flash* | Exact | 30.00 | 20.03 | 6.00 | 2.51 |
| Lenient | 64.00 ( 113.33%) | 55.96 ( 179.38%) | 22.00 ( 266.67%) | 15.52 ( 518.33%) | |
| Gemini 2.5 Flash* | Exact | 30.00 | 26.31 | 7.00 | 3.30 |
| Lenient | 65.00 ( 116.67%) | 56.94 ( 116.42%) | 21.00 ( 200.00%) | 18.75 ( 468.18%) | |
| Gemini 2.5 Pro* | Exact | 30.00 | 26.45 | 8.00 | 5.80 |
| Lenient | 73.00 ( 143.33%) | 69.17 ( 161.51%) | 31.00 ( 287.50%) | 22.12 ( 281.38%) | |
| Session | Exact | 20.41 | 15.62 | 9.98 | 5.00 |
| Lenient | 48.67 ( 138.46%) | 46.78 ( 199.49%) | 25.22 ( 152.65%) | 17.45 ( 249.00%) | |
| User | Exact | 41.18 | 34.57 | 9.11 | 5.46 |
| Lenient | 80.55 ( 95.60%) | 79.03 ( 128.61%) | 27.47 ( 201.54%) | 22.79 ( 317.40%) |
Our analysis so far has relied on an Exact match criterion, where a prediction is only considered correct if it perfectly aligns with the ground truth. While standard, this approach can be overly punitive for ordinal attributes like Age and Income, where a prediction that is “close” is more informative than one that is far off. For instance, misclassifying a 25-year-old as being in the 18–24 age bracket is a less severe error than classifying them as 65–74. To capture this nuance, we introduce a more forgiving, “Lenient” evaluation criterion. Under this setting, a prediction is considered correct if it either exactly matches the ground truth or falls within one adjacent, pre-defined “near” category (e.g., for the 25–34 age bracket, the adjacent categories are 18–24 and 35–44). Table 8 presents the performance for Age and Income prediction under both the Exact and Lenient criteria, evaluated across our different experimental settings: the 100-session sample (for all tested LLMs), the full session-level dataset, and the final user-level aggregation.
The results reveal a dramatic and consistent improvement across all models and settings when moving from the Exact to the Lenient criterion. For Age, the performance of all models on the 100-session sample improves substantially, with accuracies often doubling. This trend culminates at the user-level, where accuracy skyrockets from 41.18% to 80.55%, and the F1-score more than doubles from 34.57% to 79.03%. This indicates that a large proportion of the models’ “incorrect” predictions were, in fact, “near misses” into an adjacent age bracket. This strongly suggests that ad streams contain a robust signal for a user’s approximate age, which machine intelligence can effectively decode, even if pinpointing the exact bracket remains challenging.
A similar, albeit less pronounced, trend is observed for Income. At the user-level, the Lenient accuracy climbs from 9.11% to 27.47%, and the F1-score shows a remarkable four-fold increase from 5.46% to 22.79%. While the absolute performance for income reconstruction remains modest, this substantial relative improvement demonstrates that the models’ predictions are not random noise. Instead, they are able to place users in an income bracket adjacent to their true one, suggesting that ad content contains a coarse but discernible signal of a user’s general economic standing.
In conclusion, this misprediction analysis provides a crucial layer of interpretation. It shows that for ordinal attributes like Age and Income, the LLMs’ inferential power is significantly greater than what exact-match accuracy suggests. The models are not just making random errors; they are consistently making predictions that are semantically close to the ground truth. This implies that even imperfect predictions can be “directionally correct”, which significantly amplifies the privacy risks of profile reconstruction from ad content.
5. Discussion
Our findings provide a multi-faceted view of the contemporary ad targeting ecosystem, revealing both embedded algorithmic biases and risks from the widespread availability of powerful LLMs. We structure the discussion around the nature of these biases and privacy risks, the policy and governance implications, and the study’s limitations.
5.1. Harmful Algorithmic Biases and Privacy Risks
Our research uncovers a dual-layered of risk. The first, from our statistical audit, is the bias inherent in the ad-delivery system itself. Our findings extend prior work (Ali et al., 2019; Imana et al., 2021b; Kaplan et al., 2022; Lambrecht and Tucker, 2019) by providing a large-scale, user-level quantification of these biases with ground-truth demographic data. Evidence of inappropriate targeting in Gambling is stark, showing higher exposure for socioeconomically vulnerable groups, such as those with lower educational attainment and the unemployed. This suggests a potentially predatory dynamic where the platform’s optimisation mechanisms may be exploiting known risk factors for gambling harm. Similarly, the concentration of political ads among specific demographic segments points to the system’s role in reinforcing political beliefs, rather than fostering open deliberation or individual autonomy.
The second, emergent layer of risk is the feasibility of user profile reconstruction by third parties using LLMs. Our work provides the first empirical demonstration that the stream of ads shown to a user is not innocuous noise but a rich digital footprint that can be systematically decoded. The success of our LLM in reconstructing attributes like gender, age, education and employment with high accuracy, rivalling or exceeding human annotators for almost all attributes, is a critical finding. It shows that an external actor, e.g., through a malicious browser extension (Englehardt and Narayanan, 2016; Nayak et al., 2024; Xie et al., 2024; Aggarwal et al., 2018; Somé, 2019), could reverse-engineer sensitive information from publicly broadcast ads. Critically, the level of protection platforms apply to behavioural data (e.g., ad stream) appears significantly lower than that for user’s personal information (Cheng and Guo, 2025). This reverse-engineering of user profiles is particularly concerning because users often perceive personalized content as reflecting stable identity, not merely a product of their recent clicks. For instance, users, especially younger ones often integrate these algorithmic reflections into their own sense of self (Mcdonald et al., 2024). Yet, users’ mental models of how platforms generate inferences are often flawed, leading to surprise and concern when they encounter inferences that seem inaccurate or inexplicable (Hautea et al., 2020). This is compounded by a fundamental misalignment between users’ contextual, evolving perception of what constitutes identifiable information and the static, formal definitions used by platforms and regulators (Song et al., 2025). This gap in user understanding is precisely what makes our findings so critical. The ability of LLMs to systematically decode ad streams represents a form of profiling that operates far beyond users’ typical expectations of how platforms function and what personal information could be leaked from seemingly innocuous ad content (Hautea et al., 2020; Yao et al., 2017; Rader, 2014; Eslami et al., 2018; Ma et al., 2025b). This dynamic often leaves users feeling a sense of powerlessness, resigned to their data being used in ways they do not fully understand or approve of (Gómez Ortega et al., 2025). The finding that the LLM’s errors for Age and Income are often “near misses” is deeply concerning. It implies that even when the model is not perfectly accurate, it is often “directionally correct”, capable of placing individuals into coarse but meaningful categories (e.g., “young”, “low-income”). This level of accuracy is sufficient to constitute a meaningful privacy breach, as it enables the inference of sensitive demographic attributes even without perfect precision. The fact that the barrier to conducting this kind of privacy-invasive inference is no longer expertise in data science but simply access to a publicly available AI tool emphasises the scale and novelty of this threat. This vulnerability is exacerbated by the narrow, algorithm-centered nature of platform transparency, which focuses on explaining models while ignoring the broader socio-organisational context in which these systems operate (Ehsan et al., 2021a). Our auditing framework, by revealing systemic, population-level patterns of ad delivery, takes a step towards the transparency that is necessary for users and regulators to truly understand the collective risks and harms of these systems.
5.2. Implications for Policy
The demonstration that multimodal LLMs can reconstruct sensitive attributes from ad streams has direct implications for platform accountability, data protection frameworks, and AI governance. We structure our recommendations across three interconnected domains. First, on transparency and accountability, our findings show that current mechanisms are insufficient. Requirements must evolve beyond current “Why am I seeing this ad?” explanations, which prior work has shown to be incomplete (Burgess et al., 2024; Andreou et al., 2018). Content-level auditing, particularly of the kind we have demonstrated, should move beyond the analysis of singular, isolated ads and towards sequence and group-level analysis and be incorporated into platform transparency reports and mandated for independent researchers. This would allow regulators and civil society to detect demographic skews in ad delivery and identify harmful targeting patterns in near real time, shifting the paradigm from transparency to genuine accountability, which requires embracing a “Social Transparency” that captures systemic operational patterns over the technical details of individual outputs (Ehsan et al., 2021b). Second, on the legal and regulatory front, privacy frameworks such as the GDPR (GDP, 2016) and Australia’s Privacy Act (Pri, 1988) should adapt to the reality of inferential risks. Our work suggests that an “ad stream” itself can constitute a form of personal data leakage. Regulations should explicitly recognise that data inferred from content exposure is a form of personal data, affording it the same protections as data explicitly provided by users. This would close a significant loophole where actors can claim they have not collected “personal information” while still deriving it through powerful inference, a risk now democratised by accessible LLMs. Third, platforms and regulators must anticipate and mitigate adversarial uses through technical and design interventions. Given the accessibility of contemporary LLMs, proactive technical mitigations are essential. These could include: (1) limiting the granularity and persistence of identifiable ad delivery logs accessible to third parties (e.g., enforcing stricter API rate limits and adopting privacy-enhancing browser architectures like cross-origin ad rendering); (2) introducing randomness or diversity constraints into ad sequencing to reduce the stability of demographic signals, thereby making reconstruction more difficult (e.g., extending fairness-enhancing mechanisms like Meta’s Variance Reduction System (Timmaraju et al., 2023), currently limited to housing ads, to other sensitive categories like gambling or political content); and (3) prohibiting or rate-limiting the high-frequency delivery of sensitive-category ads to groups identified as vulnerable (e.g., implementing platform-wide frequency caps for categories like gambling ads). These findings strengthen the case for mandatory algorithmic impact assessments that require platforms to evaluate not only their targeting algorithms but also the emergent demographic signals embedded in the content streams they produce.
5.3. Limitations and Future Work
Several limitations of this study should be acknowledged. First, our dataset, while large and longitudinal, is sourced from a self-selected group of Australian volunteers using a browser plugin. This cohort may not be fully representative of the broader Facebook population, particularly mobile-only users, and may not generalise to other countries with different advertising norms or platform policies (Kaushik et al., 2024). Second, while our harmful algorithmic bias audit identifies statistically significant disparities, the causal mechanisms remain opaque. We cannot definitively distinguish between bias originating from advertiser targeting strategies, platform optimisation algorithms, or user-level engagement feedback loops. Disentangling these mechanisms would require access to platform-side data, which is currently unavailable to independent researchers. Third, our analysis focuses on Facebook; other platforms with different ad formats or targeting policies may exhibit different patterns. Extending our framework to TikTok, Instagram, and programmatic ad networks is a crucial next step. Similarly, other sensitive traits not analysed here, such as religion or race, may also be encoded in ad streams, warranting further investigation. Finally, our LLM-based reconstruction pipeline has methodological limitations. Our approach is a multi-stage process, not an end-to-end one; we first use a single multimodal model (Gemini 2.0 Flash) to generate structured textual summaries from raw ad content, which are then used for all subsequent demographic inferences (see Section 3.1). This design was a necessary trade-off to manage the prohibitive token costs and contextual complexity of directly processing long multimodal ad sequences(as detailed in Section 3.3), a design which allows for scalable and controlled analysis. However, it also means the quality of the final inference is bottlenecked by the initial summary generation, and we do not capture the potential performance of a true end-to-end system. Future work with more powerful LLMs could explore direct, end-to-end profile reconstruction.
6. Conclusion
In this work, we examined the dual risks of algorithmic bias in ad targeting and the emergent threat of user profile reconstruction by Large Language Models. Using a multi-stage auditing framework that combines statistical analysis of ad delivery with LLM-based inference, we found strong evidence of inappropriate targeting and demonstrated, for the first time, that a state-of-the-art multimodal LLM can reliably infer gender, education, employment status, and produce human-comparable, above-chance estimates of age, income and party preference from ad streams alone. Temporal patterns in ad delivery further amplified this risk, and even “near-miss” errors for ordinal attributes, such as age and income, constituted meaningful privacy violations. These findings show that an ad stream is not merely a sequence of commercial messages, but a rich digital footprint that leaks personal information. The accessibility of modern LLMs has made such inference broadly feasible, shifting it from a theoretical concern to a practical reality. Safeguarding against these inferential risks will require moving beyond platform-provided transparency tools toward auditing the content-level signals embedded in ad delivery.
Acknowledgements.
This research includes computations using the Wolfpack computational cluster, supported by the School of Computer Science and Engineering at UNSW Sydney. We also acknowledge support from the ARC Centre of Excellence for Automated Decision-Making and Society (CE200100005). We would like to thank Abdul Obeid for suggesting the idea of using a KDE-based approach for defining session thresholds. We further thank Baihe Zhang, Abdul Obeid, Zechen Li, Wilson Wongso, Yixuan Liu for their hard work on annotation, which greatly contributed to the human evaluation.References
- (1)
- GDP (2016) 2016. General Data Protection Regulation (GDPR). https://eur-lex.europa.eu/legal-content/EN/TXT/PDF/?uri=CELEX:32016R0679
- Pri (1988) 1988. Privacy Act 1988. https://www.legislation.gov.au/C2004A03712/latest/text
- Aggarwal et al. (2018) Anupama Aggarwal, Bimal Viswanath, Liang Zhang, Saravana Kumar, Ayush Shah, and Ponnurangam Kumaraguru. 2018. I spy with my little eye: analysis and detection of spying browser extensions. In 2018 IEEE European Symposium on Security and Privacy (EuroS&P). IEEE, 47–61.
- Akgul et al. (2022) Omer Akgul, Richard Roberts, Moses Namara, Dave Levin, and Michelle L Mazurek. 2022. Investigating influencer VPN ads on YouTube. In 2022 IEEE Symposium on Security and Privacy (SP). IEEE, 876–892.
- Ali et al. (2022) Muhammad Ali, Angelica Goetzen, Alan Mislove, Elissa Redmiles, and Piotr Sapiezynski. 2022. All things unequal: Measuring disparity of potentially harmful ads on facebook. In Proceedings of the 2022 workshop on consumer protection.
- Ali et al. (2023) Muhammad Ali, Angelica Goetzen, Alan Mislove, Elissa M Redmiles, and Piotr Sapiezynski. 2023. Problematic advertising and its disparate exposure on Facebook. In 32nd USENIX Security Symposium (USENIX Security 23). 5665–5682.
- Ali et al. (2019) Muhammad Ali, Piotr Sapiezynski, Miranda Bogen, Aleksandra Korolova, Alan Mislove, and Aaron Rieke. 2019. Discrimination through Optimization: How Facebook’s Ad Delivery Can Lead to Biased Outcomes. Proc. ACM Hum.-Comput. Interact. 3, CSCW, Article 199 (Nov. 2019), 30 pages. doi:10.1145/3359301
- Andreou et al. (2018) Athanasios Andreou, Giridhari Venkatadri, Oana Goga, Krishna P Gummadi, Patrick Loiseau, and Alan Mislove. 2018. Investigating ad transparency mechanisms in social media: A case study of Facebook’s explanations. In NDSS 2018-Network and distributed system security symposium. 1–15.
- Angus et al. (2024a) Daniel Angus, Lauren Hayden, Abdul Karim Obeid, Xue Ying Tan, Nicholas Carah, Jean Burgess, Christine Parker, et al. 2024a. Computational Methods for Improving the Observability of Platform-Based Advertising. Journal of Advertising 53, 5 (2024), 661–680. doi:10.1080/00913367.2024.2394156
- Angus et al. (2024b) Daniel Angus, Abdul Karim Obeid, Jean Burgess, Christine Parker, Mark Andrejevic, Nicholas Carah, and Xue Ying Tan. 2024b. Enabling online advertising transparency through data donation methods. Computational Communication Research 6, 2 (2024), 1.
- Anthropic (2025) Anthropic. 2025. Claude Opus 4 & Claude Sonnet 4: System Card. Technical Report. Anthropic.
- Balog et al. (2019) Krisztian Balog, Filip Radlinski, and Shushan Arakelyan. 2019. Transparent, scrutable and explainable user models for personalized recommendation. In Proceedings of the 42nd international acm sigir conference on research and development in information retrieval. 265–274.
- Bi et al. (2013) Bin Bi, Milad Shokouhi, Michal Kosinski, and Thore Graepel. 2013. Inferring the demographics of search users: social data meets search queries. In Proceedings of the 22nd International Conference on World Wide Web (Rio de Janeiro, Brazil) (WWW ’13). Association for Computing Machinery, New York, NY, USA, 131–140. doi:10.1145/2488388.2488401
- Boonprakong et al. (2023) Nattapat Boonprakong, Benjamin Tag, and Tilman Dingler. 2023. Designing Technologies to Support Critical Thinking in an Age of Misinformation. IEEE Pervasive Computing 22, 3 (2023), 8–17. doi:10.1109/MPRV.2023.3275514
- Burgess et al. (2024) Jean Burgess, Nicholas Carah, Daniel Angus, Abdul Obeid, and Mark Andrejevic. 2024. Why Am I Seeing This Ad? The affordances and limits of automated user-level explanation in Meta’s advertising system. New Media & Society 26, 9 (2024), 5130–5149. doi:10.1177/14614448241251796
- Cameron and Trivedi (2013) Adrian Colin Cameron and Pravin K Trivedi. 2013. Regression analysis of count data. Number 53. Cambridge university press.
- Capozzi et al. (2023) Arthur Capozzi, Gianmarco De Francisci Morales, Yelena Mejova, Corrado Monti, and André Panisson. 2023. The Thin Ideology of Populist Advertising on Facebook during the 2019 EU Elections. In Proceedings of the ACM Web Conference 2023 (Austin, TX, USA) (WWW ’23). Association for Computing Machinery, New York, NY, USA, 2852–2862. doi:10.1145/3543507.3583267
- Cheng and Guo (2025) Le Cheng and Yijin Guo. 2025. Privacy Protection on Social Media Platforms: Overdisclosure of Online Behavioral Data is Labeling Users. International Journal of Digital Law and Governance (2025). doi:doi:10.1515/ijdlg-2025-0001
- Comanici et al. (2025) Gheorghe Comanici, Eric Bieber, Mike Schaekermann, Ice Pasupat, Noveen Sachdeva, Inderjit Dhillon, Marcel Blistein, Ori Ram, Dan Zhang, Evan Rosen, et al. 2025. Gemini 2.5: Pushing the frontier with advanced reasoning, multimodality, long context, and next generation agentic capabilities. arXiv preprint arXiv:2507.06261 (2025).
- Dambra et al. (2022) Savino Dambra, Iskander Sanchez-Rola, Leyla Bilge, and Davide Balzarotti. 2022. When Sally met trackers: Web tracking from the users’ perspective. In 31st USENIX Security Symposium (USENIX Security 22). 2189–2206.
- Dolin et al. (2018) Claire Dolin, Ben Weinshel, Shawn Shan, Chang Min Hahn, Euirim Choi, Michelle L. Mazurek, and Blase Ur. 2018. Unpacking Perceptions of Data-Driven Inferences Underlying Online Targeting and Personalization. In Proceedings of the 2018 CHI Conference on Human Factors in Computing Systems (Montreal QC, Canada) (CHI ’18). Association for Computing Machinery, New York, NY, USA, 1–12. doi:10.1145/3173574.3174067
- Edelson et al. (2019) Laura Edelson, Shikhar Sakhuja, Ratan Dey, and Damon McCoy. 2019. An analysis of United States online political advertising transparency. arXiv preprint arXiv:1902.04385 (2019).
- Ehsan et al. (2021a) Upol Ehsan, Q. Vera Liao, Michael Muller, Mark O. Riedl, and Justin D. Weisz. 2021a. Expanding Explainability: Towards Social Transparency in AI systems. In Proceedings of the 2021 CHI Conference on Human Factors in Computing Systems (Yokohama, Japan) (CHI ’21). Association for Computing Machinery, New York, NY, USA, Article 82, 19 pages. doi:10.1145/3411764.3445188
- Ehsan et al. (2021b) Upol Ehsan, Q. Vera Liao, Michael Muller, Mark O. Riedl, and Justin D. Weisz. 2021b. Expanding Explainability: Towards Social Transparency in AI systems. In Proceedings of the 2021 CHI Conference on Human Factors in Computing Systems (Yokohama, Japan) (CHI ’21). Association for Computing Machinery, New York, NY, USA, Article 82, 19 pages. doi:10.1145/3411764.3445188
- Englehardt and Narayanan (2016) Steven Englehardt and Arvind Narayanan. 2016. Online Tracking: A 1-million-site Measurement and Analysis. In Proceedings of the 2016 ACM SIGSAC Conference on Computer and Communications Security (Vienna, Austria) (CCS ’16). Association for Computing Machinery, New York, NY, USA, 1388–1401. doi:10.1145/2976749.2978313
- Eslami et al. (2018) Motahhare Eslami, Sneha R. Krishna Kumaran, Christian Sandvig, and Karrie Karahalios. 2018. Communicating Algorithmic Process in Online Behavioral Advertising. In Proceedings of the 2018 CHI Conference on Human Factors in Computing Systems (Montreal QC, Canada) (CHI ’18). Association for Computing Machinery, New York, NY, USA, 1–13. doi:10.1145/3173574.3174006
- Gómez Ortega et al. (2025) Alejandra Gómez Ortega, Hosana Morales Ornelas, and Uğur Genç. 2025. Surrendering to Powerlesness: Governing Personal Data Flows in Generative AI. In Proceedings of the 2025 CHI Conference on Human Factors in Computing Systems (CHI ’25). Association for Computing Machinery, New York, NY, USA, Article 232, 18 pages. doi:10.1145/3706598.3713504
- Google DeepMind (2025) Google DeepMind. 2025. Gemini 2.0 Flash Model Card. Technical Report. Google DeepMind.
- Guo et al. (2025) Daya Guo, Dejian Yang, Haowei Zhang, Junxiao Song, Ruoyu Zhang, Runxin Xu, Qihao Zhu, Shirong Ma, Peiyi Wang, Xiao Bi, et al. 2025. Deepseek-r1: Incentivizing reasoning capability in llms via reinforcement learning. arXiv preprint arXiv:2501.12948 (2025).
- Hautea et al. (2020) Samantha Hautea, Anjali Munasinghe, and Emilee Rader. 2020. ’That’s Not Me’: Surprising Algorithmic Inferences. In Extended Abstracts of the 2020 CHI Conference on Human Factors in Computing Systems (Honolulu, HI, USA) (CHI EA ’20). Association for Computing Machinery, New York, NY, USA, 1–7. doi:10.1145/3334480.3382816
- He et al. (2024) Fengxiang He, Mengnan Du, Aris Filos-Ratsikas, Lu Cheng, Qingquan Song, Min Lin, and John Vines. 2024. AI Driven Online Advertising: Market Design, Generative AI, and Ethics. In Companion Proceedings of the ACM Web Conference 2024 (Singapore, Singapore) (WWW ’24). Association for Computing Machinery, New York, NY, USA, 1407–1409. doi:10.1145/3589335.3641295
- Hilbe (2011) Joseph M Hilbe. 2011. Negative binomial regression. Cambridge University Press.
- Hinds and Joinson (2018) Joanne Hinds and Adam N Joinson. 2018. What demographic attributes do our digital footprints reveal? A systematic review. PloS one 13, 11 (2018), e0207112.
- Hurst et al. (2024) Aaron Hurst, Adam Lerer, Adam P Goucher, Adam Perelman, Aditya Ramesh, Aidan Clark, AJ Ostrow, Akila Welihinda, Alan Hayes, Alec Radford, et al. 2024. Gpt-4o system card. arXiv preprint arXiv:2410.21276 (2024).
- IAB Technology Laboratory ([n. d.]) IAB Technology Laboratory. [n. d.]. Ad Product Taxonomy. IAB Tech Lab website. https://iabtechlab.com/standards/ad-product-taxonomy/ Last updated: December 11, 2024.
- Im et al. (2023) Jane Im, Ruiyi Wang, Weikun Lyu, Nick Cook, Hana Habib, Lorrie Faith Cranor, Nikola Banovic, and Florian Schaub. 2023. Less is Not More: Improving Findability and Actionability of Privacy Controls for Online Behavioral Advertising. In Proceedings of the 2023 CHI Conference on Human Factors in Computing Systems (Hamburg, Germany) (CHI ’23). Association for Computing Machinery, New York, NY, USA, Article 661, 33 pages. doi:10.1145/3544548.3580773
- Imana et al. (2021a) Basileal Imana, Aleksandra Korolova, and John Heidemann. 2021a. Auditing for Discrimination in Algorithms Delivering Job Ads. In Proceedings of the Web Conference 2021 (Ljubljana, Slovenia) (WWW ’21). Association for Computing Machinery, New York, NY, USA, 3767–3778. doi:10.1145/3442381.3450077
- Imana et al. (2021b) Basileal Imana, Aleksandra Korolova, and John Heidemann. 2021b. Auditing for Discrimination in Algorithms Delivering Job Ads (WWW ’21). Association for Computing Machinery, New York, NY, USA, 3767–3778. doi:10.1145/3442381.3450077
- Imana et al. (2024) Basileal Imana, Aleksandra Korolova, and John Heidemann. 2024. Auditing for Bias in Ad Delivery Using Inferred Demographic Attributes. arXiv preprint arXiv:2410.23394 (2024). https://arxiv.org/abs/2410.23394
- Jaech et al. (2024) Aaron Jaech, Adam Kalai, Adam Lerer, Adam Richardson, Ahmed El-Kishky, Aiden Low, Alec Helyar, Aleksander Madry, Alex Beutel, Alex Carney, et al. 2024. Openai o1 system card. arXiv preprint arXiv:2412.16720 (2024).
- Johnson et al. (2017) Isaac Johnson, Connor McMahon, Johannes Schöning, and Brent Hecht. 2017. The Effect of Population and ”Structural” Biases on Social Media-based Algorithms: A Case Study in Geolocation Inference Across the Urban-Rural Spectrum. In Proceedings of the 2017 CHI Conference on Human Factors in Computing Systems (Denver, Colorado, USA) (CHI ’17). Association for Computing Machinery, New York, NY, USA, 1167–1178. doi:10.1145/3025453.3026015
- Kaplan et al. (2022) Levi Kaplan, Nicole Gerzon, Alan Mislove, and Piotr Sapiezynski. 2022. Measurement and analysis of implied identity in ad delivery optimization. In Proceedings of the 22nd ACM Internet Measurement Conference (Nice, France) (IMC ’22). Association for Computing Machinery, New York, NY, USA, 195–209. doi:10.1145/3517745.3561450
- Kaushik et al. (2024) Smirity Kaushik, Tanusree Sharma, Yaman Yu, Amna F Ali, Yang Wang, and Yixin Zou. 2024. Cross-Country Examination of People’s Experience with Targeted Advertising on Social Media. In Extended Abstracts of the CHI Conference on Human Factors in Computing Systems (Honolulu, HI, USA) (CHI EA ’24). Association for Computing Machinery, New York, NY, USA, Article 91, 10 pages. doi:10.1145/3613905.3650780
- Kosinski et al. (2013) Michal Kosinski, David Stillwell, and Thore Graepel. 2013. Private traits and attributes are predictable from digital records of human behavior. Proceedings of the National Academy of Sciences 110, 15 (2013), 5802–5805. arXiv:https://www.pnas.org/doi/pdf/10.1073/pnas.1218772110 doi:10.1073/pnas.1218772110
- Lambrecht and Tucker (2019) Anja Lambrecht and Catherine Tucker. 2019. Algorithmic bias? An empirical study of apparent gender-based discrimination in the display of STEM career ads. Management science 65, 7 (2019), 2966–2981.
- Li et al. (2024) Tianshi Li, Sauvik Das, Hao-Ping (Hank) Lee, Dakuo Wang, Bingsheng Yao, and Zhiping Zhang. 2024. Human-Centered Privacy Research in the Age of Large Language Models. In Extended Abstracts of the CHI Conference on Human Factors in Computing Systems (Honolulu, HI, USA) (CHI EA ’24). Association for Computing Machinery, New York, NY, USA, Article 581, 4 pages. doi:10.1145/3613905.3643983
- Ma et al. (2025a) Rongjun Ma, Caterina Maidhof, Juan Carlos Carrillo, Janne Lindqvist, and Jose Such. 2025a. Privacy Perceptions of Custom GPTs by Users and Creators. In Proceedings of the 2025 CHI Conference on Human Factors in Computing Systems (CHI ’25). Association for Computing Machinery, New York, NY, USA, Article 237, 18 pages. doi:10.1145/3706598.3713540
- Ma et al. (2025b) Ying Ma, Shiquan Zhang, Dongju Yang, Zhanna Sarsenbayeva, Jarrod Knibbe, and Jorge Goncalves. 2025b. Raising Awareness of Location Information Vulnerabilities in Social Media Photos using LLMs. In Proceedings of the 2025 CHI Conference on Human Factors in Computing Systems (CHI ’25). Association for Computing Machinery, New York, NY, USA, Article 238, 14 pages. doi:10.1145/3706598.3714074
- Mariani et al. (2024) Adamo Mariani, Matteo Liberato, Anna Sperotto, and Antonia Affinito. 2024. Analyzing Privacy Implications of Mobile Apps Data Collection across Age Groups. In 2024 20th International Conference on Network and Service Management (CNSM). IEEE, 1–7.
- Mcdonald et al. (2024) Nora Mcdonald, John S. Seberger, and Afsaneh Razi. 2024. For Me or Not for Me? The Ease With Which Teens Navigate Accurate and Inaccurate Personalized Social Media Content. In Proceedings of the 2024 CHI Conference on Human Factors in Computing Systems (Honolulu, HI, USA) (CHI ’24). Association for Computing Machinery, New York, NY, USA, Article 904, 7 pages. doi:10.1145/3613904.3642297
- Meguellati et al. (2024) Elyas Meguellati, Lei Han, Abraham Bernstein, Shazia Sadiq, and Gianluca Demartini. 2024. How Good are LLMs in Generating Personalized Advertisements?. In Companion Proceedings of the ACM Web Conference 2024 (Singapore, Singapore) (WWW ’24). Association for Computing Machinery, New York, NY, USA, 826–829. https://doi-org.wwwproxy1.library.unsw.edu.au/10.1145/3589335.3651520
- Mirbabaie et al. (2021) Milad Mirbabaie, Felix Brünker, Magdalena Wischnewski, and Judith Meinert. 2021. The Development of Connective Action during Social Movements on Social Media. Trans. Soc. Comput. 4, 1, Article 3 (April 2021), 21 pages. doi:10.1145/3446981
- Nayak et al. (2024) Asmit Nayak, Rishabh Khandelwal, Earlence Fernandes, and Kassem Fawaz. 2024. Experimental Security Analysis of Sensitive Data Access by Browser Extensions. In Proceedings of the ACM Web Conference 2024 (Singapore, Singapore) (WWW ’24). Association for Computing Machinery, New York, NY, USA, 1283–1294. doi:10.1145/3589334.3645683
- OpenAI (2024) OpenAI. 2024. Memory and new controls for ChatGPT. https://openai.com/index/memory-and-new-controls-for-chatgpt/.
- OpenAI (2025) OpenAI. 2025. GPT-5 System Card. Technical Report. OpenAI.
- Pan et al. (2025) Junwei Pan, Zhilin Zhang, Han Zhu, Jian Xu, Jie Jiang, and Bo Zheng. 2025. Computational Advertising: Recent Advances (WWW ’25). Association for Computing Machinery, New York, NY, USA, 37–40. doi:10.1145/3701716.3715872
- Panjwani et al. (2013) Saurabh Panjwani, Nisheeth Shrivastava, Saurabh Shukla, and Sharad Jaiswal. 2013. Understanding the privacy-personalization dilemma for web search: a user perspective. In Proceedings of the SIGCHI Conference on Human Factors in Computing Systems (Paris, France) (CHI ’13). Association for Computing Machinery, New York, NY, USA, 3427–3430. doi:10.1145/2470654.2466470
- Rader (2014) Emilee Rader. 2014. Awareness of behavioral tracking and information privacy concern in Facebook and Google. In Proceedings of the Tenth USENIX Conference on Usable Privacy and Security (Menlo Park, CA) (SOUPS ’14). USENIX Association, USA, 51–67.
- Radlinski et al. (2022) Filip Radlinski, Krisztian Balog, Fernando Diaz, Lucas Dixon, and Ben Wedin. 2022. On natural language user profiles for transparent and scrutable recommendation. In Proceedings of the 45th international ACM SIGIR conference on research and development in information retrieval. 2863–2874.
- Ramos et al. (2024) Jerome Ramos, Hossein A. Rahmani, Xi Wang, Xiao Fu, and Aldo Lipani. 2024. Transparent and Scrutable Recommendations Using Natural Language User Profiles. In Proceedings of the 62nd Annual Meeting of the Association for Computational Linguistics (Volume 1: Long Papers), Lun-Wei Ku, Andre Martins, and Vivek Srikumar (Eds.). Association for Computational Linguistics, Bangkok, Thailand, 13971–13984. doi:10.18653/v1/2024.acl-long.753
- Reitinger et al. (2024) Nathan Reitinger, Bruce Wen, Michelle L. Mazurek, and Blase Ur. 2024. What Does It Mean to Be Creepy? Responses to Visualizations of Personal Browsing Activity, Online Tracking, and Targeted Ads. Proc. Priv. Enhancing Technol. 2024, 3 (2024), 715–743. https://doi.org/10.56553/popets-2024-0101
- Ren et al. (2024) Xubin Ren, Wei Wei, Lianghao Xia, Lixin Su, Suqi Cheng, Junfeng Wang, Dawei Yin, and Chao Huang. 2024. Representation learning with large language models for recommendation. In Proceedings of the ACM Web Conference 2024. 3464–3475.
- Sapiezynski et al. (2024) Piotr Sapiezynski, Levi Kaplan, Alan Mislove, and Aleksandra Korolova. 2024. On the Use of Proxies in Political Ad Targeting. Proc. ACM Hum.-Comput. Interact. 8, CSCW2, Article 378 (Nov. 2024), 31 pages. doi:10.1145/3686917
- Somé (2019) Dolière Francis Somé. 2019. EmPoWeb: empowering web applications with browser extensions. In 2019 IEEE Symposium on Security and Privacy (SP). IEEE, 227–245.
- Song et al. (2025) Qiurong Song, Yanlai Wu, Rie Helene (Lindy) Hernandez, Yao Li, Yubo Kou, and Xinning Gui. 2025. Understanding Users’ Perception of Personally Identifiable Information. In Proceedings of the 2025 CHI Conference on Human Factors in Computing Systems (CHI ’25). Association for Computing Machinery, New York, NY, USA, Article 240, 24 pages. doi:10.1145/3706598.3713783
- Tan and Jiang (2023) Zhaoxuan Tan and Meng Jiang. 2023. User modeling in the era of large language models: Current research and future directions. arXiv preprint arXiv:2312.11518 (2023).
- Timmaraju et al. (2023) Aditya Srinivas Timmaraju, Mehdi Mashayekhi, Mingliang Chen, Qi Zeng, Quintin Fettes, Wesley Cheung, Yihan Xiao, Manojkumar Rangasamy Kannadasan, Pushkar Tripathi, Sean Gahagan, et al. 2023. Towards fairness in personalized ads using impression variance aware reinforcement learning. In Proceedings of the 29th ACM SIGKDD Conference on Knowledge Discovery and Data Mining. 4937–4947.
- Wei et al. (2020) Miranda Wei, Madison Stamos, Sophie Veys, Nathan Reitinger, Justin Goodman, Margot Herman, Dorota Filipczuk, Ben Weinshel, Michelle L Mazurek, and Blase Ur. 2020. What Twitter knows: Characterizing ad targeting practices, user perceptions, and ad explanations through users’ own Twitter data. In 29th USENIX Security Symposium (USENIX Security 20). 145–162.
- Wongso et al. (2025) Wilson Wongso, Hao Xue, and Flora Salim. 2025. GenUP: Generative User Profilers as In-Context Learners for Next POI Recommender Systems. In Proceedings of the 33nd ACM International Conference on Advances in Geographic Information Systems (Minneapolis, MN, USA) (SIGSPATIAL ’25). Association for Computing Machinery, New York, NY, USA.
- Wu et al. (2023) Yuxi Wu, Sydney Bice, W. Keith Edwards, and Sauvik Das. 2023. The Slow Violence of Surveillance Capitalism: How Online Behavioral Advertising Harms People. In Proceedings of the 2023 ACM Conference on Fairness, Accountability, and Transparency (Chicago, IL, USA) (FAccT ’23). Association for Computing Machinery, New York, NY, USA, 1826–1837. doi:10.1145/3593013.3594119
- Xi et al. (2024) Yunjia Xi, Weiwen Liu, Jianghao Lin, Xiaoling Cai, Hong Zhu, Jieming Zhu, Bo Chen, Ruiming Tang, Weinan Zhang, and Yong Yu. 2024. Towards open-world recommendation with knowledge augmentation from large language models. In Proceedings of the 18th ACM Conference on Recommender Systems. 12–22.
- Xie et al. (2024) Qinge Xie, Manoj Vignesh Kasi Murali, Paul Pearce, and Frank Li. 2024. Arcanum: Detecting and evaluating the privacy risks of browser extensions on web pages and web content. In 33rd USENIX Security Symposium (USENIX Security 24). 4607–4624.
- Yao et al. (2017) Yaxing Yao, Davide Lo Re, and Yang Wang. 2017. Folk Models of Online Behavioral Advertising. In Proceedings of the 2017 ACM Conference on Computer Supported Cooperative Work and Social Computing (Portland, Oregon, USA) (CSCW ’17). Association for Computing Machinery, New York, NY, USA, 1957–1969. doi:10.1145/2998181.2998316
- Yeung et al. (2023) Christina Yeung, Umar Iqbal, Yekaterina Tsipenyuk O’Neil, Tadayoshi Kohno, and Franziska Roesner. 2023. Online Advertising in Ukraine and Russia During the 2022 Russian Invasion. In Proceedings of the ACM Web Conference 2023 (Austin, TX, USA) (WWW ’23). Association for Computing Machinery, New York, NY, USA, 2787–2796. doi:10.1145/3543507.3583484
- Zeng et al. (2021a) Eric Zeng, Tadayoshi Kohno, and Franziska Roesner. 2021a. What Makes a “Bad” Ad? User Perceptions of Problematic Online Advertising. In Proceedings of the 2021 CHI Conference on Human Factors in Computing Systems (Yokohama, Japan) (CHI ’21). Association for Computing Machinery, New York, NY, USA, Article 361, 24 pages. doi:10.1145/3411764.3445459
- Zeng et al. (2021b) Eric Zeng, Miranda Wei, Theo Gregersen, Tadayoshi Kohno, and Franziska Roesner. 2021b. Polls, clickbait, and commemorative $2 bills: problematic political advertising on news and media websites around the 2020 U.S. elections. In Proceedings of the 21st ACM Internet Measurement Conference (Virtual Event) (IMC ’21). Association for Computing Machinery, New York, NY, USA, 507–525. doi:10.1145/3487552.3487850
- Zeng et al. (2025) Eric Zeng, Xiaoyuan Wu, Emily N Ertmann, Lily Huang, Danielle F Johnson, Anusha T Mehendale, Brandon T Tang, Karolina Zhukoff, Michael Adjei-Poku, Lujo Bauer, et al. 2025. Measuring Risks to Users’ Health Privacy Posed by Third-Party Web Tracking and Targeted Advertising. In Proceedings of the 2025 CHI Conference on Human Factors in Computing Systems. 1–26.
- Zhang et al. (2025) Zhehao Zhang, Ryan A. Rossi, Branislav Kveton, Yijia Shao, Diyi Yang, Hamed Zamani, Franck Dernoncourt, Joe Barrow, Tong Yu, Sungchul Kim, Ruiyi Zhang, Jiuxiang Gu, Tyler Derr, Hongjie Chen, Junda Wu, Xiang Chen, Zichao Wang, Subrata Mitra, Nedim Lipka, Nesreen K. Ahmed, and Yu Wang. 2025. Personalization of Large Language Models: A Survey. Transactions on Machine Learning Research (2025).
- Zhou et al. (2024) Joyce Zhou, Yijia Dai, and Thorsten Joachims. 2024. Language-based user profiles for recommendation. arXiv preprint arXiv:2402.15623 (2024).
Appendix A Statistics
Appendix B Analysis Visualizations
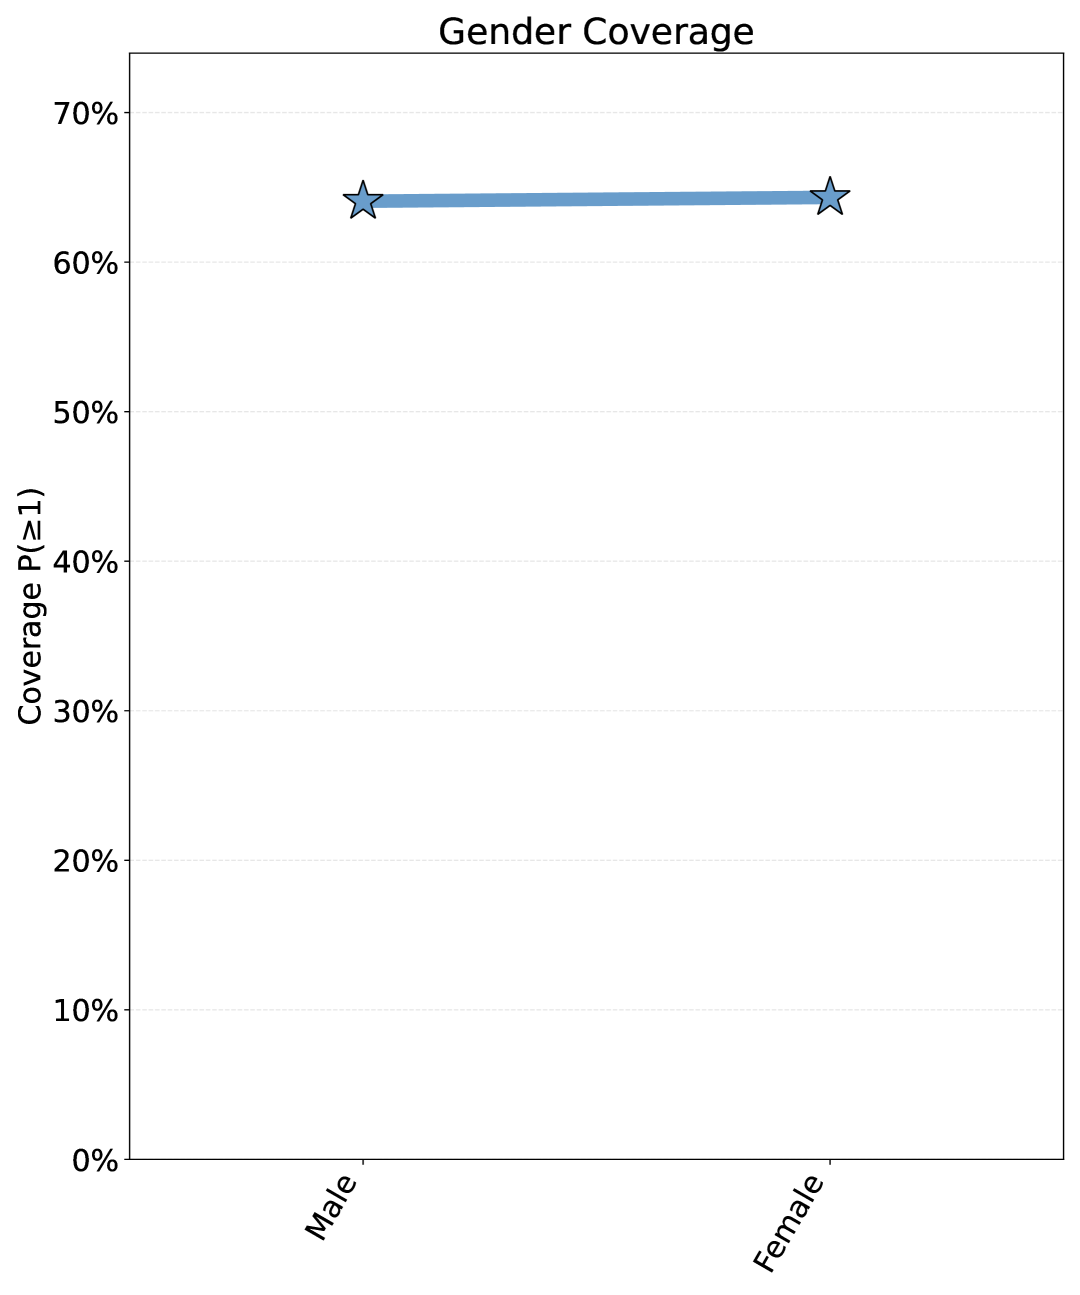
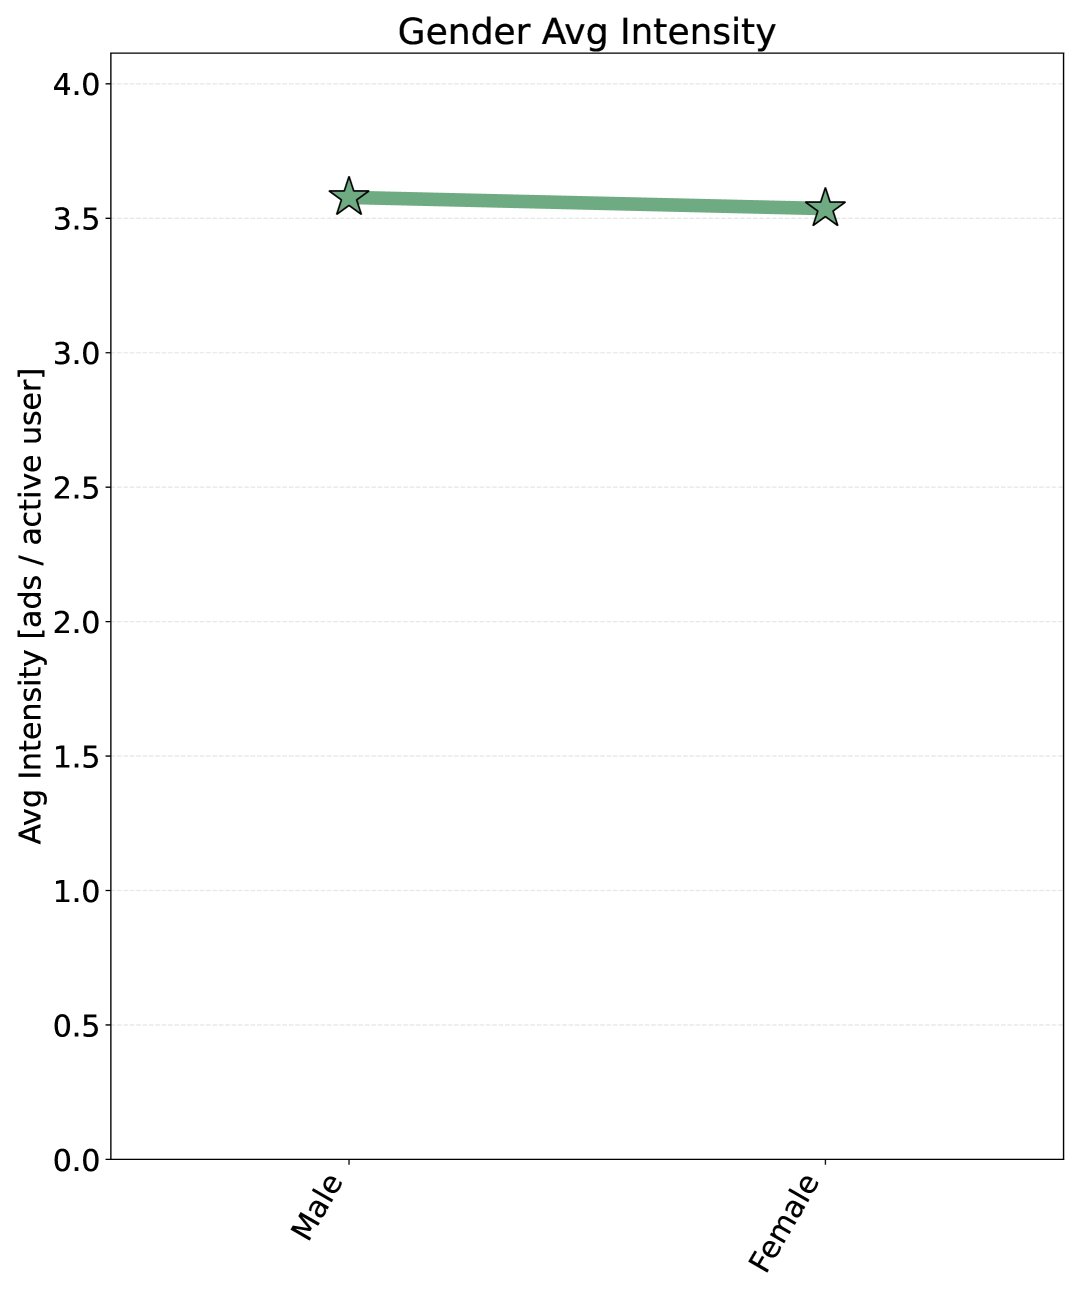
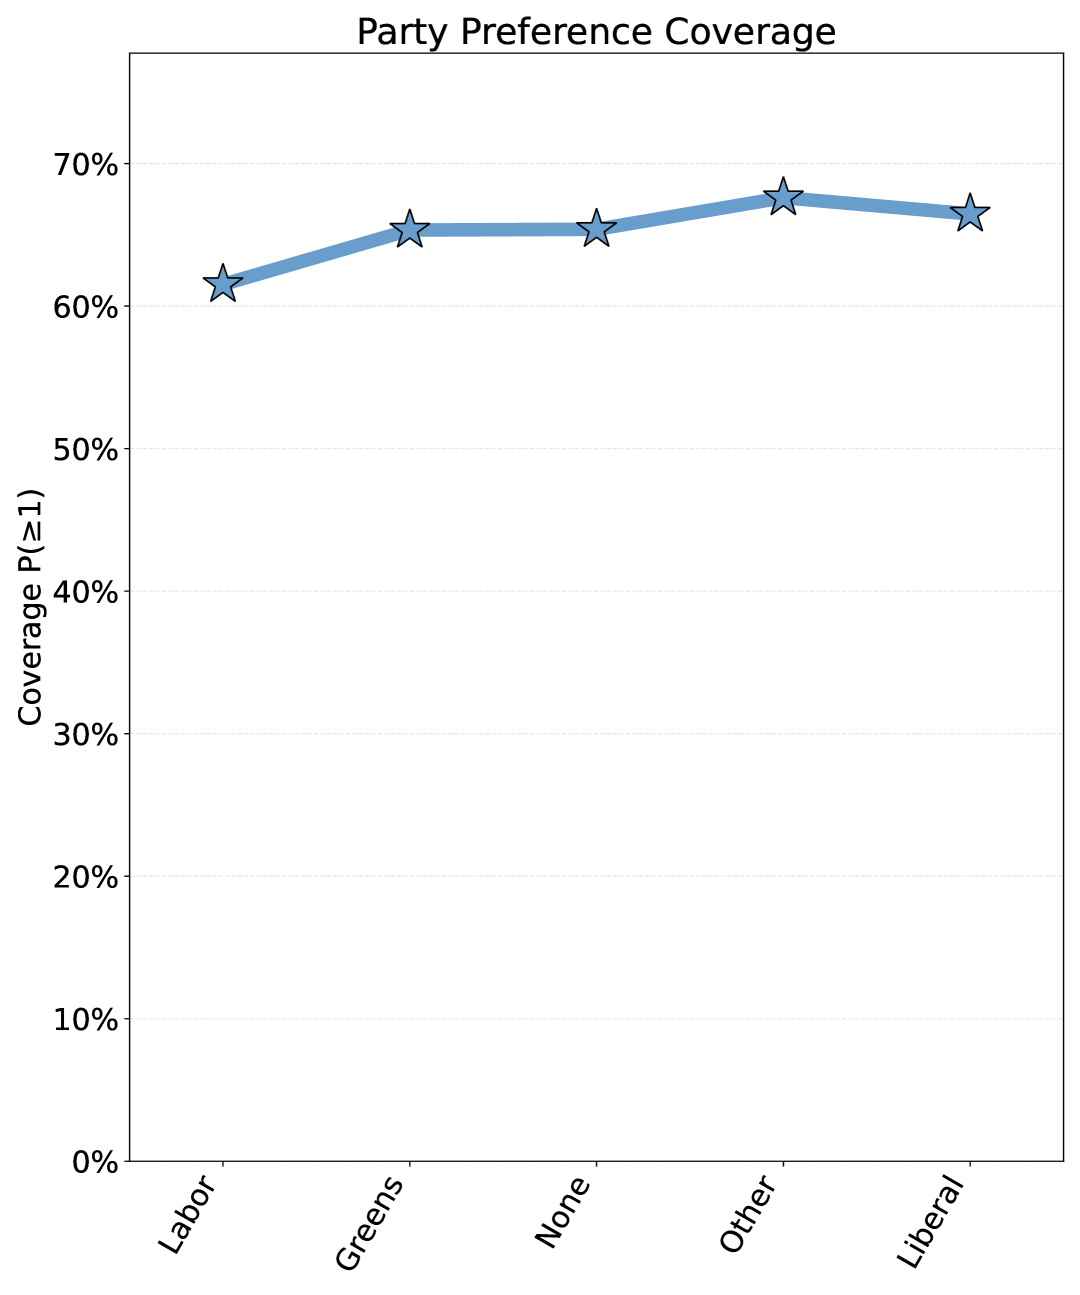
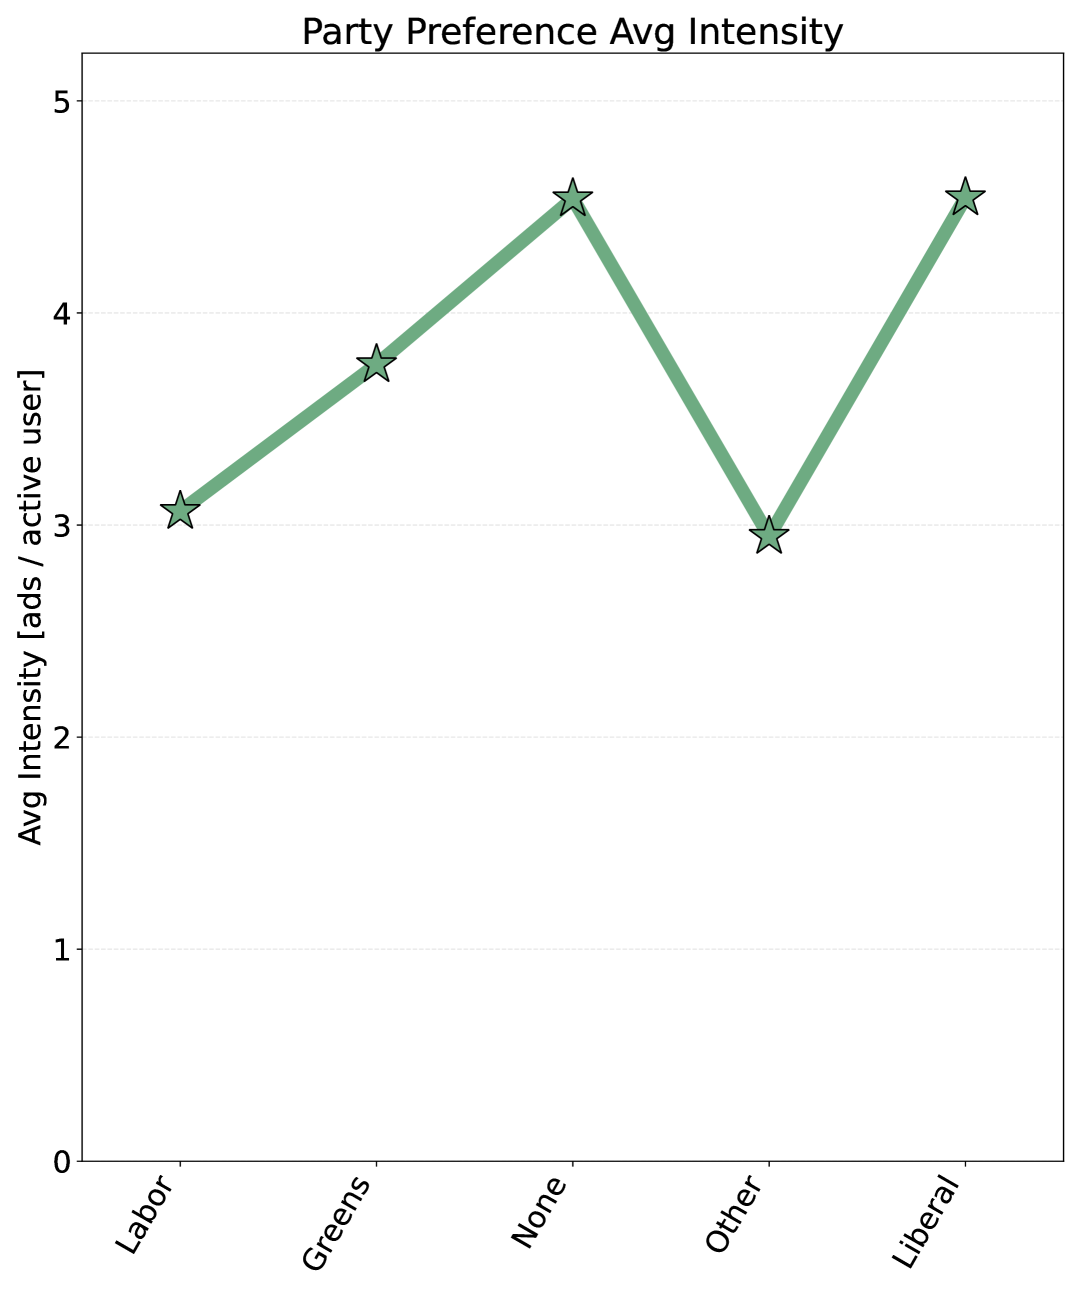
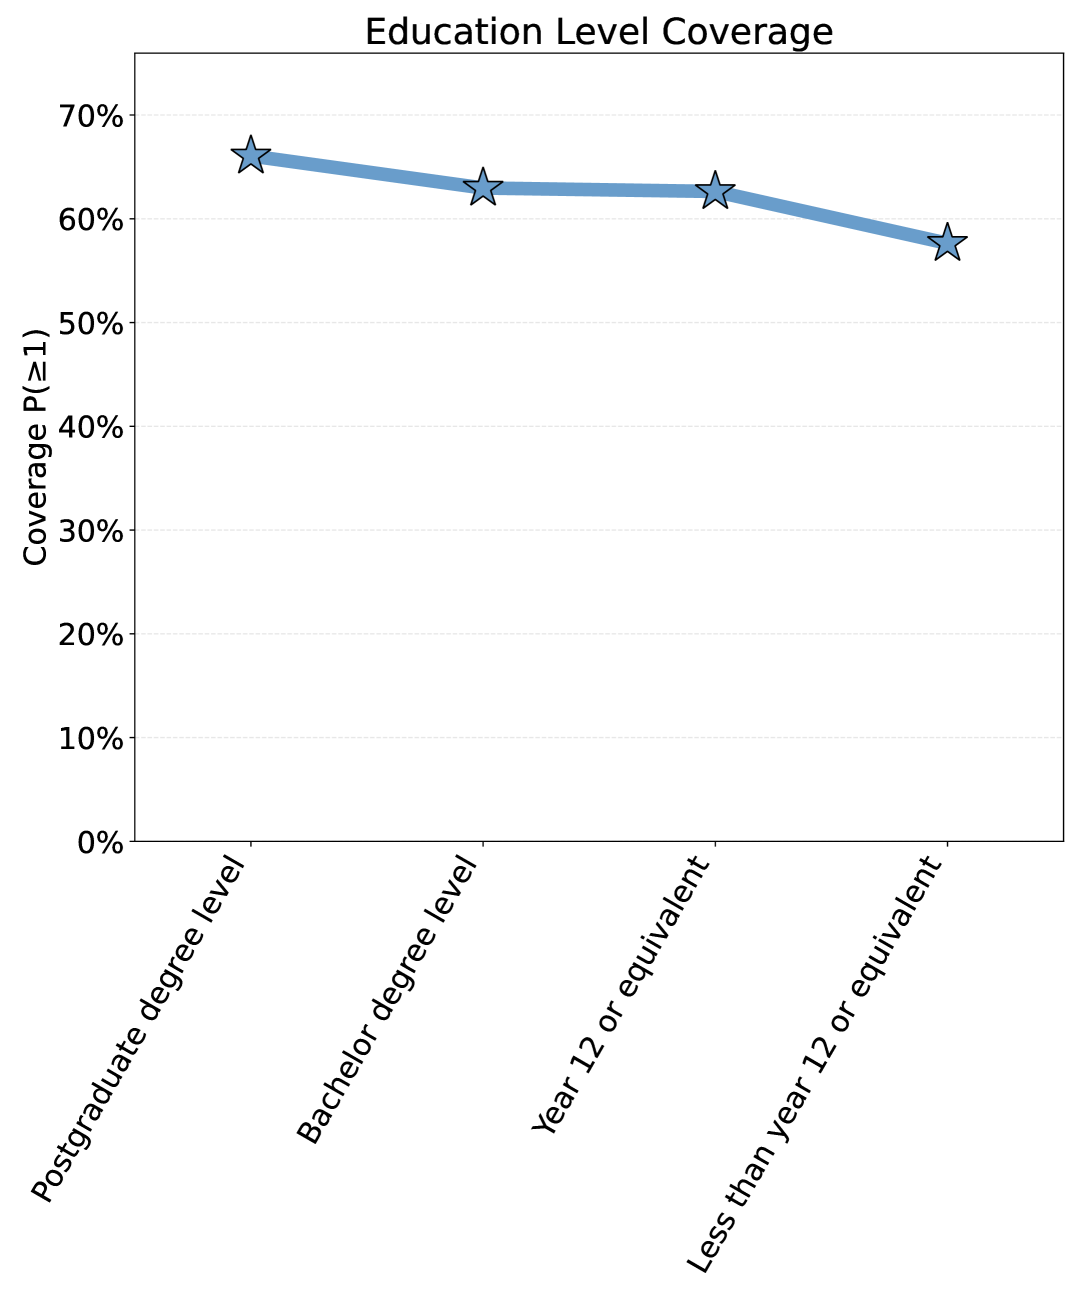
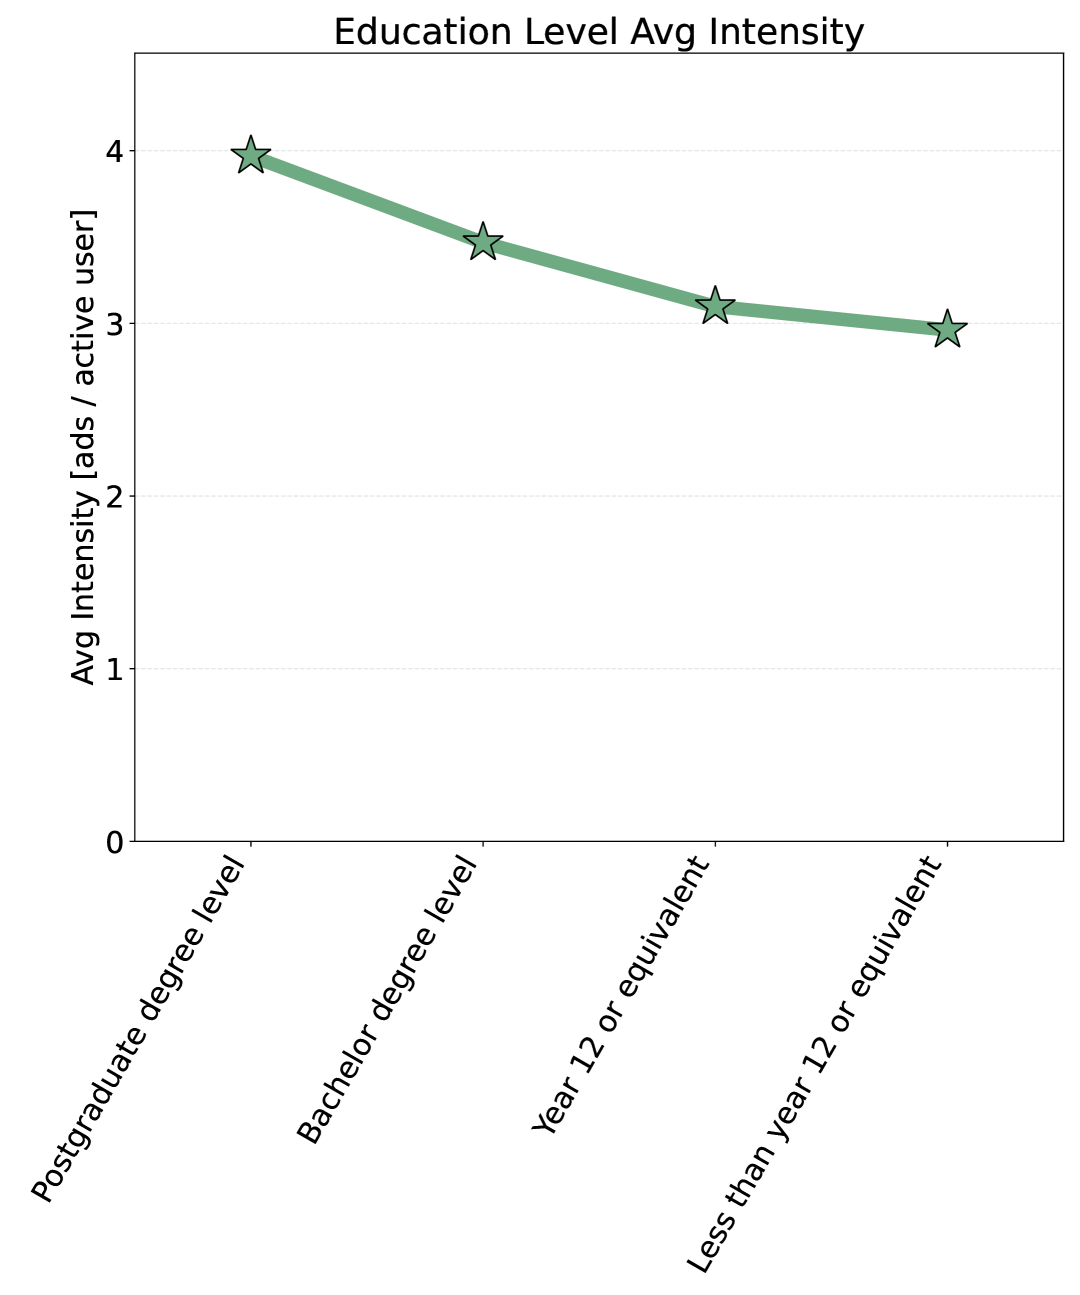
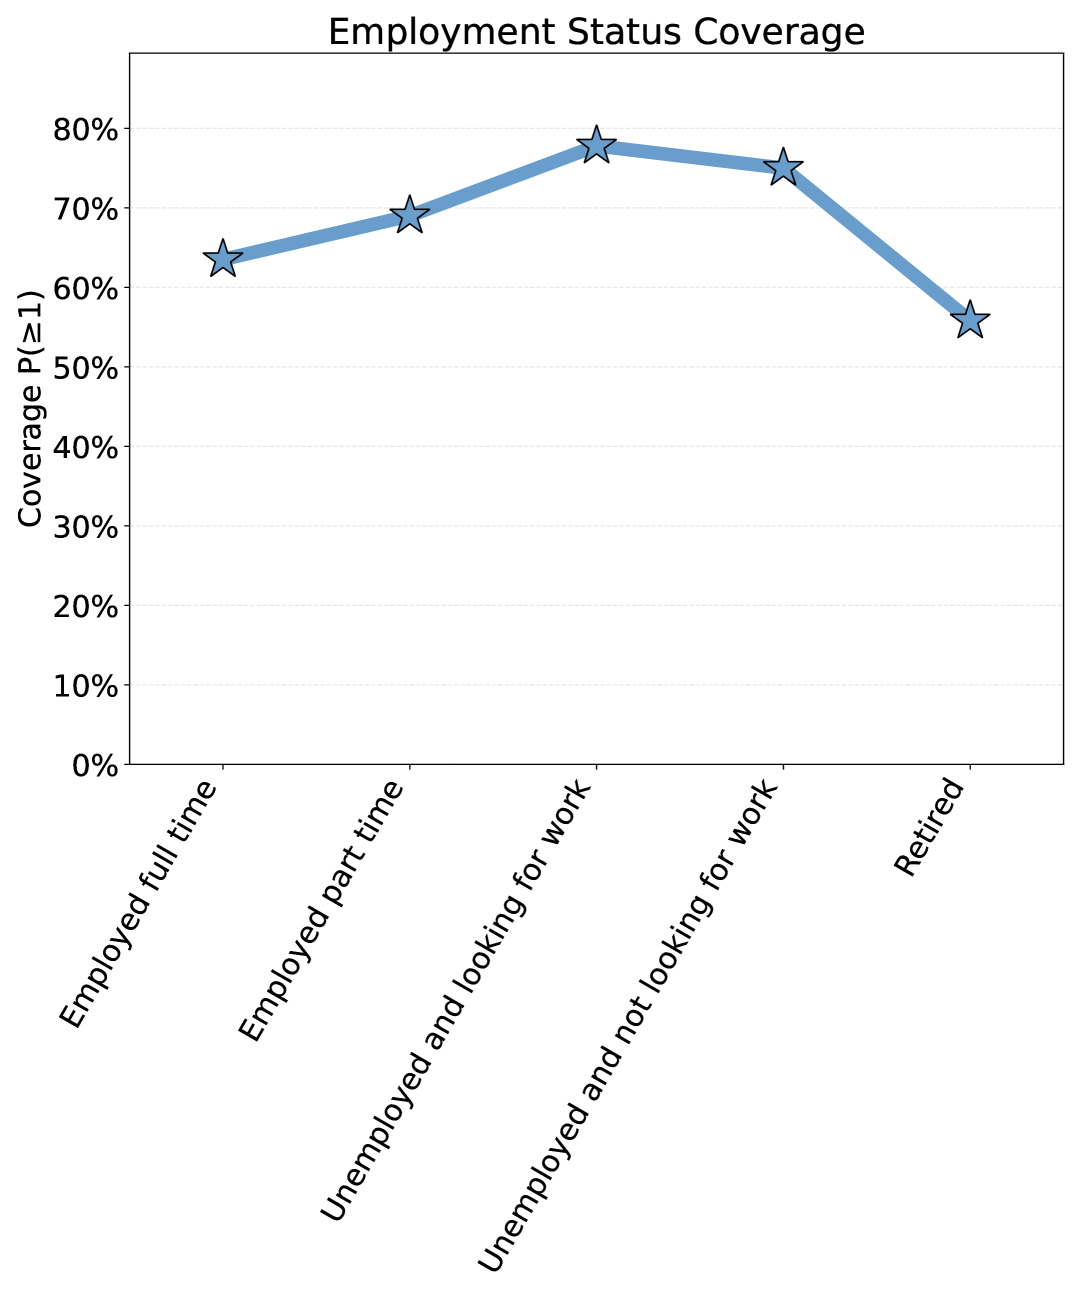
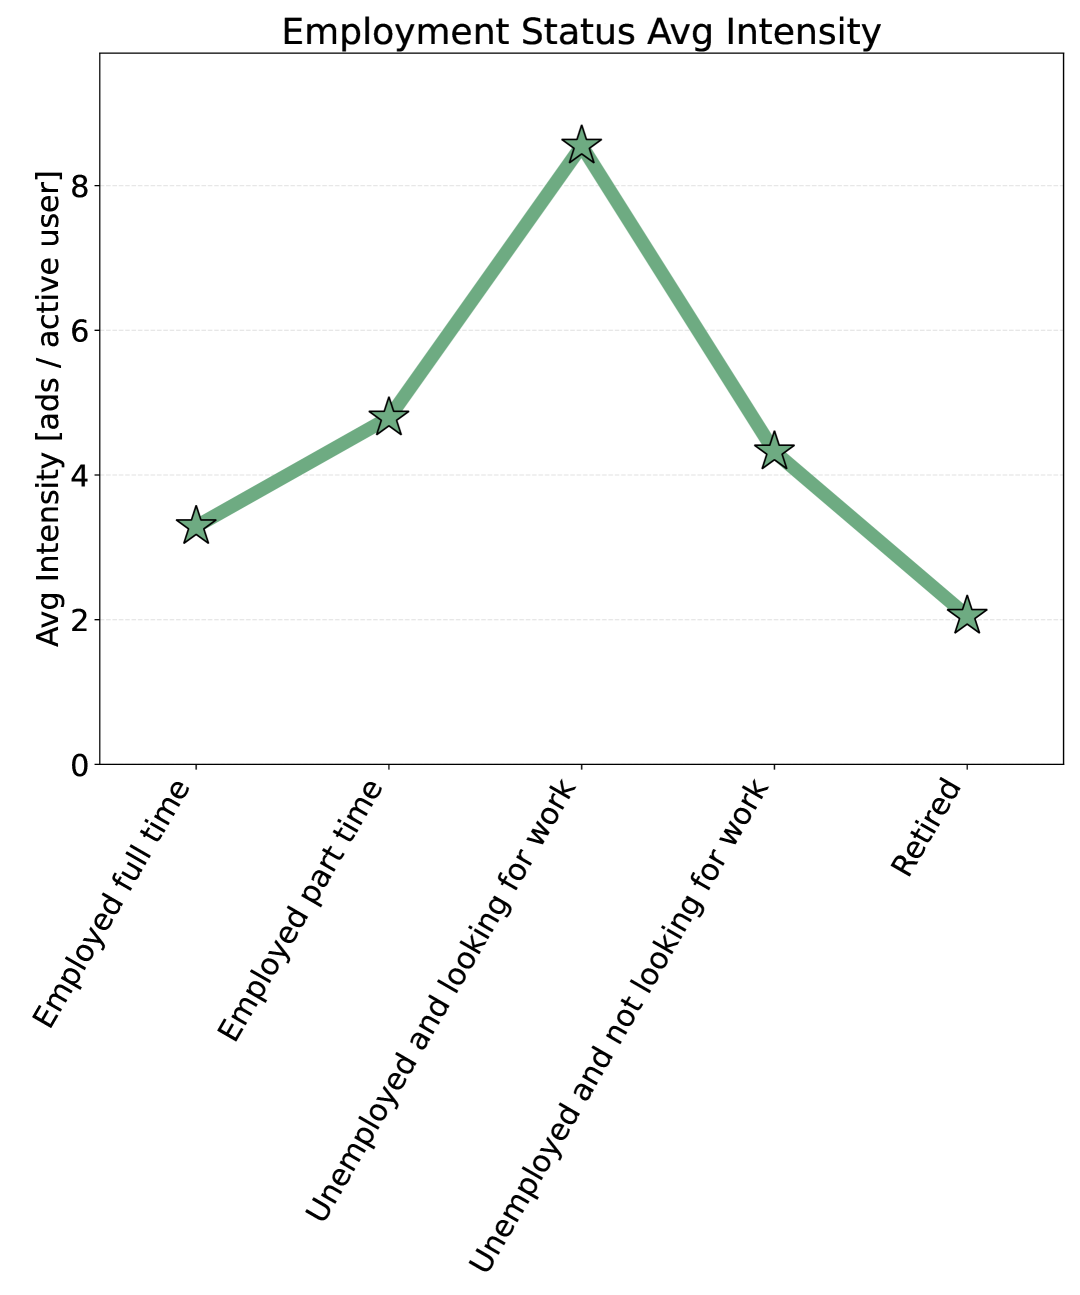
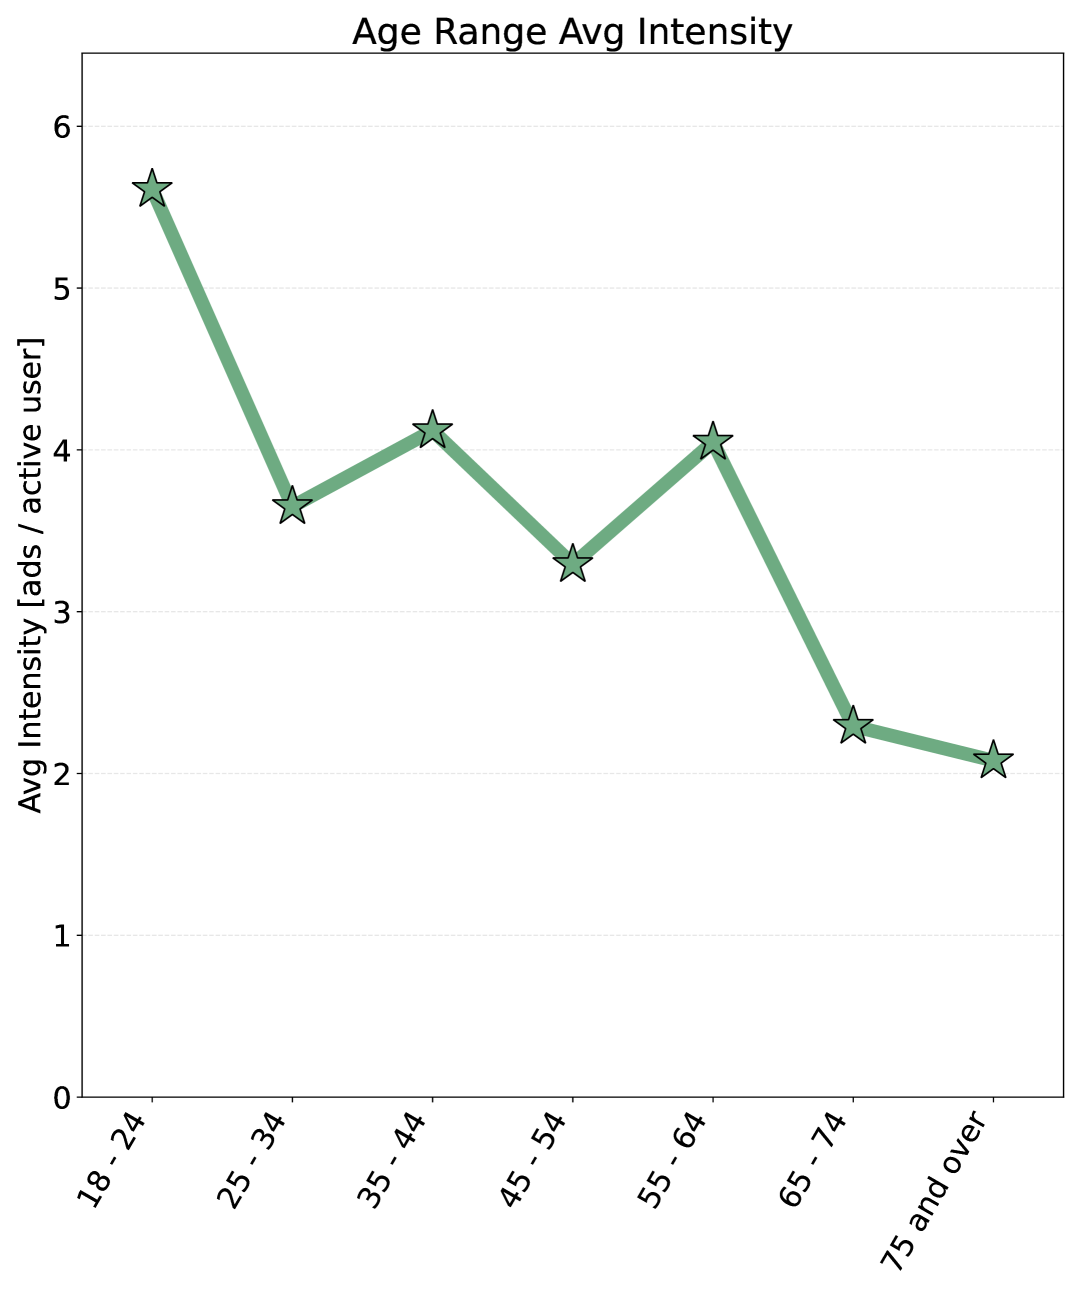
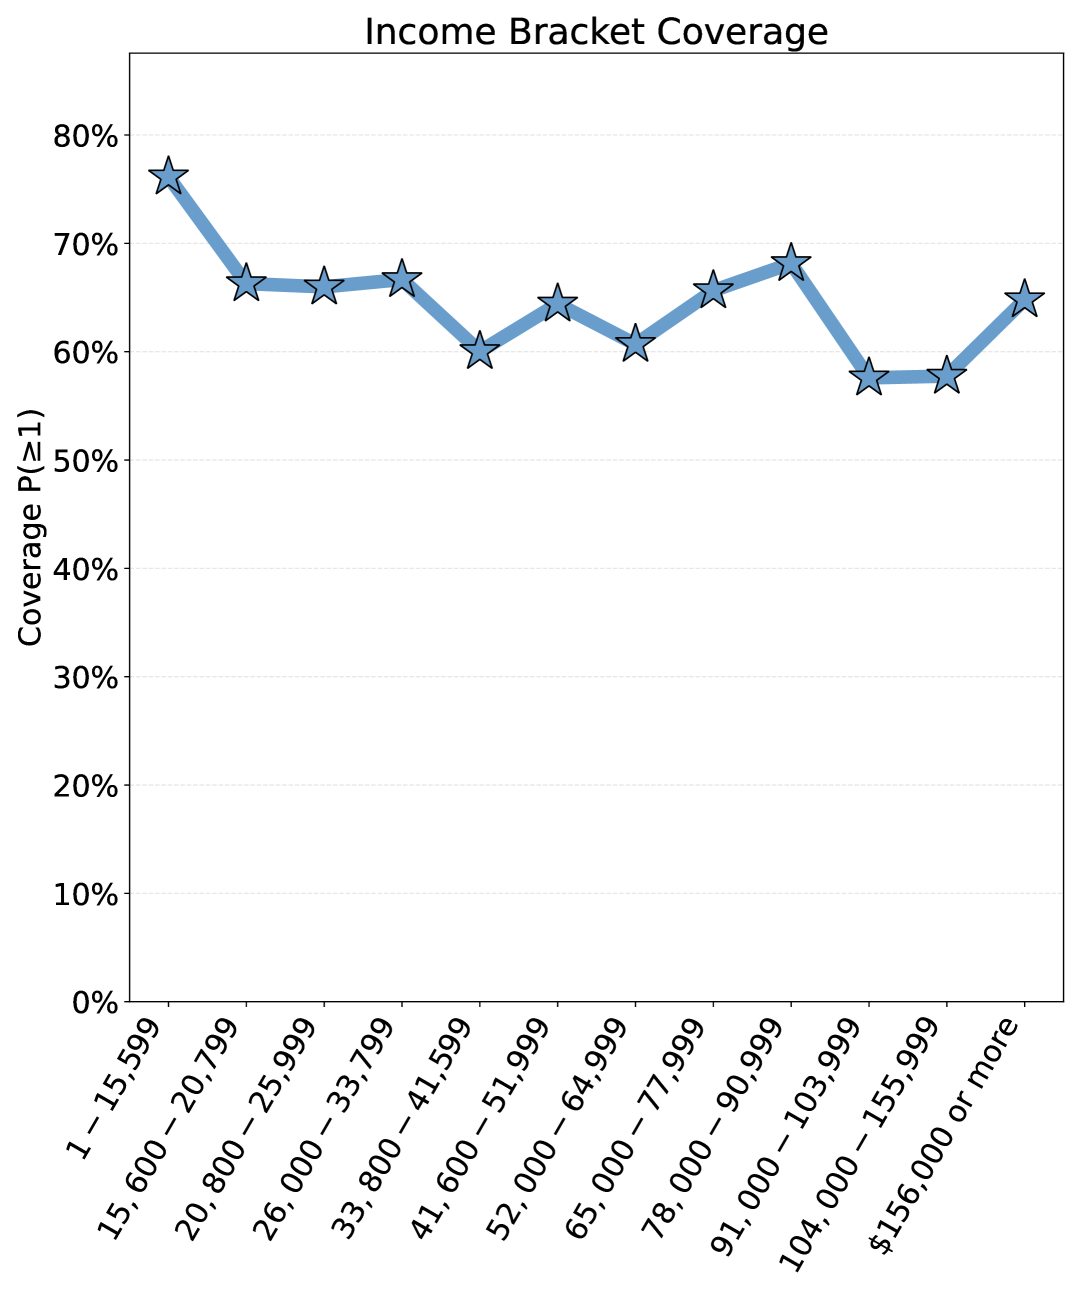
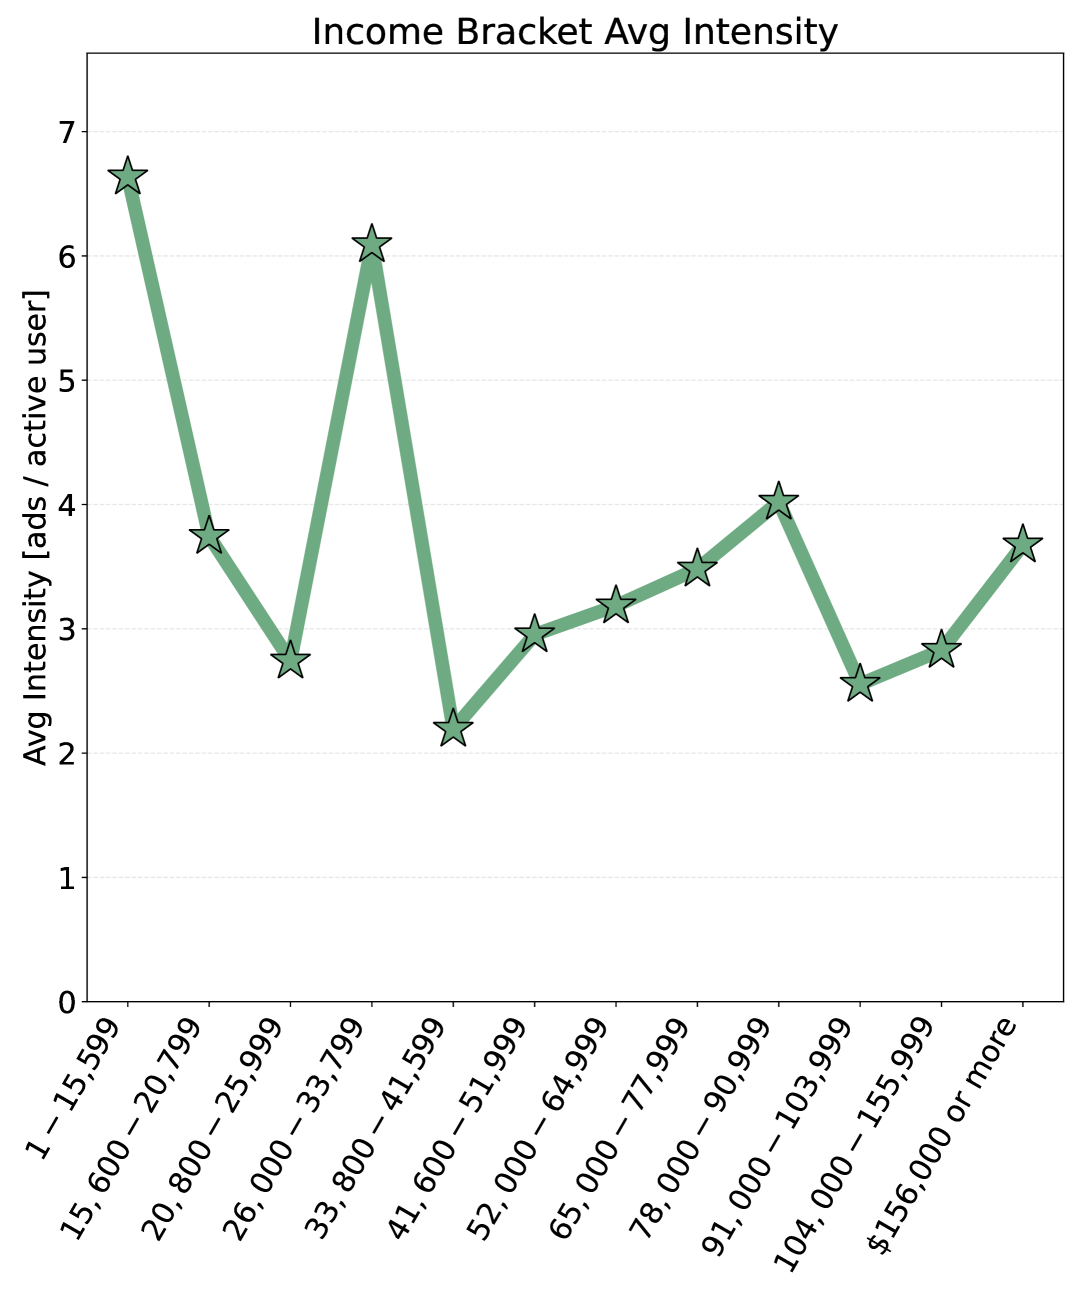
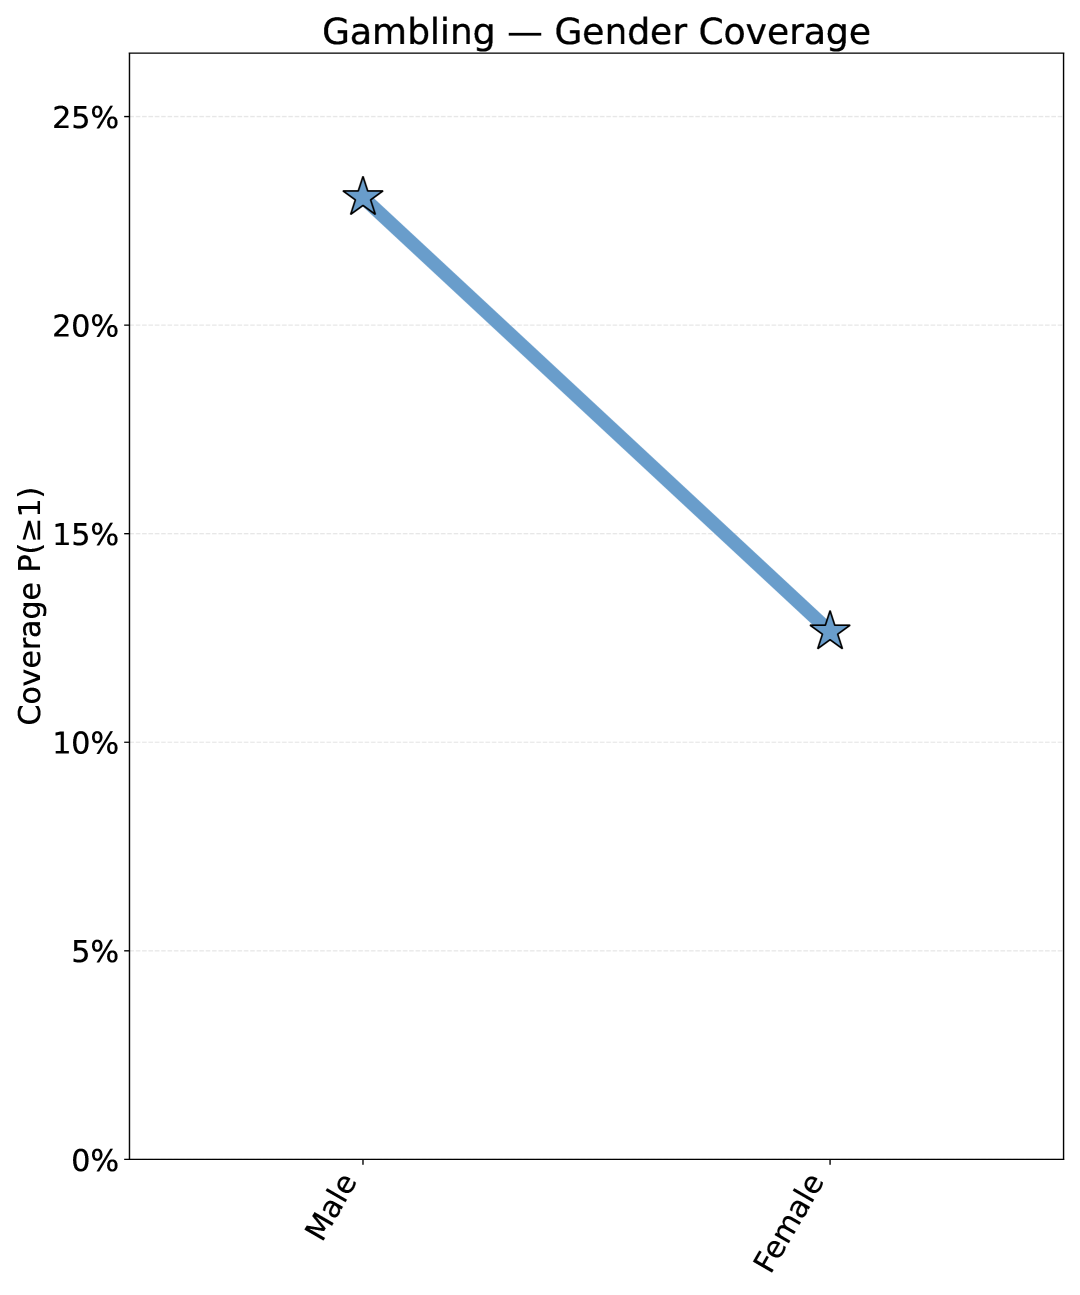
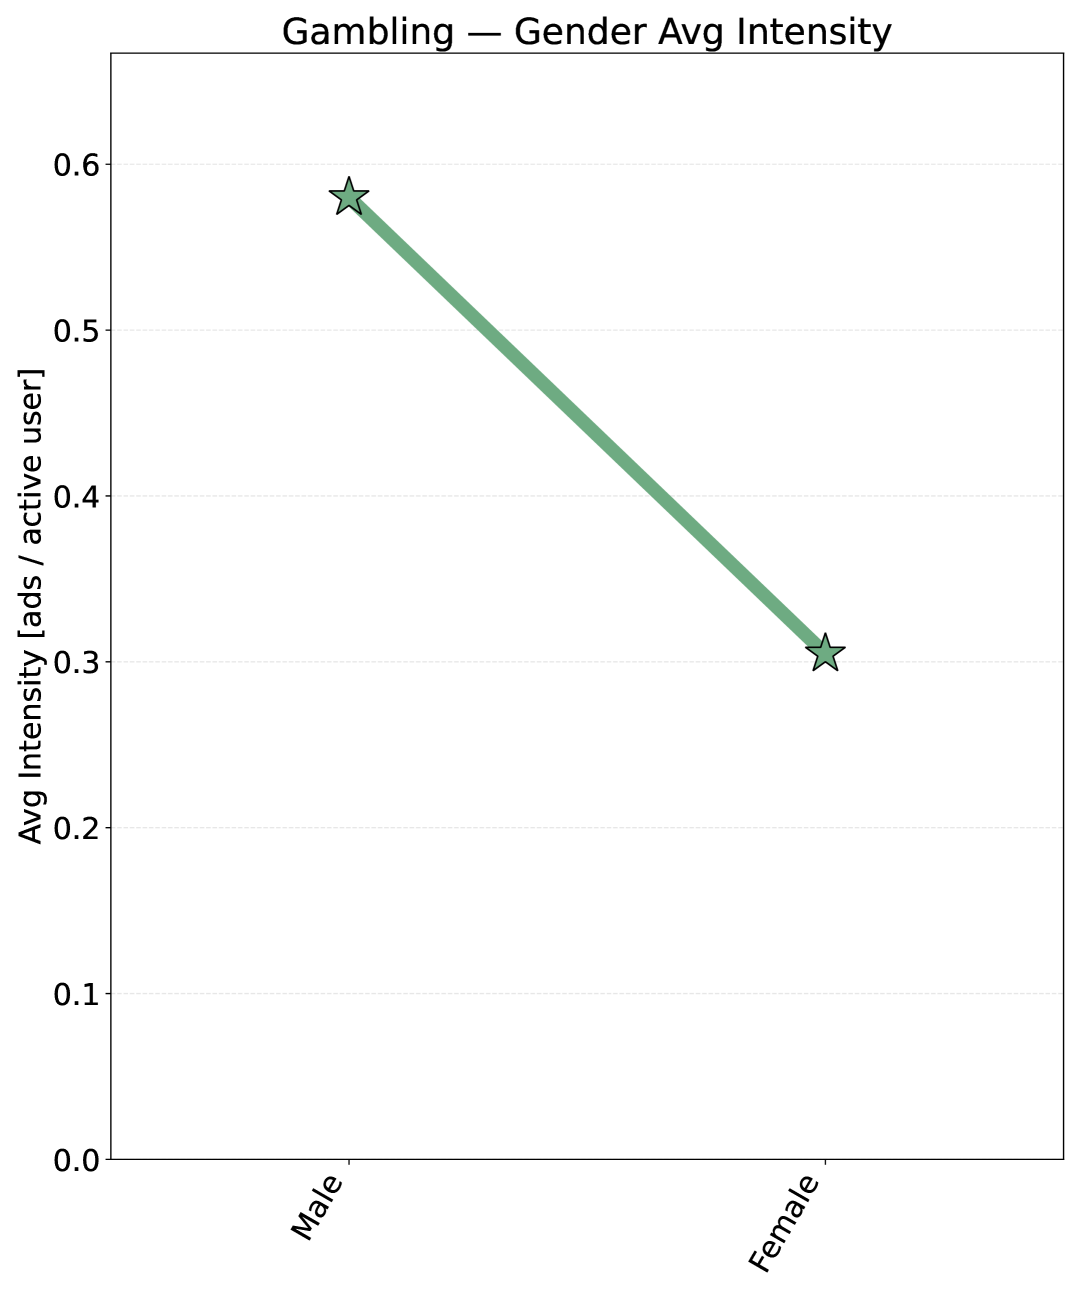
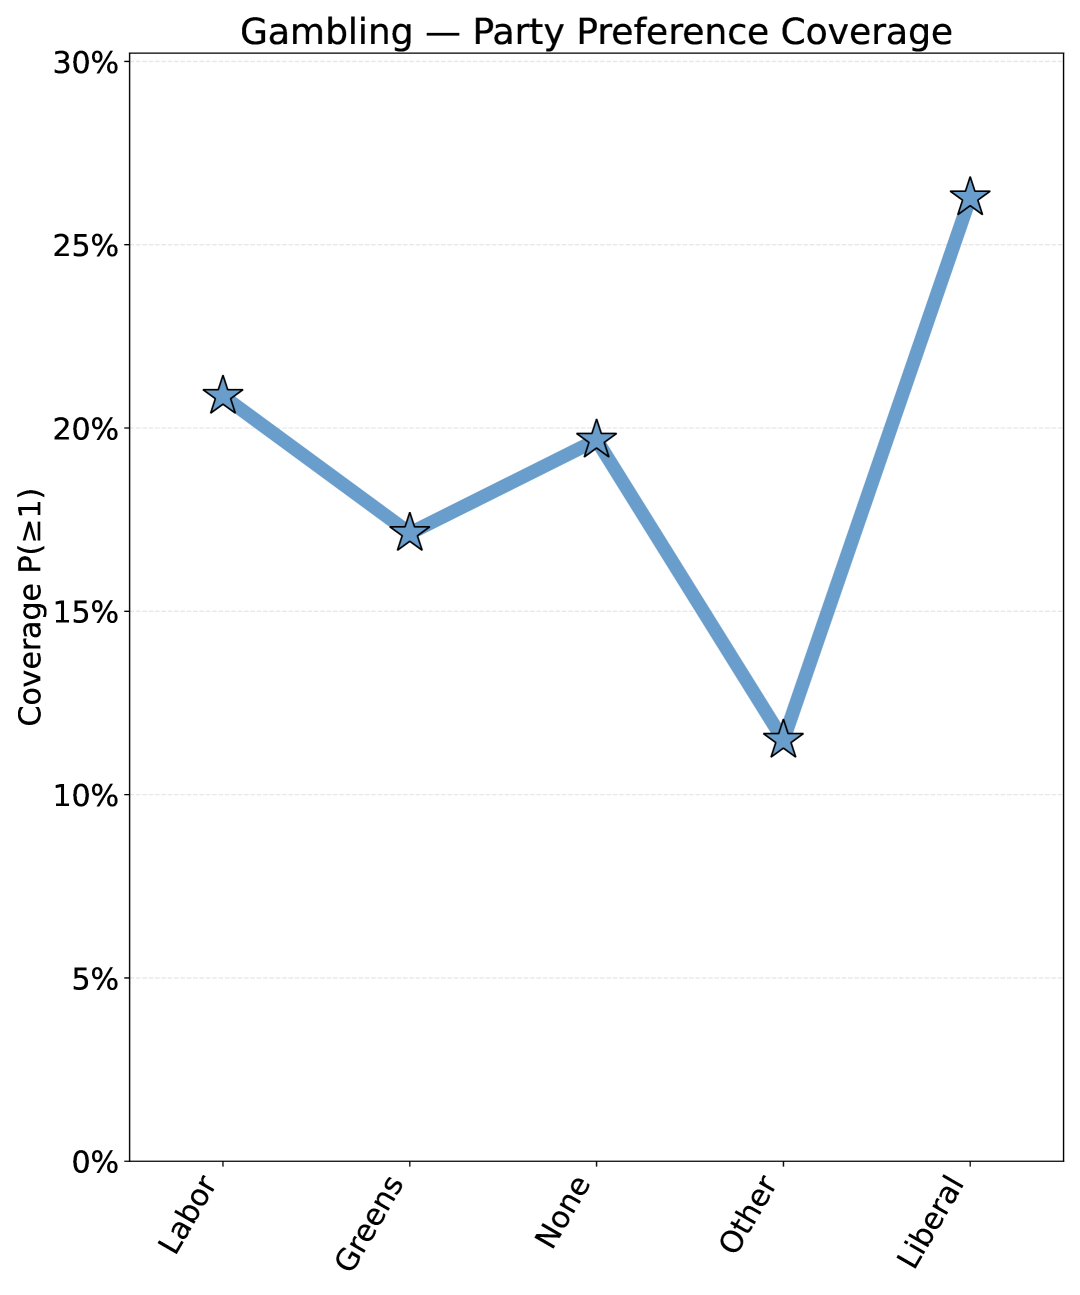
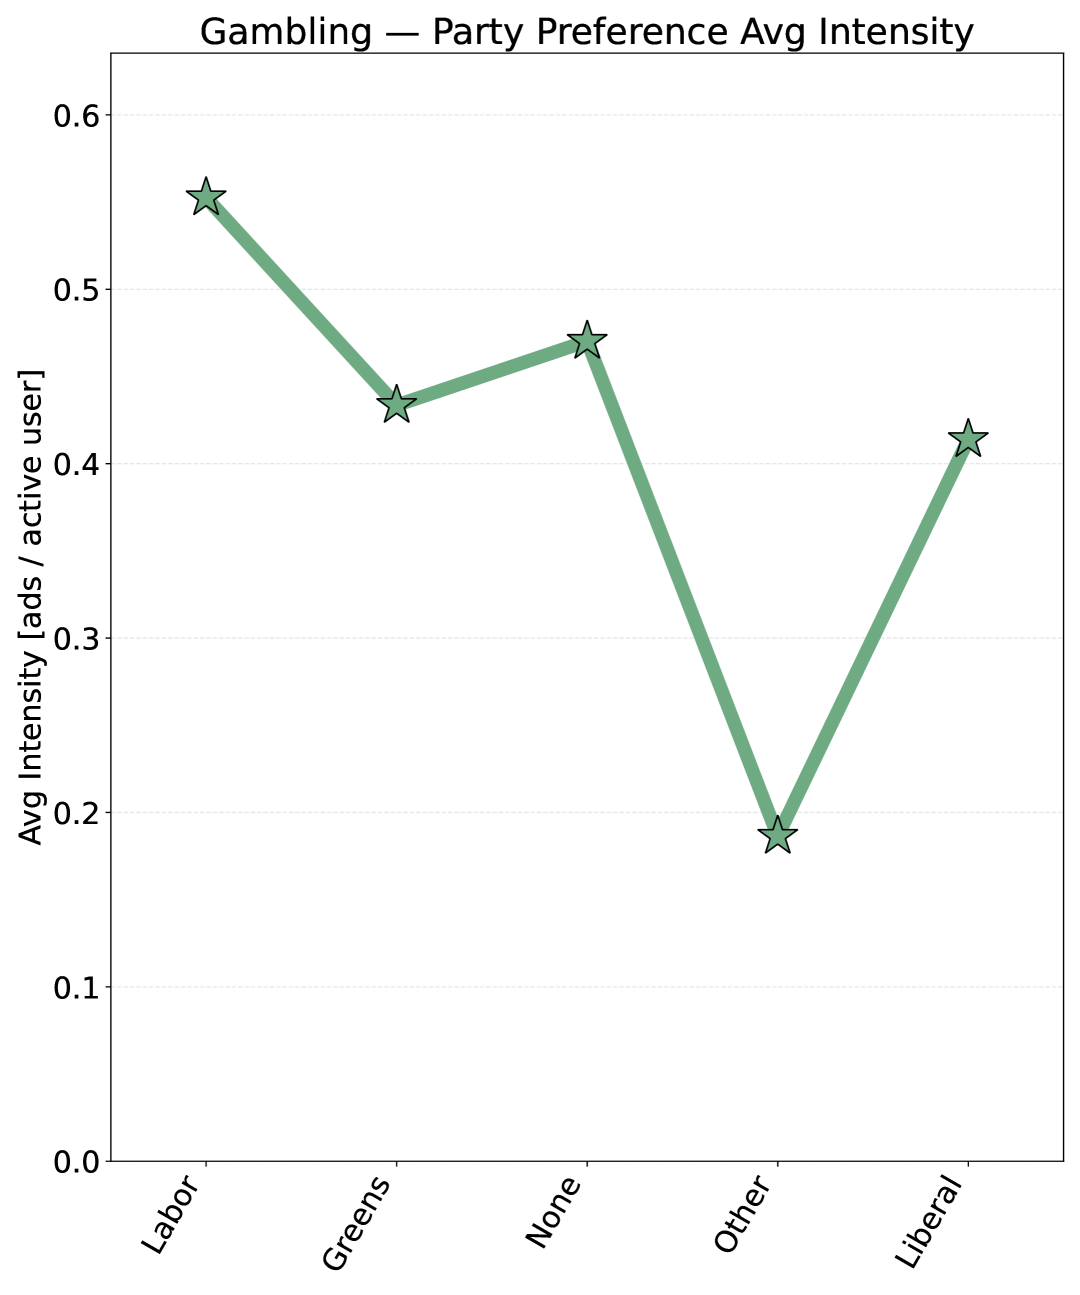
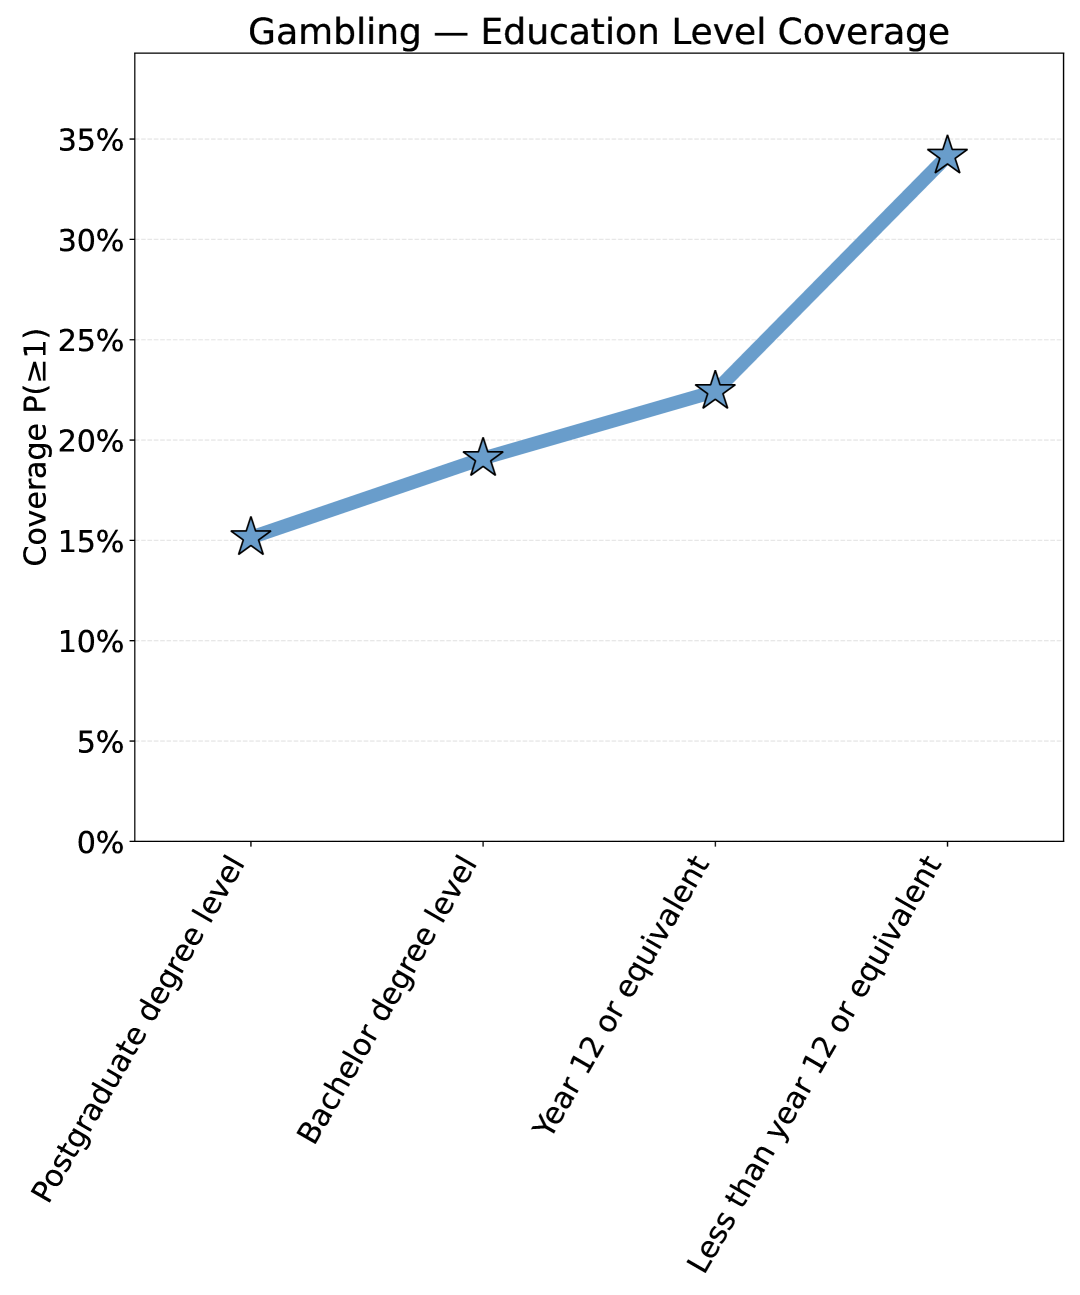
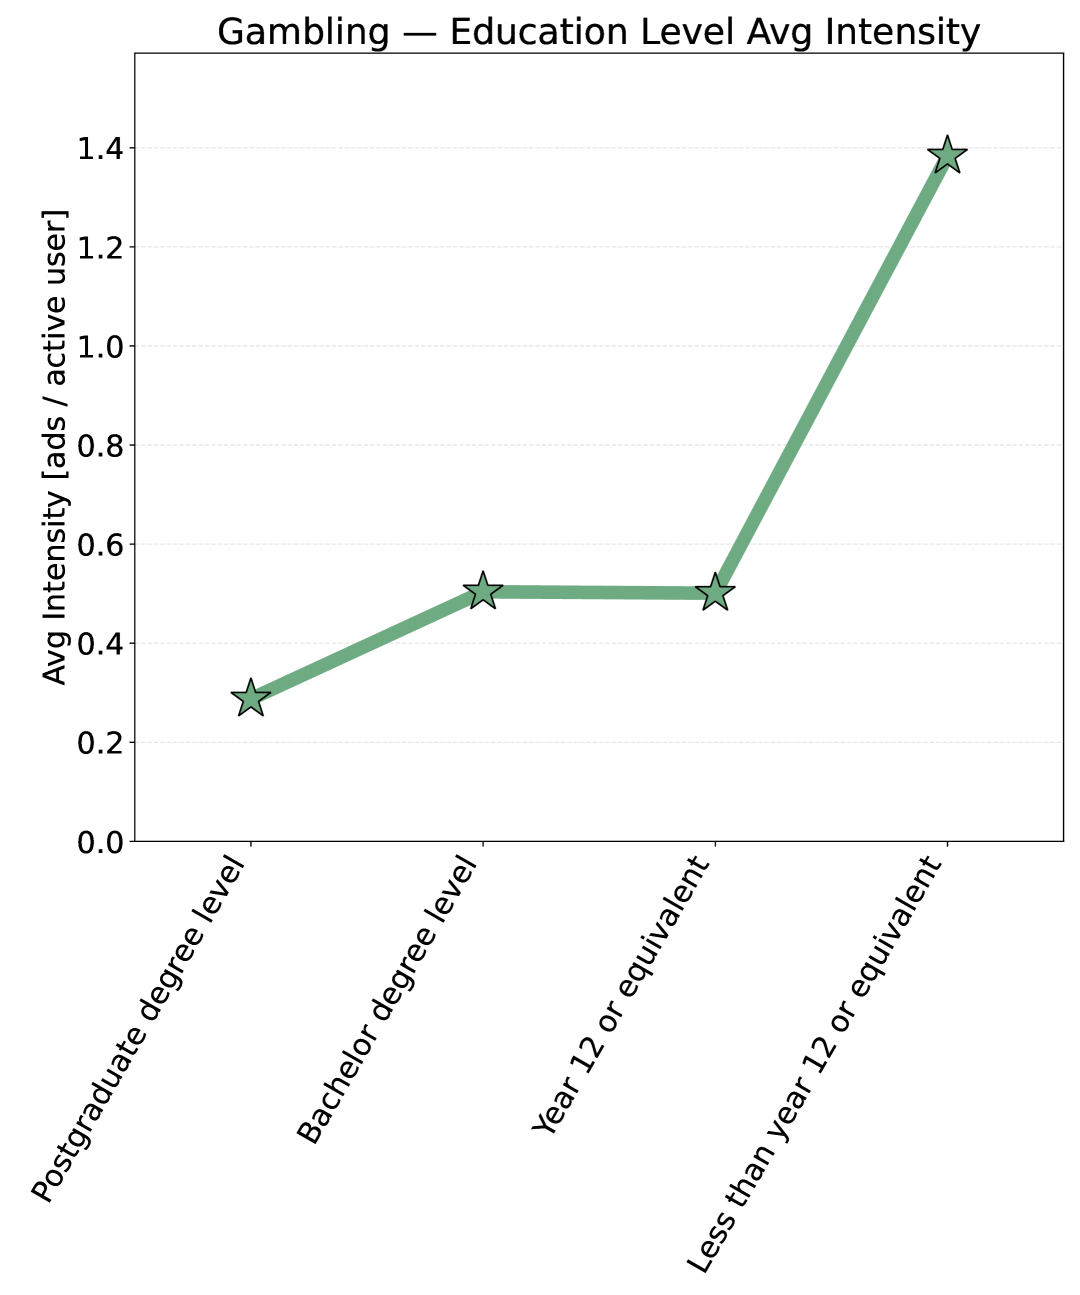
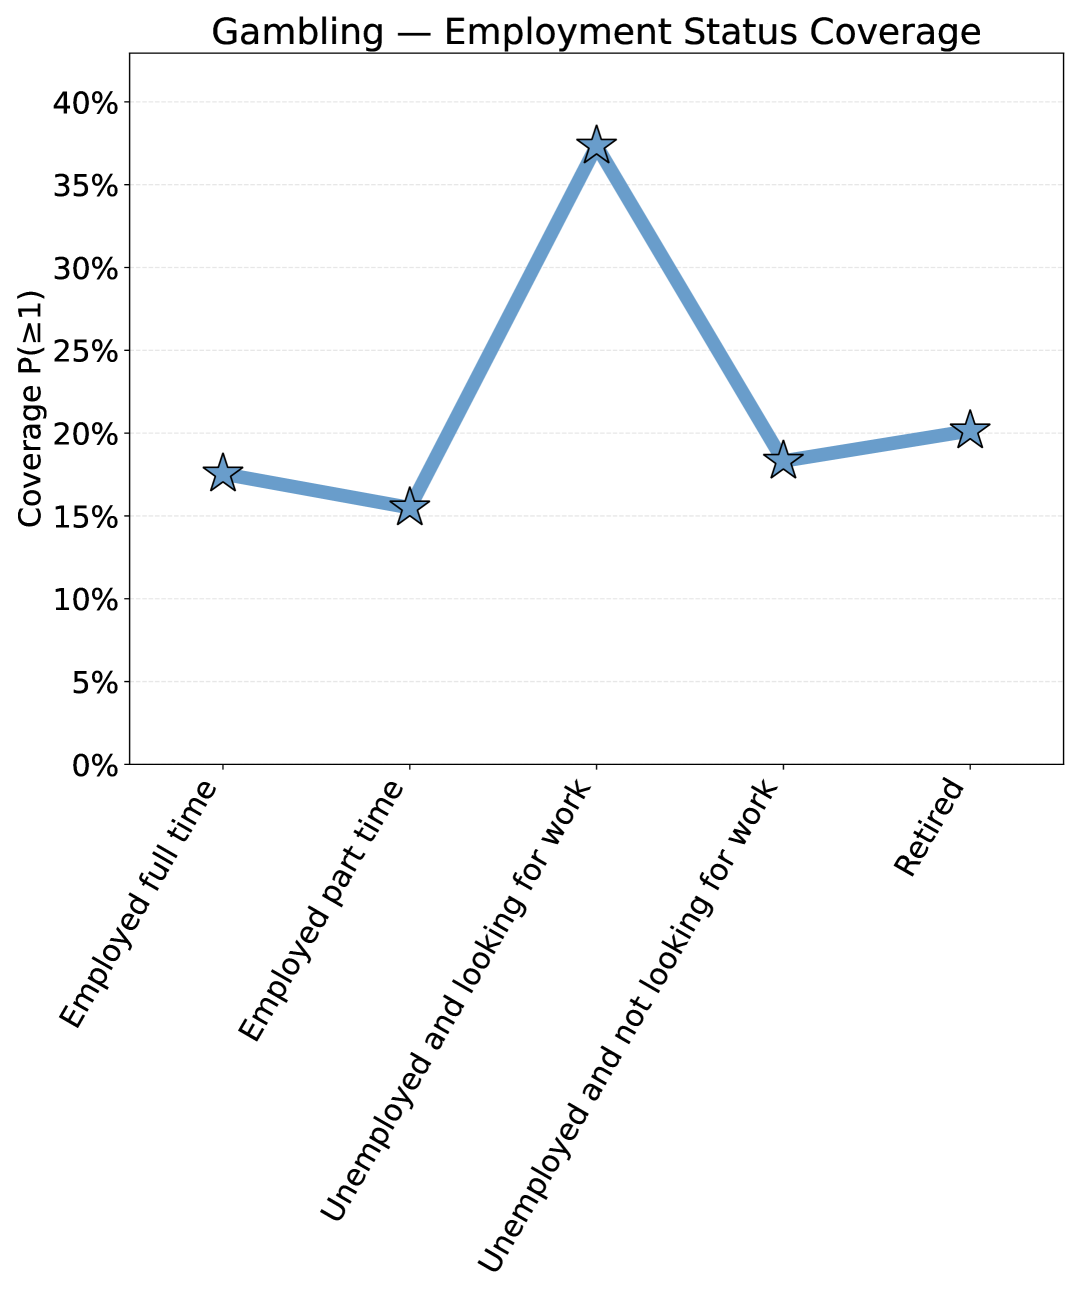
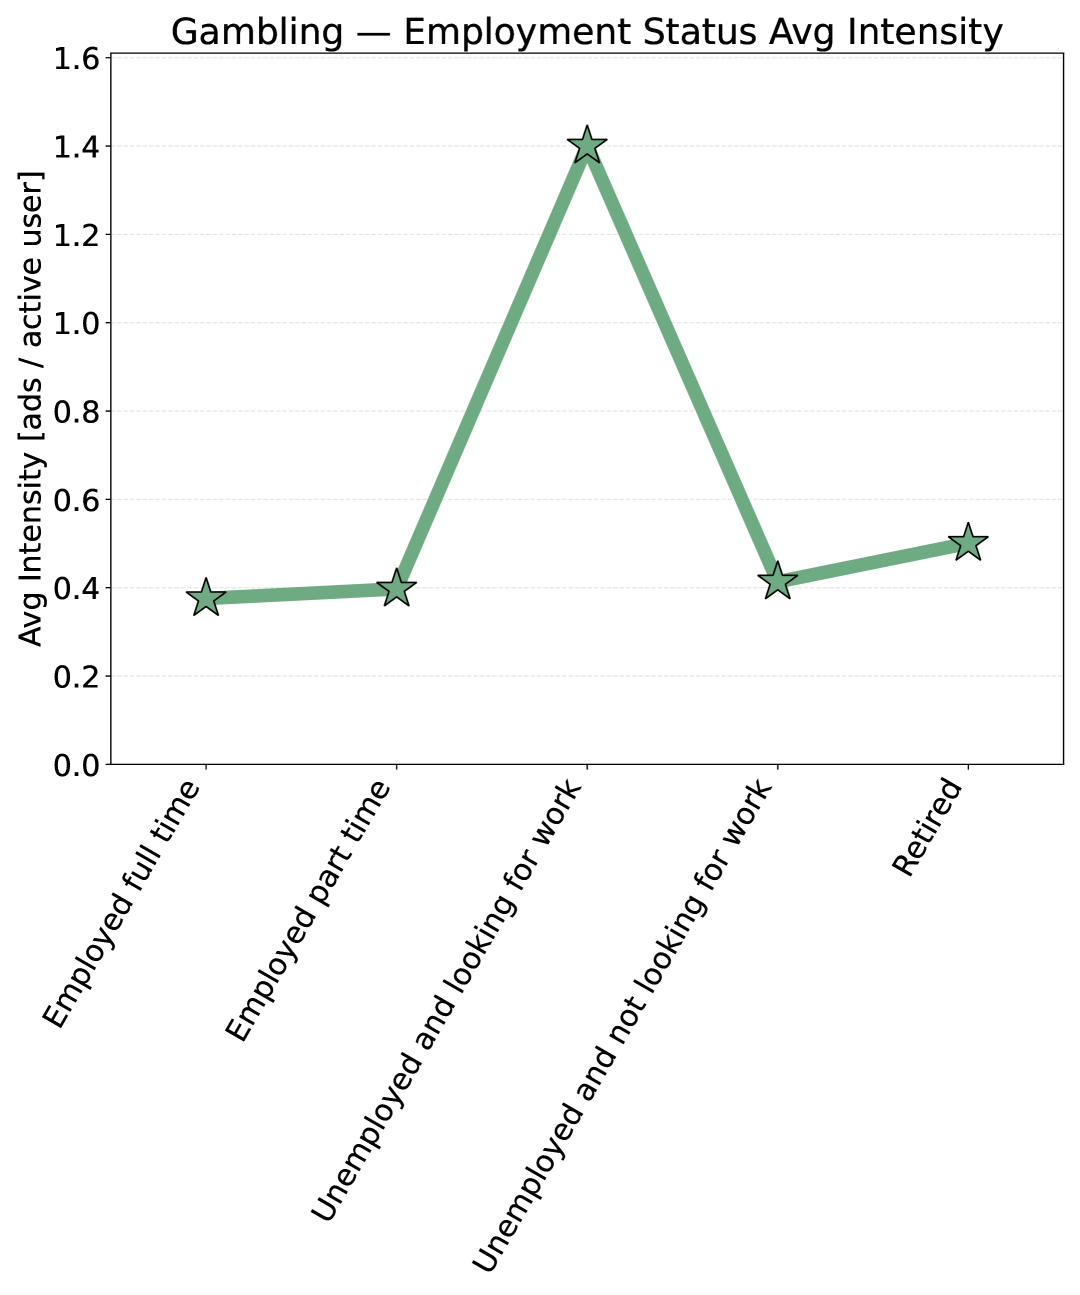
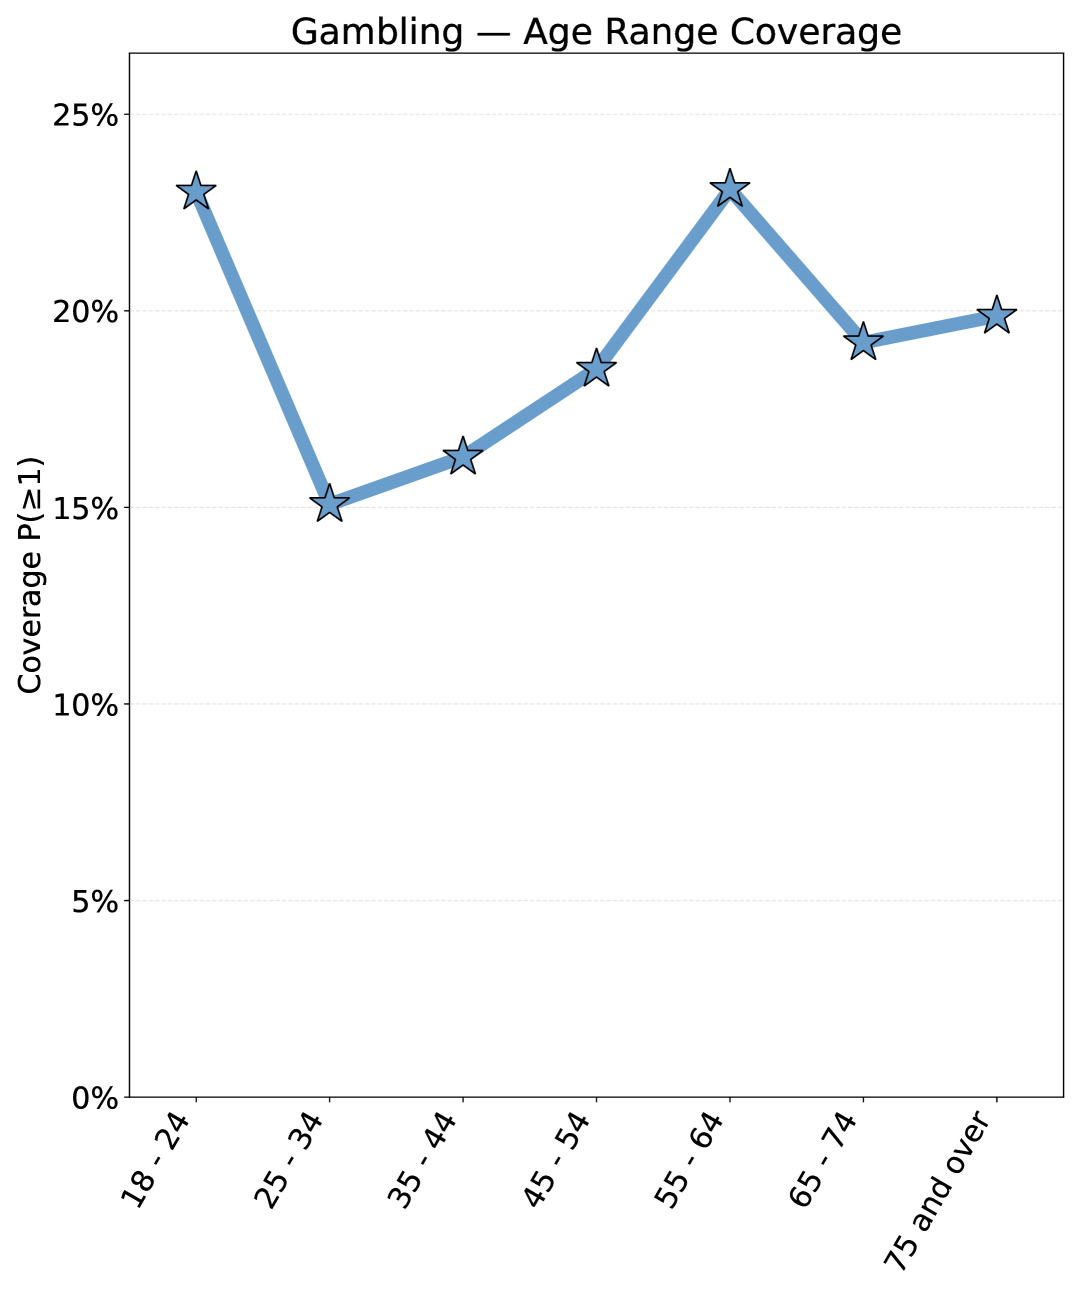
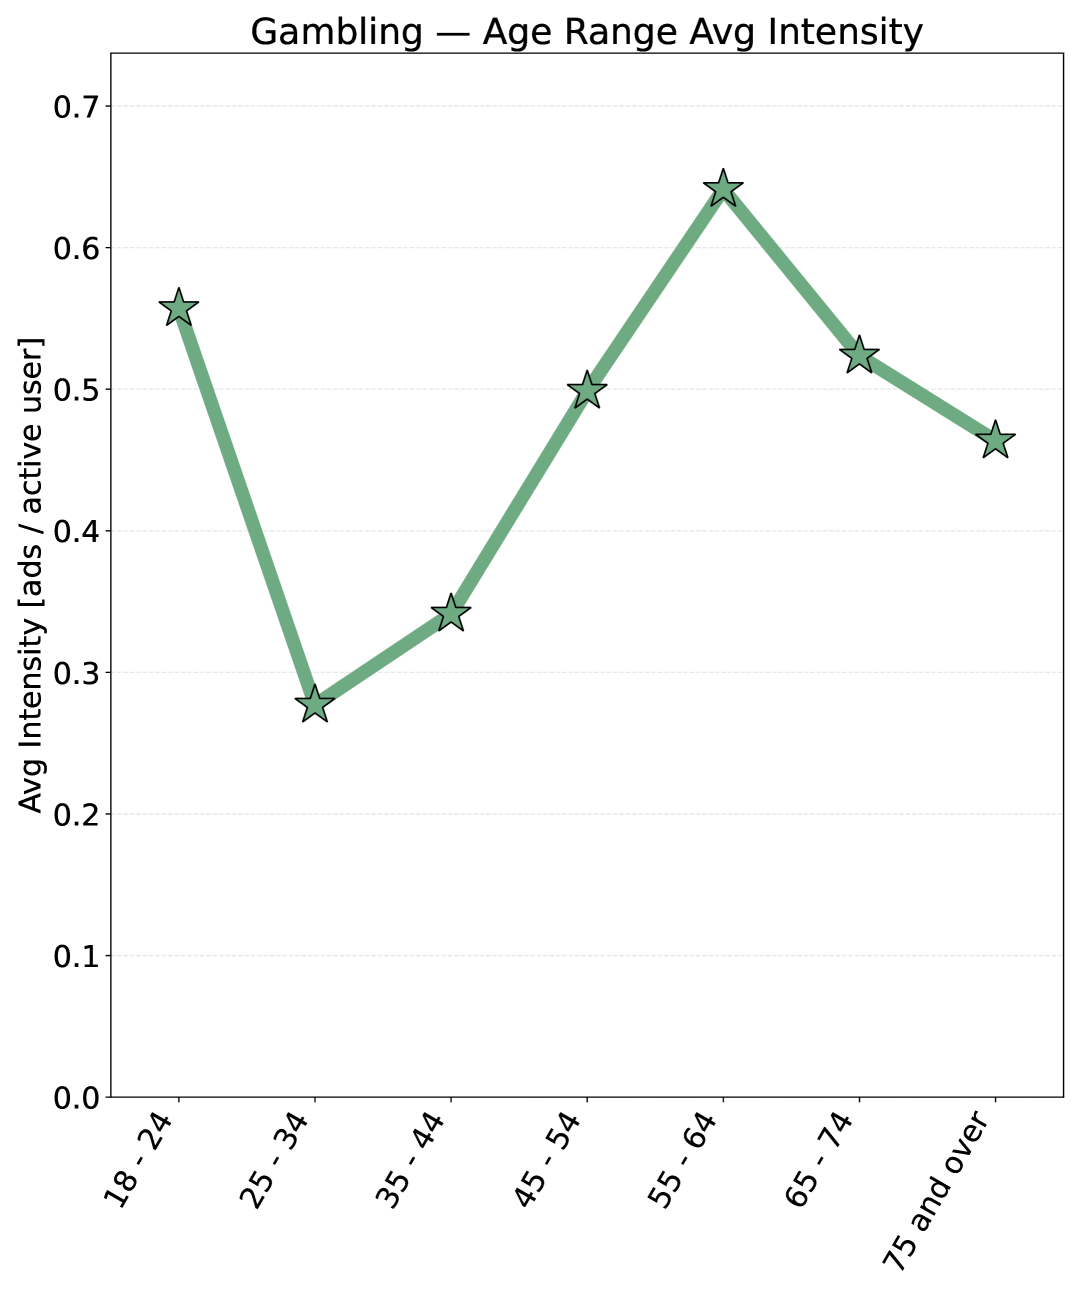
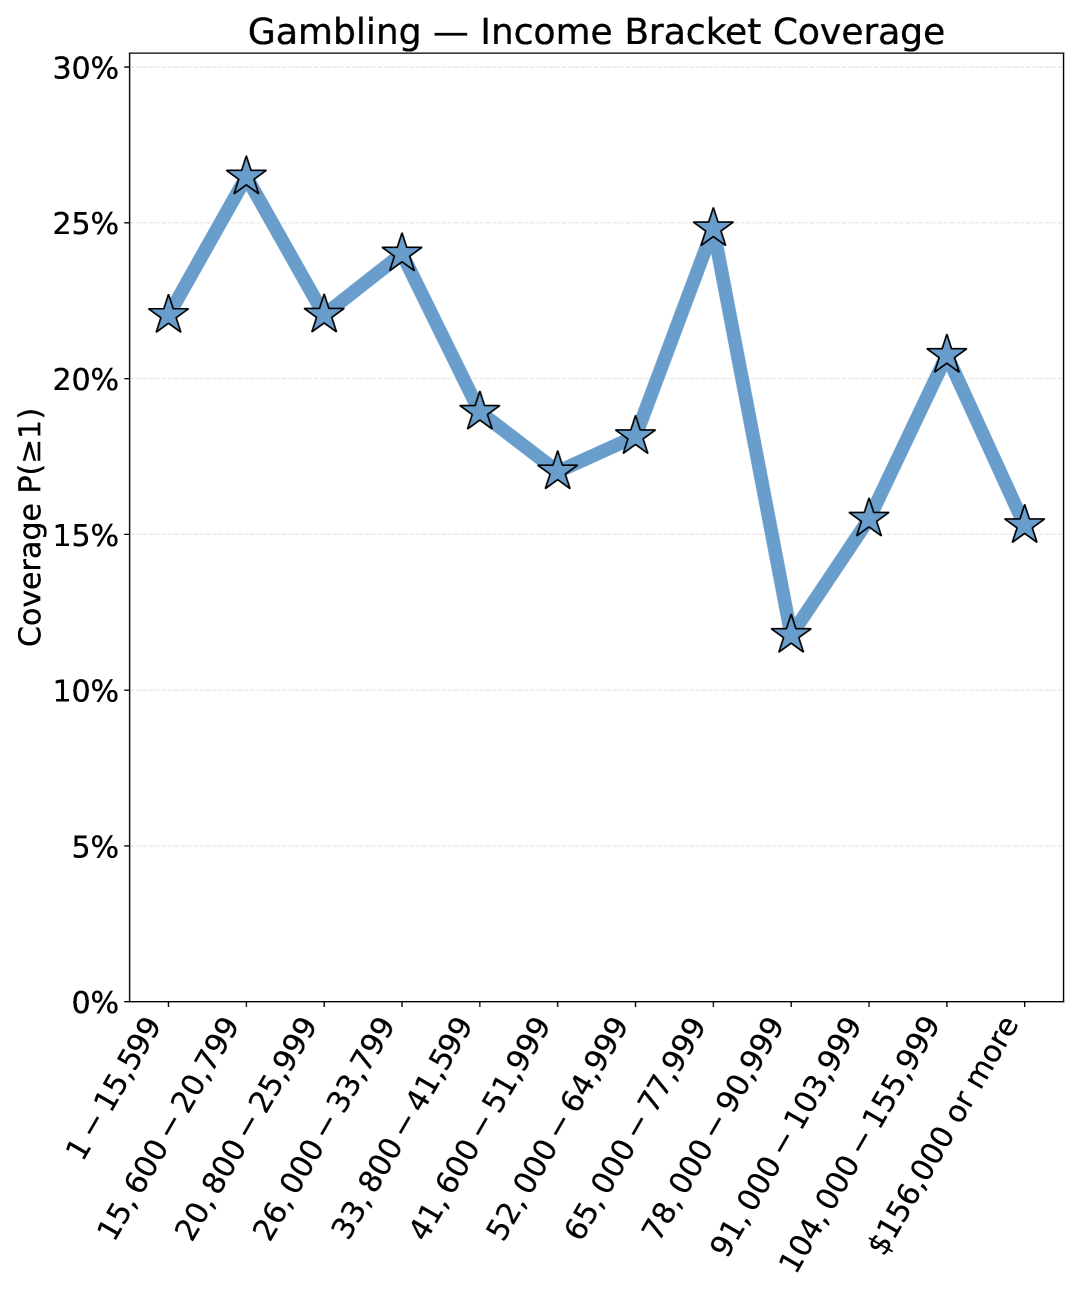
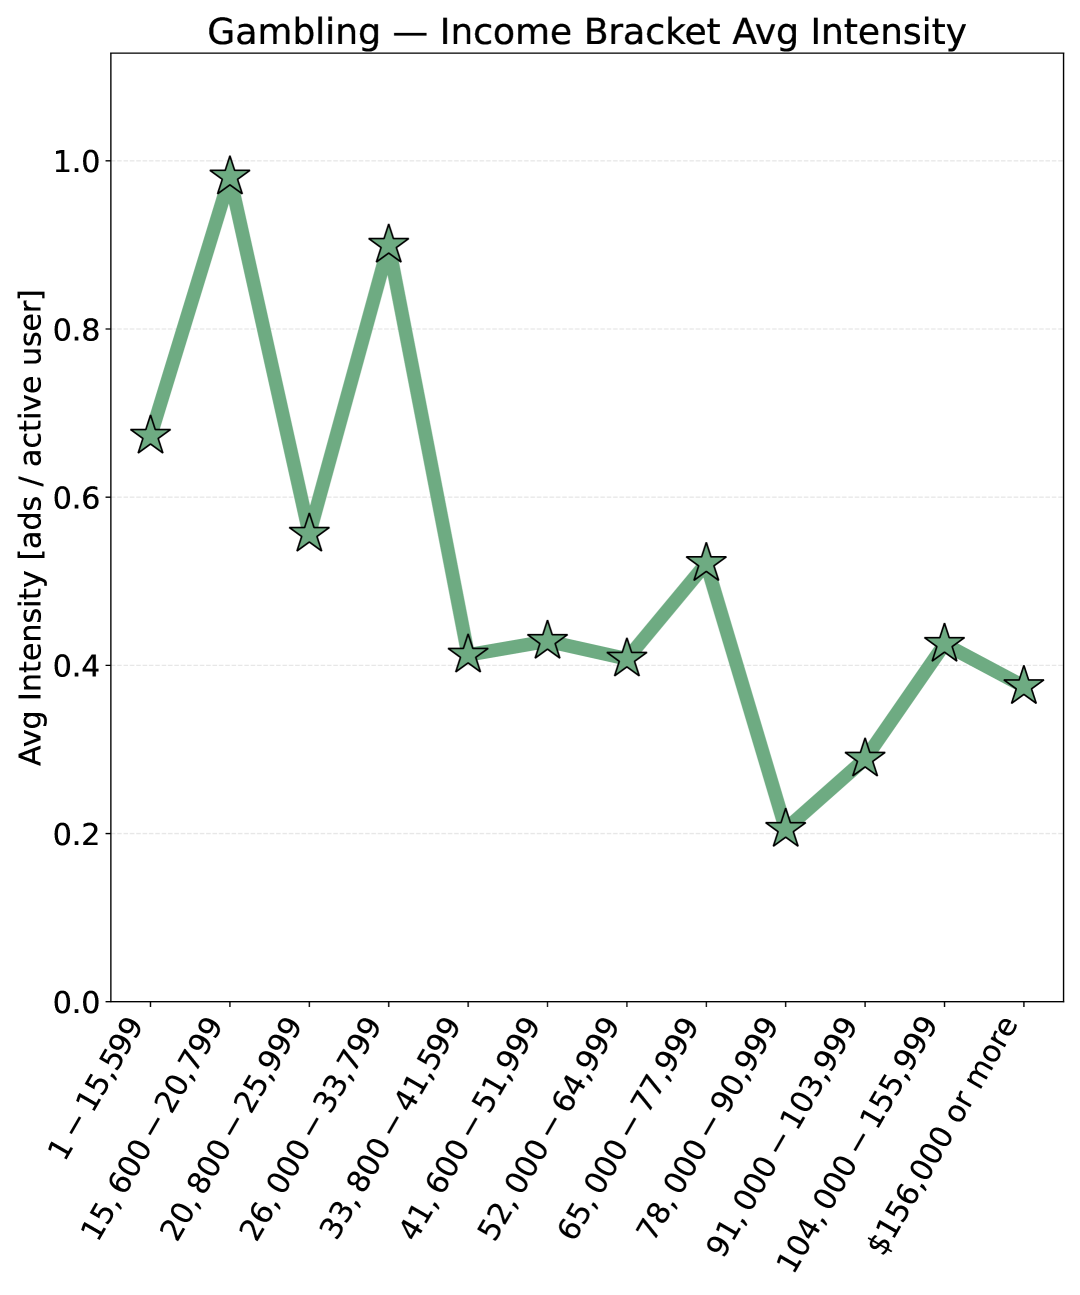
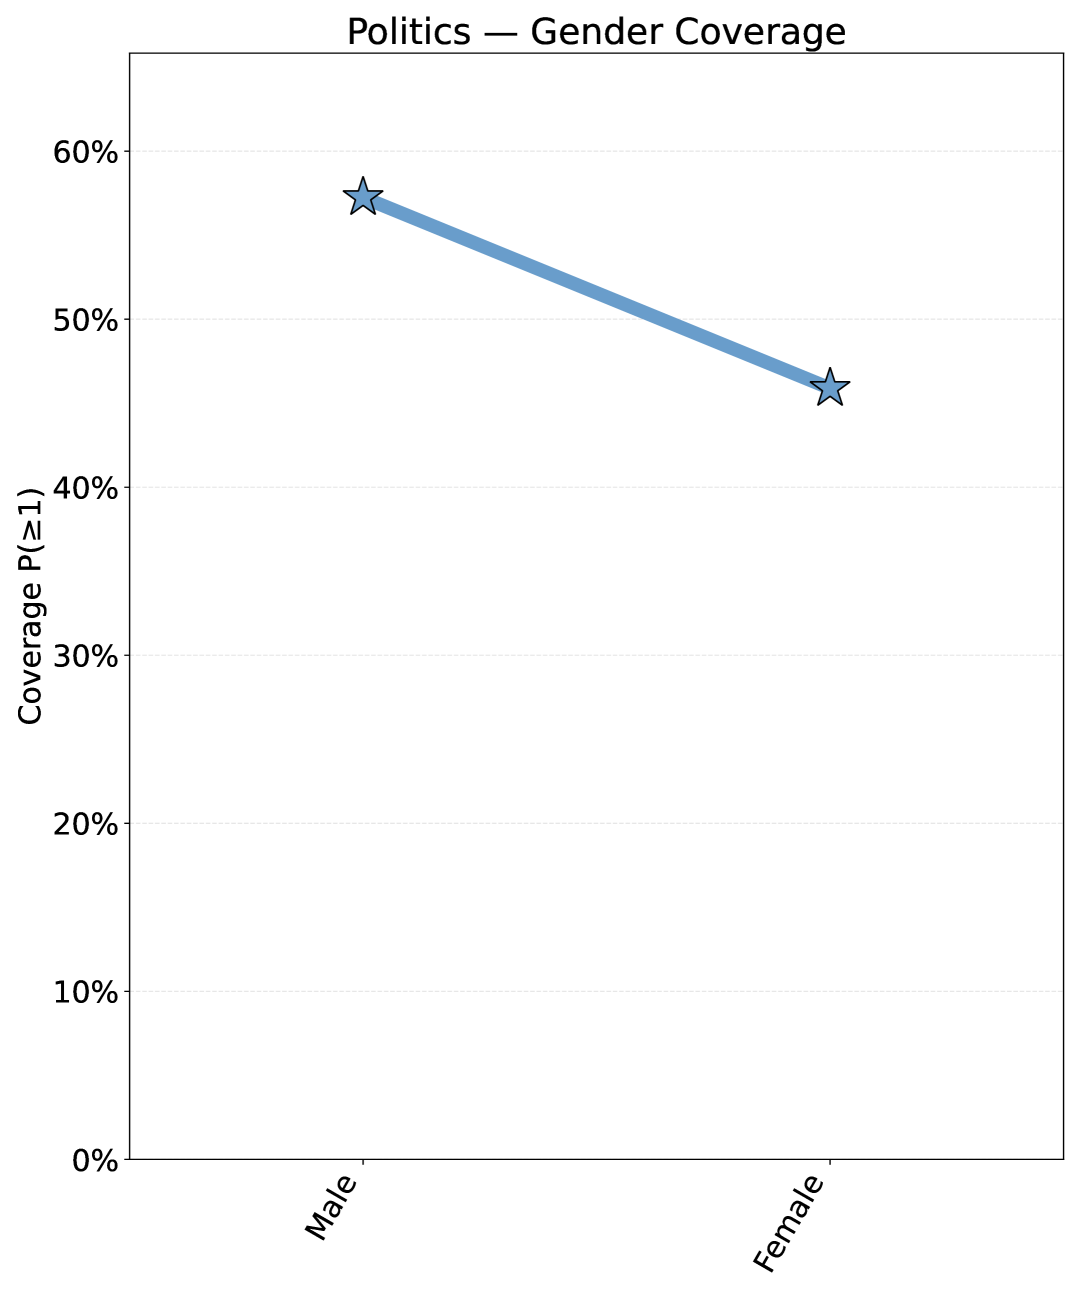
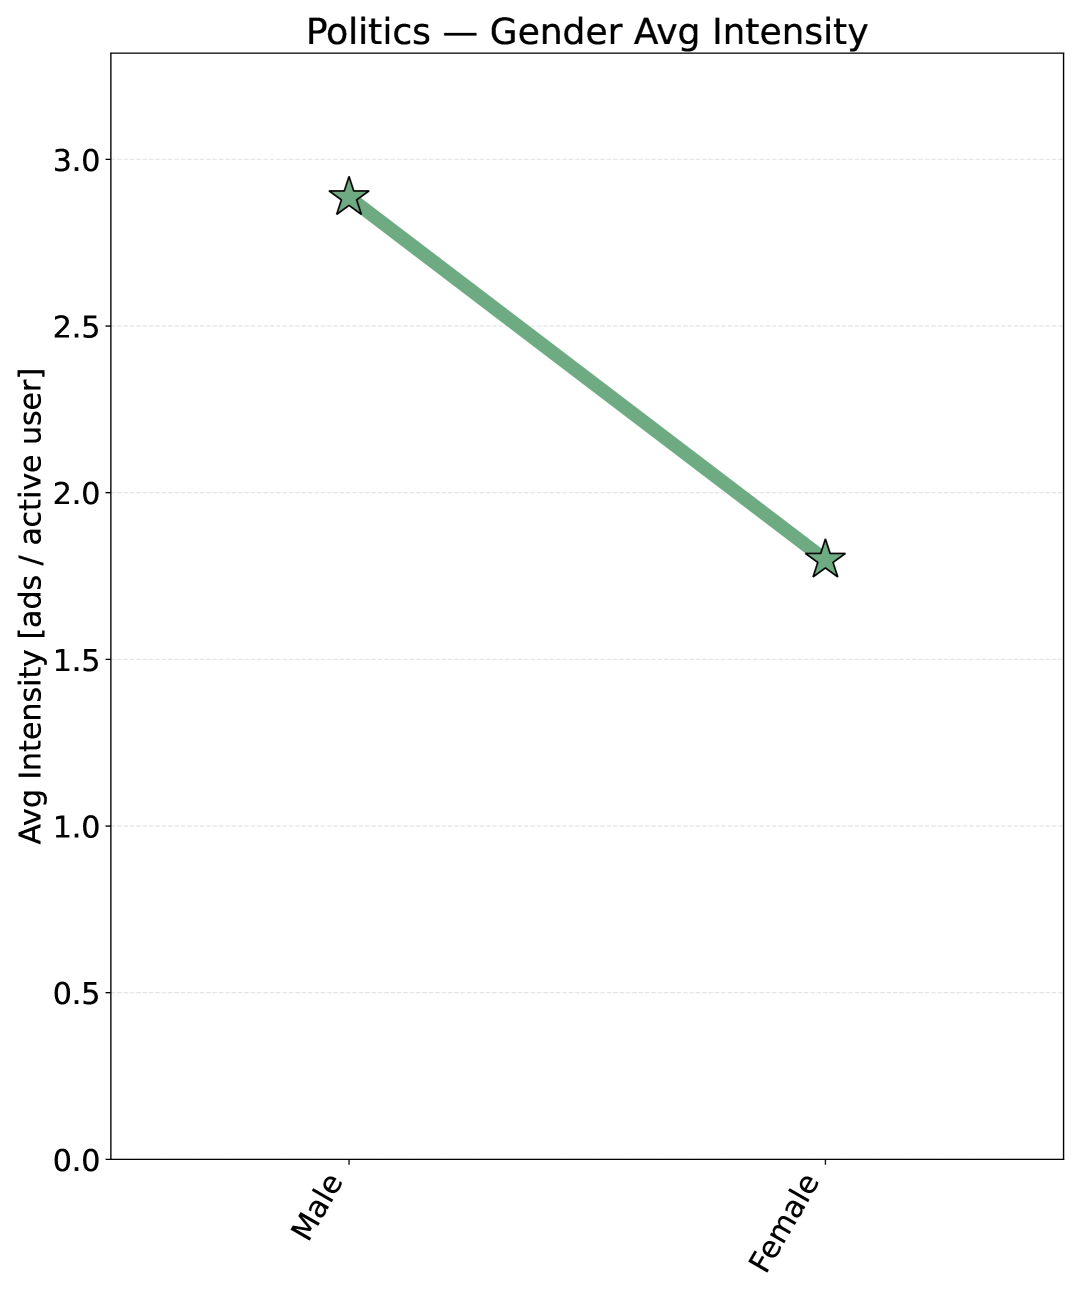
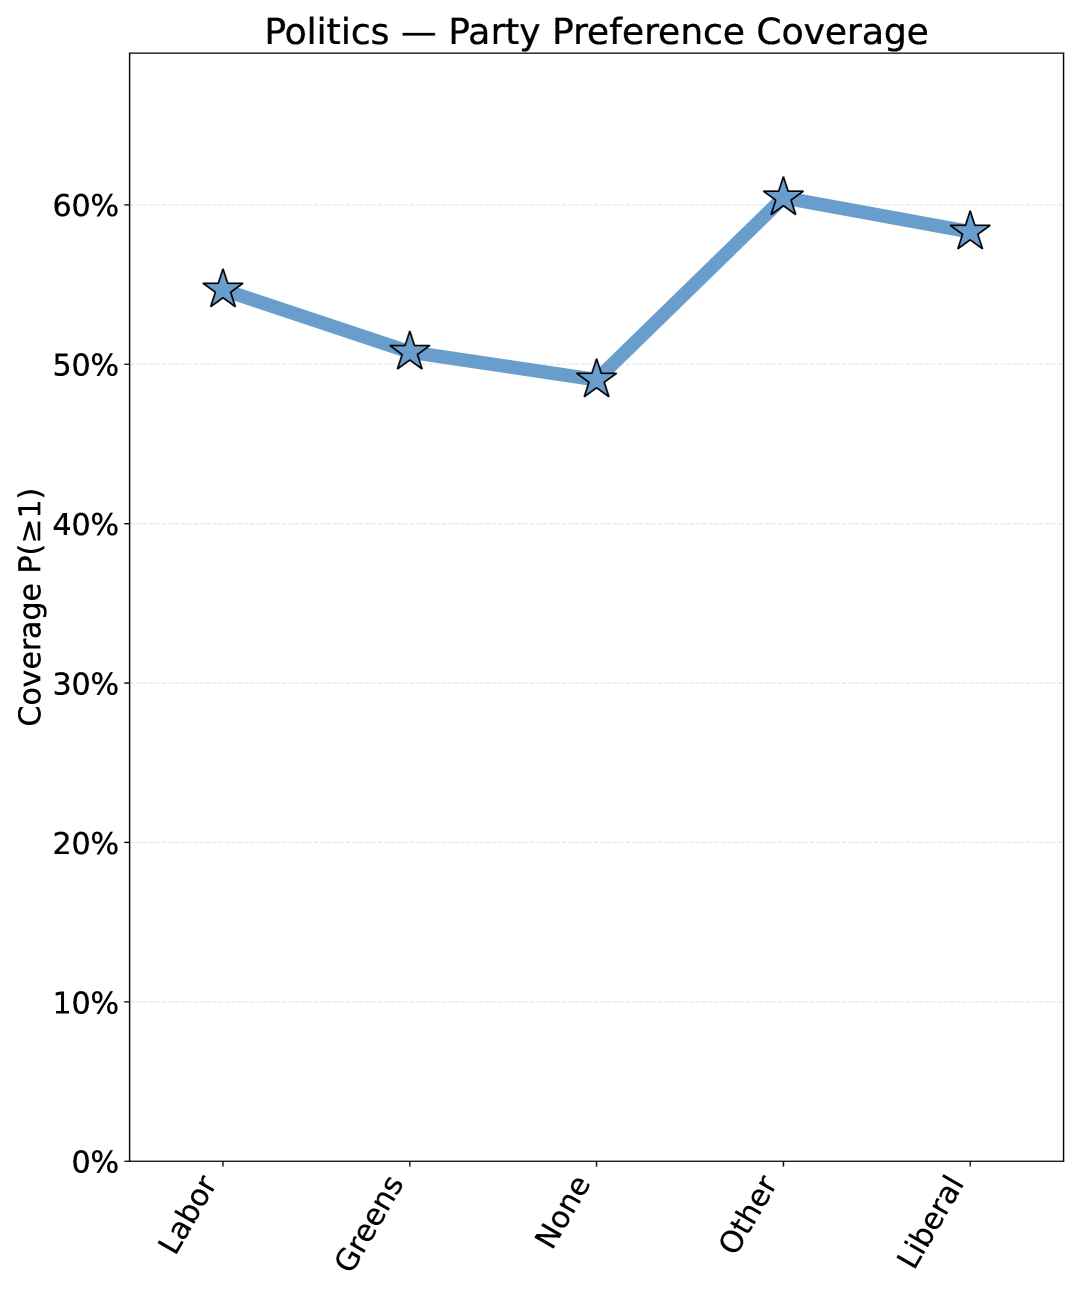
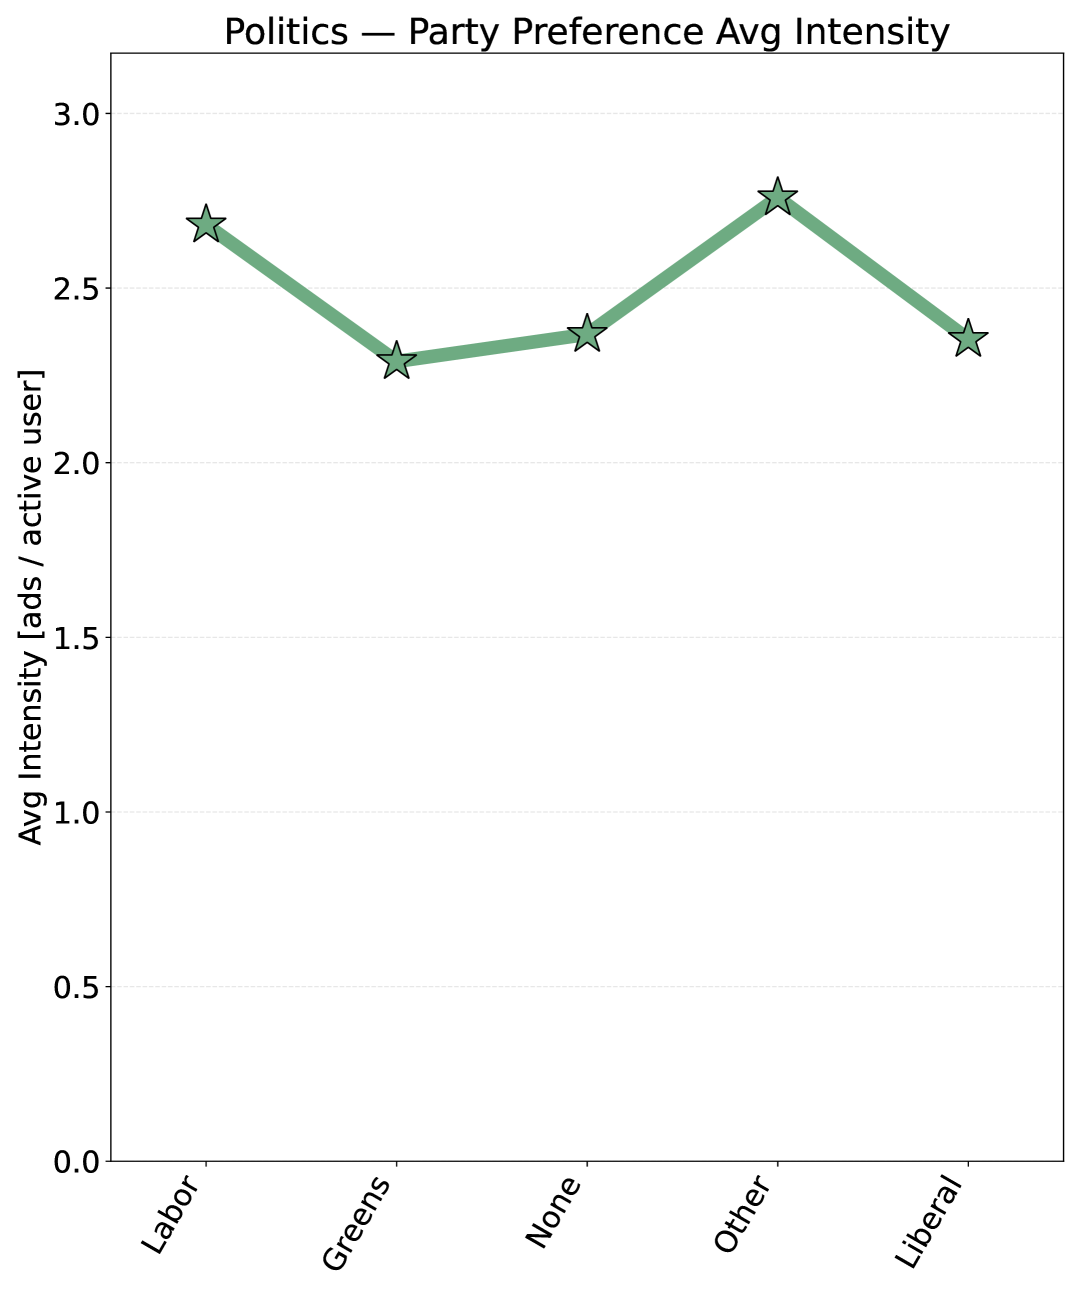
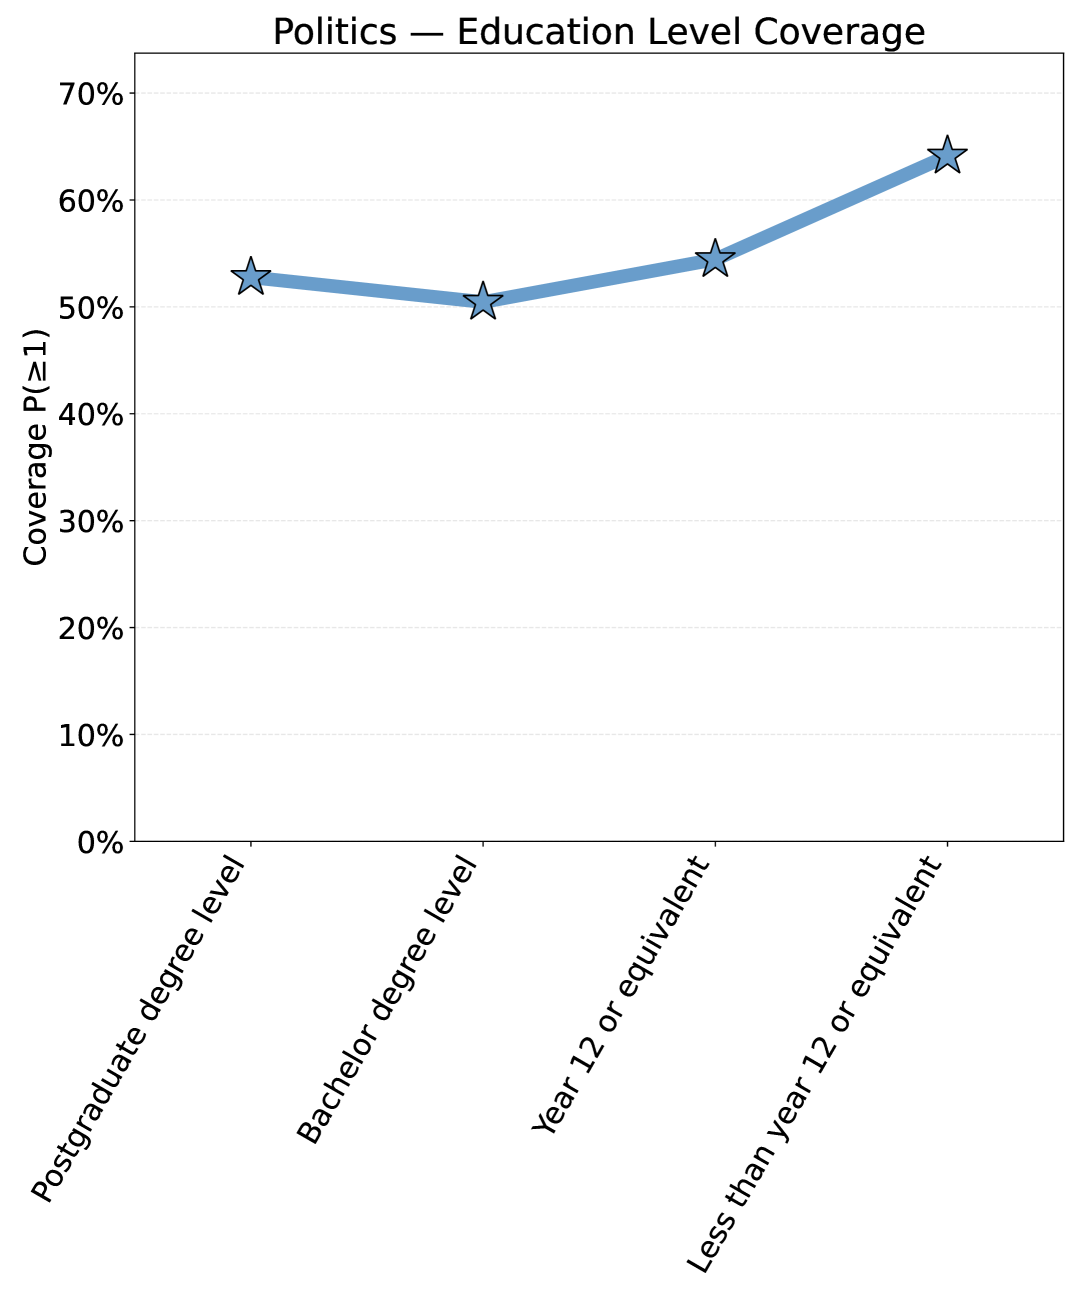
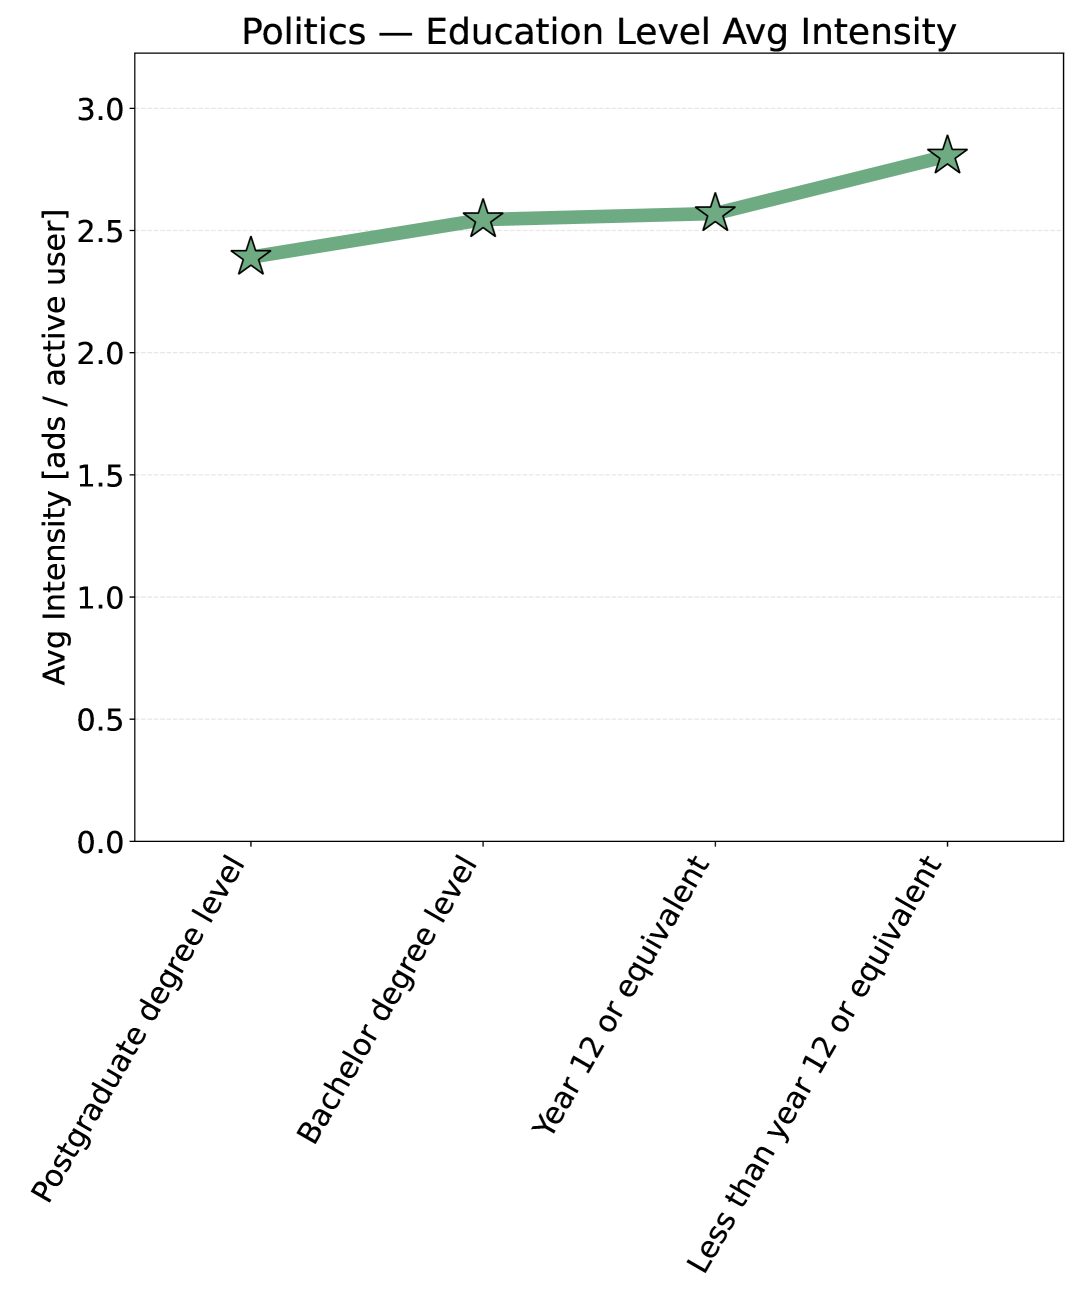
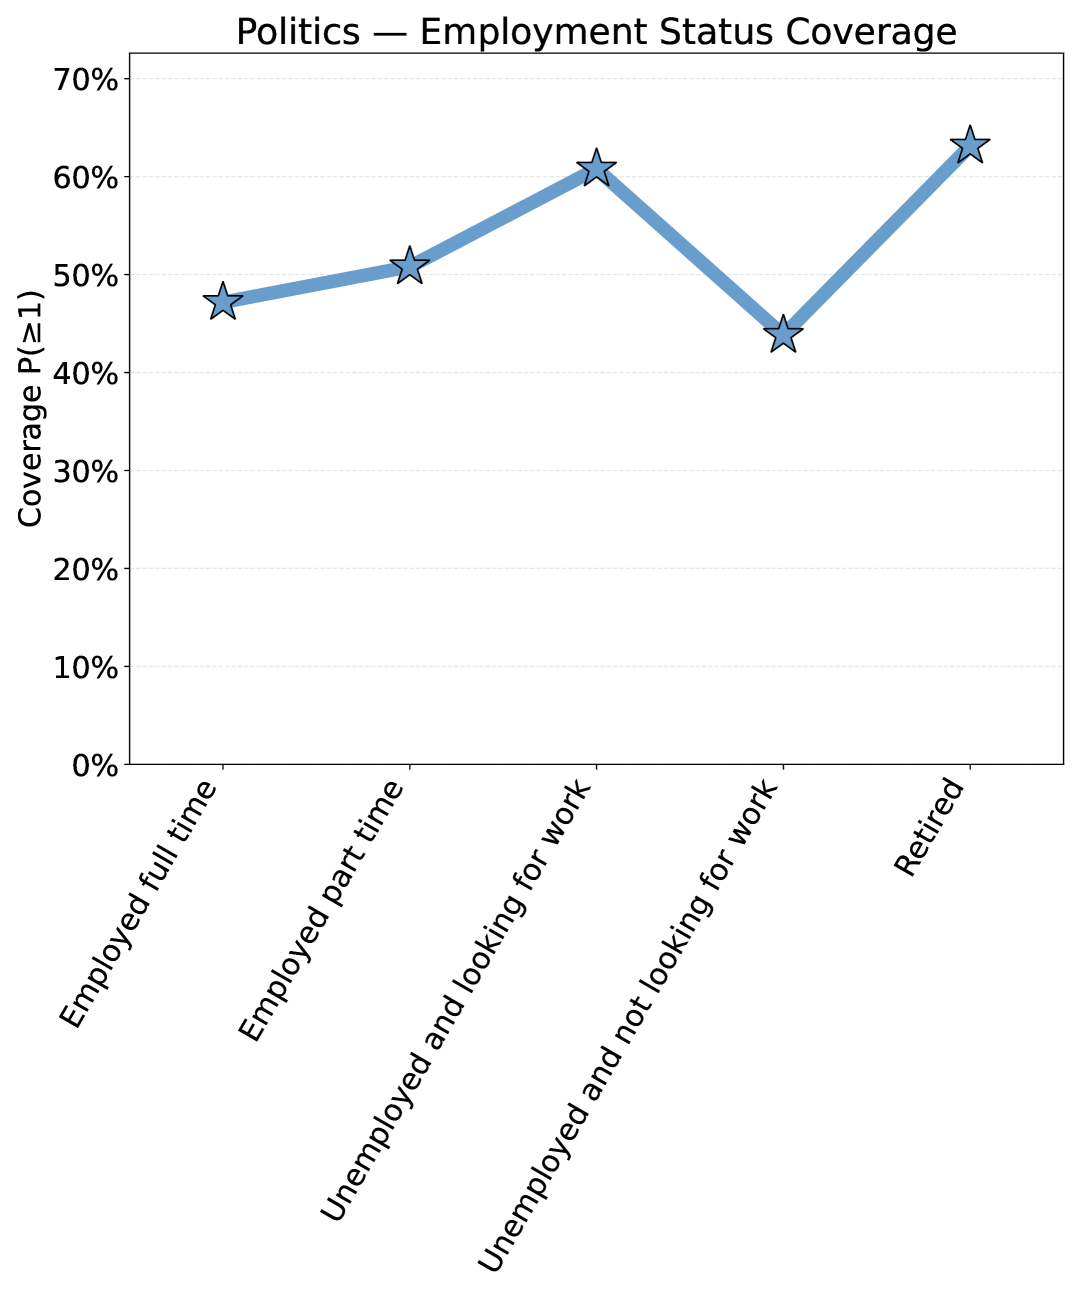
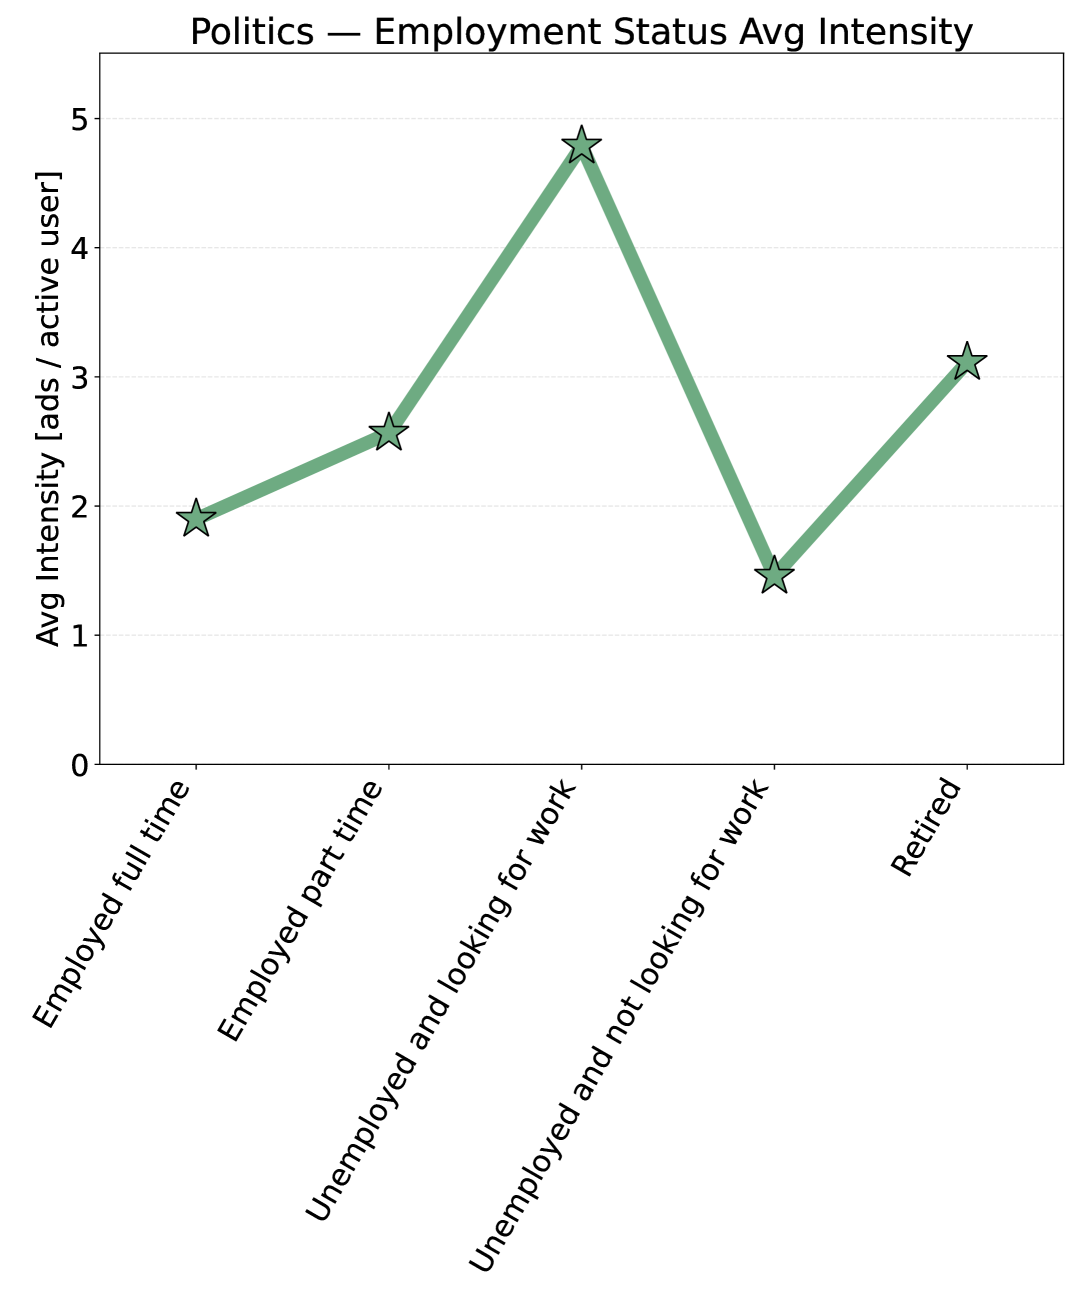
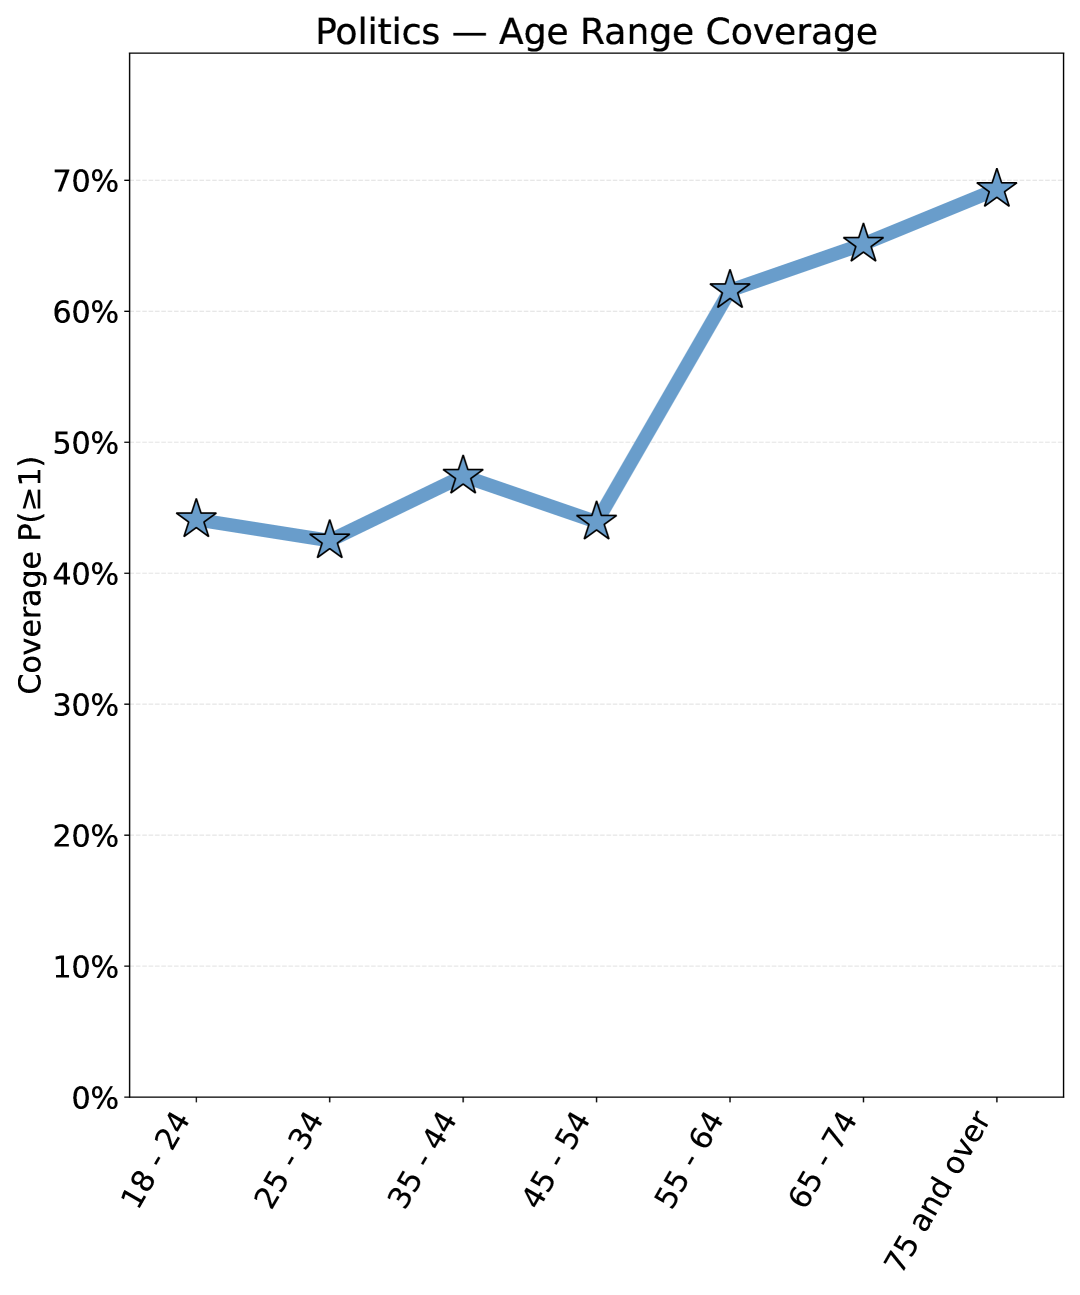
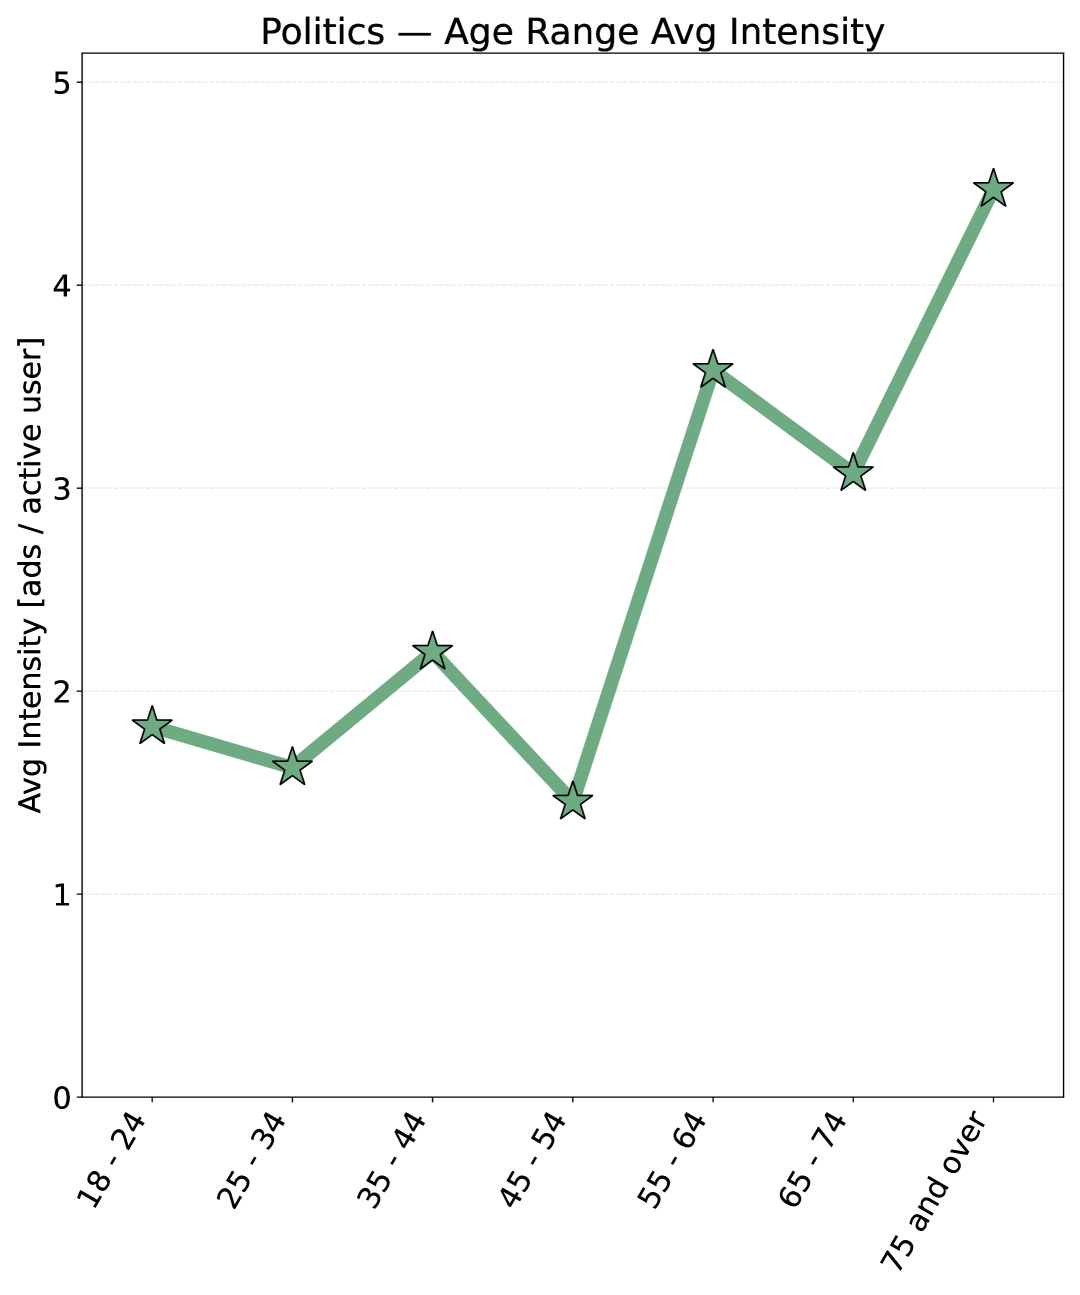
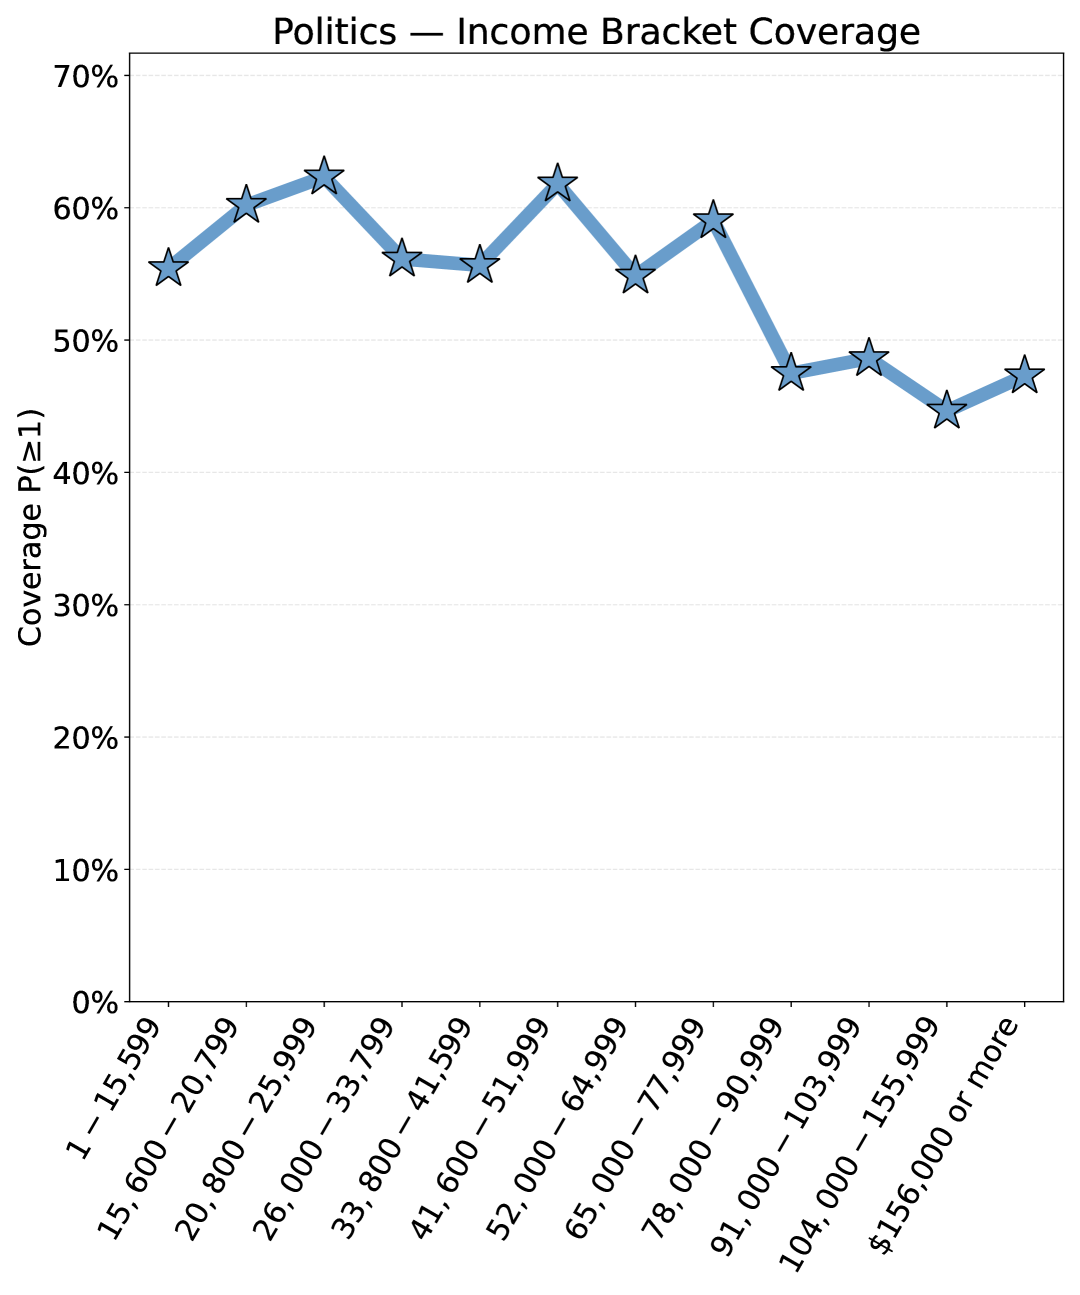
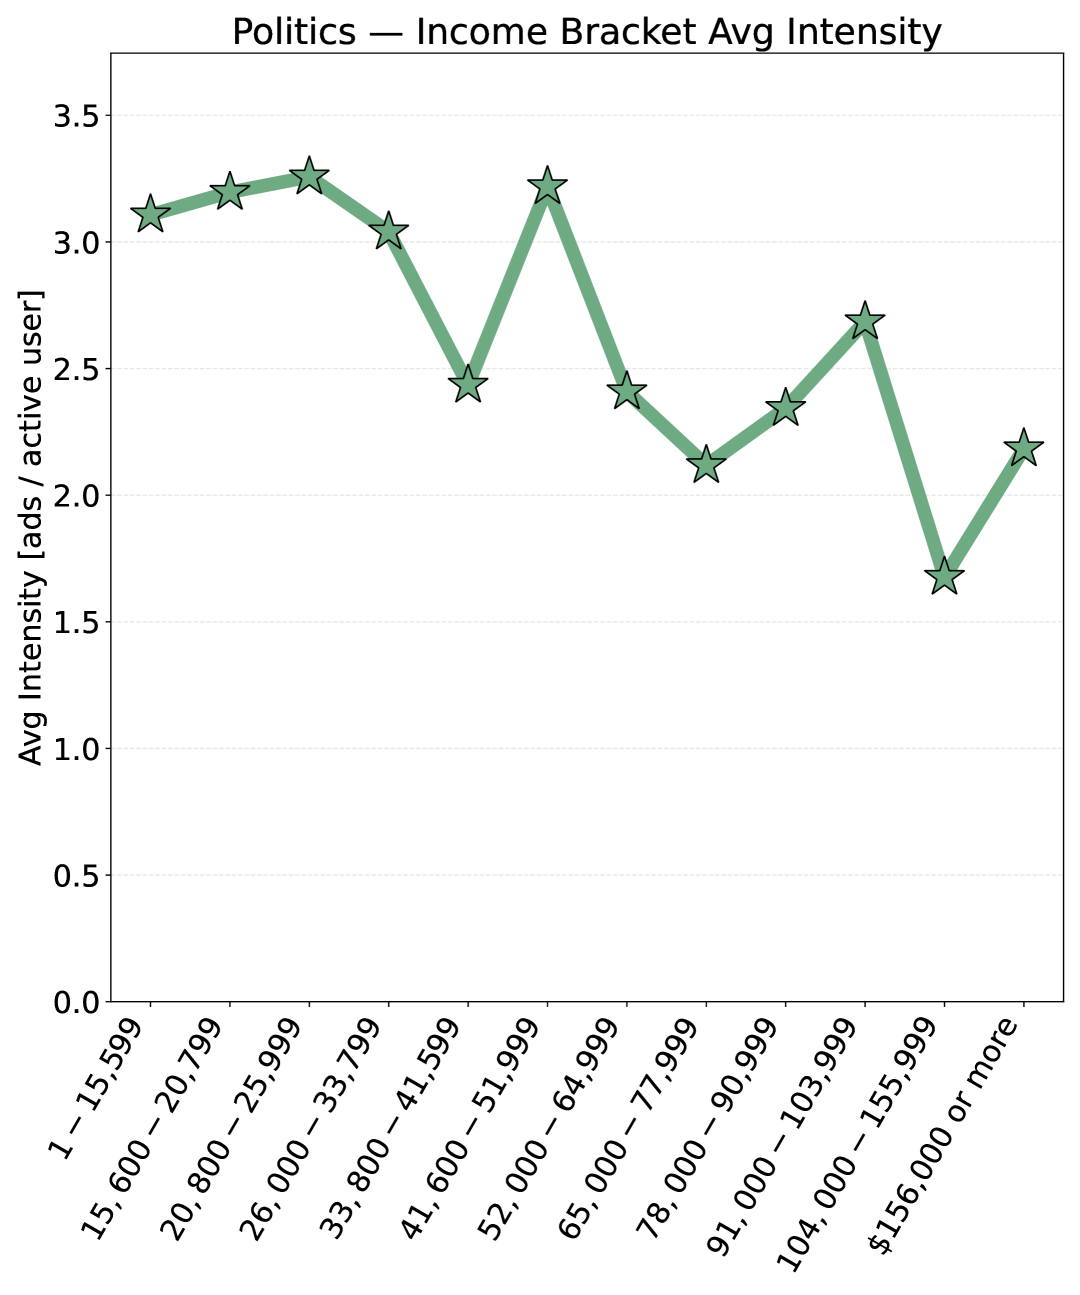
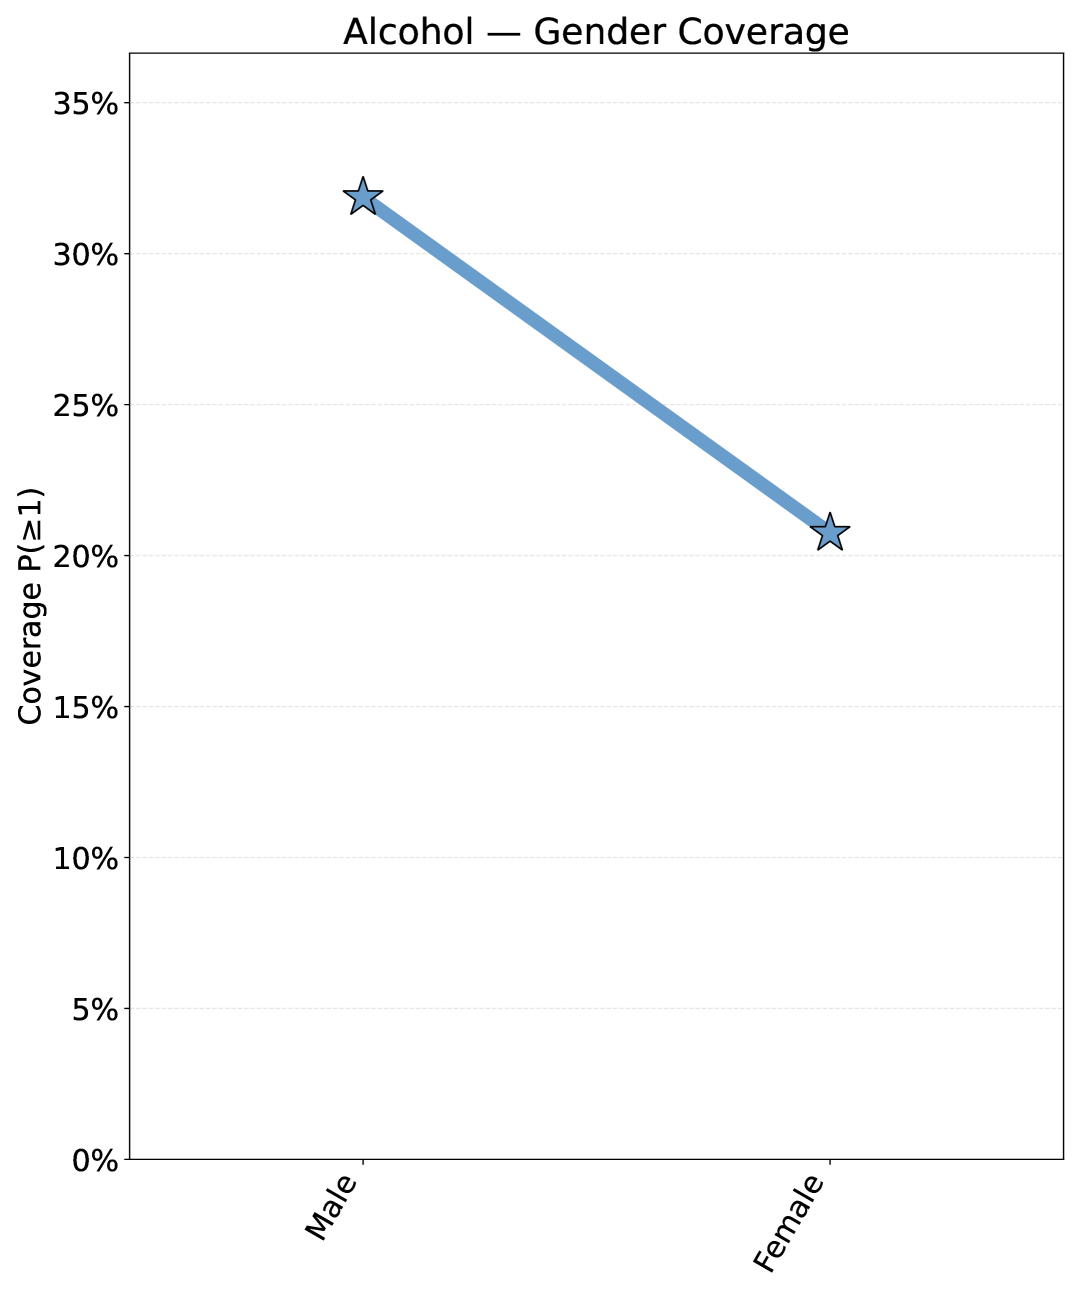
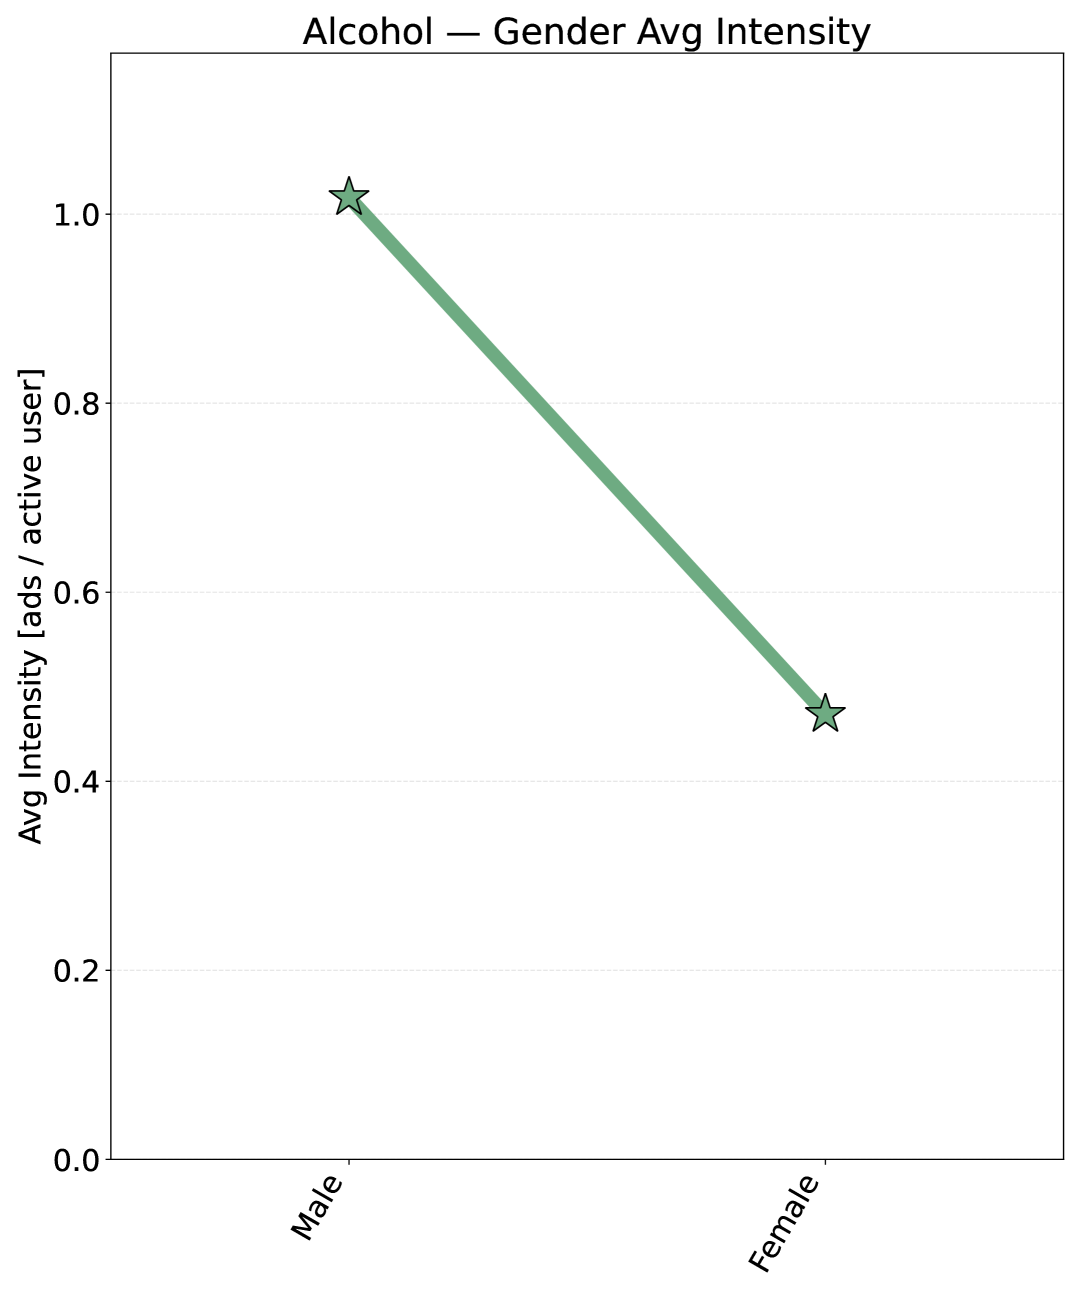
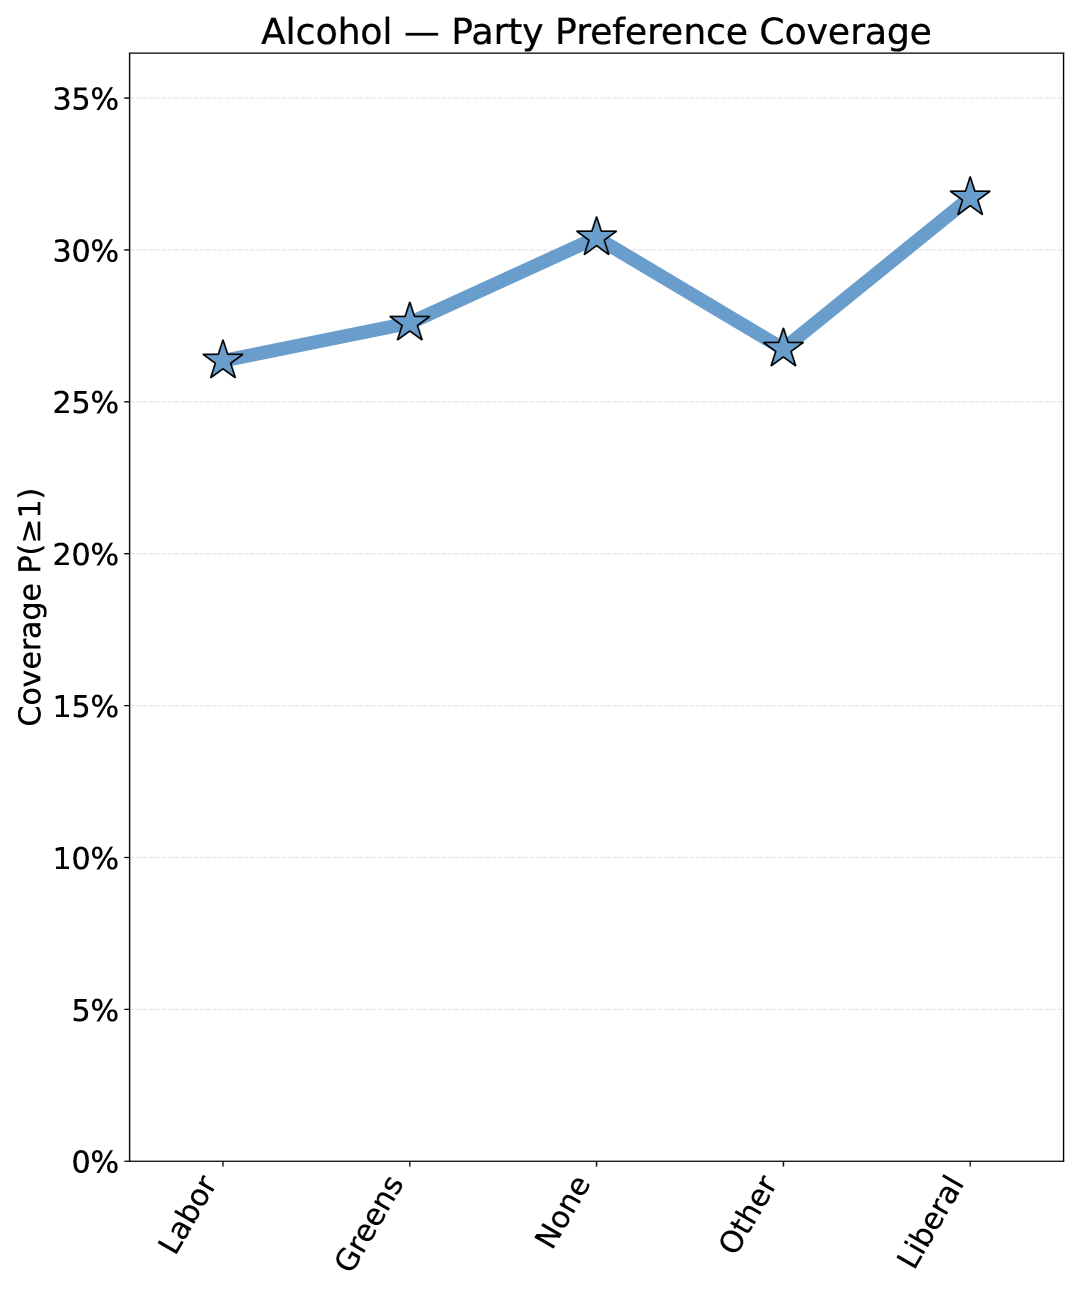
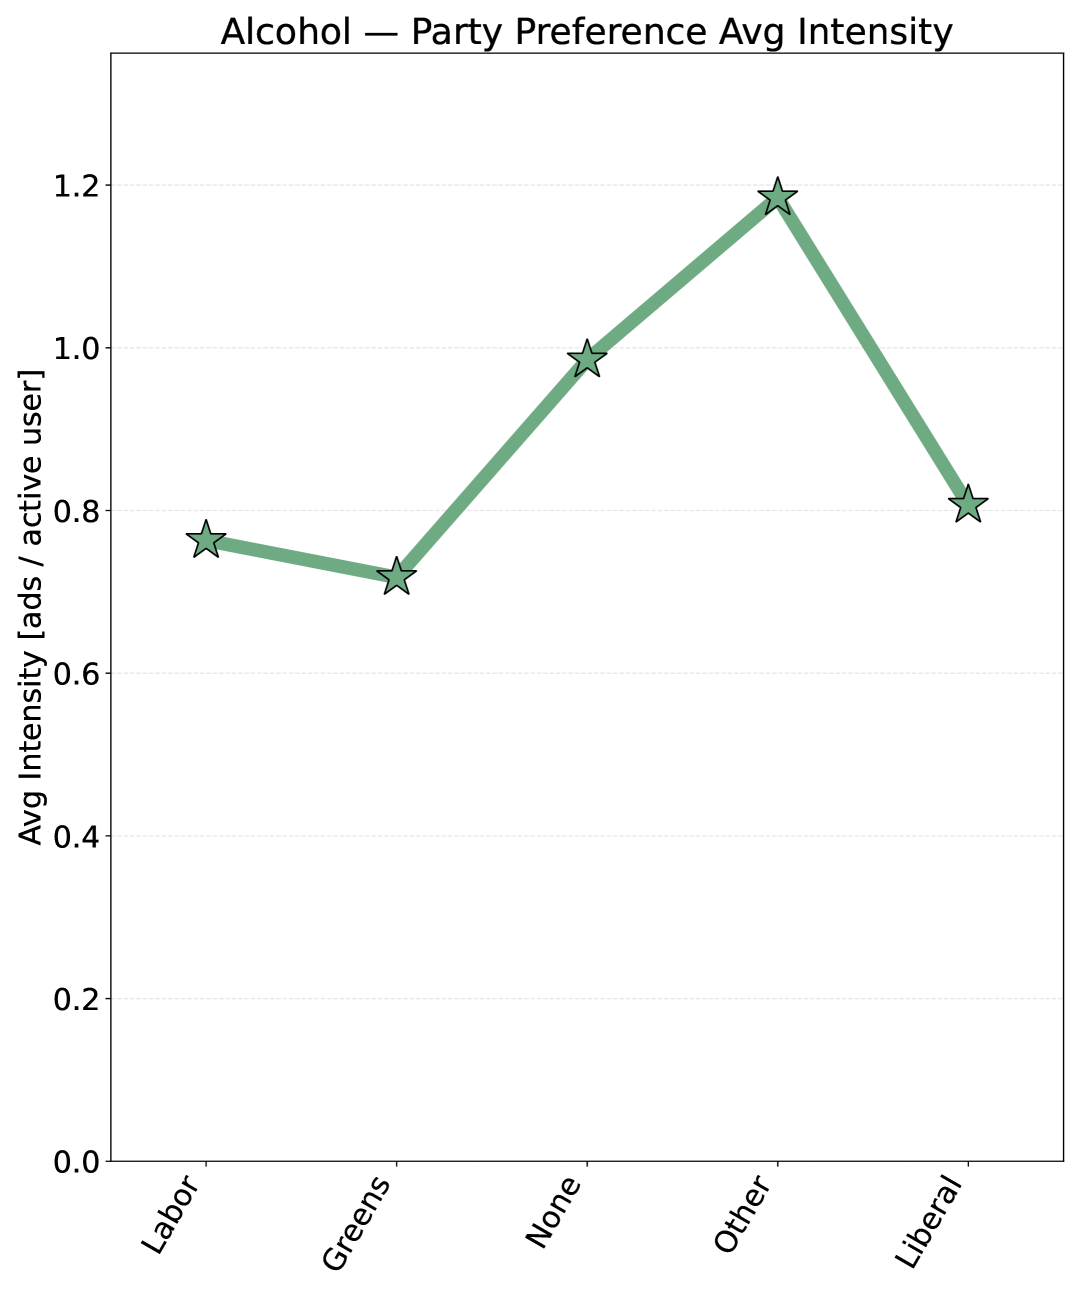
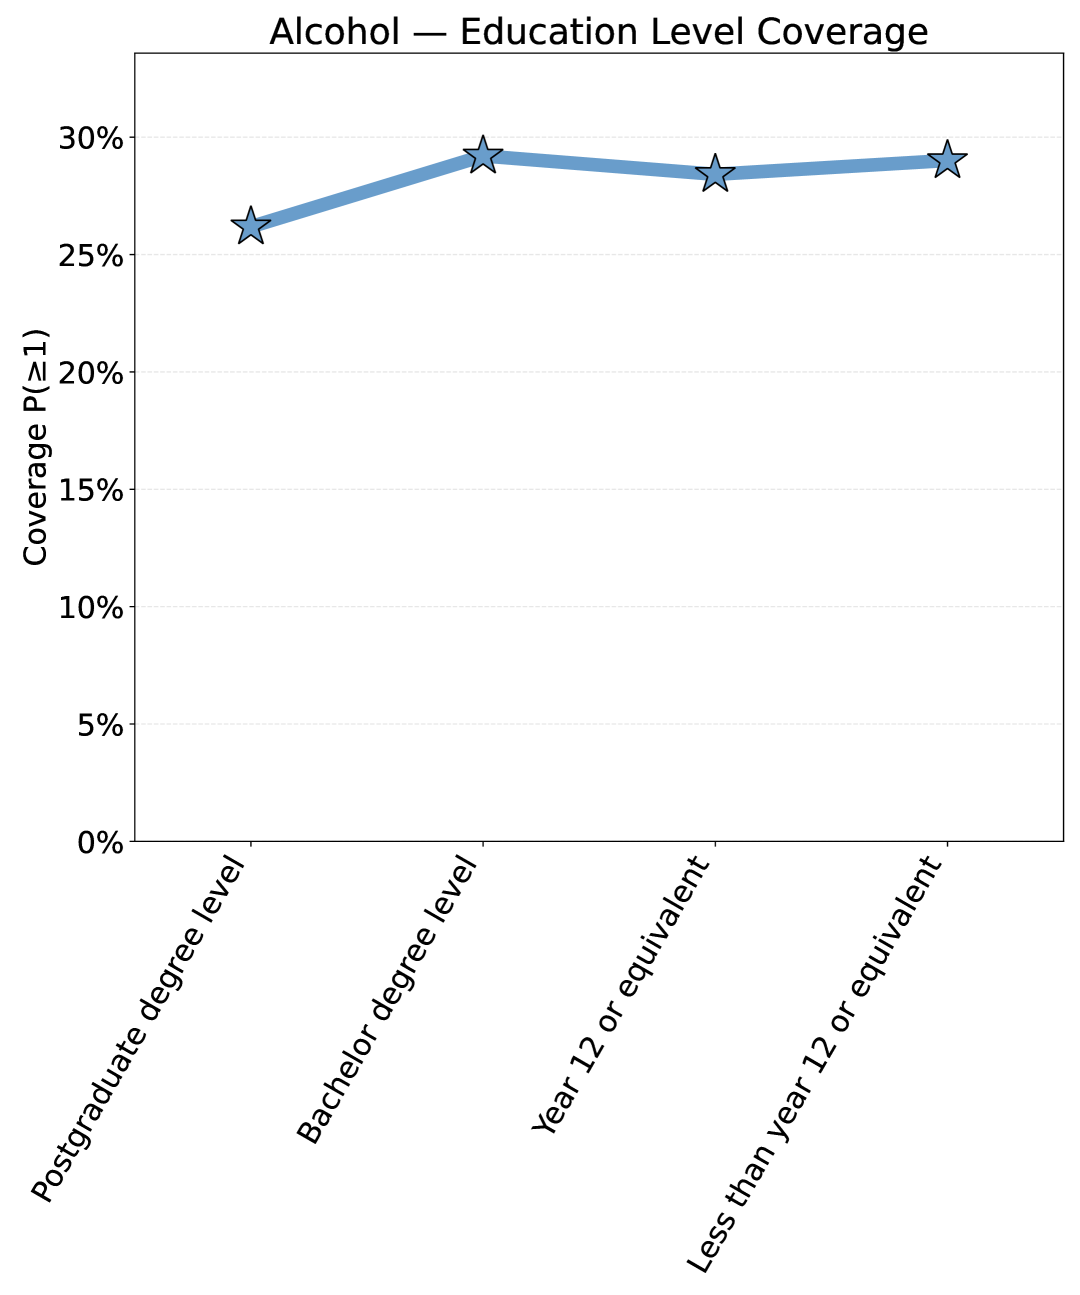
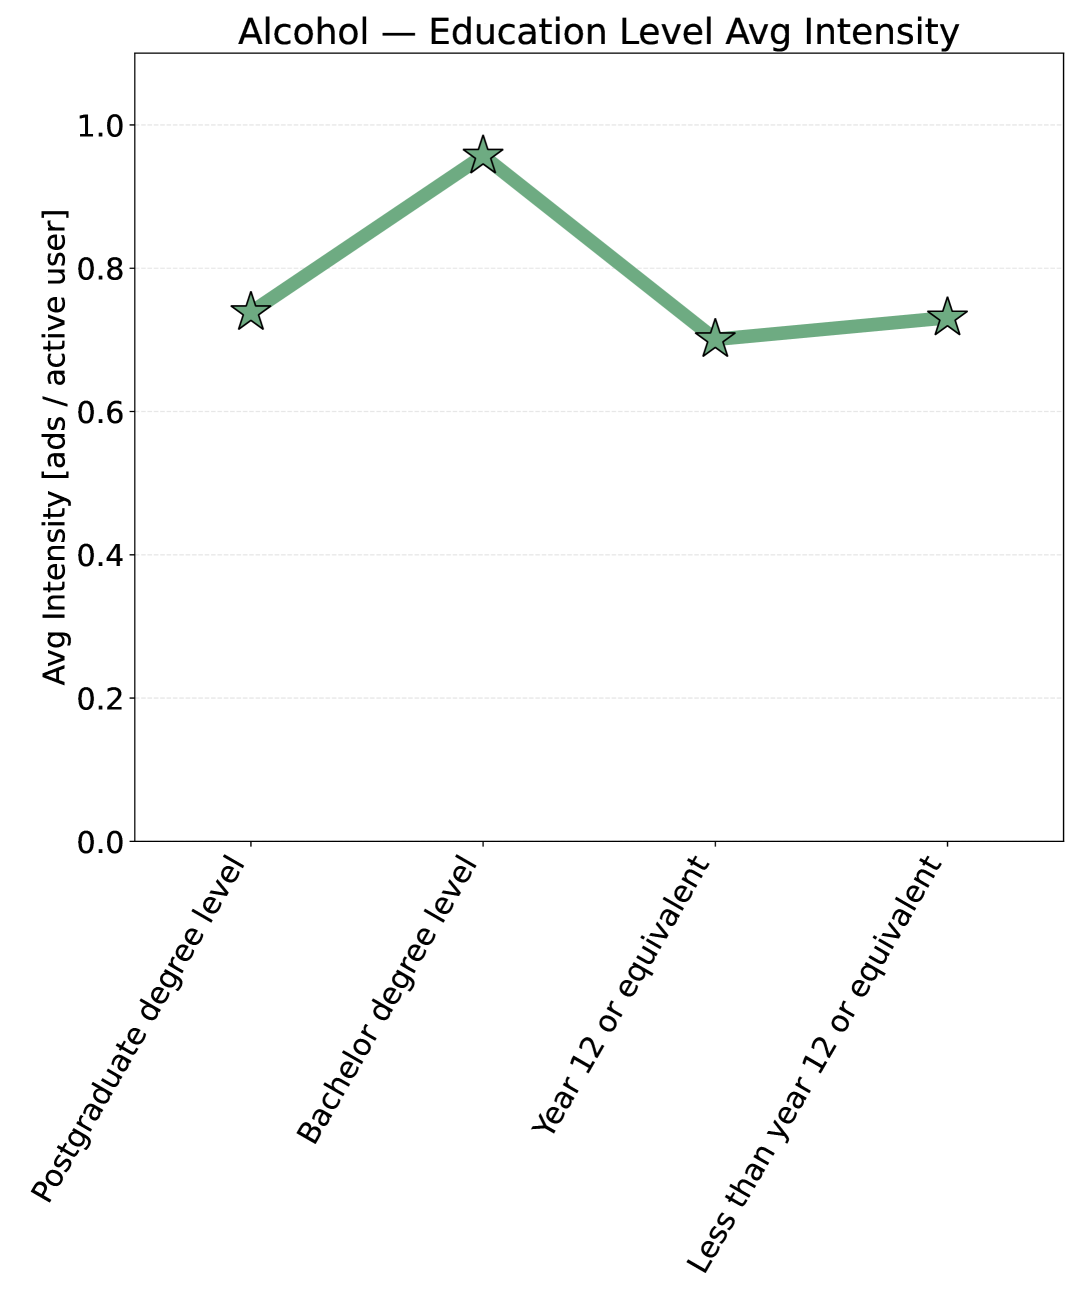
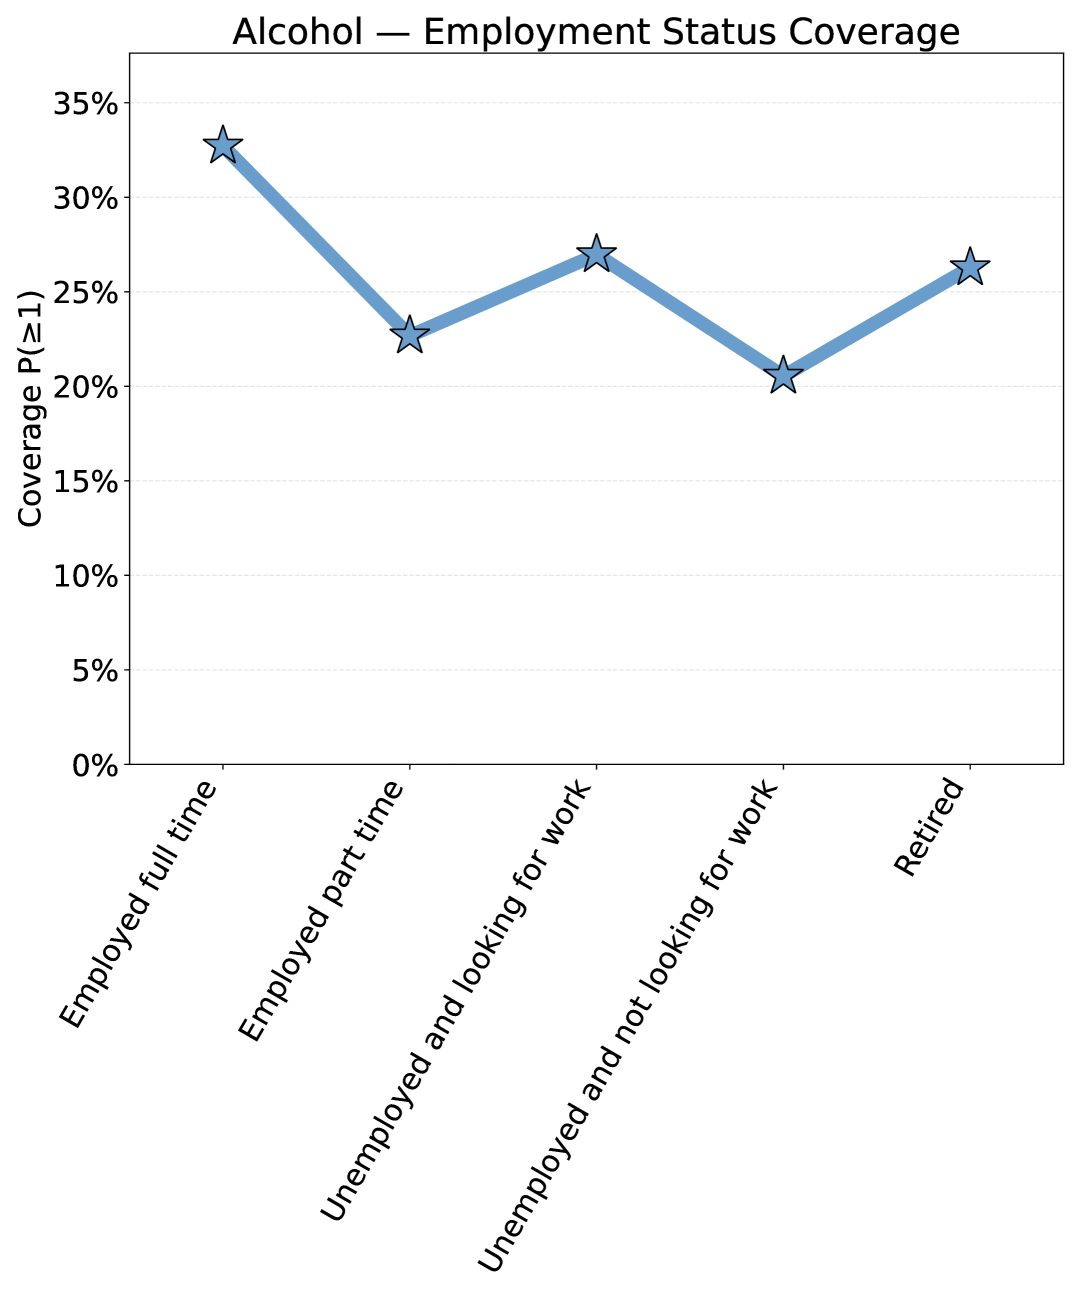
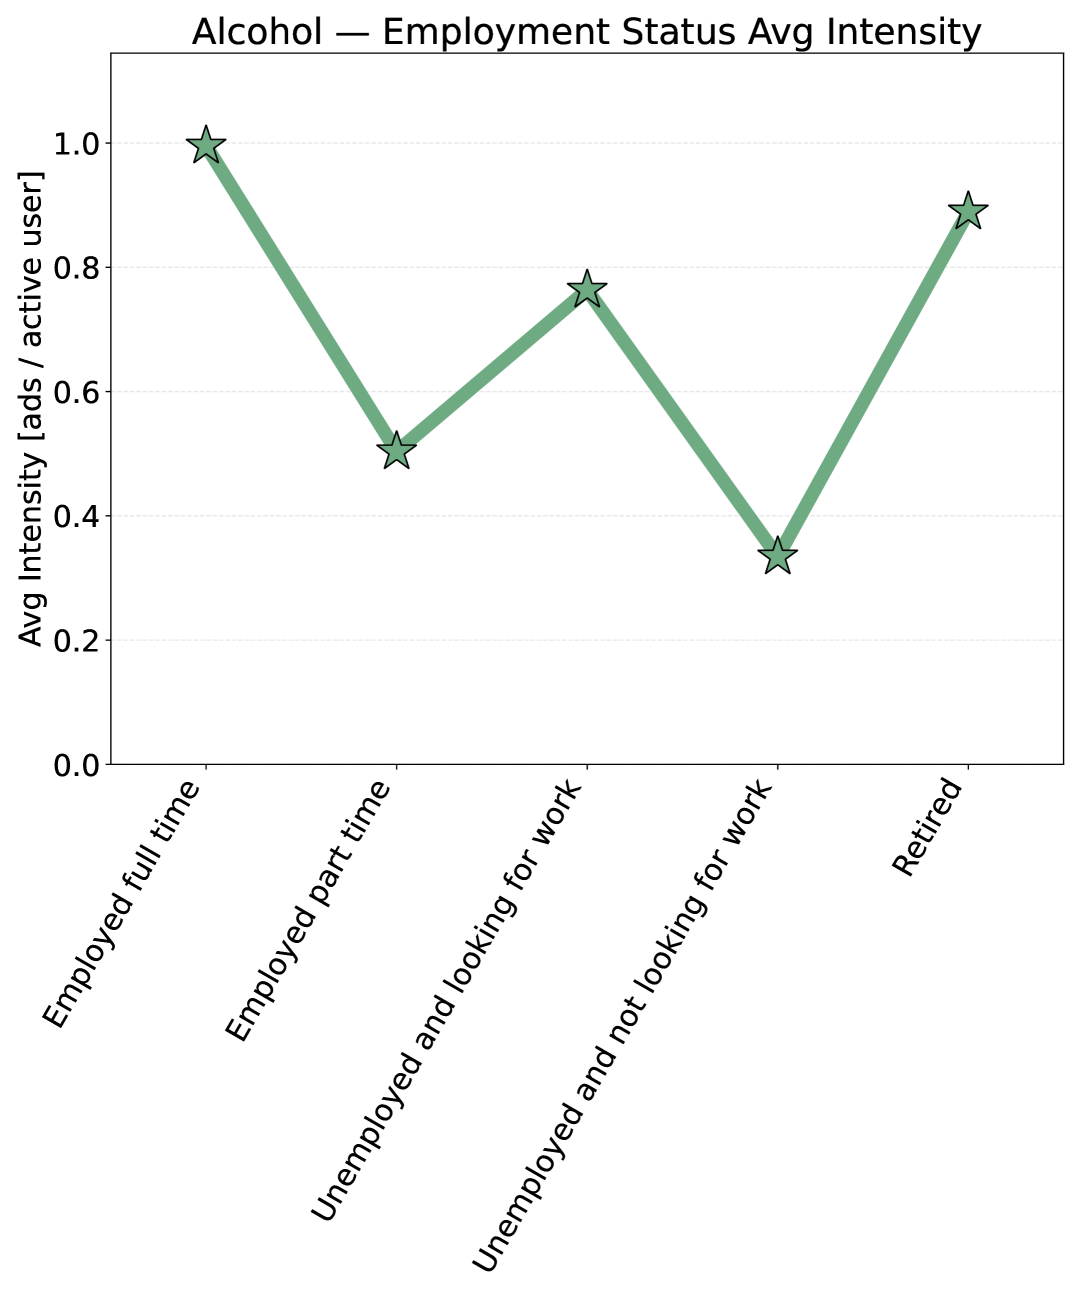
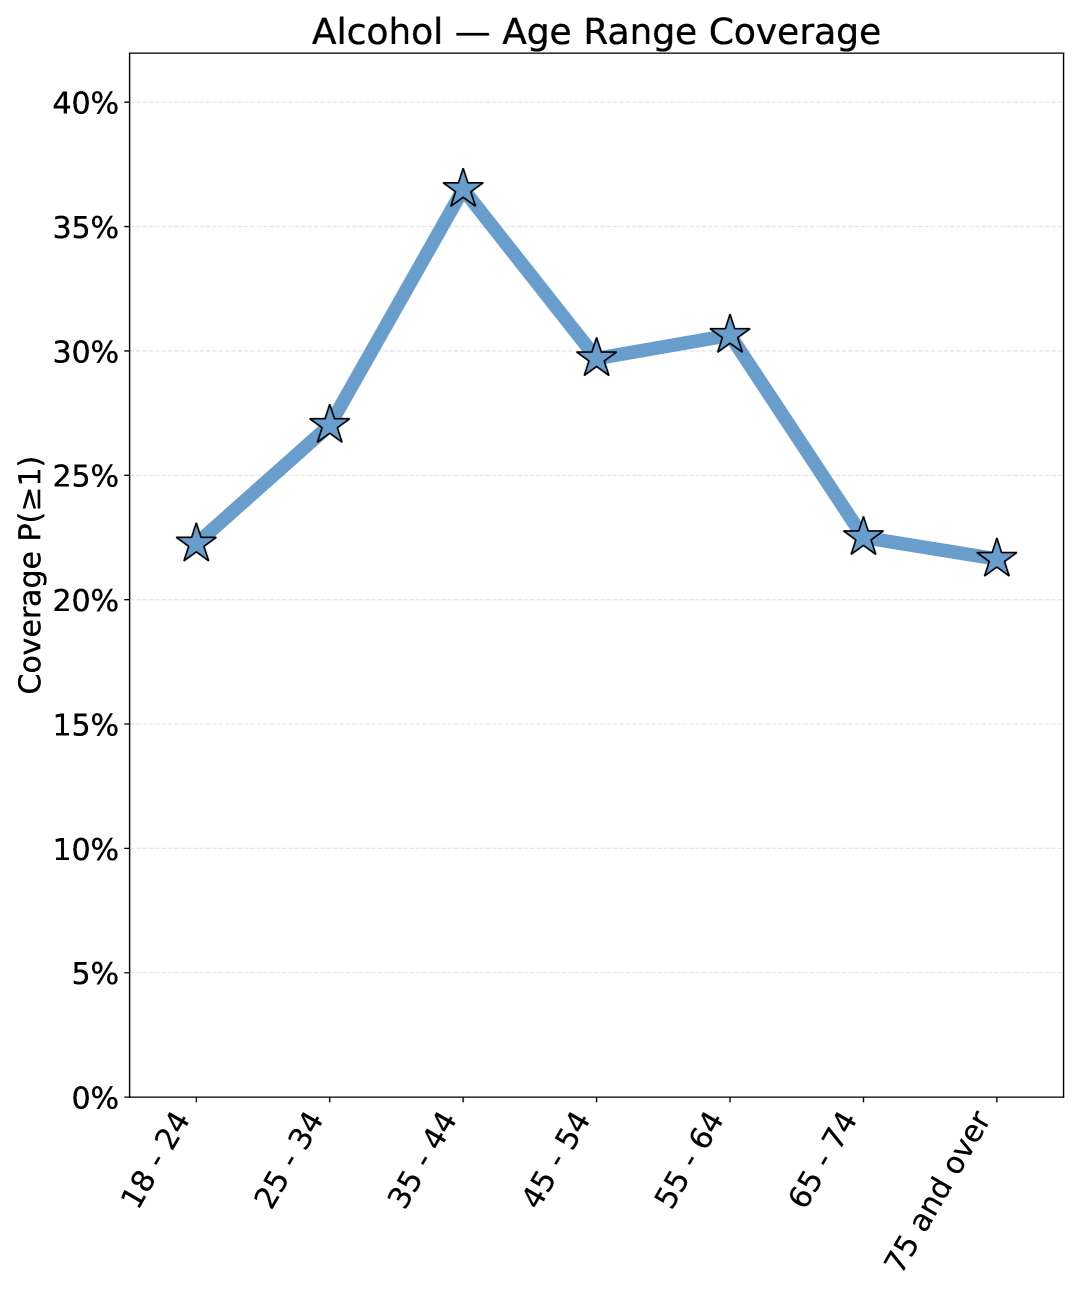
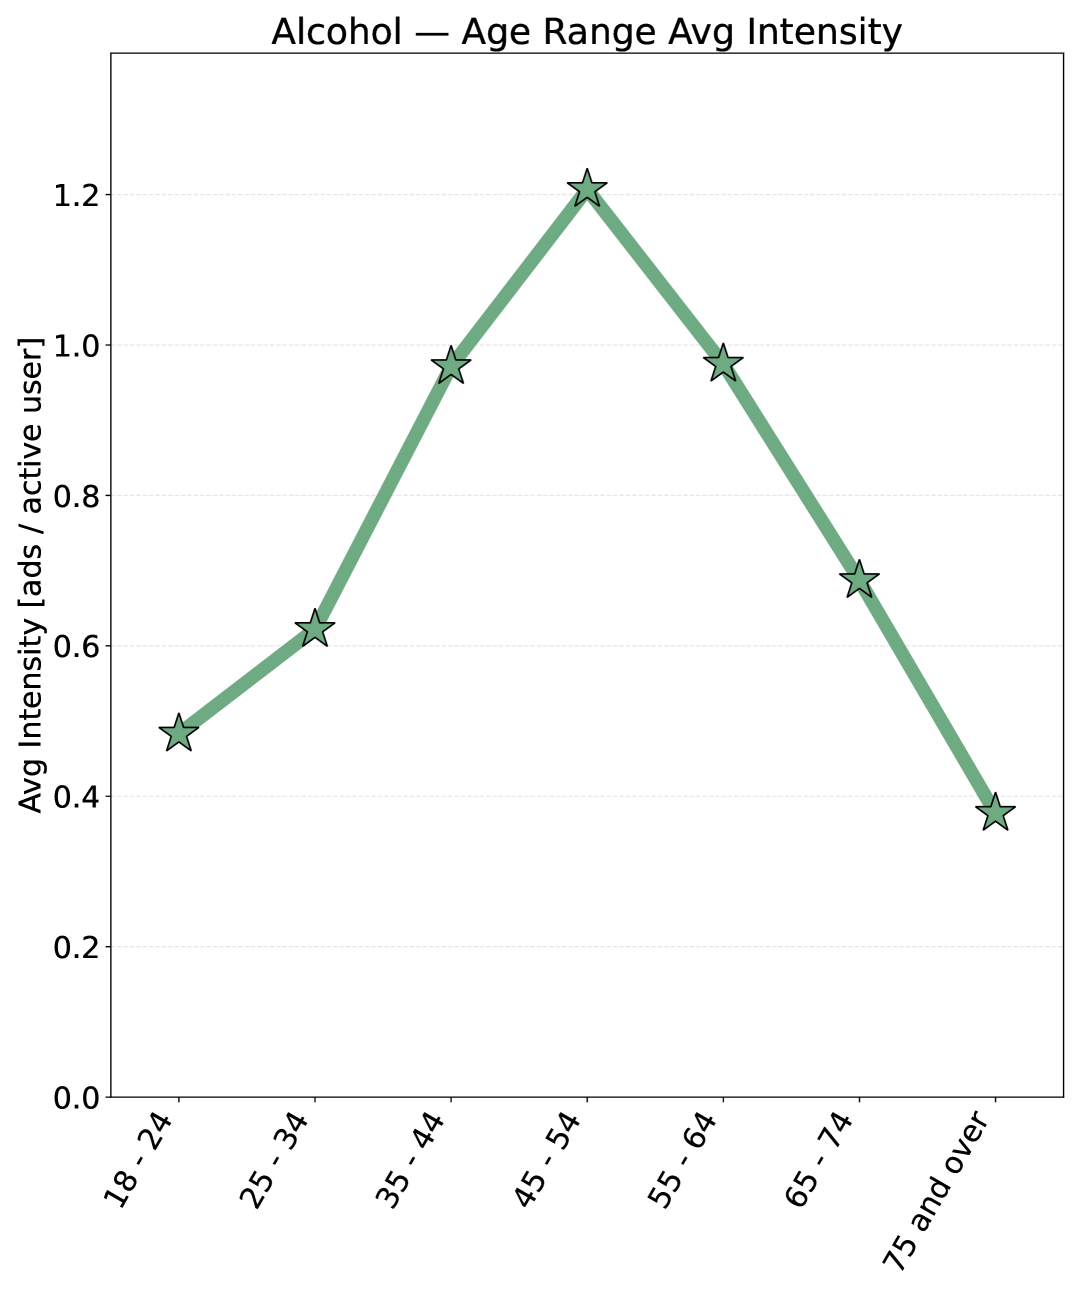
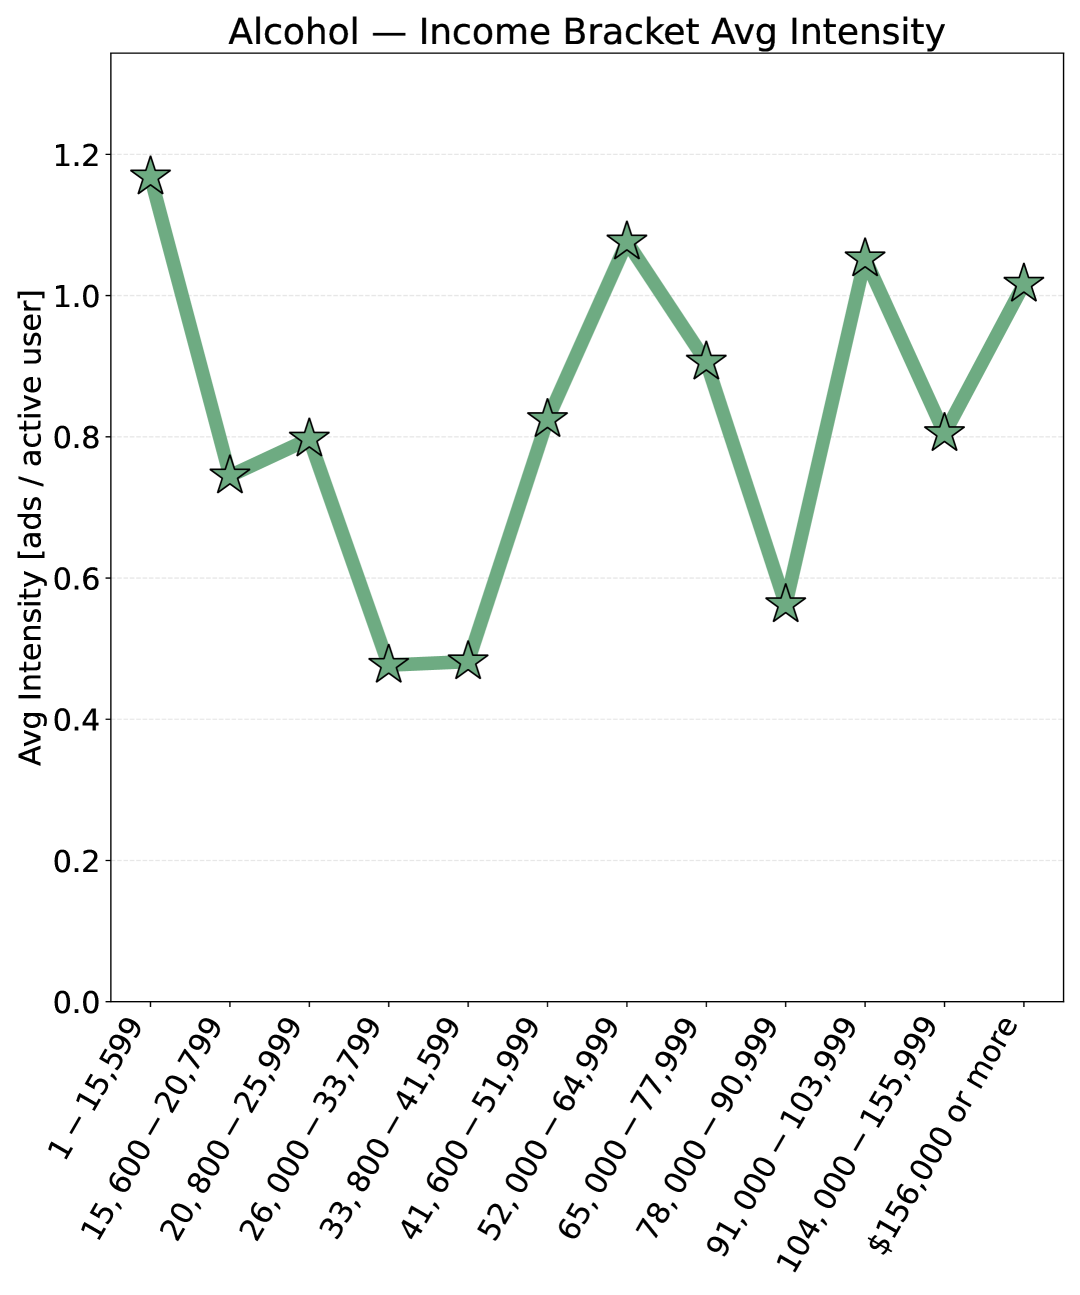
Appendix C Parameters of Models
In the multimodal understanding stage, we used Gemini 2.0 Flash 111https://cloud.google.com/vertex-ai/generative-ai/docs/models/gemini/2-0-flash with a temperature of 0.3 to allow a small degree of creativity needed for fluent yet faithful captions, while constraining outputs to a structured JSON format. For the reconstruction stages (session- and user-level), we set temperature to 0.0 to maximize determinism and reproducibility. When employing a thinking model, we used Gemini 2.5 Pro 222https://cloud.google.com/vertex-ai/generative-ai/docs/models/gemini/2-5-pro with the default dynamic-thinking configuration enabled (thinking budget = -1). For GPT-5 333https://platform.openai.com/docs/models/gpt-5 and GPT-5 mini 444https://platform.openai.com/docs/models/gpt-5-mini, we retained the default reasoning effort setting (“medium”). All other non-thinking models followed the same configuration as Gemini 2.0 Flash in the reconstruction stage (i.e., temperature set to 0.0).
Appendix D Gemini Quality Evaluation
| Dimension / Metric | Value (%) |
|---|---|
| Caption Overall | 99 |
| Caption Relevance | 100 |
| Caption Correctness | 99 |
| Caption Informativeness | 100 |
| Descriptive Category Accuracy | 99 |
| IAB Tier 1 Category Accuracy | 97 |
| Key Entities Accuracy | 99 |
To ensure the reliability of Gemini’s structured outputs from the multimodal understanding stage, we conducted a systematic human evaluation across multiple dimensions of caption and metadata quality (Table 10). Three human annotators were involved in the process. Two annotators independently evaluated a set of 100 advertisements generated by Gemini. Each output was judged against the original advertisement image and text, assessing whether the generated caption, descriptive category, IAB Tier 1 category, and key entities accurately represented the ad content. To resolve cases of disagreement, a third annotator who had no stake or involvement in this work acted as an independent judge. For caption evaluation, given its natural language nature, we considered three sub-dimensions: Relevance, Correctness, and Informativeness. A caption was marked as Overall correct only if all three sub-dimensions were judged to be true. This adjudication procedure ensured that the evaluation results were consistent, unbiased, and suitable for supporting the accuracy of subsequent analyses and reconstruction tasks.
The evaluation results in Table 10 demonstrate that our multimodal understanding stage achieved consistently high accuracy across all assessed dimensions. In particular, caption were near-perfect, with an overall correctness of 99%. Likewise, the descriptive category, IAB Tier 1 classification, and key entity extraction all exhibited similarly strong performance. These findings indicate that the structured outputs produced by Gemini 2.0 Flash are highly robust and reliable, providing a strong foundation for the subsequent analysis and session-level and user-level reconstruction stages.
Appendix E Example of Human-Gemini Disagreement
In Figure 9, we further illustrate how human annotators evaluated Gemini’s caption quality across multiple dimensions. While the model-generated caption successfully identifies the product (Tesla Powerwall), the context (residential solar energy use), and the intended audience (homeowners), the human annotator flagged a factual error. Specifically, the highlighted sentence incorrectly describes the woman in the advertisement as holding a white cloth for cleaning or maintenance, which was judged as inaccurate. This example demonstrates how human evaluation can accept the topical relevance and coverage of a caption while still rejecting specific erroneous details. Importantly, it also shows that occasional minor errors do not undermine the overall utility of the generated captions, highlighting the robustness of our evaluation framework.