LAPTH-010/25
Cosmic-ray cooling by dark matter in astrophysical jets
Abstract
Astrophysical jets from powerful active galactic nuclei (AGN) have recently been proposed as promising probes of dark matter (DM) in the sub-GeV mass range. AGN launch relativistic jets that accelerate cosmic rays (CRs) to very high energies, which can then interact with their surroundings and produce multiwavelength (MW) emission spanning from radio frequencies to TeV rays. If DM consists of light particles, their interactions with CRs could lead to an additional cooling mechanism that modifies the expected MW emission. In this work, we analyse the MW spectrum of Markarian 421, a well-studied AGN, using a multizone leptonic jet model that includes the interactions between CR electrons and DM particles. For the first time, we account for the uncertainties in the astrophysical jet dynamics, which have been previously neglected when constraining the CR-DM interactions. By fitting simultaneously jet parameters and DM-electrons interactions, we use the MW data from Markarian 421 to set constraints on the DM-induced CR cooling. We obtain 5 upper limit for a DM mass of . We demonstrate that this is about a factor of five weaker than traditional approaches, implying that properly accounting for degeneracies between jet dynamics and DM interactions is key to derive robust constraints on DM interactions.
I Introduction
The existence of dark matter (DM) in the Universe is well established, but its nature remains elusive [1, 2, 3, 4, 5, 6]. The sub-GeV mass regime is largely unexplored [5], as current direct detection experiments are more sensitive to DM particles with masses above the GeV scale, owing to their limited sensitivity at low nuclear recoil energies. Various indirect detection strategies have been proposed to probe sub-GeV DM particles for masses still allowed by both Big Bang Nucleosynthesis (BBN) and direct-detection bounds [7, 8, 9, 10, 11, 12]. One possibility involves the interaction of DM particles with cosmic rays (CRs), which can result in two key effects. First, collisions between DM particles and CRs accelerated in astrophysical environments can produce a population of boosted DM particles, which may be detectable at the Earth [13, 14, 15, 16, 17, 18, 19, 20, 21, 22, 23, 24, 25, 26, 27, 28, 29, 30, 31, 32, 33, 34, 35, 36, 37, 38, 39, 40, 41, 42, 43]. Second, such interactions could act as a cooling mechanism for CRs, thereby perturbing their non-thermal emission [44, 45, 46, 47]. In the inelastic regime, they can also lead to the cascade production of secondary particles such as rays and neutrinos [48, 49, 50, 51, 52]. These secondary particles may compete against the products of the standard astrophysical particle-emission processes, making the identification of a DM signals challenging to disentangle from purely astrophysical signatures.
Active galactic nuclei (AGNs) are black holes (BHs) known to launch relativistic outflows that remain collimated over kpc distances. These outflows, known as jets, carry enough power to accelerate CRs to high energies, possibly beyond 1 PeV. The precise composition of CRs is still unknown, but both leptonic and hadronic scenarios are possible. Leptonic CRs can, in fact, explain the majority of the multiwavelength (MW) spectrum emitted for most sources, from radio to TeV rays [53, 54, 55]. In some cases, hadronic CRs are accelerated in jets and the interactions with the ambient medium lead to the formation of secondary particles; the stable ones are pairs of electrons and positrons, neutrinos and rays from neutral pion decay [56, 57]. Since the electromagnetic emission fails to distinguish the two scenarios, the neutrino emission represents the smoking gun for hadronic acceleration in AGN jets [58].
DM is present in galaxies according to astrophysical observations and simulations [59, 60]. Interestingly, in the vicinity of massive BHs at the center of galaxies, the DM density is expected to be enhanced. The adiabatic growth of BHs leads to a growth of the DM density, commonly referred to as DM spike [61]. The presence of the DM spike makes AGNs as ideal targets for the investigation of boosted DM signals and CR cooling due to CR-DM collisions. Previous works have analysed the expected detection of boosted DM signals considering TXS 0506+056 and BL Lacerta [26, 27]. Both these sources are well-studied AGNs, and the former in particular is the first blazar (an AGN launching a jet along the line of sight) correlated to an astrophysical neutrino. Refs. [45, 46, 47] have examined the CR cooling from DM-CR collisions for TXS 0506+056 and NGC 1068, a Seyfert galaxy correlated to a strong neutrino emission, to set bounds on the CR-DM cross-section. Such studies, however, lack a consistent investigation of the impact of the uncertainties of the dynamical properties of the astrophysical source on the constraints in the DM parameter space. On the other hand, Ref. [49] has performed a more consistent statistical analysis of the -ray flux of M82, a well-studied star forming galaxy, to examine the effects of the CR-DM interactions on the emitted spectrum. This approach is extremely promising to reveal a spectral deviation from the standard one for the case of blazars, especially when accompanied by a proper jet modelling.
In this work, we examine in a statistically self-consistent framework the effect of the uncertainty of the kinematics of astrophysical blazar jets in constraining the nature of the DM particles. We use in particular a multi-zone jet model developed to reproduce and predict the electromagnetic flux covering the entire MW spectrum from radio to very high energy rays [62]. We further develop this jet model (henceforth, we refer to the purely astrophysical case as BHJet) to include the CR electron cooling due to CR-DM collisions and examine the jet dynamical quantities that are most degenerate with a DM signal. We analyse in particular the emitted spectrum of the jets of Markarian 421, one of the brightest and nearby blazars. Markarian 421 is located at 1.22 Mpc at redshift 0.0308 from the Earth [63]. The mass of the BH is [64], which corresponds to a Schwarzschild radius of . Using the simultaneous and MW spectrum from radio to TeV rays, as presented by Ref. [65], we examine the parameter degeneracies and place constraints on the DM-electron cross section.
The paper is organized as follows. In Sec. II, we present the jet model, and in Sec. III we discuss the DM density profile and the CR cooling due to DM particles. In Sec. IV we discuss the methodology we follow, and in Sec. V we present the results of our analysis. Finally, we discuss our findings and conclude in Sec. VI.
II Cosmic-ray acceleration and cooling in jets
To capture the CR acceleration along the jet, as well as the jet launching and evolution, we use BHJet, a semi-analytical, multi-zone jet model [66, 67, 62]. We assume that the jets are launched close to the BH at distance , and they extend conically forming 100 jet segments along the jet axis . Each jet segment has cross-sectional radius and height 2, and it is described by its particle number density and its magnetic field strength . The jet base has a cross-sectional radius , and an equal number density of electrons and protons. The protons carry the bulk mass of the jet, whereas electrons form a thermal, relativistic, Maxwell-Jüttner distribution that peaks at keV. The total power of the jet base is distributed between the particles and the magnetic field.
At distance from the jet base, magnetic energy is dissipated into non-thermal particle energy. In particular, we assume that this jet segment has a magnetization given by , which represents the ratio between the magnetic field energy density and the rest mass energy density.
A fraction of the thermal electrons gets accelerated to non-thermal energies. The total number density of the non-thermal electrons is , where is the total electron number density at distance along the jet. These electrons are distributed in a non-thermal power law following the steady-state transport equation
| (1) |
Here, is the sum of the loss rate per physical process , and is the injected rate of non-thermal electrons per energy , where is the normalization and with and is the maximum attainable energy for each jet segment beyond . We assume for every jet segment, and we calculate by comparing the characteristic timescale of acceleration to the one for losses, including synchrotron, inverse Compton (IC) scattering, and escape. Namely,
| (2) | |||||
with
| (3) | |||||
| (4) | |||||
| (5) | |||||
| (6) |
In the above equations, is the acceleration efficiency of a diffusive shock-type acceleration [68], which we assume to be constant at , is the electron velocity, is the magnetic-field energy density, is the photon-field energy density, and is the cross-sectional radius of the jet at distance . The rest of the parameters are constants: is the electron rest mass and is the Thomson cross section.
Having calculated the non-thermal electron distribution, we derive the synchrotron radiation for each jet segment. Both expressions for the emissivity and the absorption are those of Ref. [69], where we assume cylindrical geometry for the jet segments [62]. For the IC scattering, we use the IC kernel given in Ref. [69], where the target photons are those produced due to synchrotron emission. In the following, we only examine the case of Markarian 421 where the -ray emission is dominated by leptonic processes. Hence, we neglect any hadronic radiation that could act as target for IC, as well as any external photon field. These two photon targets may be important in other source types.
Before discussing the fit of Markarian 421 MW spectrum, we first identify the key parameters that significantly affect it. Having explored different initial conditions and different jet dynamical quantities, we conclude that the most impactful parameters modifying the MW spectrum are the jet base injected power , the radius at the jet base and the location of the energy dissipation where particle acceleration kicks in . The last two parameters dictate the shape of the jet and hence its emission. We note that more parameters can alter the emitted spectrum, for instance the power-law index of the non-thermal particles. We discuss later on the impact of this specific parameter on our final results.
In Fig. 1, we show how variations in the three parameters affect the emitted spectrum in four representative cases. The jets propagate with a bulk Lorentz factor of 25 [65]. When the dissipation region is at (dashed orange line) instead of 10 Rg (solid blue line), the magnetic energy density is increased for a constant magnetization, and hence the synchrotron luminosity increases. When the jet base is larger, the size of the dissipation region increases as well. As a result, for a given magnetization, the magnetic energy density decreases, leading to lower synchrotron emission (dotted green line compared to solid blue line). Finally, when the injected power at the jet base is ten times larger, more energy is distributed in both the particles and the magnetic fields eventually leading to stronger total non-thermal emission (dotted-dashed red line compared to solid blue line). The spectral feature at is the synchrotron emission of the thermal electrons at the jet base.
III Dark matter and cosmic rays
III.1 DM profile and spike
The radial DM density profile, , is given by the expression (see e.g., Ref. [70]):
| (7) |
In general, towards the BH center, the density profile converges to the constant value, , which depends on the BH growth timescale , the DM mass , and the velocity-averaged DM self-annihilation cross section . Conversely, it is generally assumed that no DM is present within a radius of from the BH. The spike density takes the expression [61]:
| (8) |
with slope and extension
| (9) |
where for . Assuming , the DM profile beyond the spike radius evolves radially as a Navarro-Frenk-White (NFW) profile [71, 72]. Therefore, in addition to the quantity , the total DM profile is fully determined by the BH mass (which is often measured), the scale radius and the normalization .
We compute the quantities and as follows. We first determine the total DM halo mass 111This is also defined here as , and matches the definition of Ref. [73]. from the relation obtained in Ref. [73] through the observation of 55 nearby galaxies. Given the total DM halo mass, we compute the value of the radius – defined as the radius within which the average DM density is 200 times the critical value – from the relation [74]:
| (10) |
Then, we obtain the radius and its uncertainty using the results for the concentration parameter obtained in Ref. [75] according to the simulations at redshift discussed in Ref. [76]. Finally, the normalization of the profile can be determined by solving the equation:
| (11) |
We stress that this procedure differs from what was done in the previous literature (e.g. in Refs. [77, 70, 26, 27, 45]), but it is, in our opinion, a more self-consistent treatment to derive the DM halo parameters. Further details on the computation of the density profile, as well as a comparison with previous derivations, are provided in Appendix A. For the specific case of Markarian 421, we find the DM halo parameters reported in Tab. 1. For the entire analysis we assume non-annihilating DM particles , which leads to stronger bounds on the CR-DM interaction. The presence of self-annihilating DM particles would result in a reduced DM density of the spike in the regions close to the jet launching and particle acceleration, hence diminishing the target density of CR-DM collisions and weakening the final bounds. We will discuss the case of non-zero annihilation cross section in Sec. V.
| Parameter | Value |
|---|---|
| kpc | |
| kpc | |
III.2 CR cooling due to DM
The interaction between the accelerated CR electrons and DM particles leads to an additional energy-loss process which modifies the transport of CR electrons along the jets. The timescale in which CR-DM collisions occur is given by
| (12) |
with the energy loss of CR electrons defined as
| (13) |
The quantity represents the maximal allowed value for the kinetic energy of DM particles in a collision with an electron with kinetic energy , namely
| (14) |
The differential elastic DM-electron cross section takes the expression
| (15) |
where is the DM-electron cross section at zero center-of-mass momentum, is the reduced mass of DM and electron, is the center-of-mass energy, and is the momentum transfer.
To account for the CR cooling due to CR-DM collisions, we include the CR-DM timescale in the calculation of the non-thermal electron distribution in Eq. (1) as well as in the one of the in Eq. (2). The CR-DM cooling, indeed, affects not only the maximum energy of the accelerated CRs, but also the normalization of the CR power-law distribution. The emitted radiation can consequently differ significantly from the standard one, as we discuss below.
The CR-DM collisions lead to less energetic CR electrons, whose maximum energy is reduced compared to the scenario without DM. Fig. 2 shows the cooling timescales and the particle acceleration timescale for the case with and without DM cooling. More precisely, we plot the synchrotron emission (dashed red line), the IC scattering (dashed grey line) and the escape timescale (dot-dashed grey line) for the jet segment at . In the case of DM cooling, we assume and (solid blue line). In the case that there is DM cooling, the maximum electron energy drops slightly above 10 GeV, as shown by the leftmost vertical line.
IV Fitting method and dark matter upper limits
We explore the 3D parameter space defined by the astrophysical parameters to search for the best fit of the BHJet calculated emission to the steady state MW observations of Markarian 421 [65]. We choose to constrain the jet base power between and , where , the jet base radius between and , and the dissipation region to extend up to . We follow a standard procedure, namely we minimize the function
| (16) |
where is the observed flux at energy bin , is the expected flux, and the uncertainty of the observation. We focus on the data as collected during the steady state between 2008 August and 2009 June [65]. The dataset consists of simultaneous observations in the radio, infrared, X-ray and -ray bands [65]. The jet emission dominates all these wavelengths, with synchrotron emission peaking in the X-ray band and IC scattering in the -ray one. The X-ray emission, specifically, shows features of neutral photoelectric absorption in the interstellar emission and reflection effects, but their detailed study remains outside the scope of our analysis. To incorporate these phenomena in the uncertainty of our predicted flux, we force an increased systematic uncertainty of 20% of the observed flux in the X-ray band. This assumption also facilitates the numerical estimation of the minimum, which is otherwise hindered by the large number of data points.
Then, we set the upper limits of by jointly fitting the astrophysical parameters and the CR-DM scattering cross section to the MW data of Markarian 421, following the same procedure as above. More specifically, we perform individual scans of the 4D phase space for different values of the mass of the DM particles. To gauge the difference from the null hypothesis, namely the purely astrophysical scenario, we calculate the quantity , where the parameters are treated as nuisance parameters. We set bounds at confidence level requiring according to the Wilks theorem [78].
To make a direct comparison with the methodology adopted in previous analyses [45, 46, 47], albeit for other sources, we also compute the upper limits on by requiring that the CR-DM cooling timescale is 10 times faster than the total losses , namely,
| (17) |
In the case of Markarian 421, the total timescales of losses is given by , as the IC cooling is negligible along all jet segments in our case (see Fig. 2). We emphasize once more that we calculate the cooling timescales and the radiation for every jet segment beyond but the dominant radiative region is at . In outer segments, where the radius is increased and the magnetic field is decreased, the maximal attainable energy is decreasing. Following Refs. [45, 46, 47], for this comparative calculation, we fix the jet parameters to the values obtained from the best fit without CR-DM interactions.
V Results
Fig. 3 shows the best fit of the calculated jet emission to the MW observations of Markarian 421. We find the following best-fit parameters:
| (18) | |||||
Similarly to previous works, we confirm that the IC scattering explains the GeV-to-TeV observations [79, 80, 81, 82, 83, 84, 85, 86, 87, 88, 89, 90]. Following the procedure described in Sec. II, we find that the CR electrons are accelerated up to energies of 30 GeV due to energy losses (see Fig. 2). In Fig. 3, we also show the contribution of the thermal electrons at the jet base that peaks at Hz.
Fig. 4 shows instead the emitted spectrum of Markarian 421 considering the jets embedded in the DM spike with and . Through the joint DM-jet fit, we can still obtain a MW spectrum compatible with the observed MW data (solid line). In this case, CR electrons are accelerated up to energies of 10 GeV (see Fig. 2), while the new best-fit jet parameters are , , and .
Compared with the best-fit without DM (dashed line), both predicted spectra fit well the observational data with the main difference being in the cutoff of the emitted radiation, which has nonetheless larger errors compared to the rest of the spectral energy distribution data points. This difference in the emitted spectrum is due to the different maximum energy the CR electrons attain and the normalization of the non-thermal electrons that depends on the DM cooling.
For illustrative purposes, we also overlay the MW emission obtained when fixing the jet parameters to the best-fit values for the astrophysical-only model (same as in Fig. 3) and including the DM-CR interactions without re-fitting (dotted line). In this case, the effect of DM cooling is overestimated since there is no freedom of the astrophysical model, and degeneracies are not taken into account.
From this plot, we can therefore conclude that the presence of DM particles can significantly affect particle acceleration and subsequent non-thermal MW emission through elastic cooling, and that accounting for astrophysical uncertainties alters the overall effect of DM cooling to the spectral data.
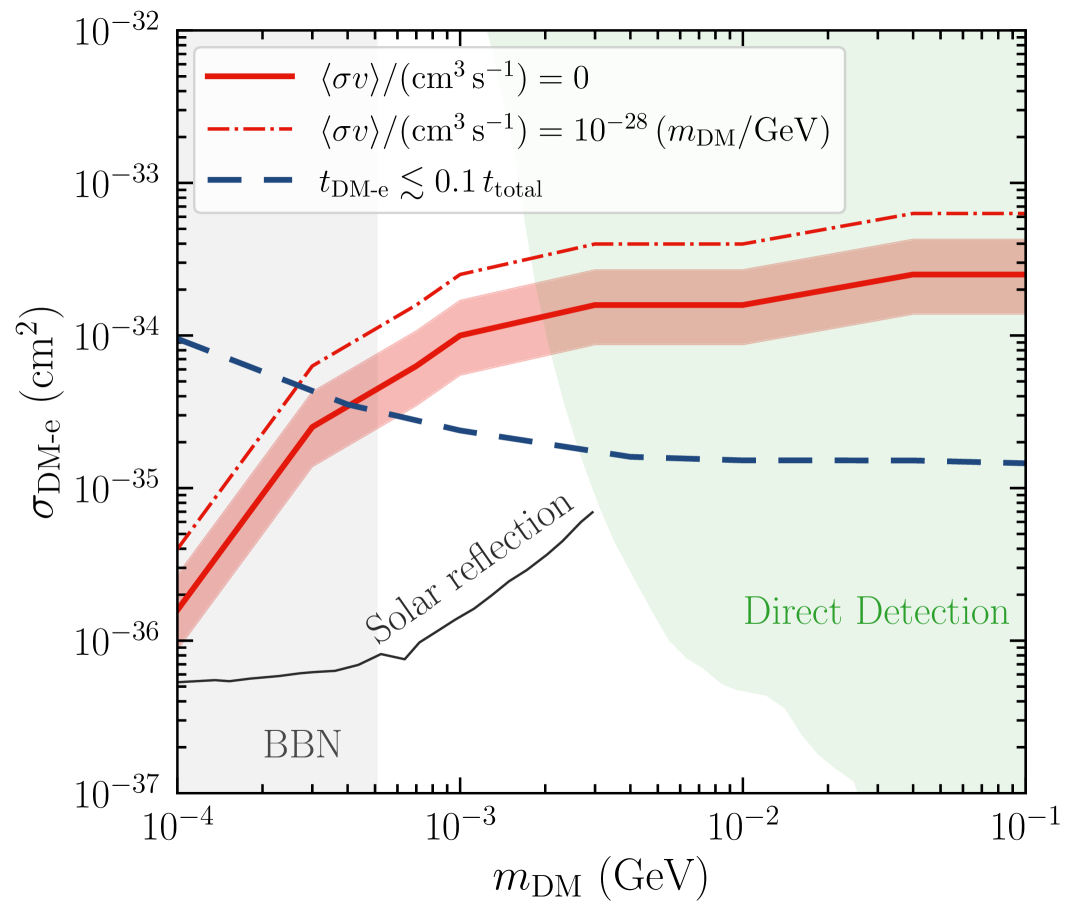
In Fig. 5, we present the upper limits on the DM–electron cross section for various DM particle masses. The bounds derived in this analysis are shown in red and blue colours, while previous constraints are indicated by the black line (solar reflection; [91]), and shaded grey (BBN; [7]) and green (direct detection; [8, 9, 10, 11, 12]) regions.
The red limits corresponds to the main results of this work, derived through a joint fit of the jet dynamics and the DM-CR interactions. The solid line represents the case of non-self-annihilating DM (), and the shaded region shows the upper bounds of accounting for the propagated uncertainties of and (see Table 1). Uncertainties from the DM distribution are no more than a factor of 1.7 for all masses.
The dot-dashed line corresponds to the more conservative upper limits in the case of self-annihilating DM with , a value that is in good agreement to recent constraints from X-ray observations with eROSITA [92], and also similar to previous works [27, 21, 45]. In this case, we obtain an upper bound of , i.e. times weaker limits compared to the non-self-annihilating scenario.
We also include the upper limits derived by following the “timescale” approach as described in Sec. IV using Eq. (17). The limit is = at 1 MeV as shown by the dashed blue line. We see that this approach leads to a slightly stronger upper bounds. This is because the jet model is fixed and therefore the degeneracies between jet parameters and DM are not properly taken into account and the effect of DM is overestimated, as we have seen in Fig. 4.
VI Discussion and Conclusions
In this work, for the first time, we examine the effect of sub-GeV DM on CR acceleration in jets assessing the uncertainties of the jet modelling. We focused on the MW emission of Markarian 421. By capturing jet physics and the CR acceleration with a simple analytical framework, we find the contribution of the jet emission of Markarian 421 to the MW spectrum for a purely astrophysical scenario. In this scenario, a power law of non-thermal CR electrons is formed in the dissipation region of the jets, where energy is dissipated to accelerate non-thermal particles [62]. The geometry and the jet power are the quantities that more strongly affect the emitted spectrum, hence, we performed a statistical analysis for three parameters, , , and . We find that a Poynting flux dominated jet that converts its magnetic energy to kinetic and non-thermal particles, can explain well the MW data of Markarian 421. We find that a non-thermal population of CR electrons with power-law index of 2 can explain well the radio observations. The -ray spectrum originates by IC scattering of synchrotron-produce electrons from the dissipation region of radius at distance from the jet base, in agreement with previous works [79, 80, 81, 82, 83, 84, 85, 86, 87, 88, 89, 90].
We then examine the scenario where DM particles constrain the CR acceleration via elastic collisions. First, we revisit the DM profile around the galactic center of Markarian 421 normalizing it by accounting for the entire DM halo (see Section III). We stress that we adopt a method in the normalization of the DM profile which is different from previous works, and yet, we believe, more consistent and precise. The difference between the peak of the calculated DM profile following our approach and the traditional ones is of the order of 1/50. Since the number density of DM particles scales linearly with the estimated CR cooling, the resulting upper limits in the CR-DM cross section may be overestimated by such a factor, cf. Appendix A.
We then perform a analysis where we fit for both the jet parameters , , and (similarly to the purely astrophysical scenario) and the CR-DM cross section for every different DM mass in the sub-GeV regime, as described in Sec. IV. Both scenarios, with and without CR cooling due to DM collisions, fit well the MW data with a reduced value close to 1.
We notice that our astrophysical model cannot perfectly match the X-ray data that show features of neutral photoelectric absorption in the interstellar emission and reflection effects. We have checked that the significance of these best fits significantly reduces when we include a 20% systematic uncertainty on X-ray data accounting for the astrophysical mis-modelling due to additional components. On the other hand, the upper limits we place on remain unaffected. Lower values of the uncertainty worsen the values of without altering the constraints of , hence no further modelling of the X-ray emission is required in our current setup.
To fully assess the impact of our new methodology, which combines in a joint fit the jet dynamics and the DM interactions, we have compared our limits with the ones derived through the “timescale approach”, as proposed in [45] albeit for another target. By adapting this approach to the case of Markarian 421, we demonstrate that fixing the CR-DM timescale to 10 times faster than the rest of the losses (see Eq. (17)) can misleadingly lead to stronger constraints, which fail to properly capture degeneracies with jet physics.
The constraints of are weaker compared to, for instance, searchers from Solar reflection [91], and yet complementary to them. A step forward in our work will be the analysis of other jetted sources which are neutrino candidates, so to include hadronic acceleration [93, 94, 95] and explore the effects of inelastic scattering between jet-accelerated CR and DM.
Our proposed method represents a viable and promising way to constrain light DM in a window where the reach of direct detection experiments is still limited. We have demonstrated that the inclusion of more accurate astrophysical models in the indirect DM searches is key to achieve robust results. Physical jet modelling in combination with a more extended coverage of the jet phase space is more crucial than ever: with the up-coming high-resolution facilities, such as the Cherenkov Telescope Array Observatory (CTAO), very precise spectral determination for AGNs beyond 30 GeV are expected, therefore enhancing the sensitivity to DM signatures in jets.
Acknowledgements.
We would like to thank Yoann Genolini for fruitful discussions on handling the data uncertainties, and Pierre Salati for discussions on the DM profiles. We would like to thank Pierre Aubert for his assistance on software acceleration, and the facilities offered by the Univ. Savoie Mont Blanc - CNRS/IN2P3 MUST computing center. DK and FC acknowledge funding from the French Programme d’investissements d’avenir through the Enigmass Labex, and from the “Agence Nationale de la Recherche”, grant number ANR-19-CE310005-01 (PI: F. Calore). MC acknowledges support from the research project TAsP (Theoretical Astroparticle Physics) funded by the Istituto Nazionale di Fisica Nucleare (INFN).References
- Bertone et al. [2005] G. Bertone, D. Hooper, and J. Silk, Particle dark matter: Evidence, candidates and constraints, Phys. Rept. 405, 279 (2005), arXiv:hep-ph/0404175 .
- Bertone and Hooper [2018] G. Bertone and D. Hooper, History of dark matter, Rev. Mod. Phys. 90, 045002 (2018), arXiv:1605.04909 [astro-ph.CO] .
- Kahlhoefer [2017] F. Kahlhoefer, Review of LHC Dark Matter Searches, Int. J. Mod. Phys. A 32, 1730006 (2017), arXiv:1702.02430 [hep-ph] .
- Aghanim et al. [2020] N. Aghanim et al. (Planck), Planck 2018 results. VI. Cosmological parameters, Astron. Astrophys. 641, A6 (2020), [Erratum: Astron.Astrophys. 652, C4 (2021)], arXiv:1807.06209 [astro-ph.CO] .
- Billard et al. [2022] J. Billard et al., Direct detection of dark matter—APPEC committee report*, Rept. Prog. Phys. 85, 056201 (2022), arXiv:2104.07634 [hep-ex] .
- Alves Batista et al. [2021] R. Alves Batista et al., EuCAPT White Paper: Opportunities and Challenges for Theoretical Astroparticle Physics in the Next Decade (2021), arXiv:2110.10074 [astro-ph.HE] .
- Knapen et al. [2017] S. Knapen, T. Lin, and K. M. Zurek, Light Dark Matter: Models and Constraints, Phys. Rev. D 96, 115021 (2017), arXiv:1709.07882 [hep-ph] .
- Angloher et al. [2016] G. Angloher et al. (CRESST), Results on light dark matter particles with a low-threshold CRESST-II detector, Eur. Phys. J. C 76, 25 (2016), arXiv:1509.01515 [astro-ph.CO] .
- Emken and Kouvaris [2018] T. Emken and C. Kouvaris, How blind are underground and surface detectors to strongly interacting Dark Matter?, Phys. Rev. D 97, 115047 (2018), arXiv:1802.04764 [hep-ph] .
- Angloher et al. [2017] G. Angloher et al. (CRESST), Results on MeV-scale dark matter from a gram-scale cryogenic calorimeter operated above ground, Eur. Phys. J. C 77, 637 (2017), arXiv:1707.06749 [astro-ph.CO] .
- Kouvaris and Pradler [2017] C. Kouvaris and J. Pradler, Probing sub-GeV Dark Matter with conventional detectors, Phys. Rev. Lett. 118, 031803 (2017), arXiv:1607.01789 [hep-ph] .
- Dolan et al. [2018] M. J. Dolan, F. Kahlhoefer, and C. McCabe, Directly detecting sub-GeV dark matter with electrons from nuclear scattering, Phys. Rev. Lett. 121, 101801 (2018), arXiv:1711.09906 [hep-ph] .
- Bringmann and Pospelov [2019] T. Bringmann and M. Pospelov, Novel direct detection constraints on light dark matter, Phys. Rev. Lett. 122, 171801 (2019), arXiv:1810.10543 [hep-ph] .
- Ema et al. [2019] Y. Ema, F. Sala, and R. Sato, Light Dark Matter at Neutrino Experiments, Phys. Rev. Lett. 122, 181802 (2019), arXiv:1811.00520 [hep-ph] .
- Giudice et al. [2018] G. F. Giudice, D. Kim, J.-C. Park, and S. Shin, Inelastic Boosted Dark Matter at Direct Detection Experiments, Phys. Lett. B 780, 543 (2018), arXiv:1712.07126 [hep-ph] .
- Bondarenko et al. [2020] K. Bondarenko, A. Boyarsky, T. Bringmann, M. Hufnagel, K. Schmidt-Hoberg, and A. Sokolenko, Direct detection and complementary constraints for sub-GeV dark matter, JHEP 03, 118, arXiv:1909.08632 [hep-ph] .
- Cappiello and Beacom [2019] C. V. Cappiello and J. F. Beacom, Strong New Limits on Light Dark Matter from Neutrino Experiments, Phys. Rev. D 100, 103011 (2019), [Erratum: Phys.Rev.D 104, 069901 (2021)], arXiv:1906.11283 [hep-ph] .
- Alvey et al. [2019] J. Alvey, M. Campos, M. Fairbairn, and T. You, Detecting Light Dark Matter via Inelastic Cosmic Ray Collisions, Phys. Rev. Lett. 123, 261802 (2019), arXiv:1905.05776 [hep-ph] .
- Dent et al. [2020] J. B. Dent, B. Dutta, J. L. Newstead, and I. M. Shoemaker, Bounds on Cosmic Ray-Boosted Dark Matter in Simplified Models and its Corresponding Neutrino-Floor, Phys. Rev. D 101, 116007 (2020), arXiv:1907.03782 [hep-ph] .
- Berger et al. [2021] J. Berger, Y. Cui, M. Graham, L. Necib, G. Petrillo, D. Stocks, Y.-T. Tsai, and Y. Zhao, Prospects for detecting boosted dark matter in DUNE through hadronic interactions, Phys. Rev. D 103, 095012 (2021), arXiv:1912.05558 [hep-ph] .
- Wang et al. [2020] W. Wang, L. Wu, J. M. Yang, H. Zhou, and B. Zhu, Cosmic ray boosted sub-GeV gravitationally interacting dark matter in direct detection, JHEP 12, 072, [Erratum: JHEP 02, 052 (2021)], arXiv:1912.09904 [hep-ph] .
- Ema et al. [2021] Y. Ema, F. Sala, and R. Sato, Neutrino experiments probe hadrophilic light dark matter, SciPost Phys. 10, 072 (2021), arXiv:2011.01939 [hep-ph] .
- Guo et al. [2020] G. Guo, Y.-L. S. Tsai, and M.-R. Wu, Probing cosmic-ray accelerated light dark matter with IceCube, JCAP 10, 049, arXiv:2004.03161 [astro-ph.HE] .
- Jho et al. [2020] Y. Jho, J.-C. Park, S. C. Park, and P.-Y. Tseng, Leptonic New Force and Cosmic-ray Boosted Dark Matter for the XENON1T Excess, Phys. Lett. B 811, 135863 (2020), arXiv:2006.13910 [hep-ph] .
- Dent et al. [2021] J. B. Dent, B. Dutta, J. L. Newstead, I. M. Shoemaker, and N. T. Arellano, Present and future status of light dark matter models from cosmic-ray electron upscattering, Phys. Rev. D 103, 095015 (2021), arXiv:2010.09749 [hep-ph] .
- Wang et al. [2022] J.-W. Wang, A. Granelli, and P. Ullio, Direct Detection Constraints on Blazar-Boosted Dark Matter, Phys. Rev. Lett. 128, 221104 (2022), arXiv:2111.13644 [astro-ph.HE] .
- Granelli et al. [2022] A. Granelli, P. Ullio, and J.-W. Wang, Blazar-boosted dark matter at Super-Kamiokande, JCAP 07 (07), 013, arXiv:2202.07598 [astro-ph.HE] .
- Bell et al. [2021] N. F. Bell, J. B. Dent, B. Dutta, S. Ghosh, J. Kumar, J. L. Newstead, and I. M. Shoemaker, Cosmic-ray upscattered inelastic dark matter, Phys. Rev. D 104, 076020 (2021), arXiv:2108.00583 [hep-ph] .
- Feng et al. [2022] J.-C. Feng, X.-W. Kang, C.-T. Lu, Y.-L. S. Tsai, and F.-S. Zhang, Revising inelastic dark matter direct detection by including the cosmic ray acceleration, JHEP 04, 080, arXiv:2110.08863 [hep-ph] .
- Das and Sen [2021] A. Das and M. Sen, Boosted dark matter from diffuse supernova neutrinos, Phys. Rev. D 104, 075029 (2021), arXiv:2104.00027 [hep-ph] .
- Xia et al. [2022] C. Xia, Y.-H. Xu, and Y.-F. Zhou, Production and attenuation of cosmic-ray boosted dark matter, JCAP 02 (02), 028, arXiv:2111.05559 [hep-ph] .
- Xia et al. [2023] C. Xia, Y.-H. Xu, and Y.-F. Zhou, Azimuthal asymmetry in cosmic-ray boosted dark matter flux, Phys. Rev. D 107, 055012 (2023), arXiv:2206.11454 [hep-ph] .
- Kachulis et al. [2018] C. Kachulis et al. (Super-Kamiokande), Search for Boosted Dark Matter Interacting With Electrons in Super-Kamiokande, Phys. Rev. Lett. 120, 221301 (2018), arXiv:1711.05278 [hep-ex] .
- Andriamirado et al. [2021] M. Andriamirado et al. (PROSPECT), Limits on sub-GeV dark matter from the PROSPECT reactor antineutrino experiment, Phys. Rev. D 104, 012009 (2021), arXiv:2104.11219 [hep-ex] .
- Cui et al. [2022] X. Cui et al. (PandaX-II), Search for Cosmic-Ray Boosted Sub-GeV Dark Matter at the PandaX-II Experiment, Phys. Rev. Lett. 128, 171801 (2022), arXiv:2112.08957 [hep-ex] .
- Xu et al. [2022] R. Xu et al. (CDEX), Constraints on sub-GeV dark matter boosted by cosmic rays from the CDEX-10 experiment at the China Jinping Underground Laboratory, Phys. Rev. D 106, 052008 (2022), arXiv:2201.01704 [hep-ex] .
- Maity and Laha [2024] T. N. Maity and R. Laha, Cosmic-ray boosted dark matter in Xe-based direct detection experiments, Eur. Phys. J. C 84, 117 (2024), arXiv:2210.01815 [hep-ph] .
- De Romeri et al. [2024] V. De Romeri, A. Majumdar, D. K. Papoulias, and R. Srivastava, XENONnT and LUX-ZEPLIN constraints on DSNB-boosted dark matter, JCAP 03, 028, arXiv:2309.04117 [hep-ph] .
- Xia et al. [2024] C. Xia, C.-Y. Xing, and Y.-H. Xu, Boosted dark matter from Centaurus A and its detection, JHEP 03, 076, arXiv:2401.03772 [hep-ph] .
- Cappiello et al. [2024] C. V. Cappiello, Q. Liu, G. Mohlabeng, and A. C. Vincent, Cosmic ray-boosted dark matter at IceCube, Phys. Rev. D 110, 095031 (2024), arXiv:2405.00086 [hep-ph] .
- Gustafson et al. [2025a] R. A. Gustafson, G. Herrera, M. Mukhopadhyay, K. Murase, and I. M. Shoemaker, Cosmic-ray boosted inelastic dark matter from neutrino-emitting active galactic nuclei, (2025a), arXiv:2508.20984 [hep-ph] .
- Li et al. [2025] L. Li, C.-T. Lu, A. K. Mishra, L. Su, and L. Wu, Enhanced Cosmic-Ray Cooling in AGN from Dark Matter Deep Inelastic Scattering, (2025), arXiv:2509.11906 [hep-ph] .
- Chen et al. [2025] Z. Chen, S.-F. Ge, J. Li, J. Pei, F. Yang, and C. Zhang, Dark Parton Shower Effects for Cosmic Ray Boosted Dark Matter, (2025), arXiv:2509.12007 [hep-ph] .
- Cappiello et al. [2019] C. V. Cappiello, K. C. Y. Ng, and J. F. Beacom, Reverse Direct Detection: Cosmic Ray Scattering With Light Dark Matter, Phys. Rev. D 99, 063004 (2019), arXiv:1810.07705 [hep-ph] .
- Herrera and Murase [2024] G. Herrera and K. Murase, Probing light dark matter through cosmic-ray cooling in active galactic nuclei, Phys. Rev. D 110, L011701 (2024), arXiv:2307.09460 [hep-ph] .
- Gustafson et al. [2025b] R. A. Gustafson, G. Herrera, M. Mukhopadhyay, K. Murase, and I. M. Shoemaker, Cosmic-ray cooling in active galactic nuclei as a new probe of inelastic dark matter, Phys. Rev. D 111, L121303 (2025b), arXiv:2408.08947 [hep-ph] .
- Mishra et al. [2025] A. K. Mishra, N. Liu, and C.-T. Lu, Probing Gauged Sub-GeV Dark Matter via Cosmic Ray Cooling in Active Galactic Nuclei, (2025), arXiv:2504.03409 [hep-ph] .
- Gorchtein et al. [2010] M. Gorchtein, S. Profumo, and L. Ubaldi, Probing Dark Matter with AGN Jets, Phys. Rev. D 82, 083514 (2010), [Erratum: Phys.Rev.D 84, 069903 (2011)], arXiv:1008.2230 [astro-ph.HE] .
- Ambrosone et al. [2023] A. Ambrosone, M. Chianese, D. F. G. Fiorillo, A. Marinelli, and G. Miele, Starburst Galactic Nuclei as Light Dark Matter Laboratories, Phys. Rev. Lett. 131, 111003 (2023), arXiv:2210.05685 [astro-ph.HE] .
- Lu et al. [2024] K. Lu, Y.-L. S. Tsai, Q. Yuan, and L. Zhang, Inelastic Scattering of Dark Matter with Heavy Cosmic Rays, Res. Astron. Astrophys. 24, 065007 (2024), arXiv:2310.12501 [astro-ph.HE] .
- De Marchi et al. [2024] A. G. De Marchi, A. Granelli, J. Nava, and F. Sala, Did IceCube discover Dark Matter around Blazars?, (2024), arXiv:2412.07861 [astro-ph.HE] .
- De Marchi et al. [2025] A. G. De Marchi, A. Granelli, J. Nava, and F. Sala, Diffuse astrophysical neutrinos from dark matter around blazars, (2025), arXiv:2506.06416 [hep-ph] .
- Ghisellini et al. [2010] G. Ghisellini, F. Tavecchio, L. Foschini, G. Ghirlanda, L. Maraschi, and A. Celotti, General physical properties of bright Fermi blazars, Mon. Not. Roy. Astron. Soc. 402, 497 (2010), arXiv:0909.0932 [astro-ph.CO] .
- Ghisellini et al. [2014] G. Ghisellini, F. Tavecchio, L. Maraschi, A. Celotti, and T. Sbarrato, The power of relativistic jets is larger than the luminosity of their accretion disks, Nature 515, 376 (2014), arXiv:1411.5368 [astro-ph.HE] .
- Baldini et al. [2021] L. Baldini et al. (Fermi-LAT), Catalog of Long-term Transient Sources in the First 10 yr of Fermi-LAT Data, Astrophys. J. Supp. 256, 13 (2021), arXiv:2106.00100 [astro-ph.HE] .
- Petropoulou et al. [2015] M. Petropoulou, S. Dimitrakoudis, P. Padovani, A. Mastichiadis, and E. Resconi, Photohadronic origin of -ray BL Lac emission: implications for IceCube neutrinos, Mon. Not. Roy. Astron. Soc. 448, 2412 (2015), arXiv:1501.07115 [astro-ph.HE] .
- Cerruti et al. [2015] M. Cerruti, A. Zech, C. Boisson, and S. Inoue, A hadronic origin for ultra-high-frequency-peaked BL Lac objects, Mon. Not. Roy. Astron. Soc. 448, 910 (2015), arXiv:1411.5968 [astro-ph.HE] .
- Aartsen et al. [2018] M. G. Aartsen et al. (IceCube), Neutrino emission from the direction of the blazar TXS 0506+056 prior to the IceCube-170922A alert, Science 361, 147 (2018), arXiv:1807.08794 [astro-ph.HE] .
- Iocco et al. [2015] F. Iocco, M. Pato, and G. Bertone, Evidence for dark matter in the inner Milky Way, Nature Phys. 11, 245 (2015), arXiv:1502.03821 [astro-ph.GA] .
- Werhahn et al. [2021] M. Werhahn, C. Pfrommer, P. Girichidis, and G. Winner, Cosmic rays and non-thermal emission in simulated galaxies – II. -ray maps, spectra, and the far-infrared–-ray relation, Mon. Not. Roy. Astron. Soc. 505, 3295 (2021), arXiv:2105.11463 [astro-ph.HE] .
- Gondolo and Silk [1999] P. Gondolo and J. Silk, Dark matter annihilation at the galactic center, Phys. Rev. Lett. 83, 1719 (1999), arXiv:astro-ph/9906391 .
- Lucchini et al. [2022] M. Lucchini, C. Ceccobello, S. Markoff, Y. Kini, A. Chhotray, R. M. T. Connors, P. Crumley, H. Falcke, D. Kantzas, and D. Maitra, Bhjet: a public multizone, steady state jet + thermal corona spectral model, Mon. Not. Roy. Astron. Soc. 517, 5853 (2022), arXiv:2108.12011 [astro-ph.HE] .
- Sbarufatti et al. [2005] B. Sbarufatti, A. Treves, and R. Falomo, Imaging redshifts of BL Lac objects, Astrophys. J. 635, 173 (2005), arXiv:astro-ph/0508200 .
- Barth et al. [2003] A. J. Barth, L. C. Ho, and W. L. W. Sargent, The Black hole masses and host galaxies of BL Lac objects, Astrophys. J. 583, 134 (2003), arXiv:astro-ph/0209562 .
- Bartoli et al. [2016] B. Bartoli et al. (ARGO-YBJ), 4.5 Years of Multi-wavelength Observations of mrk 421 During the Argo-ybj and Fermi Common Operation Time, Astrophys. J. Suppl. 222, 6 (2016), arXiv:1511.06851 [astro-ph.HE] .
- Markoff et al. [2003] S. Markoff, M. Nowak, S. Corbel, R. P. Fender, and H. Falcke, Exploring the role of jets in the radio / X-ray correlations of GX 339-4, Astron. Astrophys. 397, 645 (2003), arXiv:astro-ph/0210439 .
- Markoff et al. [2005] S. Markoff, M. A. Nowak, and J. Wilms, Going with the flow: can the base of jets subsume the role of compact accretion disk coronae?, Astrophys. J. 635, 1203 (2005), arXiv:astro-ph/0509028 .
- Jokipii [1987] J. Jokipii, Rate of energy gain and maximum energy in diffusive shock acceleration, ApJ 313, 842 (1987).
- Blumenthal and Gould [1970] G. R. Blumenthal and R. J. Gould, Bremsstrahlung, synchrotron radiation, and compton scattering of high-energy electrons traversing dilute gases, Rev. Mod. Phys. 42, 237 (1970).
- Lacroix et al. [2017] T. Lacroix, M. Karami, A. E. Broderick, J. Silk, and C. Boehm, Unique probe of dark matter in the core of M87 with the Event Horizon Telescope, Phys. Rev. D 96, 063008 (2017), arXiv:1611.01961 [astro-ph.GA] .
- Navarro et al. [1996] J. F. Navarro, C. S. Frenk, and S. D. M. White, The Structure of cold dark matter halos, Astrophys. J. 462, 563 (1996), arXiv:astro-ph/9508025 .
- Navarro et al. [1997] J. F. Navarro, C. S. Frenk, and S. D. M. White, A Universal density profile from hierarchical clustering, Astrophys. J. 490, 493 (1997), arXiv:astro-ph/9611107 .
- Marasco et al. [2021] A. Marasco, G. Cresci, L. Posti, F. Fraternali, F. Mannucci, A. Marconi, F. Belfiore, and S. M. Fall, A universal relation between the properties of supermassive black holes, galaxies, and dark matter haloes, Mon. Not. Roy. Astron. Soc. 507, 4274 (2021), arXiv:2105.10508 [astro-ph.GA] .
- Boudaud et al. [2021] M. Boudaud, T. Lacroix, M. Stref, J. Lavalle, and P. Salati, In-depth analysis of the clustering of dark matter particles around primordial black holes. Part I. Density profiles, JCAP 08, 053, arXiv:2106.07480 [astro-ph.CO] .
- Asgari et al. [2023] M. Asgari, A. J. Mead, and C. Heymans, The halo model for cosmology: a pedagogical review 10.21105/astro.2303.08752 (2023), arXiv:2303.08752 [astro-ph.CO] .
- Ishiyama et al. [2021] T. Ishiyama et al., The Uchuu simulations: Data Release 1 and dark matter halo concentrations, Mon. Not. Roy. Astron. Soc. 506, 4210 (2021), arXiv:2007.14720 [astro-ph.CO] .
- Lacroix et al. [2015] T. Lacroix, C. Bœhm, and J. Silk, Ruling out thermal dark matter with a black hole induced spiky profile in the M87 galaxy, Phys. Rev. D 92, 043510 (2015), arXiv:1505.00785 [astro-ph.GA] .
- Wilks [1938] S. S. Wilks, The Large-Sample Distribution of the Likelihood Ratio for Testing Composite Hypotheses, Annals Math. Statist. 9, 60 (1938).
- Ghisellini et al. [1996] G. Ghisellini, L. Maraschi, and L. Dondi, Diagnostics of Inverse-Compton models for the -ray emission of 3C 279 and MKN 421., A&AS 120, 503 (1996).
- Mastichiadis and Kirk [1997] A. Mastichiadis and J. G. Kirk, Variability in the synchrotron self-compton model of blazar emission, Astron. Astrophys. 320, 19 (1997), arXiv:astro-ph/9610058 .
- Tavecchio et al. [1998] F. Tavecchio, L. Maraschi, and G. Ghisellini, Constraints on the physical parameters of TeV blazars, Astrophys. J. 509, 608 (1998), arXiv:astro-ph/9809051 .
- Tavecchio et al. [2001] F. Tavecchio, L. Maraschi, E. Pian, L. Chiappetti, A. Celotti, G. Fossati, G. Ghisellini, E. Palazzi, C. M. Raiteri, R. M. Sambruna, A. Treves, C. M. Urry, M. Villata, and A. Djannati-Ataï, Theoretical Implications from the Spectral Evolution of Markarian 501 Observed with BeppoSAX, ApJ 554, 725 (2001).
- Konopelko et al. [2003] A. K. Konopelko, A. Mastichiadis, J. G. Kirk, O. C. de Jager, and F. W. Stecker, Modeling the TeV gamma-ray spectra of two low redshift AGNs: Mkn 501 and Mkn 421, Astrophys. J. 597, 851 (2003), arXiv:astro-ph/0302049 .
- Finke et al. [2008] J. D. Finke, C. D. Dermer, and M. Böttcher, Synchrotron Self-Compton Analysis of TeV X-ray Selected BL Lacertae Objects, Astrophys. J. 686, 181 (2008), arXiv:0802.1529 [astro-ph] .
- Bartoli et al. [2011] B. Bartoli et al. (ARGO-YBJ), Long-term monitoring of the TeV emission from Mrk 421 with the ARGO-YBJ experiment, Astrophys. J. 734, 110 (2011), arXiv:1106.0896 [astro-ph.HE] .
- Takahashi et al. [2013] K. Takahashi, M. Mori, K. Ichiki, S. Inoue, and H. Takami, Lower Bounds on Magnetic Fields in Intergalactic Voids from Long-term GeV-TeV Light Curves of the Blazar Mrk 421, Astrophys. J. Lett. 771, L42 (2013), arXiv:1303.3069 [astro-ph.CO] .
- Petropoulou et al. [2014] M. Petropoulou, E. Lefa, S. Dimitrakoudis, and A. Mastichiadis, One-zone synchrotron self-Compton model for the core emission of Centaurus A revisited, Astron. Astrophys. 562, A12 (2014), arXiv:1311.1119 [astro-ph.HE] .
- Acciari et al. [2014] V. A. Acciari et al., Observation of Markarian 421 in TeV gamma rays over a 14-year time span, Astropart. Phys. 54, 1 (2014), arXiv:1310.8150 [astro-ph.HE] .
- Abdo et al. [2014] A. A. Abdo et al., The Study of TeV Variability and the Duty Cycle of Mrk 421 from 3 Yr of Observations with the Milagro Observatory, Astrophys. J. 782, 110 (2014), arXiv:1401.2161 [astro-ph.HE] .
- Nilsson et al. [2018] K. Nilsson et al., Long-term optical monitoring of TeV emitting blazars - I. Data analysis, Astron. Astrophys. 620, A185 (2018), arXiv:1810.01751 [astro-ph.HE] .
- An et al. [2018] H. An, M. Pospelov, J. Pradler, and A. Ritz, Directly Detecting MeV-scale Dark Matter via Solar Reflection, Phys. Rev. Lett. 120, 141801 (2018), [Erratum: Phys.Rev.Lett. 121, 259903 (2018)], arXiv:1708.03642 [hep-ph] .
- Balaji et al. [2025] S. Balaji, D. Cleaver, P. De la Torre Luque, and M. Michailidis, Dark Matter in X-rays: Revised XMM-Newton Limits and New Constraints from eROSITA (2025), arXiv:2506.02310 [hep-ph] .
- Kantzas et al. [2020] D. Kantzas et al., A new lepto-hadronic model applied to the first simultaneous multiwavelength data set for Cygnus X–1, Mon. Not. Roy. Astron. Soc. 500, 2112 (2020), arXiv:2010.08501 [astro-ph.HE] .
- Kantzas et al. [2023] D. Kantzas, S. Markoff, M. Lucchini, C. Ceccobello, and K. Chatterjee, Exploring the role of composition and mass loading on the properties of hadronic jets, Mon. Not. Roy. Astron. Soc. 520, 6017 (2023), arXiv:2301.06382 [astro-ph.HE] .
- Dekker et al. [2025] A. Dekker, G. Herrera, and D. Kantzas, Axion-like particle limits from multi-messenger sources (2025), arXiv:2506.14659 [hep-ph] .
- Di Matteo et al. [2003] T. Di Matteo, R. A. C. Croft, V. Springel, and L. Hernquist, Black hole growth and activity in a lambda CDM universe, Astrophys. J. 593, 56 (2003), arXiv:astro-ph/0301586 .
Appendix A DM profile
In Fig. 6 we plot the relation based on the observations of Ref. [73]. In case of Markarian 421, which has a BH mass of [64], we get (orange square). Previous analyses have instead used the empirical equation of Ref. [96] which in our case implies (black diamond). Having calculated the mass of the halo, which is equal to , we can find the value of the concentration based on the simulations of Ref. [76]. For the case of Markarian 421, the integrated value from the simulations is , that results in and .
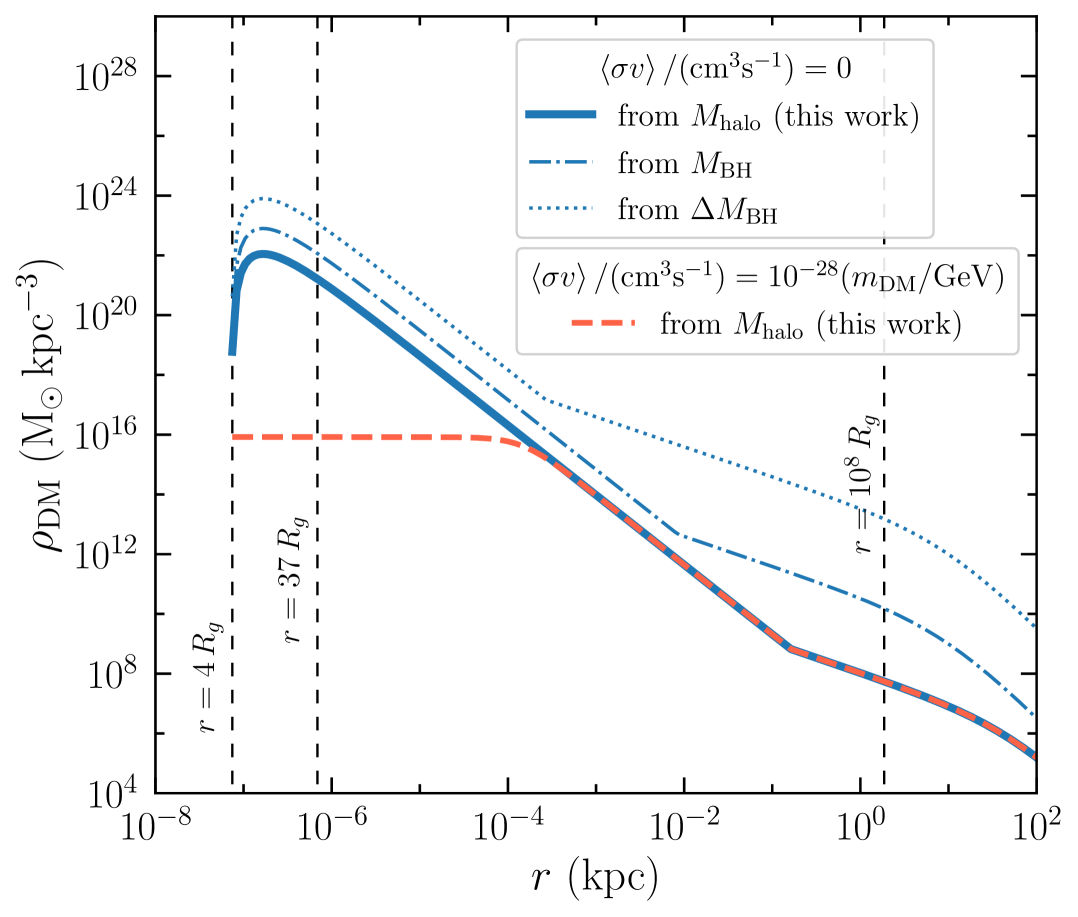
In Fig. 7, we show the DM profile defined in Eq. (7) as a function of the radial distance from the BH as obtained in the present work considering non-self-annihilating DM particles (solid blue line) and self-annihilating DM particles with (dashed red line). We also plot for comparison the DM profile for non-self-annihilating DM particles which is obtained according to two different approaches adopted in previous works [77, 70, 26, 27, 45]. Namely, assuming a constant kpc, we derive the normalization from integrating the DM mass up to the spike radius defined in Eq. (9), and then equating this mass to the BH mass (dot-dashed blue line) or its uncertainty (dotted blue line). We find and , respectively. The difference between the peak of the calculated DM profile following the proper approach and the approximated one is of the order of 1/50. Since the number density of DM particles scales linearly with the estimated CR cooling, the resulting upper limits in the CR-DM cross section may be overestimated by a such a factor.