Network representations reveal structured uncertainty in music
Abstract
Music, as a structured yet perceptually rich experience, can be modeled as a network to uncover how humans encode and process auditory information. While network-based representations of music are increasingly common, the impact of feature selection on structural properties and cognitive alignment remains underexplored. In this study, we evaluated eight network models, each constructed from symbolic representations of piano compositions using distinct combinations of pitch, octave, duration, and interval, designed to be representative of existing approaches in the literature. By comparing these models through topological metrics, entropy analysis, and divergence with respect to inferred cognitive representations, we assessed both their structural and perceptual efficiency. Our findings reveal that simpler, feature-specific models (e.g., pitch or duration alone) better match human perception, whereas complex, multidimensional representations introduce cognitive inefficiencies. These results support the view that humans rely on modular, parallel cognitive networks—-an architecture consistent with theories of predictive processing and free energy minimization. Moreover, we find that musical networks are structurally organized to guide attention toward transitions that are both uncertain and inferable. The resulting structure concentrates uncertainty in a few frequently visited nodes, creating local entropy gradients that alternate between stable and unpredictable regions, thereby enabling the expressive dynamics of tension and release that define the musical experience. These findings show that network structures make the organization of uncertainty in music observable, offering new insight into how patterned flows of expectation shape perception, and open new directions for studying how musical structures evolve across genres, cultures, and historical periods through the lens of network science.
I Introduction
Music is a highly complex and structured phenomenon involving the organization of sound, characterized by intricate relationships between its elements across multiple dimensions. Understanding this complexity requires an analytical framework capable of capturing both local and global patterns within musical compositions. Moreover, the study of music is essential for discovering the neural and cognitive mechanisms that foster creativity and shape human brain function, positioning it as a cornerstone in interdisciplinary research on cognition and human behavior Koelsch (2014); Koelsch et al. (2019).
From a structural perspective, music can be conceptualized as a network, where nodes represent pitches, chords, or note durations, while edges capture the transitions between these elements, defining the overall organization of a composition. When using this network perspective Liu et al. (2009); Ferretti (2017); Gomez et al. (2014); serrà_corral_boguñá_haro_arcos_2012; Nardelli (2023); Kulkarni et al. (2024); Rolla et al. (2018); Mrad et al. ; Frottier et al. (2022), classical music has been suggested to exhibit small-world properties Liu et al. (2009); Ferretti (2017) including high clustering coefficients Liu et al. (2009); Kulkarni et al. (2024) and long-tailed degree distributions Gomez et al. (2014). Furthermore, analyses of its sequential organization reveal statistical regularities—such as Zipf’s and Heaps’ laws Manaris et al. (2005); Serra-Peralta et al. (2021) that underscore the inherent complexity of its structure.
Drawing on the concept of predictive processing, network-based analyses similarly reveal structural patterns that may underlie the perceptual encoding and efficient communication of musical information. In recent studies, this human perception perspective has been introduced in Lynn et al. (2020a), focusing on how efficiently these structures support the encoding and communication of musical information Kulkarni et al. (2024). The results suggest that certain properties of note transition networks —mainly clustering coefficient and degree heterogeneity— may align with cognitive efficiency principles. However, given the inherent multidimensionality of music, analyzing individual network representations in isolation—such as note transition networks—provides only a partial understanding of its organization. There is a lack of systematic comparison regarding how different combinations of musical elements—such as pitch, duration, and harmonic groupings—affect the resulting network topology. This gap highlights the need to explore how feature definition—hence using different viewpoints—impact the network’s ability to represent the complexity and structure of music. A more integrative approach, where multiple network representations are applied simultaneously, is necessary to uncover which structural properties emerge across musical dimensions Buongiorno Nardelli (2020) and how these resulting topologies, in turn, affect human perception and cognitive processing.
In this study, we explored the relationship between various music network representations and their efficiency in transmitting information and aligning with human perception. Informed by a comprehensive review of network approaches leveraging diverse musical features, we propose a representative set of models for comparative analysis. These models were applied to two classical music datasets Krueger (2018); Dorfer et al. (2019) to evaluate their network properties, information content (entropy), and communication efficiency. The musical sequence analysis, in which information content is assessed across viewpoints Conklin and Witten (1995), inspired the investigation of how different network structures compare in their ability to capture musically relevant organizations. In line with the principle of free energy in music Friston (2010), which states that the brain’s perception of music is an active process of minimizing surprise or prediction errors to obtain pleasure or reward by matching expectations, we examined which representations align best with human perception mechanisms, providing insight into how musical structures are tuned for cognitive processing.
Our study is driven by three primary objectives. First, we systematically compared how different musical features, defining distinct viewpoints over the musical sequence, influence the resulting network properties, thus clarifying the impact of various modeling approaches on analytical conclusions. Second, we assessed the information structure within these networks through entropy measures to reveal how musical information is organized, both globally and locally—examining where uncertainty is concentrated and how it is distributed across the network. Third, by integrating these quantitative analyses within a human perception framework Lynn et al. (2020a), we investigated which network representations best align with the cognitive processes underlying musical understanding. In particular, we examined whether simpler network models—built from fewer and more abstract musical features—can achieve greater perceptual fidelity and cognitive efficiency. Additionally, we explored how both information structure and perceptual alignment evolve with increasing musical length, offering insight into how complexity scales within human-comprehensible systems.
II From music to networks
To explore how symbolic music data gives rise to network structures, we begin by examining the basic principles of musical representation and how different features can be encoded into discrete elements. When represented symbolically, music is described as a sequence of discrete elements, such as pitches, intervals, and durations, rather than its continuous physical properties. Symbolic music data encodes these elements into structured formats like musical scores, MIDI files, or piano rolls. These representations, commonly used in composition and production software, align with how humans naturally perceive and organize music into patterns and structures Cuthbert and Ariza (2010); Müller (2015).
From this symbolic perspective, music becomes a sequence of features that can be analyzed individually. For instance, pitch refers to the perceived frequency of a sound (e.g., the note A4 is 440 Hz) and is often grouped into pitch classes, where notes an octave apart (like C4 and C5) belong to the same class but differ in frequency by a factor of two. Duration defines how long a note or chord is held, using standard values like whole, half, or quarter notes to indicate relative lengths. Additional features—such as chord structures (e.g., pitch class sets), rhythmic patterns, and dynamic variations—further enrich the symbolic description of a piece.
These abstractions are examples of viewpoints, a concept introduced by Conklin Conklin and Witten (1995), which maps multidimensional musical events into structured partial representations. Pearce et al. Pearce et al. (2010); Pearce and Wiggins (2012) tested this theory by implementing a model that selected an optimal set of viewpoints, showing strong alignment with human responses. These findings support the idea that human music perception involves the parallel processing of multiple viewpoints, enabling listeners to interpret various aspects of music simultaneously.
In this study, we used the concept of viewpoints as a framework for comparing different network-based approaches to representing music. While viewpoints are typically used to analyze how musical sequences unfold over time Pearce and Wiggins (2012), our focus is on how different viewpoint selections affect the structure of the resulting networks. Specifically, we examine how each method defines musical elements as nodes, based on the features selected in a given viewpoint, and how transitions between these elements shape the network. The choice of features directly influences the network’s topology and the kind of insight it can reveal.
Models from Liu et al. Liu et al. (2009) and Ferretti Ferretti (2017) have opted to define a node of their musical network using features: pitch, octave, and duration. More precisely, Ferretti Ferretti (2017) allowed chords and rests within a node, constituting sets of these features. These works aimed to describe the complexity of single melodic lines or solos and analyze their network structure, classifying them as complex networks. Kulkarni et al. Kulkarni et al. (2024) defined each node solely by its pitch and octave, omitting any rhythmic information, and split chords (simultaneous notes) into separate nodes that are connected by multiple edges. The same strategy was adopted by Di Marco et al. Di Marco et al. (2025), who also decomposed polyphonic structures into separate nodes to analyze pitch transitions within a non-rhythmic framework.
On the other hand, in the harmonic approach, other researchers opted to disregard the duration of the notes and focused on grouping the different pitches that co-occur in a single node of the network Gomez et al. (2014); serrà_corral_boguñá_haro_arcos_2012; Nardelli (2023). These approaches do not take into account the octave (considering both C5 and C6 as C), and represent nodes as pitch sets Gomez et al. (2014); serrà_corral_boguñá_haro_arcos_2012 or chords–from a more informed viewpoint Nardelli (2023). Similarly, other works model these transitions, including the possible existence of broken chords Rolla et al. (2018) or from a functional harmony perspective Mrad et al. ; Frottier et al. (2022).
Similarly, statistical studies have explored musical sequences without explicitly mapping them to networks. These approaches have investigated complexity using different modeling strategies, focusing on pitch Perkins et al. (2014), pitch and octave del Río et al. (2008), pitch and duration Zanette (2006), chords Moss et al. (2019); Mehr et al. (2019), or pitch sets Rohrmeier and Cross (2008); Serra-Peralta et al. (2021). For example, Manaris Manaris et al. (2005) investigated how different representations impact Zipf’s law, offering insight into the statistical properties of musical structures.
In this study, we explored eight distinct network representations, each defined by single or multiple musical features–constituting viewpoints–that collectively represent key approaches from the existing literature. This representative set encompasses both simple models, based on individual features, and more complex models with integrated multiple dimensions, thereby enabling a nuanced examination of how each building block contributes to the overall network structure. The nodes of a musical network can be defined based on:
-
•
Pitch: Pitch is the frequency of a sound wave, which is related to its perceived highness or lowness. Each node may represent a set of pitches that co-occur in the sequence. This viewpoint is representative of harmonic approaches found in the literature serrà_corral_boguñá_haro_arcos_2012; Gomez et al. (2014); Nardelli (2023).
-
•
Duration: Each node represents the duration of a musical element in the sequence, expressed as a quantized float. These durations are relative to standard musical values, where a quarter note corresponds to 1.0, and other durations (e.g., half notes, eighth notes) are scaled accordingly.
-
•
Interval: Each node represents the chromatic pitch distance between two consecutive musical elements. Chromatic intervals measure pitch differences in semitones, meaning that each step corresponds to the smallest standard division in Western music. If multiple pitches are present, the highest pitch within each chord or pitch set is used for the calculation.
-
•
Pitch+Duration: Each node represents the set of pitches co-occurring in a musical element, paired with its duration. This model combines the Pitch and Duration representations, capturing both harmonic content and rhythmic structure.
-
•
Pitch+Octave: Each node represents the set of pitches co-occurring in a musical element, along with their corresponding octave information. This model extends the Pitch representation by incorporating octave distinctions, providing a more detailed harmonic structure.
-
•
Pitch+Duration+Octave: Each node represents the set of pitches co-occurring, along with their corresponding octaves and a shared duration for the entire set. This model combines the Pitch+Octave and Duration representations and is representative of melodic approaches found in the literature Ferretti (2017); Liu et al. (2009).
-
•
Pitch (split): Similarly to the Pitch model, but with chords split into individual nodes, where each pitch is treated separately. As a result, the model can contain up to 12 distinct nodes, corresponding to the 12 chromatic pitch classes.
-
•
Pitch+Octave (split): This model extends Pitch (split) by incorporating octave information, distinguishing identical pitch classes across different registers. It can be seen as a variation of the Pitch+Octave model, where pitch sets are split into individual nodes, and edges are created from the predecessor to each note in the set and from each note in the set to possible successors. This approach is representative of models used in the literature, such as Kulkarni et al. (2024). In total, it can contain up to 128 distinct nodes, reflecting the full range of MIDI note numbers. However, in practical applications, it is typically limited to the 88 keys of a standard piano.
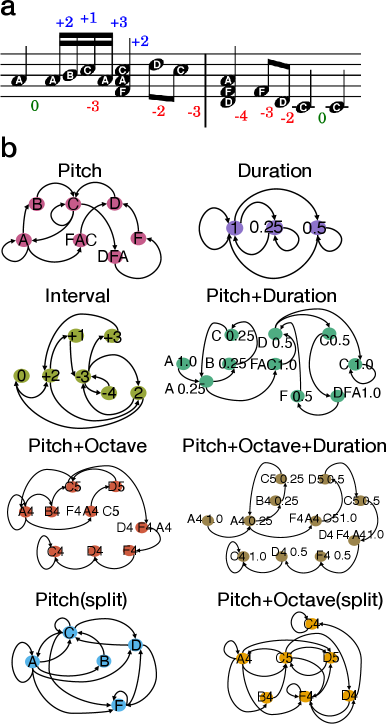
Given a musical piece in MIDI format, we convert it into a network by tracking transitions from one musical element to another. Each transition represents a link, while the definition of a node depends on the model used. Figure 1 illustrates a simple musical composition along with its corresponding network representations. Note that all graphs are directed and weighted, though their specific properties may differ. In particular, in Figure 1, the Duration model consists of only three nodes, each of which features a self-loop. In contrast, the more complex Pitch+Octave+Duration model represents the same composition with 11 distinct nodes and a single self-loop.
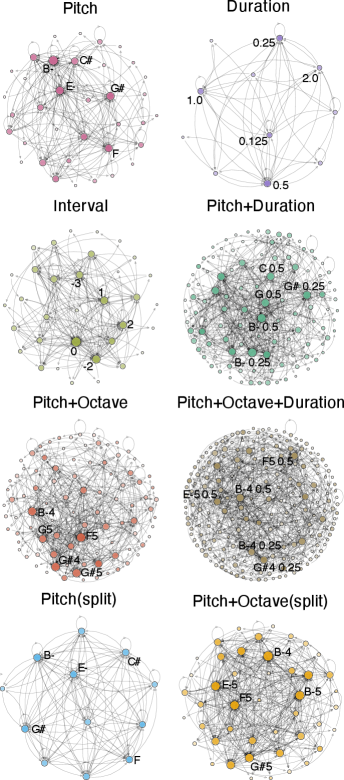
Figure 2 presents eight different network representations of Fryderyk Chopin’s Waltz in E-flat major, Op. 18. The Duration model results in the smallest network, reflecting the limited set of distinct note durations. In contrast, the Pitch(split) model is only based on 12 possible pitches. As anticipated, the Pitch+Octave+Duration model produces the largest network, characterized by only a few self-loops. These observations underscore the variability inherent in different network representations of the same musical piece.
We analyzed the different representations for the compositions in two piano datasets: the piano-midi.de dataset Krueger (2018) and the MSDM dataset Dorfer et al. (2019). The first contains 268 musical pieces, while the second includes 665. Both datasets comprise pieces that span from the Baroque period to the 20th century. We preprocessed and merged two datasets split by left and right hands. For further details, see Section V.1.
III Results
We first computed network properties averaged across all compositions. Then, we quantified the information contained in the different music network representations, analyzing how this information is distributed across the network and how it evolves with musical length. Finally, we examined how humans perceive these models to assess whether perceptual efficiency changes with complexity and to identify where inference errors tend to concentrate.
III.1 Topological properties of music network models
To assess the impact of each music network representation on the network topology, we computed key network properties for each version, including undirected, directed, and weighted network properties. For a complete list of the computed network properties, see Supplementary Tables S1 and S2.
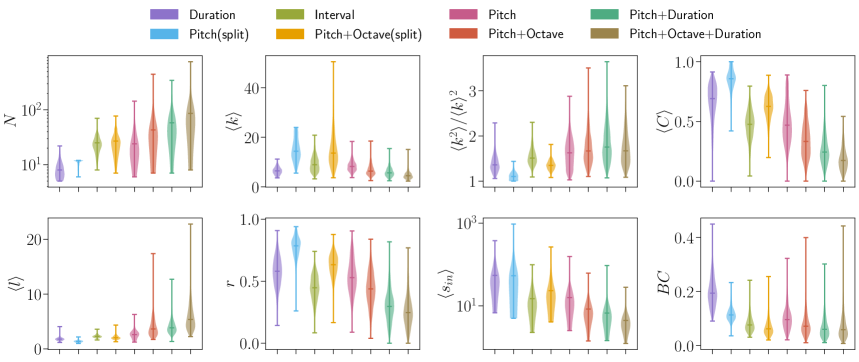
In Figure 3, we plot the distributions of these eight network metrics for the right hand. The smallest networks are observed in the Duration and Pitch(split) models, whereas the largest networks are produced by the Pitch+Duration and Pitch+Octave+Duration models. In particular, these latter models also yield a very low average degree, a low clustering coefficient, and a low reciprocity level. In contrast, the Pitch(split) and Pitch+Octave(split) models generate networks with the highest average degrees and reciprocity levels. It is important to note that splitting chords into individual nodes in these models introduces a bias that affects the number of cycles in the networks. We also note that degree heterogeneity is relatively low, especially for Pitch(split) and Pitch+Octave(split) models, indicating a more homogenous degree distribution. The more multi-feature viewpoints we include in the network model, the more heterogeneous they become. Finally, we observe that the average shortest path length is proportional to the size of the networks. In contrast, the average in-strength is inversely proportional, as we have the same number of transitions but smaller networks. In Supplementary Figure 7, we plot an additional eight metrics, whereas in Supplementary Figures 7-8, the results for the left hand are displayed. In general, the findings are consistent and do not depend on the hand.
The choice of the music network model plays a critical role in the final conclusions. Whether a musical piece exhibits small-world or scale-free properties depends heavily on its network representation. For example, the Pitch(split) model, which uses only 12 notes, does not produce networks with these characteristics. In contrast, more complex models such as Pitch+Duration+Octave generate networks that can display a range of complex properties, as demonstrated in Liu et al. (2009). These findings highlight that the observed complexity of musical networks is not solely a property of the music structure itself but is significantly influenced by the abstraction applied in the modeling process.
In general, these differences in network representations can significantly impact our view of each musical piece. Depending on the model, we may lose or distort critical information. Thus, examining different models simultaneously could not only reveal these nuances but also enable more precise correlations with their musical meaning.
III.2 Information across music network models
To further evaluate the differences between network music representations, we quantified the amount of information produced by the same sequence of notes in each network viewpoint. As suggested in Kulkarni et al. (2024), we focused on the Markov transition structure, i.e., studying the information contained in the individual note transition. This information is quantified by the Shannon entropy of a random walk on the network Gómez-Gardenes and Latora (2008); Shannon (1948). See Section V.2 for more details. This entropy quantifies the average uncertainty of transitions, i.e., the expected information content, by weighting each node’s local entropy by its stationary distribution. The stationary distribution reflects the expected visitation frequency of each node under the network’s structure and edge weights.

In Figure 4a, we compare the weighted entropy to the unweighted one across models. The biggest difference is for the Duration model, for which unweighted entropy is significantly larger. Hence, the lack of weights makes this model significantly less predictable. On the other hand, the entropies for the Pitch+Octave+Duration model remain unchanged, indicating a minimal effect on the weights in that model. Regarding the number of music features, as more features are added, the network grows in the number of nodes, while the average degree, clustering coefficient, and reciprocity decrease (see Fig. 2). This notably reduces the number of possible transitions for a random walker at each step, lowering entropy. Thus, larger networks with sparser connectivity exhibit less uncertainty in note transitions.
To investigate how entropy is structurally organized within the network, we computed the average node entropy for both unweighted and weighted networks (Figure 4b). This measure, referred to as uniform entropy, is the mean of node-level entropies without weighting by the stationary distribution—thus abstracting away from how uncertainty is distributed along the flow of the network (see Eq. 3). Models that split chords into individual nodes exhibit the highest uniform entropy, reflecting greater local branching. The Duration model shows a particularly large drop from unweighted to weighted networks, indicating that although multiple continuations are structurally available, transitions are strongly biased toward specific outcomes. Across all models, uniform entropy is consistently lower than entropy in Figure 4a. This gap reflects the alignment between node-level uncertainty and the stationary distribution: high-entropy nodes are visited more frequently. Notably, this alignment cannot be explained by degree heterogeneity alone—it results from a structured coupling between local uncertainty and network flow, concentrating entropy in a small subset of frequently traversed nodes.
This alignment is directly visualized in Figure 4c, which plots the entropy difference as a simple measure of the structural contribution to entropy. Smaller differences indicate weaker alignment between node-level uncertainty and the transition distribution. Notably, models based on chord splitting, such as Pitch(split) and Pitch+Octave(split), show consistently lower alignment. This is because these structures introduce uniformly high local entropy by adding many edges, reducing the presence of low-entropy nodes and flattening the overall entropy landscape. As a result, the stationary distribution aligns less selectively with specific nodes. This effect is especially clear when comparing the Pitch+Octave model with its split counterpart: although both use the same feature set, the non-split model shows markedly stronger alignment, underscoring how modeling alone can impact entropy concentration. A similar trend is observed in the Duration model, which also exhibits weak alignment, suggesting a more even distribution of entropy across the network. Interestingly, the unweighted version of this model shows better alignment, likely due to the influence of a few central nodes with high apparent entropy, an effect that diminishes once transition probabilities are taken into account.
To more robustly quantify how much of the entropy arises from such alignment, we introduce a normalized entropy score shown in Figure 4d. This score is defined by computing , where and are obtained using two artificial stationary distributions that respectively maximize and minimize the alignment with node entropy (see Section V.2 for more details). This measure provides an estimate of how optimal the observed alignment is for a given network size and topology. The results show that pitch-based models, such as Pitch and Interval, achieve high normalized entropy values, indicating that they effectively align structural centrality with local unpredictability, thereby concentrating uncertainty. Split models also show values near the maximum, but this is primarily due to uniformly high node entropy, rather than genuine alignment, reducing the structural relevance of the score. The Duration model again reveals a marked contrast between the unweighted and weighted cases: while the unweighted version appears to concentrate entropy in a few central nodes, the weighted version fails to do so, suggesting that the duration-based network does not form the kind of structurally aligned configurations observed in pitch-based representations.
The results confirm that musical networks, especially pitch-based ones, exhibit high levels of entropy optimization by effectively aligning structural importance (stationary distribution) with local unpredictability (entropy).
To assess the structural contribution to this alignment, we introduce two null models. The first is a directed degree-preserving randomization that rewires the network while maintaining each node’s in- and out-degree and out-strength, referred to as Rand A. At each rewiring step, two links are selected and swapped, ensuring no multi-edges are created. We generated 10 randomized networks per original network, computing entropy metrics for each. As shown in Figure 4e, these randomized networks consistently exhibit a lower total entropy, confirming that the original network topology facilitates the alignment between transition flow and node entropy. This breakdown is also reflected in the reduced alignment (Figure 4g) and normalized entropy values (Figure 4h). The second null model preserves the original network’s topology while randomizing the edge weights, referred to as Rand B. This model does not preserve a node’s out-strength or node-level entropy in the weighted case. As a result, the relationship between out-degree and out-strength becomes less superlinear compared to the original (see Figures S10–S12). This randomization similarly disrupts the alignment between transitionary distribution and local entropy, highlighting the role of edge weights in enhancing entropy optimization as shown in Figures 4i,k,l. The results for the left hand are consistent and displayed in Supplementary Figure S13. In addition, the results for the unweighted entropy measures are in Supplementary Figures S14-S15.
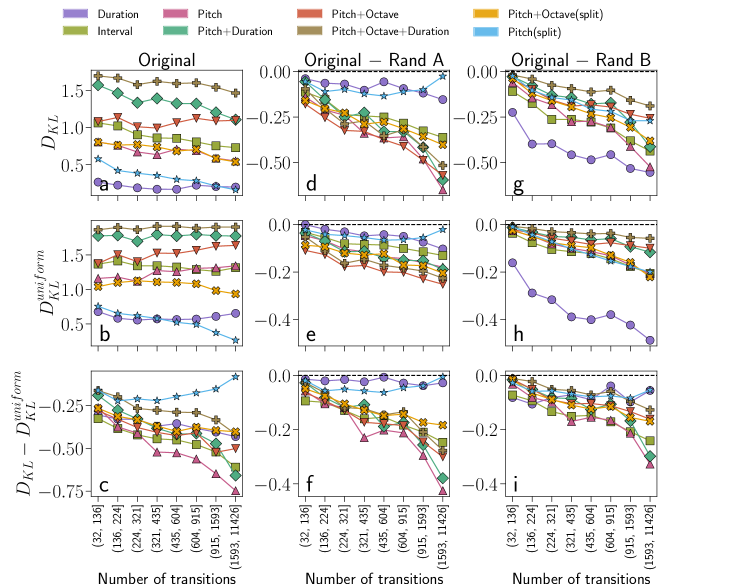
So far, we have studied the global picture of the information structure extracted from the music networks. One crucial factor that has not yet been addressed is the length of the musical piece. To understand how it influences the information content, we analyzed how entropy-related metrics evolve as a function of transition size. The transition size is defined as the total number of transitions in a piece, i.e., the total edge weight of the network. In Figure 5a, we observe that global entropy increases with transition size, indicating that longer musical pieces tend to exhibit greater informational complexity. This reflects a higher average uncertainty across transitions in larger networks. Notably, the Duration model does not follow this trend, showing a relatively flat profile, which suggests that temporal information may not scale with length in the same way as pitch-based organization does.
To assess whether this increase results from more complex node-level behavior or structural dynamics, we also calculated the average node entropy (Figure 5b), representing a uniform average of local uncertainties across all nodes. Notably, node entropy remains relatively stable across transition size for most models. The split models (e.g., Pitch(split), Pitch+Octave(split)), on the contrary, exhibit artificially elevated node entropy. This results from the increase in local branching caused by splitting chords, which inflates the number of transitions per node.
Crucially, the difference between global entropy and average node entropy (), shown in Figure 5c, increases with transition size. This suggests that longer musical pieces do not simply add more uncertainty uniformly, but instead enhance the alignment between structural centrality and unpredictability — i.e., high-entropy nodes become more frequently visited in larger networks. In other words, longer pieces exhibit more efficient informational structure. However, this trend is not observed in the Duration and split models, where the alignment remains weak and largely unchanged as the transition size increases. This suggests that these models exhibit distinct organizational dynamics, where increased length does not necessarily translate into improved alignment or more efficient information distribution.
Next, we compare our findings with two null network models. In Figure 5d, we observe that the entropy difference between real and rewired networks (Rand A) slightly increases with transition size. The node-level entropy remains unchanged in the degree-preserving null model (Figure 5e), which supports the interpretation that rewiring disrupts the alignment between the entropy and the stationary distribution. This is further confirmed in Figure 5f, where the alignment difference () between original and randomized networks grows with transition size. A similar trend is observed in the skeleton-random null model (Rand B), where edge weights are shuffled while maintaining the network topology. As shown in Figure 5g, the entropy difference relative to the real network increases with size, while Figure 5h reveals a modest rise in node-level entropy. These results suggest that randomly assigning edge weights tends to dilute the strategic concentration of uncertainty. In real networks, high-entropy nodes tend to distribute transition weights more evenly, thus contributing more to global entropy. This structure is disrupted when weights are randomized, reinforcing the idea that musical networks optimize not just which transitions exist, but how those transitions are weighted. The results for the left hand are shown in Supplementary Figure S16.
To better understand how uncertainty is locally organized, and how this may relate to perceptual structure, we analyzed the internal organization of the network by grouping nodes into quartiles based on their cumulative stationary distribution (). Each quartile comprises nodes that together account for 25% of the total stationary probability. This partition allows us to explore how both structural centrality and entropy are distributed across the network. Figures 6a and 6b show the number of nodes per quartile, averaged in short and long musical pieces, respectively. Even in shorter sequences, the distribution is already skewed, with a disproportionately large number of nodes in the first quartile. In longer pieces, this asymmetry becomes more pronounced: most nodes are visited infrequently, while a small subset accumulates most of the visitation mass. This reflects a highly skewed visitation pattern that scales with piece length. This effect is less prominent in the Duration and Pitch(split) models, which yield smaller and more uniformly visited networks.
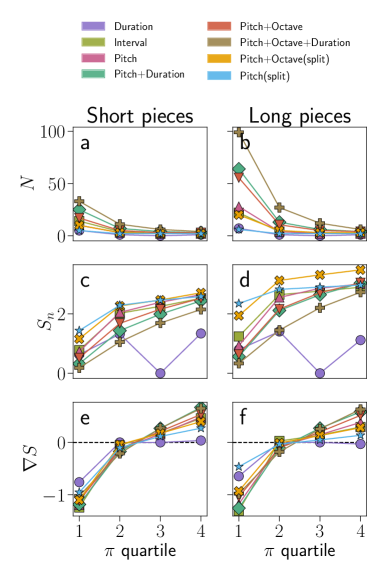
To assess how entropy is organized across this distribution, we computed the average node entropy within each quartile. As shown in Figure 6c, entropy increases with each successive quartile, indicating that more frequently visited nodes tend to be more uncertain in their transitions. This trend is further accentuated in longer musical pieces (Figure 6d), where the few central nodes not only dominate in visitation frequency but also exhibit higher local entropy. The network structure thus amplifies informational focus: a small number of central nodes carry both structural weight and higher unpredictability, while peripheral nodes remain simpler and less influential. An exception to this pattern is the Duration model, where the median value for entropy drops to zero in the third quartile, indicating that some highly visited nodes have only one possible continuation.
To understand the dynamic interplay of uncertainty across network flows, we introduce a measure of gradient entropy. This metric quantifies, for each node, the difference between its own entropy and the average entropy of its incoming neighbors, a quantity we refer to as funnel entropy (see Section V.2 for a formal definition). Gradient entropy indicates whether a node represents a point of informational increase (positive gradient) or decrease (negative gradient).
Figure 6e shows the average gradient entropy for each quartile in shorter pieces. A clear pattern emerges: nodes in the first quartile tend to have negative gradient entropy, meaning they are reached from more uncertain contexts. In contrast, nodes in the top quartile, those most frequently visited, exhibit positive gradients, indicating a rise in uncertainty upon arrival. This pattern is preserved and becomes more pronounced in longer pieces (Figure 6f). The results for the left hand are shown in Supplementary Figure S19. Again, this trend does not hold for the Duration model, where the gradient entropy pattern is either absent or inconsistent, suggesting that this may be a property specific to pitch-based musical grammar.
III.3 Human perception of music networks
Music plays an important role in daily life, and when listening to music, individuals are exposed to a sequence of notes that serve as stimuli. Over time, we accumulate this information and construct internal network representations. How humans learn and represent transition structures can be studied through models of internal transition networks accounting for imperfect cognitive processes Lynn et al. (2020b); Momennejad et al. (2017); Howard and Kahana (2002); Garvert et al. (2017); Meyniel et al. (2016); Meyniel and Dehaene (2017).
Following the approach in Kulkarni et al. (2024), we use a model that captures both temporal integration and perceptual inaccuracies Lynn et al. (2020b, a). This model postulates that when constructing internal network representations, humans aim to maximize accuracy while minimizing the computational cost required for their construction. Using this model, we derive a human-inferred network in which the transition probabilities reflect the balance between perceptual fidelity and cognitive efficiency (see details in Section V.3). We apply this inference process to each of the music network models, evaluating which structure most effectively communicates information in alignment with human perceptual constraints. To do so, we quantify the discrepancy between the inferred network and the true network using the Kullback–Leibler (KL) divergence. A lower KL divergence indicates that the inferred network is closer to the ground truth network and, consequently, is more effective in accurately conveying the underlying information.
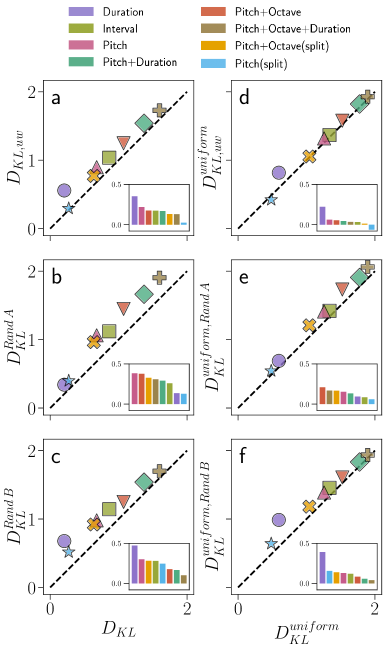
Figure 7a compares the KL divergence for weighted and unweighted networks. Incorporating edge weights reduces the KL divergence across all models, indicating that the inclusion of transition probabilities improves the alignment between human inference and the actual network structure. This effect is particularly pronounced for the Duration model, where weights capture critical temporal information. In contrast, models such as Pitch(split), with smaller networks and more uniform transitions, show minimal differences. Regarding differences across network representations, we observe that KL divergence is lowest for simpler models based on a single musical feature, such as Pitch or Duration, and increases as more features are included. The highest divergence is observed in the Pitch+Octave+Duration model, suggesting that more complex feature combinations introduce inconsistencies that make the structure more complicated to infer accurately.
To assess the information efficiency of real musical networks, we compare them against the two null models previously introduced. The first null model (Rand A) preserves in-degree, out-degree, and out-strength distributions while randomizing the topology. As shown in Figure 7b, these rewired networks perform significantly worse, exhibiting a substantially higher KL divergence than the original networks. This indicates that real network topologies are more effectively structured to support perceptual inference. Similarly, Figure 7c shows results for the second null model (Rand B), which preserves the network skeleton but shuffles the edge weights. Once again, KL divergence increases, highlighting that not only the topology but also the specific weight configuration contributes to the optimized structure of real musical networks.
To understand the origin of these differences, we compute a uniform KL metric, which averages KL divergence uniformly across all nodes rather than weighting by the stationary distribution (see Section V.3). As shown in Figure 7d, uniform KL values are similar between weighted and unweighted networks. This suggests that average node-level errors remain relatively constant when edge weight information is added. Hence, the reduction in overall KL seen with weighting must arise from an alignment between transitionary importance (i.e., stationary distribution) and inference accuracy. Resulting in weighted networks being better at directing attention toward transitions that are easier to predict.
Figures 7e and 7f present the uniform KL divergence for the two null models, offering a complementary picture. While both null models exhibit higher uniform KL—indicating greater node-level estimation errors—this measure captures a different aspect of inference quality. For the first null model (Rand A), roughly half of the KL increase relative to the real networks can be attributed to this rise in uniform KL, suggesting that both local inaccuracies and misalignment contribute to the degradation. The second null model (Rand B) highlights a stronger effect in the Duration model, where disrupting the weight configuration significantly impairs inference, reinforcing the importance of temporal information encoded in edge weights. These findings suggest that real musical networks are not only globally aligned for efficient inference but are also locally optimized: their topologies and weight distributions are both tuned to reduce node-level errors and enhance the alignment between structure and perceptual processing. The results for the left hand show similar trends and are shown in Supplementary Figure S22.
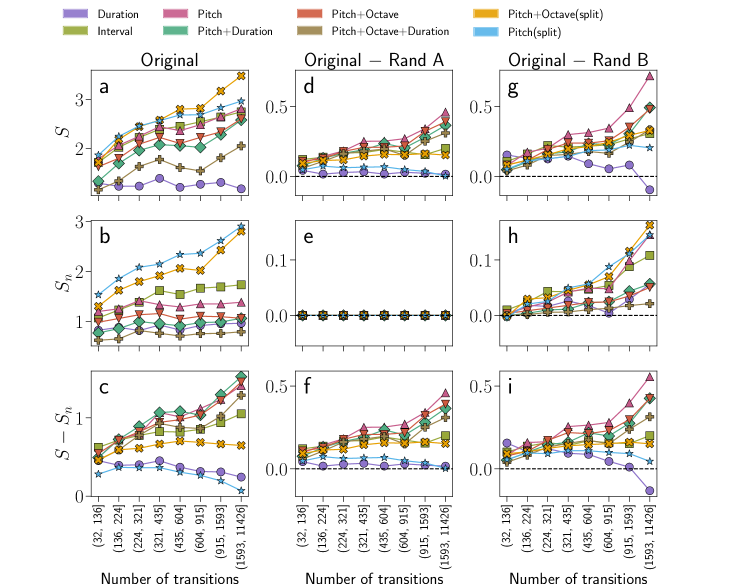
To better understand how musical length affects inference quality, we analyze whether longer pieces make it harder (or easier) to estimate their transition structure. Figure 8a shows that, for most models, decreases as the number of transitions increases. This trend suggests that longer musical pieces are generally associated with a lower overall estimation error, that is, humans are better at inferring transition probabilities in extended sequences.
To understand whether the observed decrease in with transition size results from improved local estimation or from global structural alignment, we turn to the uniform KL divergence shown in Figure 8b. While generally decreases with longer sequences, uniform KL shows little to no decrease—and even a slight increase for some models—indicating that improved per-node estimation is not the primary driver. An exception is found in the split models, where uniform KL decreases with transition size. This may be due to the added edges flattening the transition probability distribution, which aligns well with the inference model and leads to smaller estimation errors. Overall, the reduction in in longer sequences cannot be explained by more accurate estimation at individual nodes. Instead, it reflects a stronger alignment between the stationary distribution and nodes with lower KL values.
This relationship is clarified in Figure 8c, which plots the difference between total and uniform KL (). While previous plots showed only slight increases or decreases, this comparison makes it clear that the gap between the two measures grows with transition size. This indicates that as musical pieces become longer, the alignment between low-KL nodes and the stationary distribution strengthens—i.e., listener attention is increasingly concentrated on transitions that are easier to infer.
To assess the robustness of these trends, we again compare the results to the two previously introduced null models. Figures 8d–f show the differences between real networks and their degree- and strength-preserving rewired counterparts (Rand A). These differences increase with transition size—most notably in the overall KL divergence (Fig.8d), but also in the node-level and alignment contributions (Figs.8e,f). In particular, the divergence between real and random networks grows more sharply for KL than for uniform KL, reinforcing the idea that alignment becomes increasingly optimized as musical sequences grow. This pattern confirms and strengthens earlier findings, showing that the superiority of real networks over their randomized versions becomes more pronounced with size and holds consistently across scales. In contrast, the Duration and Pitch(split) models show only marginal differences from their null counterparts, suggesting that these simpler networks are less affected by the rewiring process.
A similar pattern is observed for the second null model (Rand B), shown in Figures 8g–i. Once again, the differences between real and null networks increase with transition size, highlighting the role of weight placement in concentrating estimable transitions within the central regions of the network. This effect is particularly pronounced in the Duration model, which shows a much larger divergence from its randomized counterpart compared to other models. Given that this null model preserves the network skeleton while shuffling edge weights, the result further underscores the critical role of weight configuration in shaping inference within duration-based representations. The results for the left hand are shown in Supplementary Figure S23.
Together, these findings suggest that as musical pieces grow in length, their underlying structure becomes increasingly efficient—organizing information in a way that maintains perceptual coherence and reduces cognitive load despite increased complexity.
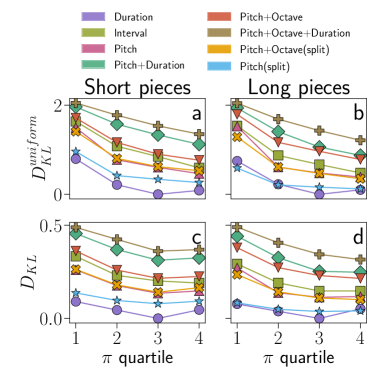
We then investigate how perceptual errors are distributed across the network. Specifically, we aim to determine which nodes are more difficult to estimate and how central these nodes are within the network structure. To answer this, we refer back to the quartile-based grouping of nodes introduced earlier, based on their contribution to the stationary distribution . As previously shown (Figures 6a,b), this distribution is strongly skewed, with most nodes occupying the lower quartiles.
We then examine how uniform KL divergence varies across these quartiles. Figures 9a and 9b show that nodes in the lowest quartile exhibit the highest uniform KL divergence. These nodes are rarely visited and also harder to estimate. On the other hand, frequently visited nodes tend to have lower uniform KL, indicating that listeners form more accurate transition expectations for these central musical elements. This trend is consistent in both short and long pieces. Crucially, the negative correlation between node-level KL and visitation probability has important consequences for the total KL divergence. Although the average KL per node is highest in the first quartile, its impact on the global KL remains limited due to the low probability of visiting these nodes. This pattern is shown in Figures 9c and 9sd, which plot each quartile’s contribution to the global KL divergence. The results confirm that a substantial portion of node-level error is concentrated in low- regions, yet this does not heavily impact the overall KL due to the low structural relevance of these nodes. Notably, these differences would be significantly larger if the transition distribution were not skewed toward favouring low-KL nodes—demonstrating that the network structure itself helps minimize the impact of more error-prone regions. The results for the left hand show similar trends and are presented in Supplementary Figure S26.
Together, these results show that perceptual errors are not uniformly distributed across the network. Instead, musical structures appear to channel attention and processing toward better-estimated, high- regions — supporting a model of efficient organization where relevance and predictability are aligned.
IV Discussion
When perceived by humans, musical stimuli are continuously matched against expectations, leading to either satisfied predictions or moments of surprise Huron (2008). This predictive processing plays a central role in music cognition, where listeners integrate multiple levels of abstraction—formally described as viewpoints—to anticipate and interpret musical sequences Conklin and Witten (1995); Pearce and Wiggins (2012). The way these viewpoints are selected and encoded into network representations has important implications for how musical structure is perceived and processed.
Our findings highlight how different choices of representation—such as pitch, interval, or duration—fundamentally shape network topology and, by extension, the distribution of uncertainty. While multi-feature networks tend to be larger and more sparse Ferretti (2017); Liu et al. (2009), simpler feature-based networks offer more compact and coherent structures. These differences reflect not only the nature of musical content but also how complexity is encoded and potentially perceived over time.
A key structural pattern we observe is the alignment between high-entropy nodes and high stationary probability. Rather than spreading uncertainty uniformly, musical networks tend to concentrate informational complexity in structurally relevant regions. This alignment is particularly pronounced in pitch-based models and becomes stronger in longer pieces. Such organization may reflect a form of informational focusing, where complexity is introduced where it is most likely to be encountered, supporting perceptual efficiency without overwhelming the listener.
Entropy gradients across the network further reveal a dynamic structure, in which stable and uncertain regions alternate. While we do not directly measure expectation or surprise, this alternation may provide a structural basis for the perceptual experience of tension and release, as described in the literature on music cognition Huron (2008); Cheung et al. (2019); Gold et al. (2019). These gradients suggest that the musical structure is not only rich in information but also carefully organized to distribute that richness in ways that engage listeners across time.
The analysis of KL divergence offers further evidence that real musical networks are efficiently structured for inference. Compared to randomized controls, real networks—particularly those based on pitch—better align their internal structure with estimable transitions. This alignment becomes even more efficient in longer sequences, where increasing complexity is balanced by greater structural organization. Importantly, these improvements are not due to simpler transitions per se, but to how information is routed within the network.
These findings suggest a broader principle of structural efficiency in music: as pieces grow in length, they appear to manage informational complexity in ways that maintain perceptual tractability. The balance between richness and coherence may be a core feature of musical grammar, allowing compositions to evolve in complexity while remaining interpretable.
Finally, the observation that simpler, single-feature models yield lower KL divergence than more complex, multi-dimensional ones suggests that perception may favor modular, parallel representations over unified high-dimensional structures. While multi-feature networks offer richer structural detail, they appear less efficiently aligned with human inference. This supports the view that, although music is inherently multidimensional, listeners parse it through distinct, low-dimensional channels. This processing aligns with the theories of modularity in music cognition Pearce and Wiggins (2012); Peretz and Coltheart (2003), providing a possible explanation for the robustness of musical understanding across varying degrees of complexity.
While our analysis focuses on a limited set of musical viewpoints, this was a deliberate choice aimed at consolidating and comparing widely used approaches in network-based representations. More complex models, such as those in IDyOM Pearce and Wiggins (2012), capture a broader range of features, and future work could extend this framework by incorporating additional or hybrid representations to explore the full richness of musical structure. Finally, although this study focuses on a corpus of piano music with relatively consistent complexity, the framework is generalizable. Applying it to other repertoires—such as popular, minimalist, or contemporary genres—may reveal how structural simplification or feature prioritization varies across styles. In this light, network-based approaches offer a promising lens for understanding how musical structure and perceptual constraints co-evolve across different cultural and historical contexts.
V Methods
V.1 Description of datasets
The data sets consist of piano pieces from several authors. These pieces are in MIDI format and were processed by our code to map them into networks. We used two datasets: (i) the piano-midi.de dataset Krueger (2018), containing 268 musical pieces, and (ii) the MSDM dataset Dorfer et al. (2019), containing 665 musical pieces. After merging the two datasets, we obtained a total of 933 music pieces. Note that some pieces may still be duplicated: in a few cases, two MIDI files represent the same composition but differ in their encoding. We have chosen to retain all files to preserve these variations. Moreover, we keep networks with a strongly connected component larger than 80% of the network size. Thus, the number of final constructed networks might differ across network models, however, it exceeds 600 musical pieces.
During data processing, MIDI files were selected only if they contained tempo information and time signature to ensure that the quantization of the duration outputs relevant values. Similarly, we only selected files containing two tracks - each corresponding to one hand on a piano score. Each track was treated as an individual network. Therefore, each input MIDI file resulted in two different networks.
In Supplementary Figure 1, we show the distribution of MIDI note numbers for both datasets. The left-hand notes range from 20 to 90, while the right-hand notes range from 40 to 110. In Supplementary Figures 2–3, we display the top 15 most frequent durations for the left and right hands. Generally, half and quarter notes occur very frequently, with whole notes following in the left hand and eighth notes in the right hand. These MIDI tracks are composed of sequences of notes that may be played simultaneously by one hand, forming chords. In Supplementary Figure 4, we compared the number of pitches played by the left and right hands. In both datasets, the right hand predominantly plays single notes, while the left hand typically plays chords. Lastly, we looked at the most frequent chromatic intervals in both datasets. In Supplementary Figures 5-6, the left hand values exhibit a pronounced peak at interval 0, reflecting repeated pitches or unisons, whereas the right hand values show a dominant peak at -2, indicating a common descending two-semitones interval. Smaller secondary peaks highlight additional ascending and descending motions in both datasets.
V.2 Entropy in complex networks
The Shannon entropy for a node can be written as Gómez-Gardenes and Latora (2008); Kulkarni et al. (2024)
| (1) |
In the case of directed and weighted networks, , where is the out-strength of the node . In unweighted networks, the out-strength is replaced by the out-degree .
The entropy of the entire network has a form
| (2) |
with representing the stationary distribution, i.e., the probability that a walker ends up at node after infinite time. It is worth noting that the formula is only applicable when a network has a single strongly connected component. In the preprocessing step, we ensure that we work with such networks.
In addition, we define the average node entropy as the uniform average for all nodes in the network:
| (3) |
The normalized entropy describes the efficiency of the alignment between transtionary distribution and node-level entropies in a given network and can be written as:
| (4) |
The and correspond to the negatively and positively correlated entropy to the two stationary distributions, respectively, as:
| (5) | ||||
| (6) |
where and are two artificial stationary distributions:
| (7) | ||||
| (8) |
We set to obtain a distribution positively correlated with entropy () and a negatively correlated distribution ().
In addition, we define a set of local entropy measures. The funnel entropy for node is the average entropy of the predecessors to :
| (9) |
with representing the stationary distribution of node and representing the set of incoming neighbours to .
The gradient entropy of node is the difference between node entropy and funnel entropy:
| (10) |
It quantifies whether a node represents a point of informational increase (positive gradient) or decrease (negative gradient).
V.3 Human perception models
In the human perception model, the learned probabilities can be written in terms of the true transition probabilities as follows:
| (11) |
where captures the errors in representation. It has been shown that, on average, humans display in large-scale online laboratory experiments Lynn et al. (2020a).
To quantify the discrepancy in the perception of music networks, i.e., the difference between these two probabilities, we use the Kullback-Leibler (KL) divergence defined as:
| (12) |
Finally, we define the uniform average of the KL divergence as:
| (13) |
Acknowledgments
L. B. R and R. J acknowledge support from the Bridge grant funded by Young Researchers of the Complex Systems Society (yrCSS). R. J. acknowledges support from the fellowship FI-SDUR funded by Generalitat de Catalunya. L. B. R acknowledges support from the ARIAC project (No. 2010235), funded by the Service Public de Wallonie (SPW Recherche). M. A. S and M. B. acknowledge support from: Grant TED2021-129791B-I00 funded by MCIN/AEI/10.13039/501100011033 and by “European Union NextGenerationEU/PRTR”; Grant PID2022-137505NB-C22 funded by MCIN/AEI/10.13039/501100011033 and by “ERDF A way of making Europe”; Generalitat de Catalunya grant number 2021SGR00856. M. B. acknowledges the ICREA Academia award, funded by the Generalitat de Catalunya.
VI Data availability
The network datasets used in this study are available from the sources referenced in the manuscript and the supplementary materials.
VII Code availability
To generate the different network models, we have produced software that allows us to read MIDI files from the given datasets, select the features that will be used to build the given model, and produce the graphs for each track in the MIDI file together with a text file that corresponds to the given viewpoint sequence. We will provide an open-source code upon publication.
References
- Koelsch (2014) S. Koelsch, Nature reviews neuroscience 15, 170 (2014).
- Koelsch et al. (2019) S. Koelsch, P. Vuust, and K. Friston, Trends in cognitive sciences 23, 63 (2019).
- Liu et al. (2009) X. Liu, C. K. Tse, and M. Small, Lecture Notes of the Institute for Computer Sciences, Social Informatics and Telecommunications Engineering Complex Sciences , 2196–2205 (2009).
- Ferretti (2017) S. Ferretti, Springer Science+Business Media (2017).
- Gomez et al. (2014) F. Gomez, T. Lorimer, and R. Stoop, Nonlinear Dynamics of Electronic Systems Communications in Computer and Information Science , 262–269 (2014).
- Nardelli (2023) M. B. Nardelli, Journal of Mathematics and Music 17, 198 (2023).
- Kulkarni et al. (2024) S. Kulkarni, S. U. David, C. W. Lynn, and D. S. Bassett, Physical Review Research 6, 013136 (2024).
- Rolla et al. (2018) V. Rolla, J. Kestenberg, and L. Velho, Europhysics Letters 121, 38005 (2018).
- (9) D. Mrad, S. Najem, P. Padilla, and F. Knights, .
- Frottier et al. (2022) T. Frottier, B. Georgeot, and O. Giraud, The European Physical Journal B 95, 103 (2022).
- Manaris et al. (2005) B. Manaris, J. Romero, P. Machado, D. Krehbiel, T. Hirzel, W. Pharr, and R. B. Davis, Computer Music Journal 29, 55 (2005).
- Serra-Peralta et al. (2021) M. Serra-Peralta, J. Serrà, and Á. Corral, EPJ Data Science 10, 40 (2021).
- Lynn et al. (2020a) C. W. Lynn, L. Papadopoulos, A. E. Kahn, and D. S. Bassett, Nature Physics 16, 965 (2020a).
- Buongiorno Nardelli (2020) M. Buongiorno Nardelli, Leonardo Music Journal 30, 38 (2020).
- Krueger (2018) B. Krueger, “Piano midi,” (1996–2018).
- Dorfer et al. (2019) M. Dorfer, j. Hajič, Jan, A. Arzt, H. Frostel, and G. Widmer, “Msmd - multimodal sheet music dataset,” (2019).
- Conklin and Witten (1995) D. Conklin and I. H. Witten, Journal of New Music Research 24, 51 (1995).
- Friston (2010) K. Friston, Nature reviews neuroscience 11, 127 (2010).
- Cuthbert and Ariza (2010) M. S. Cuthbert and C. Ariza, (2010).
- Müller (2015) M. Müller, Fundamentals of music processing: Audio, analysis, algorithms, applications, Vol. 5 (Springer, 2015).
- Pearce et al. (2010) M. T. Pearce, M. H. Ruiz, S. Kapasi, G. A. Wiggins, and J. Bhattacharya, NeuroImage 50, 302 (2010).
- Pearce and Wiggins (2012) M. T. Pearce and G. A. Wiggins, Topics in cognitive science 4, 625 (2012).
- Di Marco et al. (2025) N. Di Marco, E. Loru, A. Galeazzi, M. Cinelli, and W. Quattrociocchi, arXiv preprint arXiv:2501.07557 (2025).
- Perkins et al. (2014) T. J. Perkins, E. Foxall, L. Glass, and R. Edwards, Nature Communications 5, 5121 (2014).
- del Río et al. (2008) M. B. del Río, G. Cocho, and G. Naumis, Physica A: Statistical Mechanics and its Applications 387, 5552 (2008).
- Zanette (2006) D. H. Zanette, Musicae Scientiae 10, 3 (2006).
- Moss et al. (2019) F. C. Moss, M. Neuwirth, D. Harasim, and M. Rohrmeier, PLoS One 14, e0217242 (2019).
- Mehr et al. (2019) S. A. Mehr, M. Singh, D. Knox, D. M. Ketter, D. Pickens-Jones, S. Atwood, C. Lucas, N. Jacoby, A. A. Egner, E. J. Hopkins, et al., Science 366, eaax0868 (2019).
- Rohrmeier and Cross (2008) M. Rohrmeier and I. Cross, in Proceedings of the 10th international conference on music perception and cognition, Vol. 6 (ICMPC Sapporo, 2008) pp. 123–1319.
- Gómez-Gardenes and Latora (2008) J. Gómez-Gardenes and V. Latora, Physical Review E—Statistical, Nonlinear, and Soft Matter Physics 78, 065102 (2008).
- Shannon (1948) C. E. Shannon, The Bell system technical journal 27, 379 (1948).
- Lynn et al. (2020b) C. W. Lynn, A. E. Kahn, N. Nyema, and D. S. Bassett, Nature communications 11, 2313 (2020b).
- Momennejad et al. (2017) I. Momennejad, E. M. Russek, J. H. Cheong, M. M. Botvinick, N. D. Daw, and S. J. Gershman, Nature human behaviour 1, 680 (2017).
- Howard and Kahana (2002) M. W. Howard and M. J. Kahana, Journal of mathematical psychology 46, 269 (2002).
- Garvert et al. (2017) M. M. Garvert, R. J. Dolan, and T. E. Behrens, elife 6, e17086 (2017).
- Meyniel et al. (2016) F. Meyniel, M. Maheu, and S. Dehaene, PLoS computational biology 12, e1005260 (2016).
- Meyniel and Dehaene (2017) F. Meyniel and S. Dehaene, Proceedings of the National Academy of Sciences 114, E3859 (2017).
- Huron (2008) D. Huron, Sweet anticipation: Music and the psychology of expectation (MIT press, 2008).
- Cheung et al. (2019) V. K. Cheung, P. M. Harrison, L. Meyer, M. T. Pearce, J.-D. Haynes, and S. Koelsch, Current Biology 29, 4084 (2019).
- Gold et al. (2019) B. P. Gold, M. T. Pearce, E. Mas-Herrero, A. Dagher, and R. J. Zatorre, Journal of Neuroscience 39, 9397 (2019).
- Peretz and Coltheart (2003) I. Peretz and M. Coltheart, Nature neuroscience 6, 688 (2003).
See pages ,,1,2,3,4,5,6,7,8,9,10,11,12,13,14,15,16,17,18,19,20,21,22,23,23,24,25 of SI.pdf