Infrared Spectroradiometry of Lithium Benzoate
from 21 to 235 THz
Abstract
This paper presents an extensive survey of the thermal radiation properties of lithium benzoate. We heated the sample from 313 to 553 K, just below the melting point, while performing an infrared spectroradiometry with an FT-IR spectrometer from 21 to 235 THz (700-7800 cm-1). We have provided a detailed analysis of the infrared spectrum data and a comparison of the absorption spectrum of the same sample. It turned out that the recorded spectra are not only different from ordinary absorption spectra but also carry substantial information about the temperature dependence of the population of vibrationally excited states. We conclude by proposing a hypothesis on the thermal excitation mechanism of vibrational energy levels of molecules consistent with the distinct characteristics of the obtained infrared emission spectra.
keywords:
Fourier-Transform infrared spectroscopy , spectroradiometry , terahertz , vibrational spectroscopy , infrared emission spectroscopy , thermal radiation , spontaneous emission[a]organization=Institute for Integrated Cell-Material Sciences (WPI-iCeMS), Kyoto University,addressline=Yoshida, city=Sakyo-ku, postcode=606-8501, state=Kyoto, country=Japan
1 Introduction
Spectroradiometry, a branch of radiometry that measures the spectral power distribution of a light source across different wavelengths, has played a pivotal role in scientific development [1]. Particularly, it is an indispensable tool in astrophysics, as it can determine the surface color temperatures of celestial bodies along with the compositions of their atmospheres from the dark absorption lines. Despite various derivatives of spectroradiometry, such as flame spectroscopy and plasma atomic emission spectroscopy, most measurements are in the ultraviolet and visible domains. Less attention has been paid to the infrared, except in the steel industry, to examine the deterioration of metal coatings at high temperatures, where thermal radiation gets so intense that the usual attenuated total reflection turns erroneous [2].
We now provide a few comments on the origin of infrared thermal radiation from molecules. Assume the energy distribution of the canonical ensemble of statistical mechanics, that is, a simple working model of thermal excitation. Then, the population of the vibrationally excited state of a molecule relative to that of the vibrationally ground state is given by
| (1) |
where and are the Boltzmann constant and the temperature of the system, respectively. And is the vibrational energy of the excited molecule, while is the ground state energy of the molecule. This formula tells us that the relative population of the vibrationally excited state at 1000 cm-1 over the ground state at 300 K is about , and at 500 K. Although vibrationally excited molecules may appear negligible, the total number of molecules collected in palm-sized pieces is so large that one can examine spontaneous emissions from them (see e.g., [3]) by performing spectroradiometry in the infrared.
Despite a long history of infrared spectroradiometry, primarily in the steel industry (see e.g., [4, 5, 6, 7, 8, 9, 10]), most of the research focuses only on the mid-Infrared (mid-IR) region of the spectrum (400-4000 cm-1), or relatively high temperatures over 400 K. In this paper, we take a step forward and perform infrared spectroradiometry of an organic molecule, lithium benzoate, from 21 to 235 THz (700-7800 cm-1), encompassing both mid-IR and near-infrared (NIR) regions over 4000 cm-1. For a detailed investigation of the temperature dependence of the infrared (IR) emission of lithium benzoate, we systematically recorded its IR emission from 313 to 553 K in 40-degree increments. This focus helps to elucidate the temperature-dependent spectral features within the studied frequency range.
2 Experimental procedure
2.1 Experimental setup
Lithium benzoate (CAS No. 553-54-8) was purchased from BLD Pharm, Inc. The sample, a powder with a purity of 99%, was placed in a 10 mm diameter aluminum cup, forming a layer approximately 0.5 mm thick.
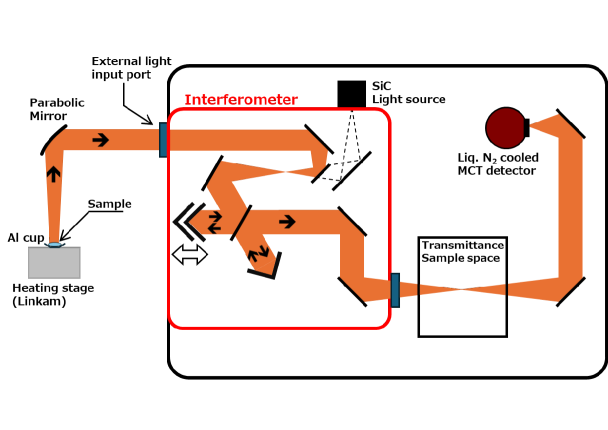
Fig. 1 shows a schematic of the IR emission measurement system constructed. IR emission from the sample was directed into the interferometer using an off-axis parabolic mirror with a long focal length. We recorded the IR emission spectra of the powder samples with a JASCO FT/IR-8X Fourier transform infrared spectrometer equipped with a mercury-cadmium-telluride (MCT) detector, cooled to liquid nitrogen temperature, with a spectral resolution of 4.0 cm-1 and 90 accumulations. The spectra were obtained while tuning the sample temperature with a Linkam Scientific Instruments stage from 313 to 553 K in 40-degree increments. To ensure reproducibility, we collected six sets of data for every measurement with fixed conditions and used their averages for our analysis.
2.2 Method of analysis
One of the difficulties in spectroradiometry of IR emission lies in the fact that every substance, including the spectrometer and the sample holder, radiates. That is, it is virtually impossible to collect radiation purely from the sample while isolating it from the rest. Hence, we have taken the following measures: Record (single-beam) IR emission spectra of the sample holder, a 10 mm diameter aluminum cup, with and without the sample. Focus on the ratio of their spectra, that is, the relative emission spectra of the sample:
| (2) |
to cancel the IR emission from the environment, together with the effects of varying factors coming from the quantum efficiency of the MCT detector.
3 Result and Discussion
3.1 Overview of obtained spectra
Fig. 2-(a) shows the relative IR emission spectra of lithium benzoate. The overall spectral profiles in the mid-IR region exhibit little change with increasing temperature. In contrast, the NIR spectra become sharper at elevated temperatures. As an illustration, the spectra around 4600 cm-1 appear fuzzy at low temperatures, due to atmospheric CO2 absorption, but become clearer as the sample is heated. This trend suggests that enhanced molecular motion at higher temperatures increases the population of higher vibrational levels, leading to the emergence of more distinct NIR spectral features.
The assignment of NIR peaks to specific functional groups, following a conventional method [11], is as follows. Multiple peaks around 4600 cm-1 correspond to the combination bands of the aromatic C-H stretch (3000–3100 cm-1), and the C-C stretch of the aromatic ring or the C=O stretch (1400–1600 cm-1). The jagged peaks near 5200 cm-1 likely correspond to the second overtones or the combination bands of the C-C stretch of the aromatic ring and the C=O stretch (1400–1600 cm-1). The peaks around 6000 cm-1 can be associated with the first overtone of the aromatic C-H stretch (3000–3100 cm-1).
3.2 Details of mid-IR spectra
We now provide a more detailed analysis of the mid-IR region in Fig. 2-(a). For this purpose, we expand in Fig. 2-(b) a portion of the fingerprint region of the spectra (24-36 THz or 800-1190 cm-1), while putting numbers on all peaks.
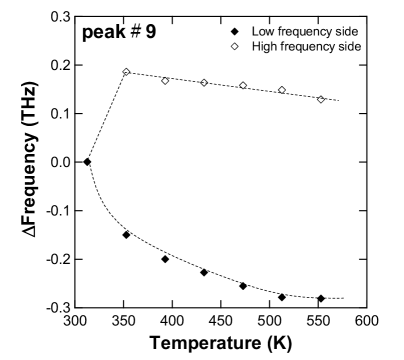
Figure 2-(c) shows the peak shifts relative to those in the lowest temperature, excluding the ninth peak. In general, all peaks broaden as the temperature increases. One of the causes of line broadening may be the shortening of the lifetime of the vibrationally excited states due to increased collisional broadening at higher temperatures. The first eight peaks are red shifted at higher temperatures. Remarkably, the amount of shift is only about 0.1% of the total wavenumber, which may be due to the robustness of our sample, lithium benzoate, with a high melting point. Moreover, the tenth peak is almost invariant, although it may be due to the strong adjacent band. The ninth peak gradually splits into two pieces, as shown in Fig. 2-(b), but both exhibit small redshifts at higher temperatures (see Fig. 3).
3.3 Comparison between mid-IR absorption and emission spectra
We also recorded the mid-IR absorption spectrum of lithium benzoate at 300 K to compare it with the emission spectrum at 313 K. The infrared absorption spectrum was recorded using an FT-IR spectrometer (FT/IR-4200, JASCO) equipped with a DLATGS (Deuterated L-Alanine Triglycine Sulfate) detector, with 90 accumulations at a resolution of 4.0 cm-1. We have prepared the sample as a KBr pellet containing 1.0 wt% of the analyte. Potassium bromide (KBr, 99%, CAS No. 7758-02-3) was purchased from Tokyo Chemical Industry (TCI).
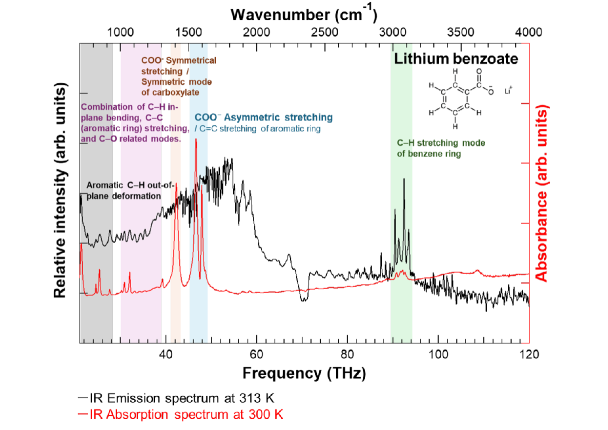
Fig. 4 shows the absorption and emission spectra with a detailed peak assignment according to [12]. Notice that the structure of the emission spectrum is distinct from and more involved than the absorption spectrum. More specifically, there are more peaks in the emission spectrum than in the absorption spectrum. They have several peaks in common, but with different intensities.
We propose that this distinction is responsible for the different mechanisms of absorption and emission measurements. In the former, we monitor the attenuation of light by the sample, during which process molecules in the sample are excited by the absorption of light quanta. Even at low temperatures, some molecules should be in their vibrationally excited states, as we demonstrated in Fig. 2-(a). However, they are averaged out to some extent in ordinary mid-IR and NIR absorption measurements at room temperature and below, resulting in reasonable agreement with quantum-mechanical calculations of vibrational frequencies at absolute zero. However, this mechanism may not apply to absorption spectroscopy in the THz region, where considerable amounts of molecules should be vibrationally excited even at room temperature, according to a rough estimate from (1).
In emission measurements, we detect weak spontaneous emissions from molecules that are vibrationally excited by heat. To provide a consistent explanation of this phenomenon, we should first clarify the mechanism of the thermal excitation of molecules. For this purpose, we would like to use the following analogy to describe our hypothesis. Imagine a staircase. Each step represents a vibrational energy level of a molecule. At the very bottom (ground state) is a hose, from which water flows at a rate corresponding to the temperature, rushing up the stairs. We can analogize the way in which a portion of water moves up and down the stairs due to collisions with others to vibrational excitations and de-excitations as a consequence of inelastic collisions between molecules. Gravity pulls the water downward toward the ground state, but after some time, the amount of water at each step will become stationary.
Recall that any two excited states of a molecule with nonzero transition dipole moments can undergo spontaneous emission from the higher to the lower. Considering this within our aforementioned analogy, the rate of descent while emitting light quanta is determined from the principle of quantum mechanics, occurring in any pair of steps proportionally to the transition dipole moments of the two states. For instance, spontaneous emissions should occur not only from direct de-excitations to the ground state but also from overtones and combination bands to the fundamentals. In this manner, there should be a cascade-like mechanism and many pathways for spontaneous emission of radiation, resulting in a more structured spectrum with more peaks than in absorption measurements. The split of the ninth peak in Fig. 2-(b) may be linked to the opening of new channels of spontaneous emission from higher excited states to lower ones at higher temperature.
4 Conclusion
In this paper, we performed the infrared spectroradiometry of lithium benzoate from 21 to 235 THz (700-7800 cm-1) at various temperatures. The obtained spectra show strong temperature dependence in the NIR region. In particular, the NIR spectra become sharper as the sample is heated, implying an increase in the population of higher vibrationally excited states.
In differentiating the absorption and emission spectra of lithium benzoate, we demonstrated that the emission spectrum provides more information than the absorption spectrum. To explain this characteristic feature of the emission spectra, we proposed the cascade-like thermal excitation and spontaneous emission mechanism. However, the complicated structure of the thermal emission prevented us from identifying the origin of all peaks in the emission spectra. More extensive investigations are needed to confirm our hypothesis and to extract much more information from emission spectra.
5 Acknowledgement
The authors thank S. Norimoto and S. Matsumoto for their support of our experiment. The authors are grateful to D. Fujita for continued support and encouragement as our principal investigator.
References
- Worsfold et al. [2019] P. Worsfold, A. Townshend, C. F. Poole, M. Miró, Encyclopedia of Analytical Science, Elsevier Science, 2019.
- Suëtaka and Yates [1995] W. Suëtaka, J. T. Yates, Surface Infrared and Raman Spectroscopy: Methods and Applications, Springer, 1995. doi:https://doi.org/10.1007/978-1-4899-0942-8.
- Sakurai [1967] J. J. Sakurai, Advanced Quantum Mechanics, Pearson Education, Incorporated, 1967.
- Deblase and Compton [1991] F. J. Deblase, S. Compton, Infrared emission spectroscopy: A theoretical and experimental review, Applied Spectroscopy 45 (1991) 611–618. URL: https://doi.org/10.1366/0003702914337029. doi:10.1366/0003702914337029. arXiv:https://doi.org/10.1366/0003702914337029.
- Chiang et al. [1983] S. Chiang, R. G. Tobin, P. L. Richards, Infrared emission spectroscopy of co on ni, Journal of Electron Spectroscopy and Related Phenomena 29 (1983) 113–118. URL: https://www.sciencedirect.com/science/article/pii/0368204883800498. doi:https://doi.org/10.1016/0368-2048(83)80049-8.
- Tobin et al. [1987] R. G. Tobin, R. B. Phelps, P. L. Richards, An infrared emission study of the c=o stretch vibration of bridge-bonded co on pt(111), Surface Science 183 (1987) 427–437. URL: https://www.sciencedirect.com/science/article/pii/S0039602887802194. doi:https://doi.org/10.1016/S0039-6028(87)80219-4.
- Tobin and Richards [1987] R. G. Tobin, P. L. Richards, An infrared emission study of the molecule-substrate mode of CO on Pt(111), Surface Science 179 (1987) 387–403. URL: https://www.sciencedirect.com/science/article/pii/0039602887900653. doi:https://doi.org/10.1016/0039-6028(87)90065-3.
- Lauer and Vogel [1984] J. L. Lauer, P. Vogel, Emission ftir analyses of thin microscopic patches of jet fuel residues deposited on heated metal surfaces, Applications of Surface Science 18 (1984) 182–206. URL: https://www.sciencedirect.com/science/article/pii/0378596384900448. doi:https://doi.org/10.1016/0378-5963(84)90044-8.
- Gratton et al. [1978] L. M. Gratton, S. Paglia, F. Scattaglia, M. Cavallini, Infrared emission spectroscopy applied to the oxidation of molybdenum, Appl. Spectrosc. 32 (1978) 310–316. URL: https://opg.optica.org/as/abstract.cfm?URI=as-32-3-310.
- Lauer and King [1979] J. L. Lauer, V. W. King, Fourier emission infrared microspectrophotometer for surface analysis. I - Application to lubrication problems, Infrared Physics 19 (1979) 395–412. URL: https://www.sciencedirect.com/science/article/pii/0020089179900514. doi:https://doi.org/10.1016/0020-0891(79)90051-4.
- Ozaki et al. [2021] Y. Ozaki, S. T. Christian Huck, S. B. Engelsen, Near-Infrared Spectroscopy, Springer Singapore, 2021. doi:https://doi.org/10.1007/978-981-15-8648-4.
- Regulska et al. [2005] E. Regulska, M. Samsonowicz, R. Świsłocka, W. Lewandowski, Vibrational and NMR spectra of alkali metal salts of 3-amino-, 3-hydroxy- and 3-halogenobenzoic acids, Journal of Molecular Structure 744-747 (2005) 353–361. doi:https://doi.org/10.1016/j.molstruc.2004.11.061.