Coronal Cells in Coronal Holes:
Systematic Analysis and Implications for Coronal Evolution
Abstract
Using advanced processing techniques, we analyze high-cadence, high-resolution extreme ultraviolet images and show that, throughout the solar cycle, mid-latitude coronal holes (CHs) are made up of ubiquitous and space-filling funnel-shaped structures (or cells) anchored to unipolar magnetic flux concentrations in lanes. We demonstrate that the coronal cells previously documented in the magnetically closed regions as well as coronal plumes are a particular manifestation of . The cell properties depend on the magnetic field intensity at their footpoint and connectivity in the corona, either closing in opposite polarity regions (CF-cells) or extending to form open-field (-cells). The cells’ lifetime mirrors that of magnetic flux concentrations revealed by magnetograms, slowly emerging and then disappearing in a matter of a few hours to a few days in a one-to-one correspondence. When a cell along the CH boundary, it can . Therefore, coronal cells can contribute to the dynamics of CH . We contextualize these observations in a “coronal cell” theory potentially able to provide an explanation for fine scale coronal structures and
newfloatplacement\undefine@keynewfloatname\undefine@keynewfloatfileext\undefine@keynewfloatwithin
show]nathalia.alzate@nasa.gov
1 Introduction
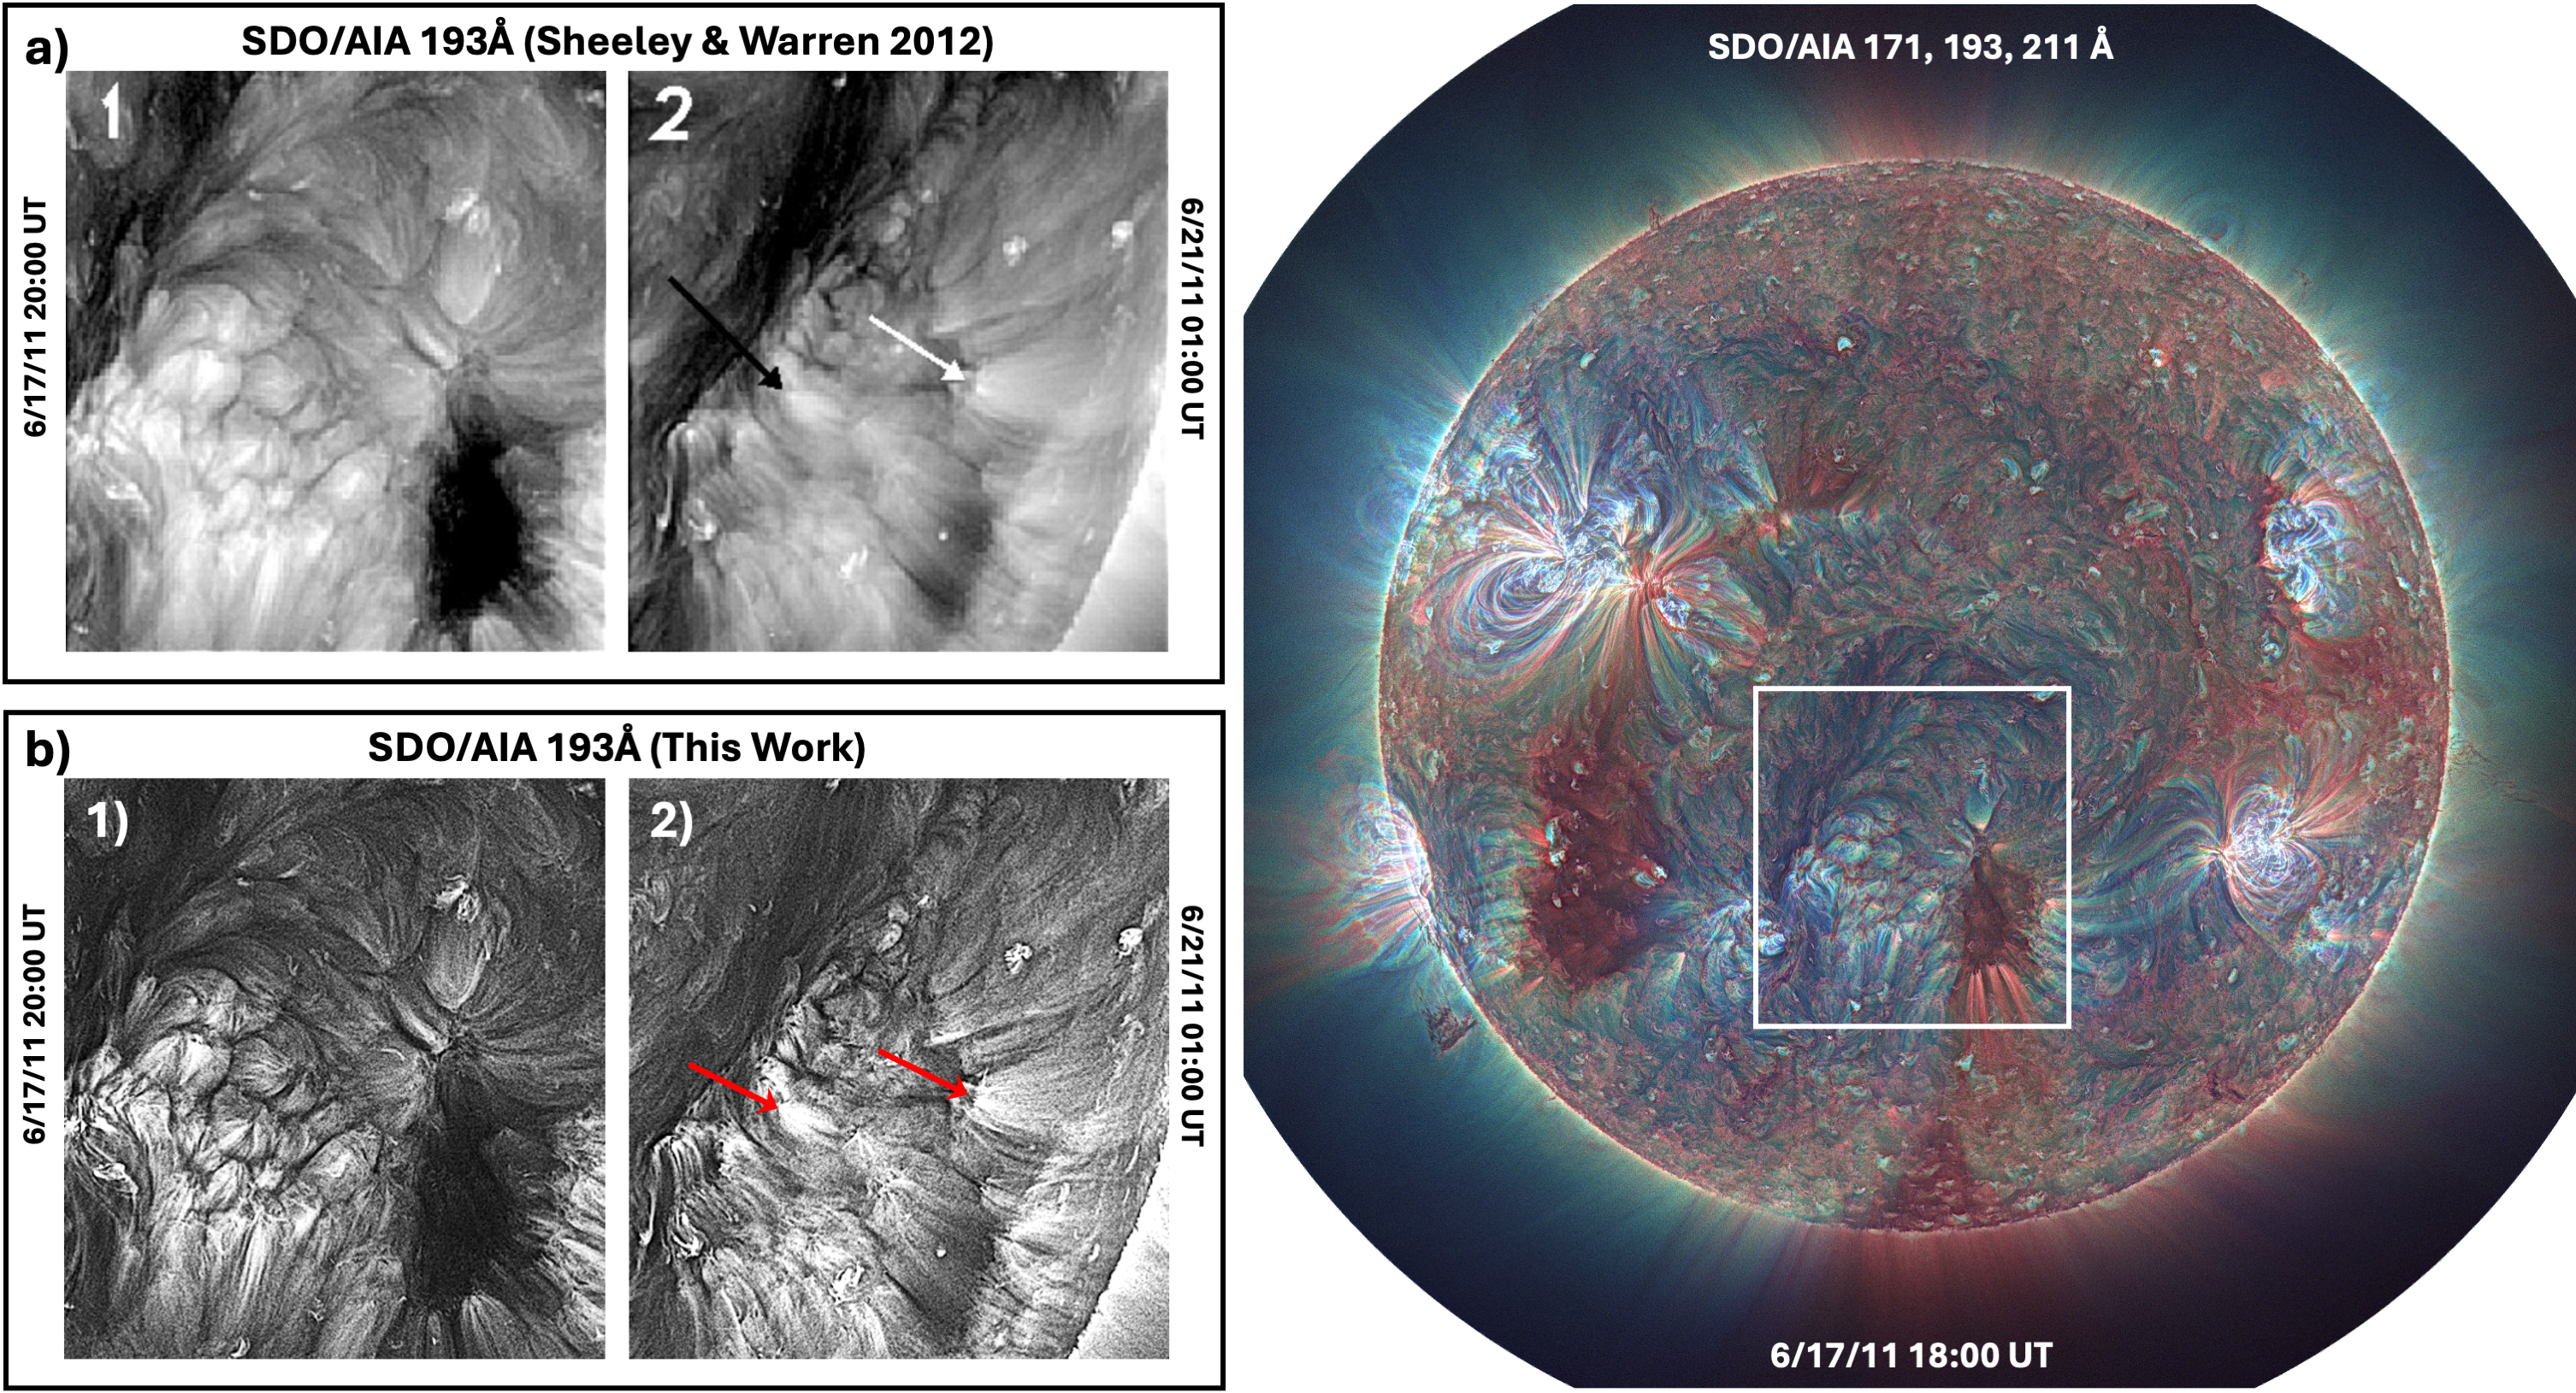
Coronal cells were first discovered by N. R. Sheeley & H. P. Warren (2012) in the magnetically closed corona. These cells were reported in Fe XII 193 Å observations with temperatures approximating 1.2 MK (Figure 1a). Later studies noted the presence of sporadic cells in coronal holes (CHs) too (e. g., N. R. Sheeley et al. 2014) visible not in 193 Å but in 171 Å observations, however, their presence in CHs has never been studied in detail. These types of structures, as originally documented in the magnetically closed corona, are the result of closely spaced radial flame-like structures that appear as cells when seen from above and as plumes when seen on the limb. Their bright centers are separated by narrow dark lanes with size of 30,000 km (supergranular size). Each of the coronal cells is centered above a concentration of photospheric flux in magnetogram observations, which also display supergranular spatial scale sizes. These closed-field cells (CF-cells) are found most commonly between filament channels and CH boundaries, and have been subsequently used to derive information about the horizontal magnetic field in the associated filament channels (N. R. Sheeley et al., 2013, 2014).
Bright, relatively short-lived features (i. e., EUV plumes) were considered to occur only in CHs (G. Poletto, 2015). However, recent observations using AIA’s 171, 193, and 211 Å EUV images and HMI magnetograms showed similar features in quasi-unipolar quiet, closed-field regions (Y. M. Wang et al., 2016; E. A. Avallone et al., 2018). These features appear to be born, live, and die in synchrony with the compact majority-polarity magnetic flux concentration at their foot carried by converging supergranular convection flows (R. L. Moore et al., 2023). Consequently, these features become fairly discernible in AIA 171 Å images when the majority-polarity network flux concentration starts to form. Once formed, the EUV plume luminosity, width, and upward extent remain roughly constant and maximal before fading to invisibility in AIA 171 Å emission as photospheric convection flows break apart the network flux concentration. The EUV plumes are not observed in the 193 Å passband (Fe XII emission from plasmas at temperatures around 1.6x10⁶ K) and the 211 Å passband (Fe XIV emission from plasmas at temperatures around 1x10⁶ K) as clearly as in the 171 Å passband (Fe IX emission from plasmas at temperatures around 6x10⁵ K). These plumes exhibit similar structuring to the coronal cells, rising above magnetic flux concentrations, except that plumes are much shorter lived. In fact, coronal cells are more akin to “network plumes” which are a more diffuse and faint set of plumes (only observable through brightness integration over time) as opposed to visible short-lived “beam plumes” (A. Gabriel et al., 2009).
Small-scale and transient magnetic activity may play a role in the formation and evolution of plumes (N. E. Raouafi & G. Stenborg, 2014). Coronal jets prior to the formation of a plume were first described by N. E. Raouafi et al. (2008) and N. E. Raouafi (2009) using . N. E. Raouafi & G. Stenborg (2014) then suggested that during the main phase of a plume, small jets, or jetlets, and plume transient bright points occur ubiquitously at the plume footpoints throughout the lifetime of the plume. P. Kumar et al. (2022) found that these small-scale plasma outflows or jetlets, are produced at the base of several equatorial and polar plumes. According to their work, these jets then transition smoothly into bright plumelets that comprise the overlying plumes. Plumelets, according to V. M. Uritsky et al. (2021), are filamentary substructures in plumes that may account for the brightness in the fully formed host plume. Additionally, L. P. Chitta et al. (2025) found that similar small-scale jet-like activity also occurs in the interplume region surrounding plumes.
Mid-latitude CHs are important for space weather, as they are the source of recurrent high speed streams responsible for a key subset of geomagnetic events. CH boundaries have also been hypothesized to be one possible source of the slow solar wind based on expansion factor and interchange reconnection models. Advanced image processing techniques (Figure 1b panels) can reveal detailed structuring within CHs, similar to the “candles on a cake” in the quiet Sun corona, discovered by N. R. Sheeley & H. P. Warren (2012). When examined in CHs, this detailed CH structuring may be directly connected to jets, plumes, and jetlets, recently hypothesized to be a source of the solar wind (V. M. Uritsky et al., 2023; P. Kumar et al., 2023; N. E. Raouafi et al., 2023). A detailed study of fine CH structure, including CH boundaries, would shed new light on the relationship between the interior of CHs and embedded solar wind structures, and CH boundary structure and the slow solar wind.
In this work, we leverage advanced image processing techniques applied to high-resolution and high-cadence extreme ultraviolet images and reveal detailed structuring inside mid-latitude CHs throughout a solar cycle. This allows to present a comprehensive comparison of coronal cells and plumes both in open and closed magnetic field topologies. In Section 2 we describe the data used in this work and the methods used for analyzing the data, in Section 3 we describe in detail our results, in Section 4 we discuss our interpretation of the results including our schematic representation of the coronal field composed of cells, and in Section 5 we present our conclusions.
2 Data and Methods
This study was carried out using data from the Atmospheric Imaging Assembly instrument (AIA; J. R. Lemen et al., 2012) onboard the Solar Dynamics Observatory (SDO). The AIA instrument images the solar atmosphere in seven EUV channels and three UV channels out to 1.3 . For this study, images in the 171, 193, 211 and 304 Å channels were used with a cadence of 12 s when analyzing specific regions and 1 hr for limb to limb analysis. For the three-wavelength (RGB) composite images we use the 171, 193 and 211 Å channels where red is the 171, green is the 193 and blue is the 211 channel. We also used line-of-sight (LOS) magnetograms from the Helioseismic Magnetic Imager (HMI, P. H. Scherrer et al., 2012), also onboard SDO The methodology implemented in this work can be separated into three main steps: (i) image processing for fine structure enhancement in EUV observations; (ii) identification of features and properties (i. e., CH boundaries, cell-like structures and lanes, magnetic flux concentrations); (iii) length series spectral analysis for the identification of characteristic scale size of cells.
2.1 Image Processing for Fine Structure Enhancement in EUV Observations
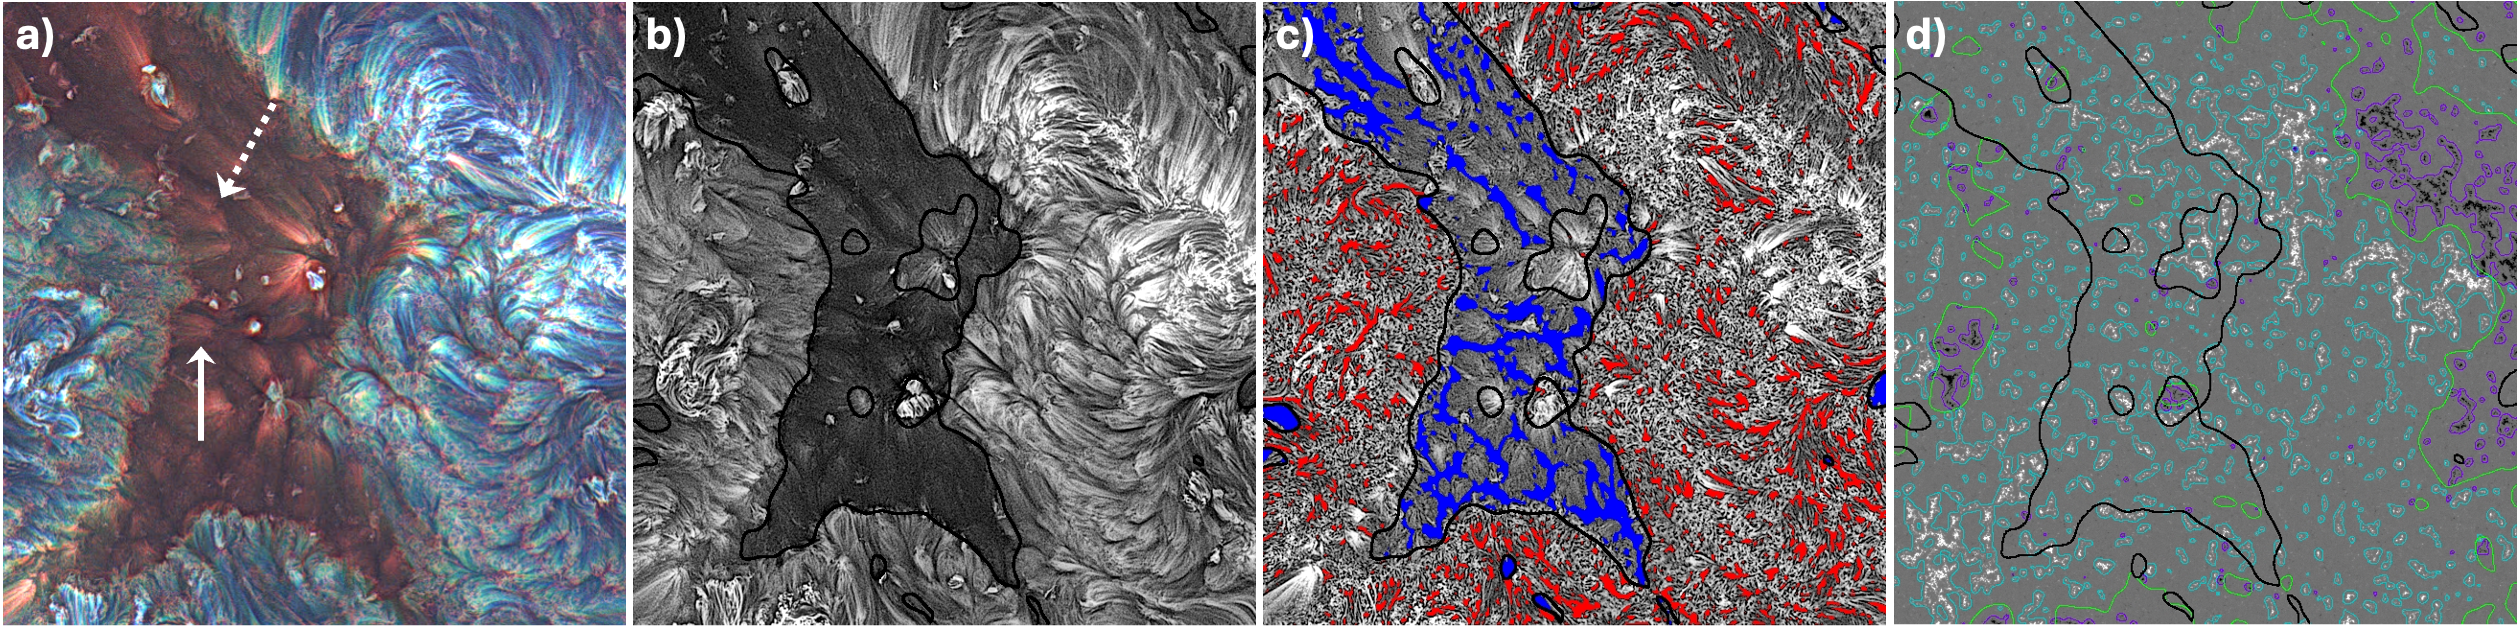
We began by applying a point filtering method to the original unprocessed images to remove outliers and isolated bright spots. We then applied the Multiscale Gaussian Normalization (MGN, H. Morgan & M. Druckmüller, 2014) technique to EUV images from the SDO/AIA instrument to reveal the fine structure details inside and outside each CH analyzed. This technique starts with a normalization of the unprocessed EUV image using a Gaussian-weighted sample of local pixels which is then rescaled by an arctan function. This is repeated over several spatial scales. Finally, the weighted combination of the normalized components is added to the original gamma-transformed image. The MGN processed EUV image reveals fine details in the corona and structures in off-limb regions. The image is then restricted to a certain sub-region around the CH of interest to which the image is cropped. Panels c) in Figure 1 and a) in Figure 2 show a 3-wavelength AIA composite processed with the MGN method showing regions of high contrast. The arrows in Figure 2a indicate coronal cell structures inside a CH.
2.2 Identification of Coronal Cells’ Features and Properties
To identify the CH boundary, we used the 193 Å AIA images since they appear to have greater brightness contrast between the CH regions and the nearby regions. We smoothed the processed images using the IDL Gaussian-Function with . The CH boundary is then defined as the contour level corresponding to a certain percentile level of the overall brightness of the cropped AIA 193 Å image. Panel b) in Figure 2 shows the result for one of our events.
The next step was to identify the coronal cell network and the corresponding lanes. We divided the processed AIA cropped image in two regions, inside and outside the CH boundary as defined above. The two separate regions were further smoothed via the IDL Gaussian-Function with inside the CH and outside the CH. This additional step helps reduce the level of details in the image revealed by the MGN method leading to a more uniform identification of the coronal cell lanes. We defined a certain percentile level of the overall brightness separately for the areas inside and outside the CH boundary below which the coronal cell lanes are defined. Panel c) in Figure 2 shows the lanes in blue inside the CH and in red outside the CH.
To investigate the connection between magnetic flux concentrations and coronal cells, we identified contour levels of magnetic field flux in HMI data. We smoothed the magnetogram images using the IDL Gaussian-Function with to identify the neutral line (green line in Figure 2d). The area of positive and negative fluxes were derived from images smoothed with and defined at levels 10 G (cyan contours in Figure 2d) and -10 G (purple contours in Figure 2d). Panel d) in Figure 2 shows the flux concentrations inside and outside the CH outlined with a black line.
2.3 Spectral Analysis of Average Brightness Across Slit
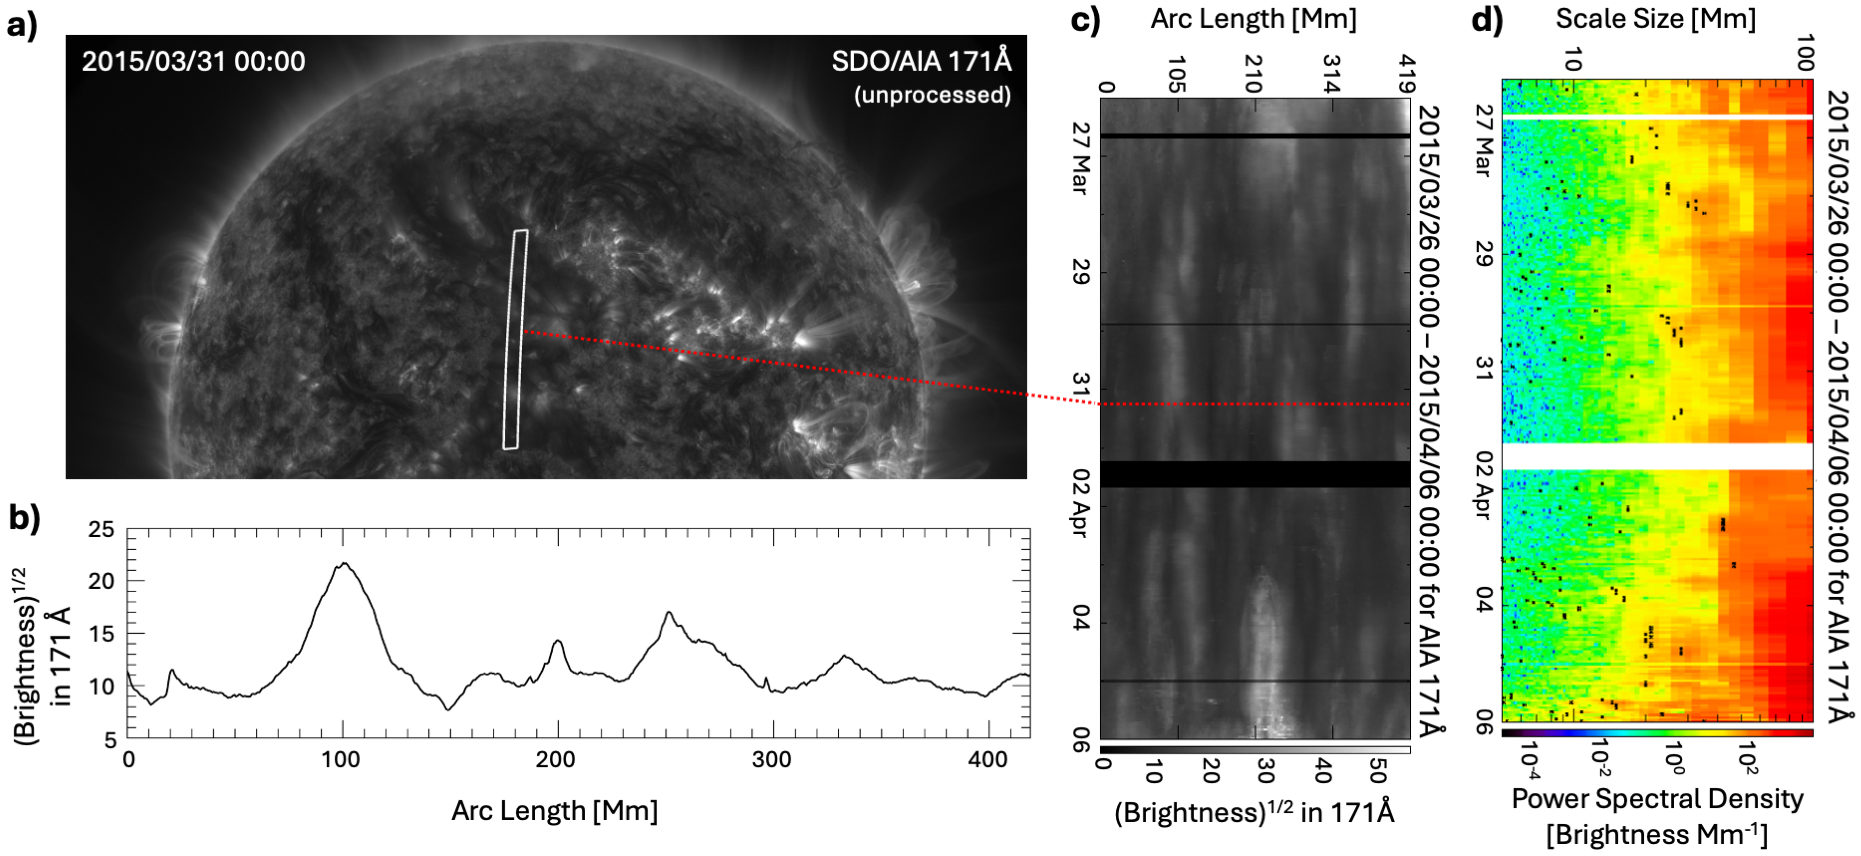
Figure 3a shows an unprocessed image of SDO/AIA for 2015-03-31 at 00:00 UT. We manually selected a slit (white contour) on the sun surface containing a series of coronal cells. Note that the vertices of the slit are connected by arcs along the sun surface. We then extracted a brightness profile along the longer side of the slit by deprojecting the portion of the image and taking the average brightness values of subareas defined by a uniform step of 0.1∘ (1.2 Mm) along the arc centered with respect to the shorter side of the slit. Figure 3b shows the square root of the average brightness length series revealing quasi-periodic variations on scales of tens of Mm. By taking into account the sun’s differential rotation, we track the same area and extract a brightness profile at each time step for 11 days. Figure 3c shows the resultant time evolution of the square root of the brightness length series. The black rectangles mark intervals of bad/missing files. To identify the characteristic size scale of the coronal cells, we applied a robust spectral analysis approach (S. Di Matteo et al., 2021), based on the multitaper method (MTM; D. J. Thomson, 1982) with time-halfbandwidth product =2.0 and =3 tapers. The software for this approach is open source and available to the community (S. Di Matteo et al., 2020). This technique enables the separation of the power spectral density (PSD) in a continuous background and discrete power enhancements related to periodic variations. The background estimation is obtained by means of a maximum likelihood fitting of a bending power law function to the PSD. In Figure 3d, Areas of the spectrum above the 90% confidence threshold, amplitude test, are marked with black dots in the dynamic spectrum and identify a characteristic length scale. Isolated dots are likely related to the expected level of false positives (10%), while clusters persisting in time constitute the most reliable identifications. In this work we consider the average size scale of each cluster as one identification of the characteristic cells’ size scale. Note that the MTM approach provides an additional independent test, the F-test, for the identification of periodicities in a data series which is often combined with the amplitude test to obtain more robust results. In our investigation, the addition of this test reduces the number of selected events but lead to the same conclusions. Therefore, in the following we only show the results stemming from the application of the amplitude test. Applying the same spectral analysis procedure on brightness profiles extracted from the MGN processed images, in which cells are better revealed, we obtain similar results .
3 Observations and Results
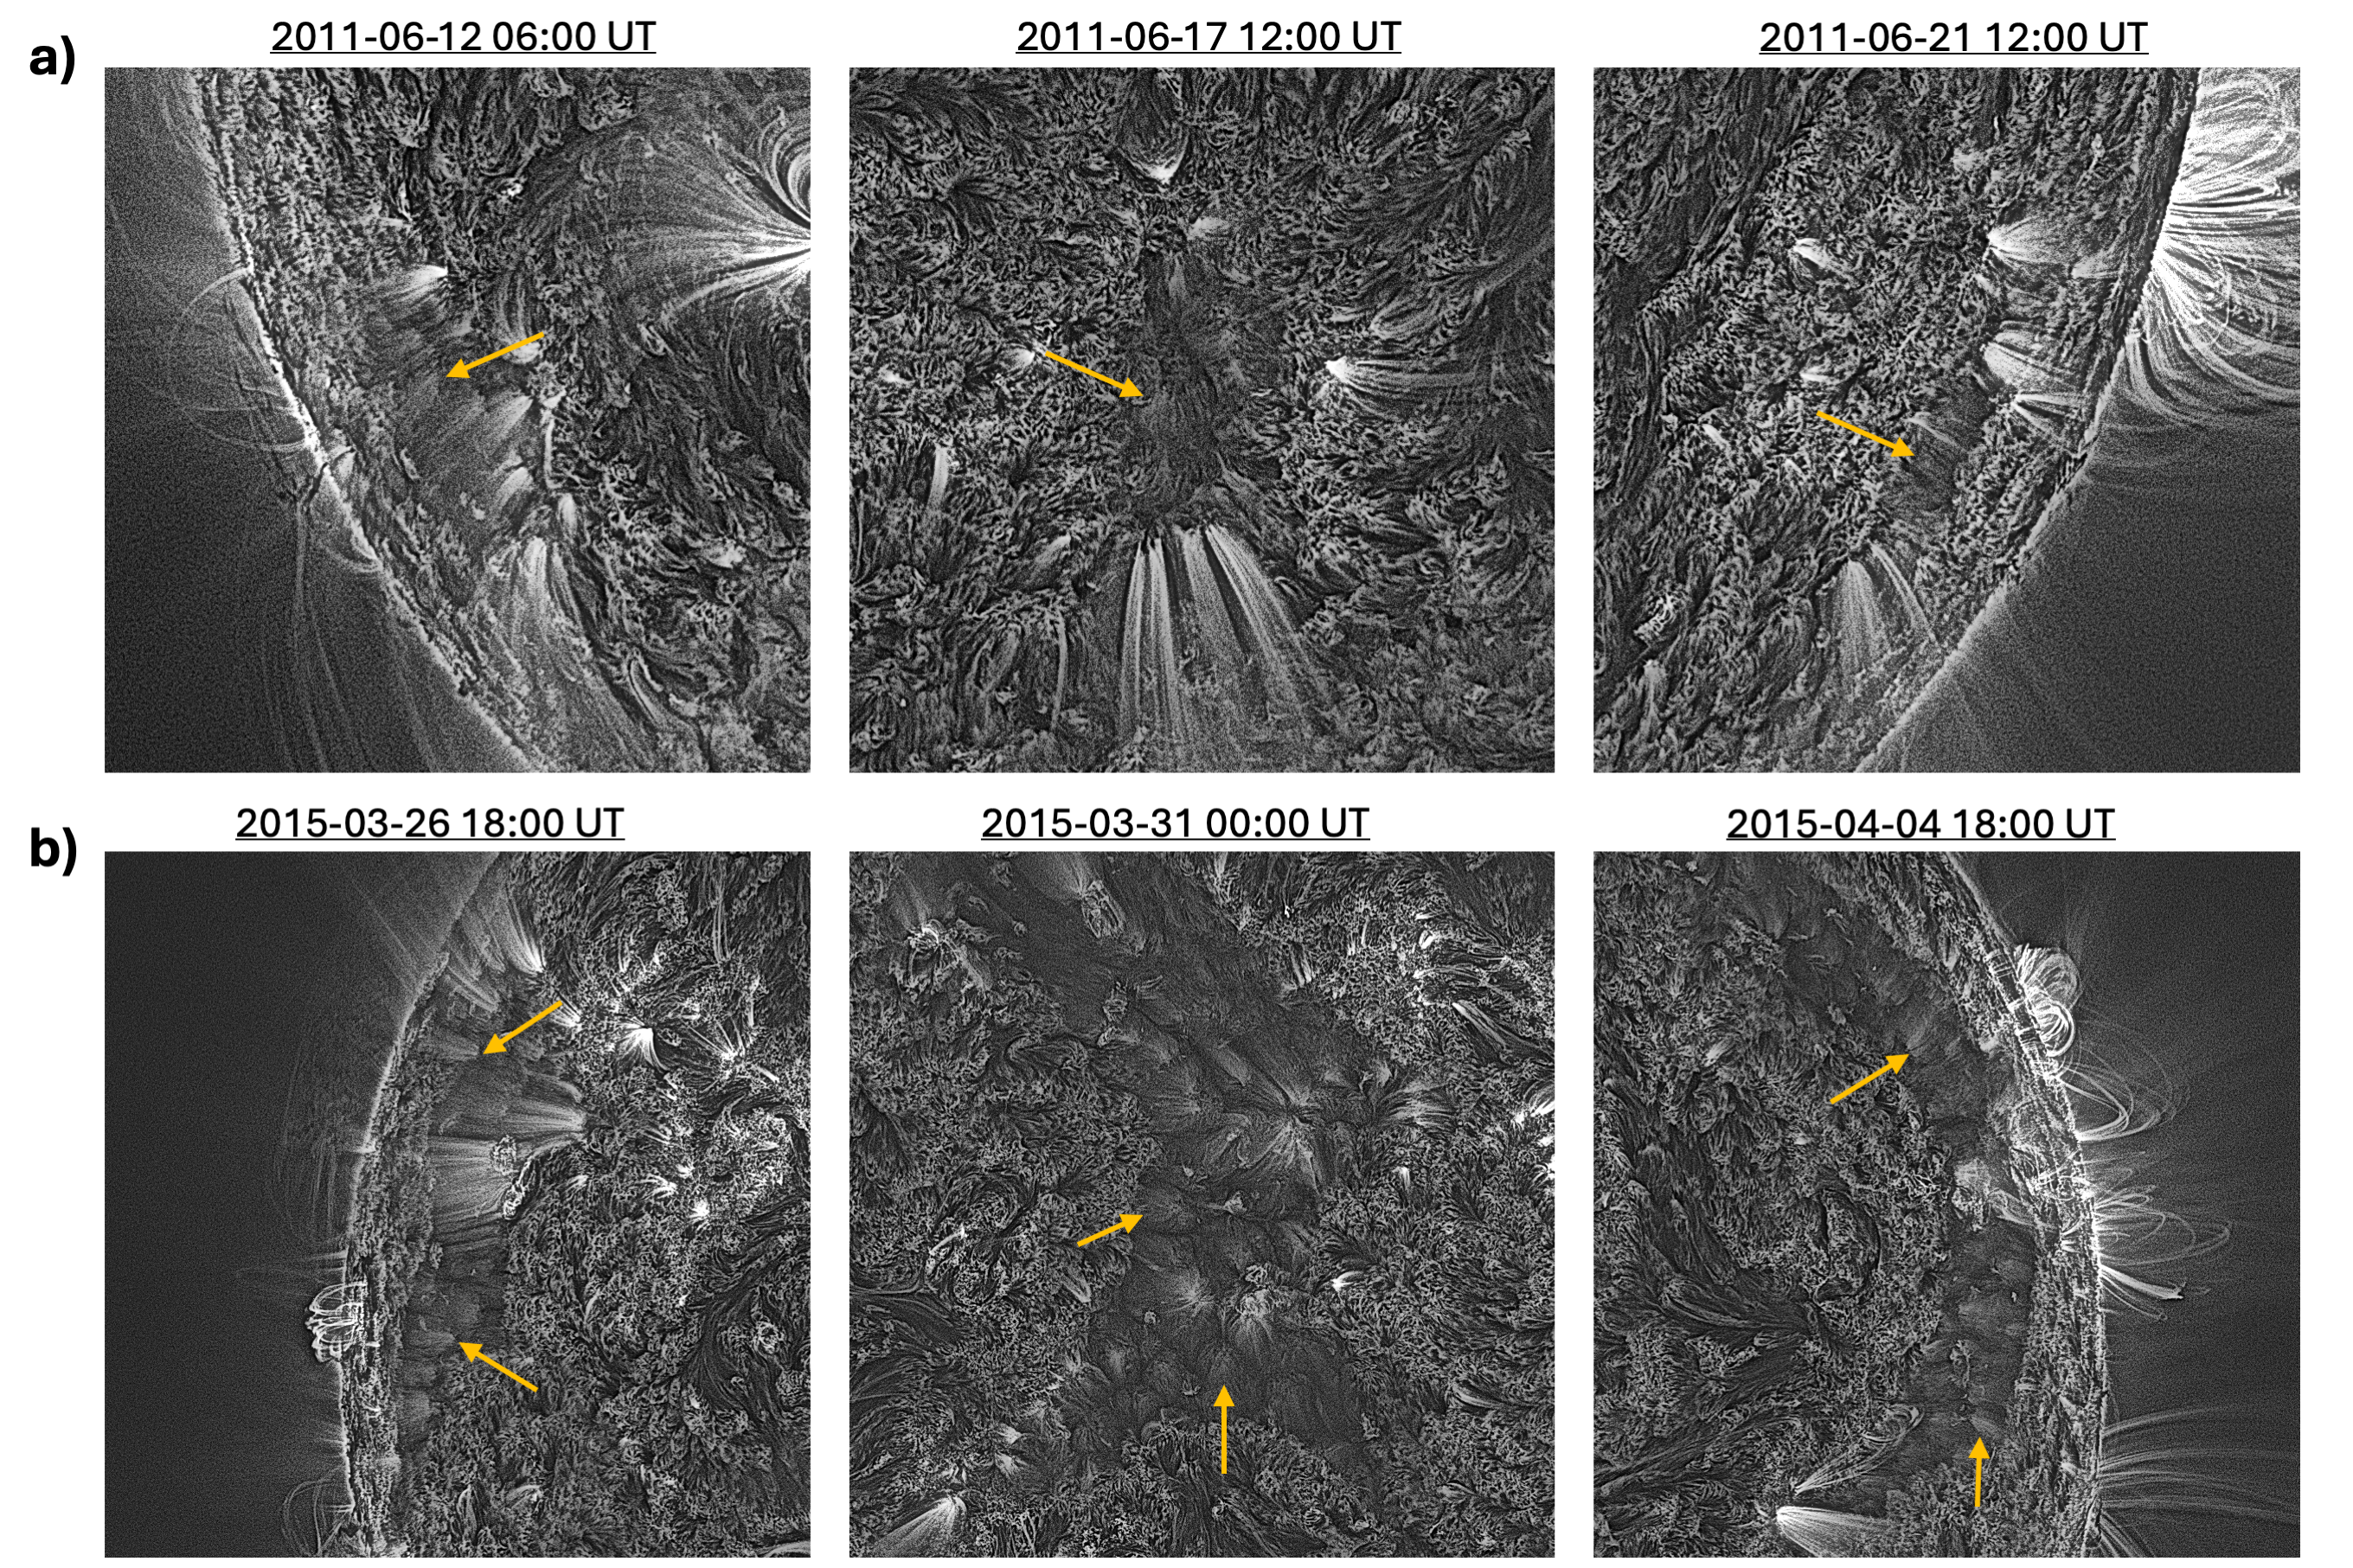
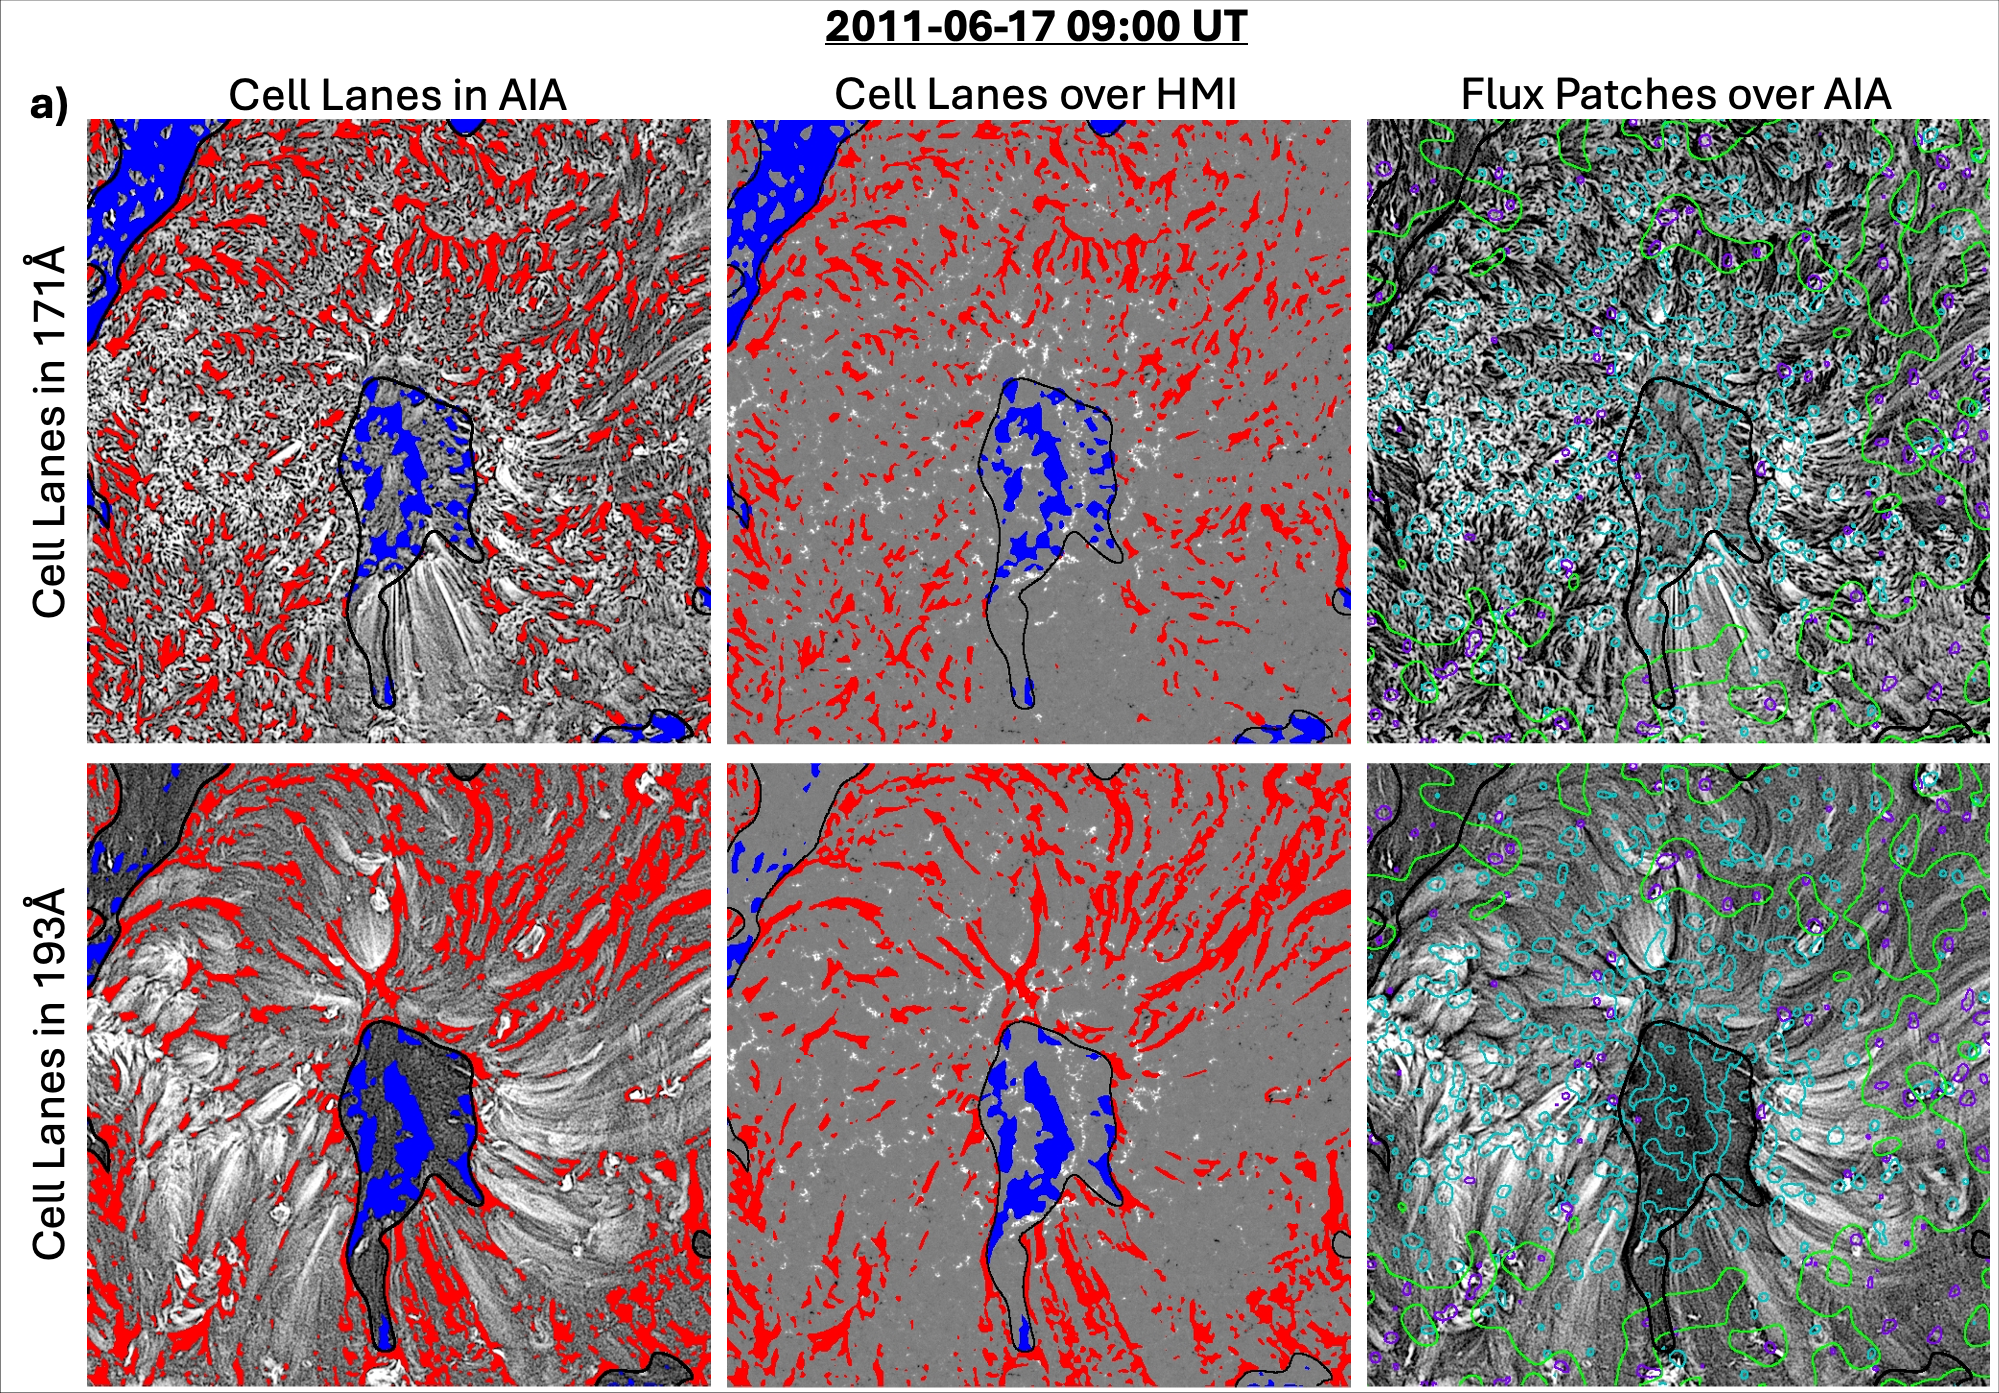
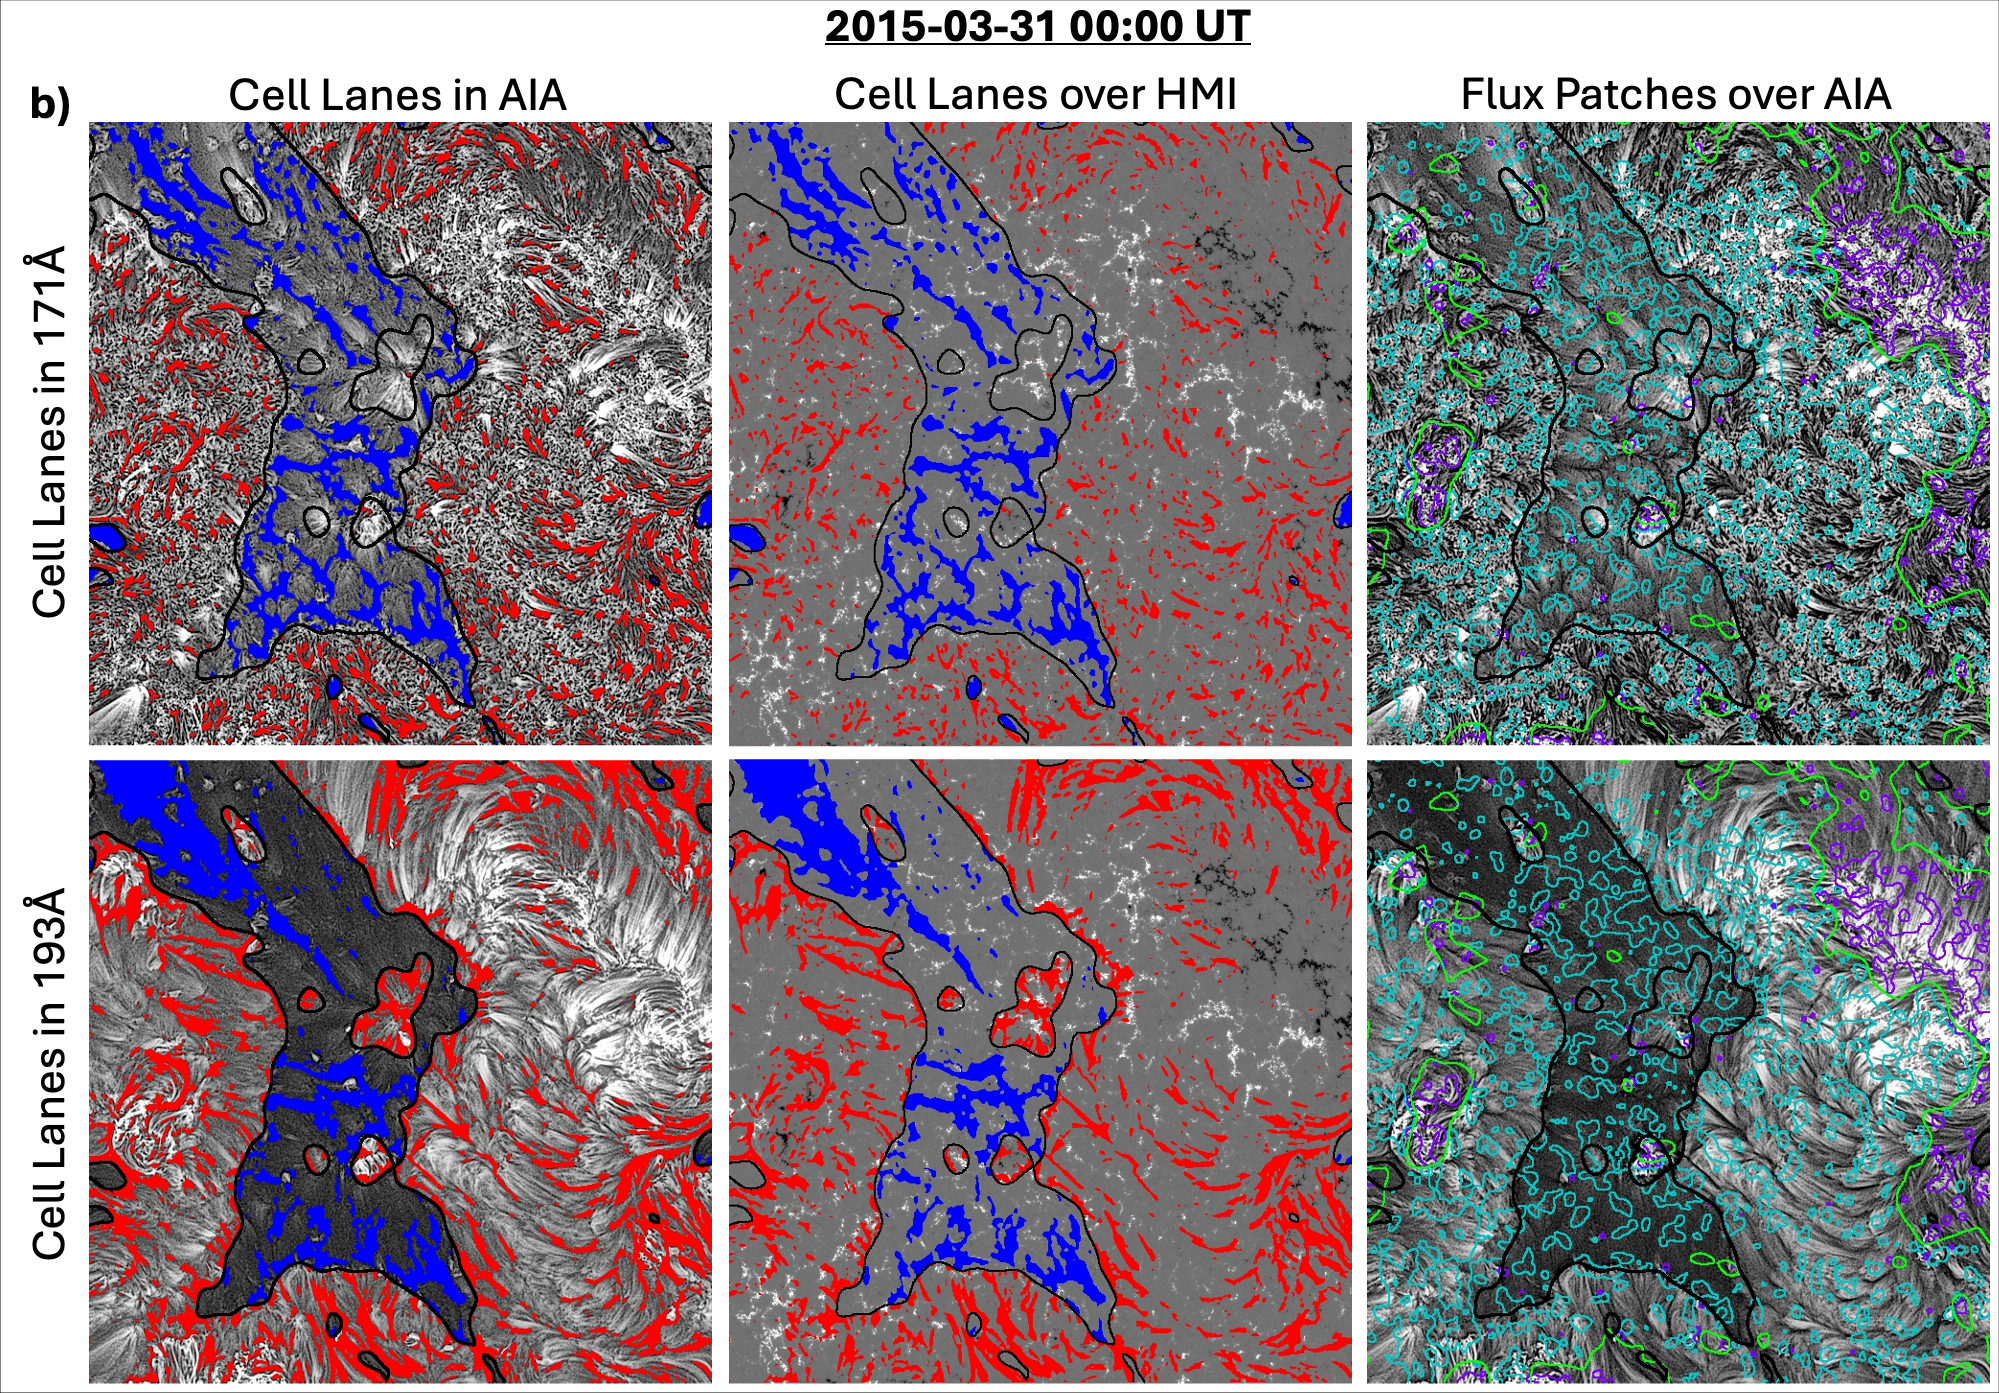
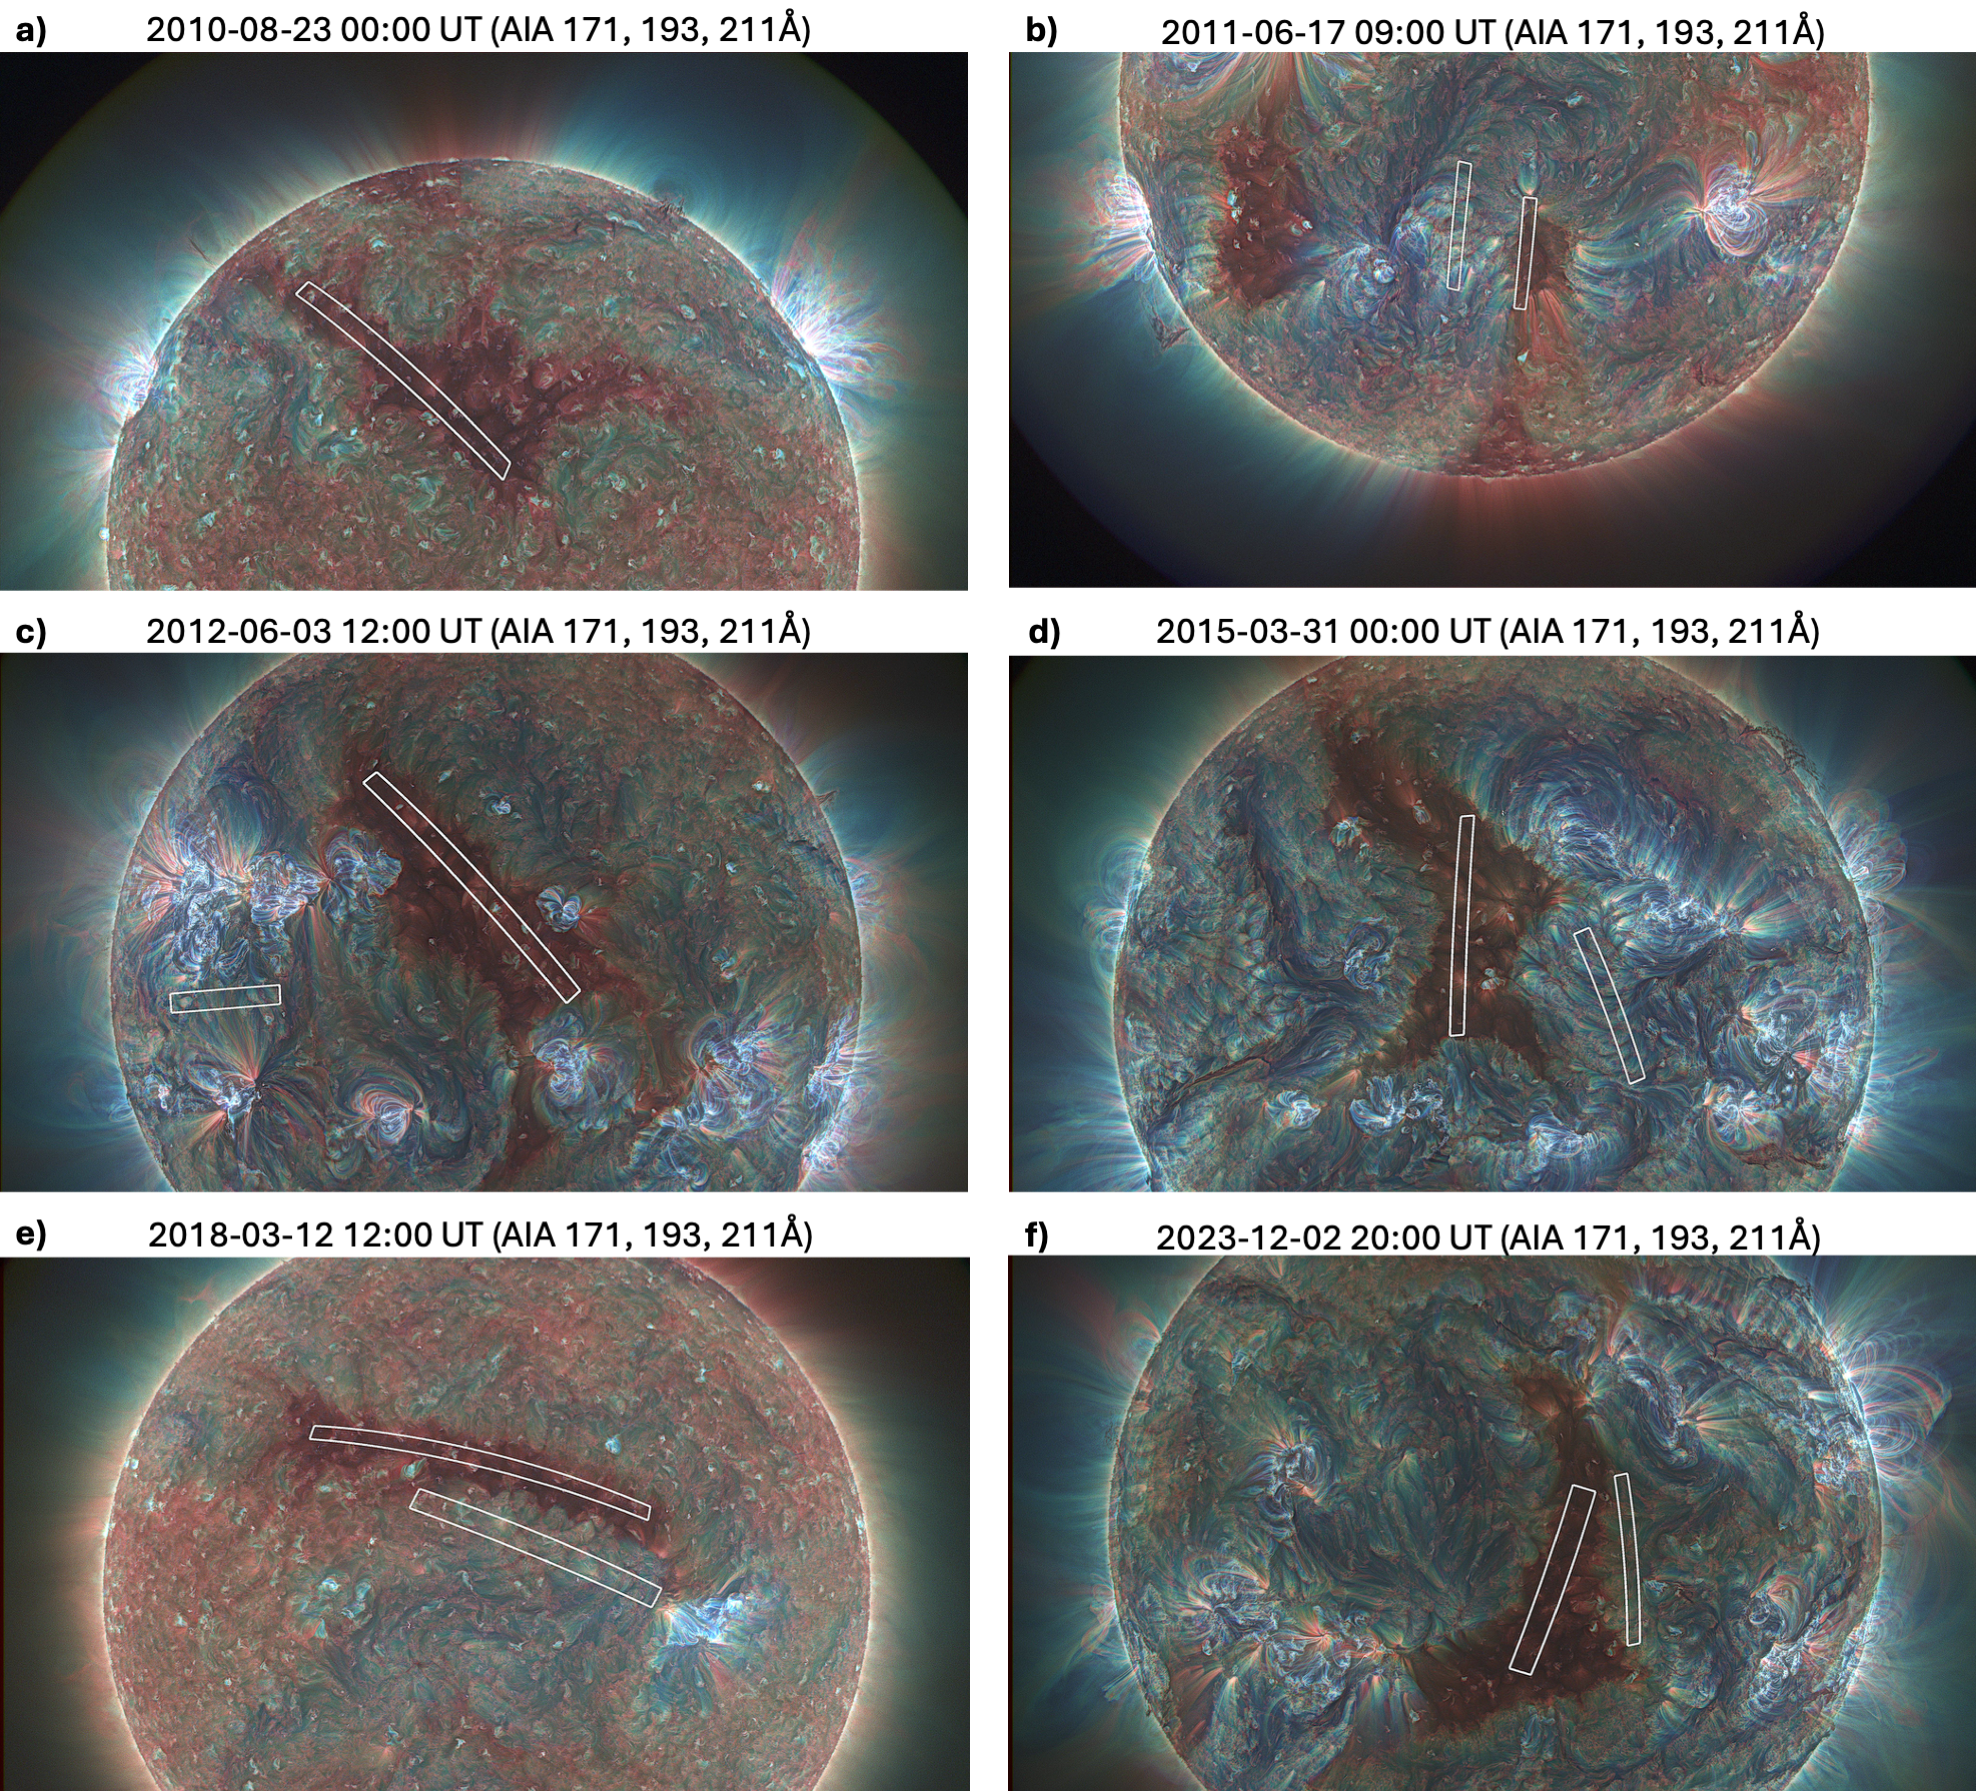
- and CF-cells are similar in shape and size and are characterized by ray-like features. The left column shows that -cells are better identified in 171 Å observations while the CF-cells are clearer in 193 Å. The cells are delimited by dark lanes both inside (shown in blue) and outside (shown in red) the CH which are best visible in the same wavelength in which the cells are best seen. The HMI magnetograms (middle column) show that the cell lanes, identified in AIA, always surround an area with a small magnetic flux concentration. The polarity of these magnetic flux concentrations is, for the vast majority, the same inside and in proximity of the CH. This is further shown in the third column, in which we compare AIA observations with the magnetic flux concentrations represented by contour levels at +10 G (cyan) and -10 G (purple) separated by the neutral line (green). Note that the magnetic flux concentrations are located at the base of both - and CF-cell, in which the ray-like features of the cells appear to be rooted. There are also some loop-like structures, more visible in 193 Å observations, inside the CH which appear to be associated with bipolar flux at the photosphere. We further support these observations performing a detailed analysis of - and CF-cells for six events throughout Solar Cycle 24. The RGB composite for each event in Figure 6 shows that coronal cells are observed throughout the solar cycle with very similar characteristics. each event, confirmed the persistence of the coronal cells’ properties previously discussed throughout the solar cycle.
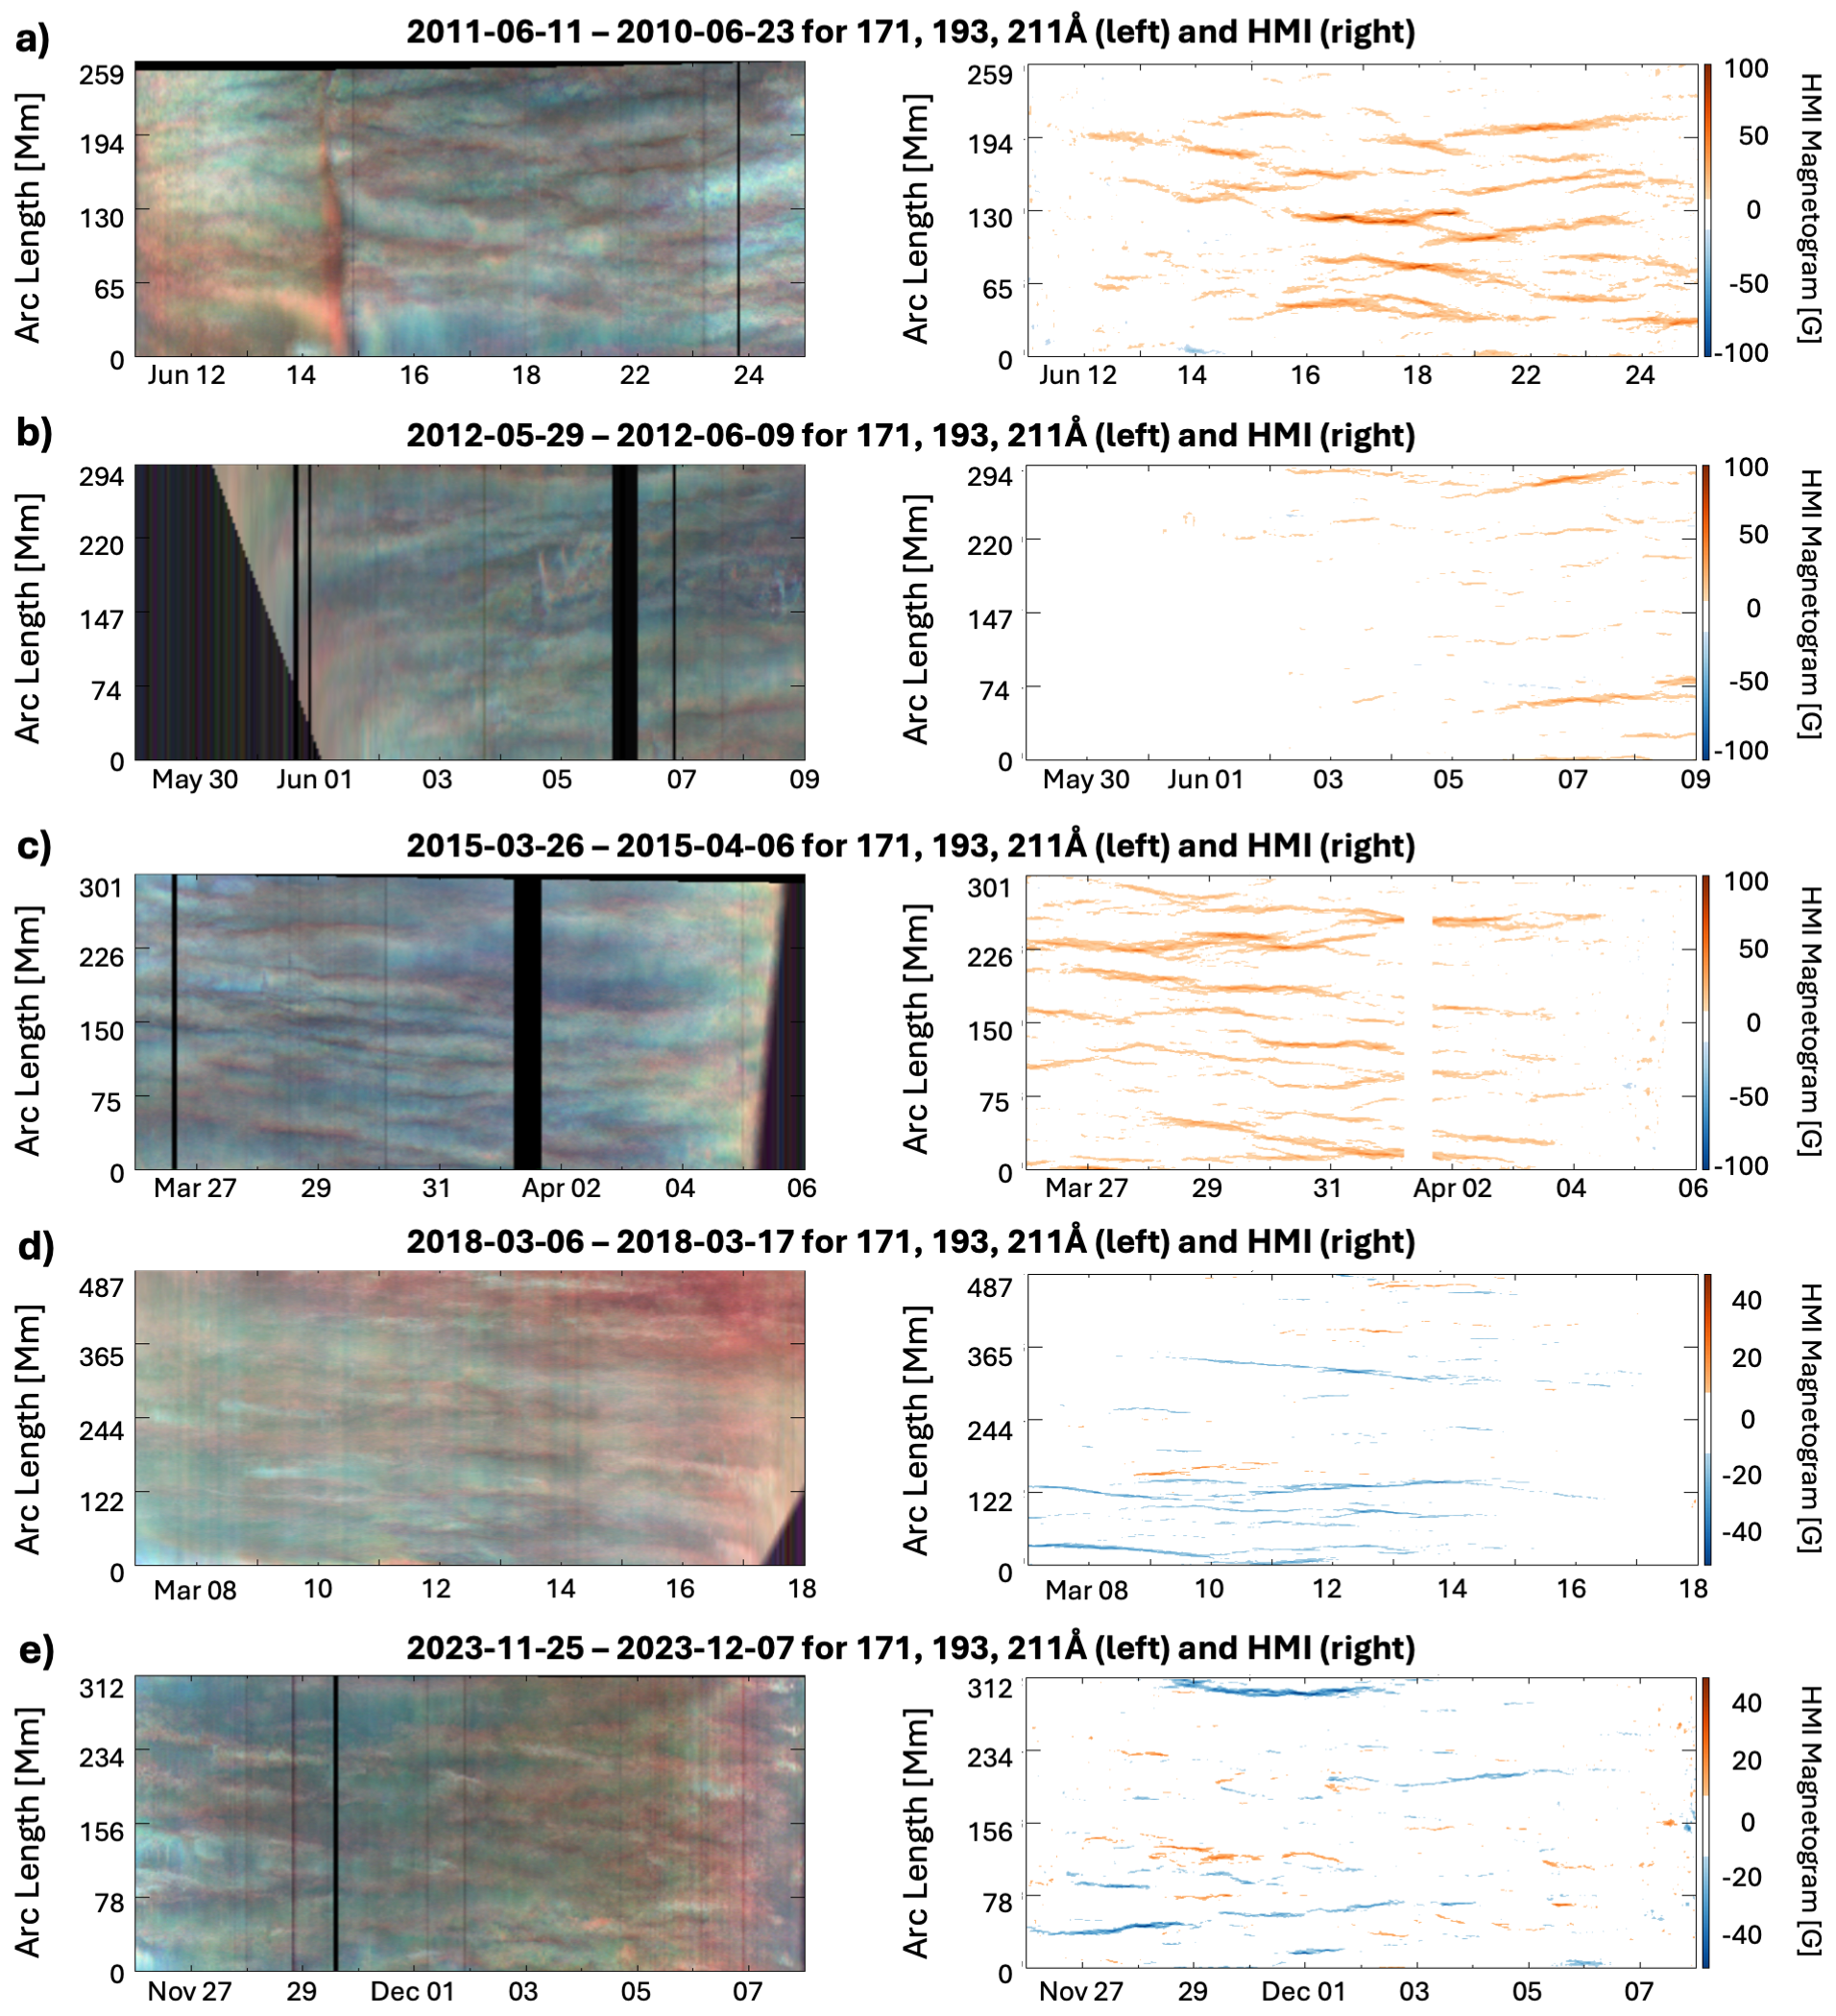
3.1 Lifetime of coronal cells and relation to network magnetic flux concentrations
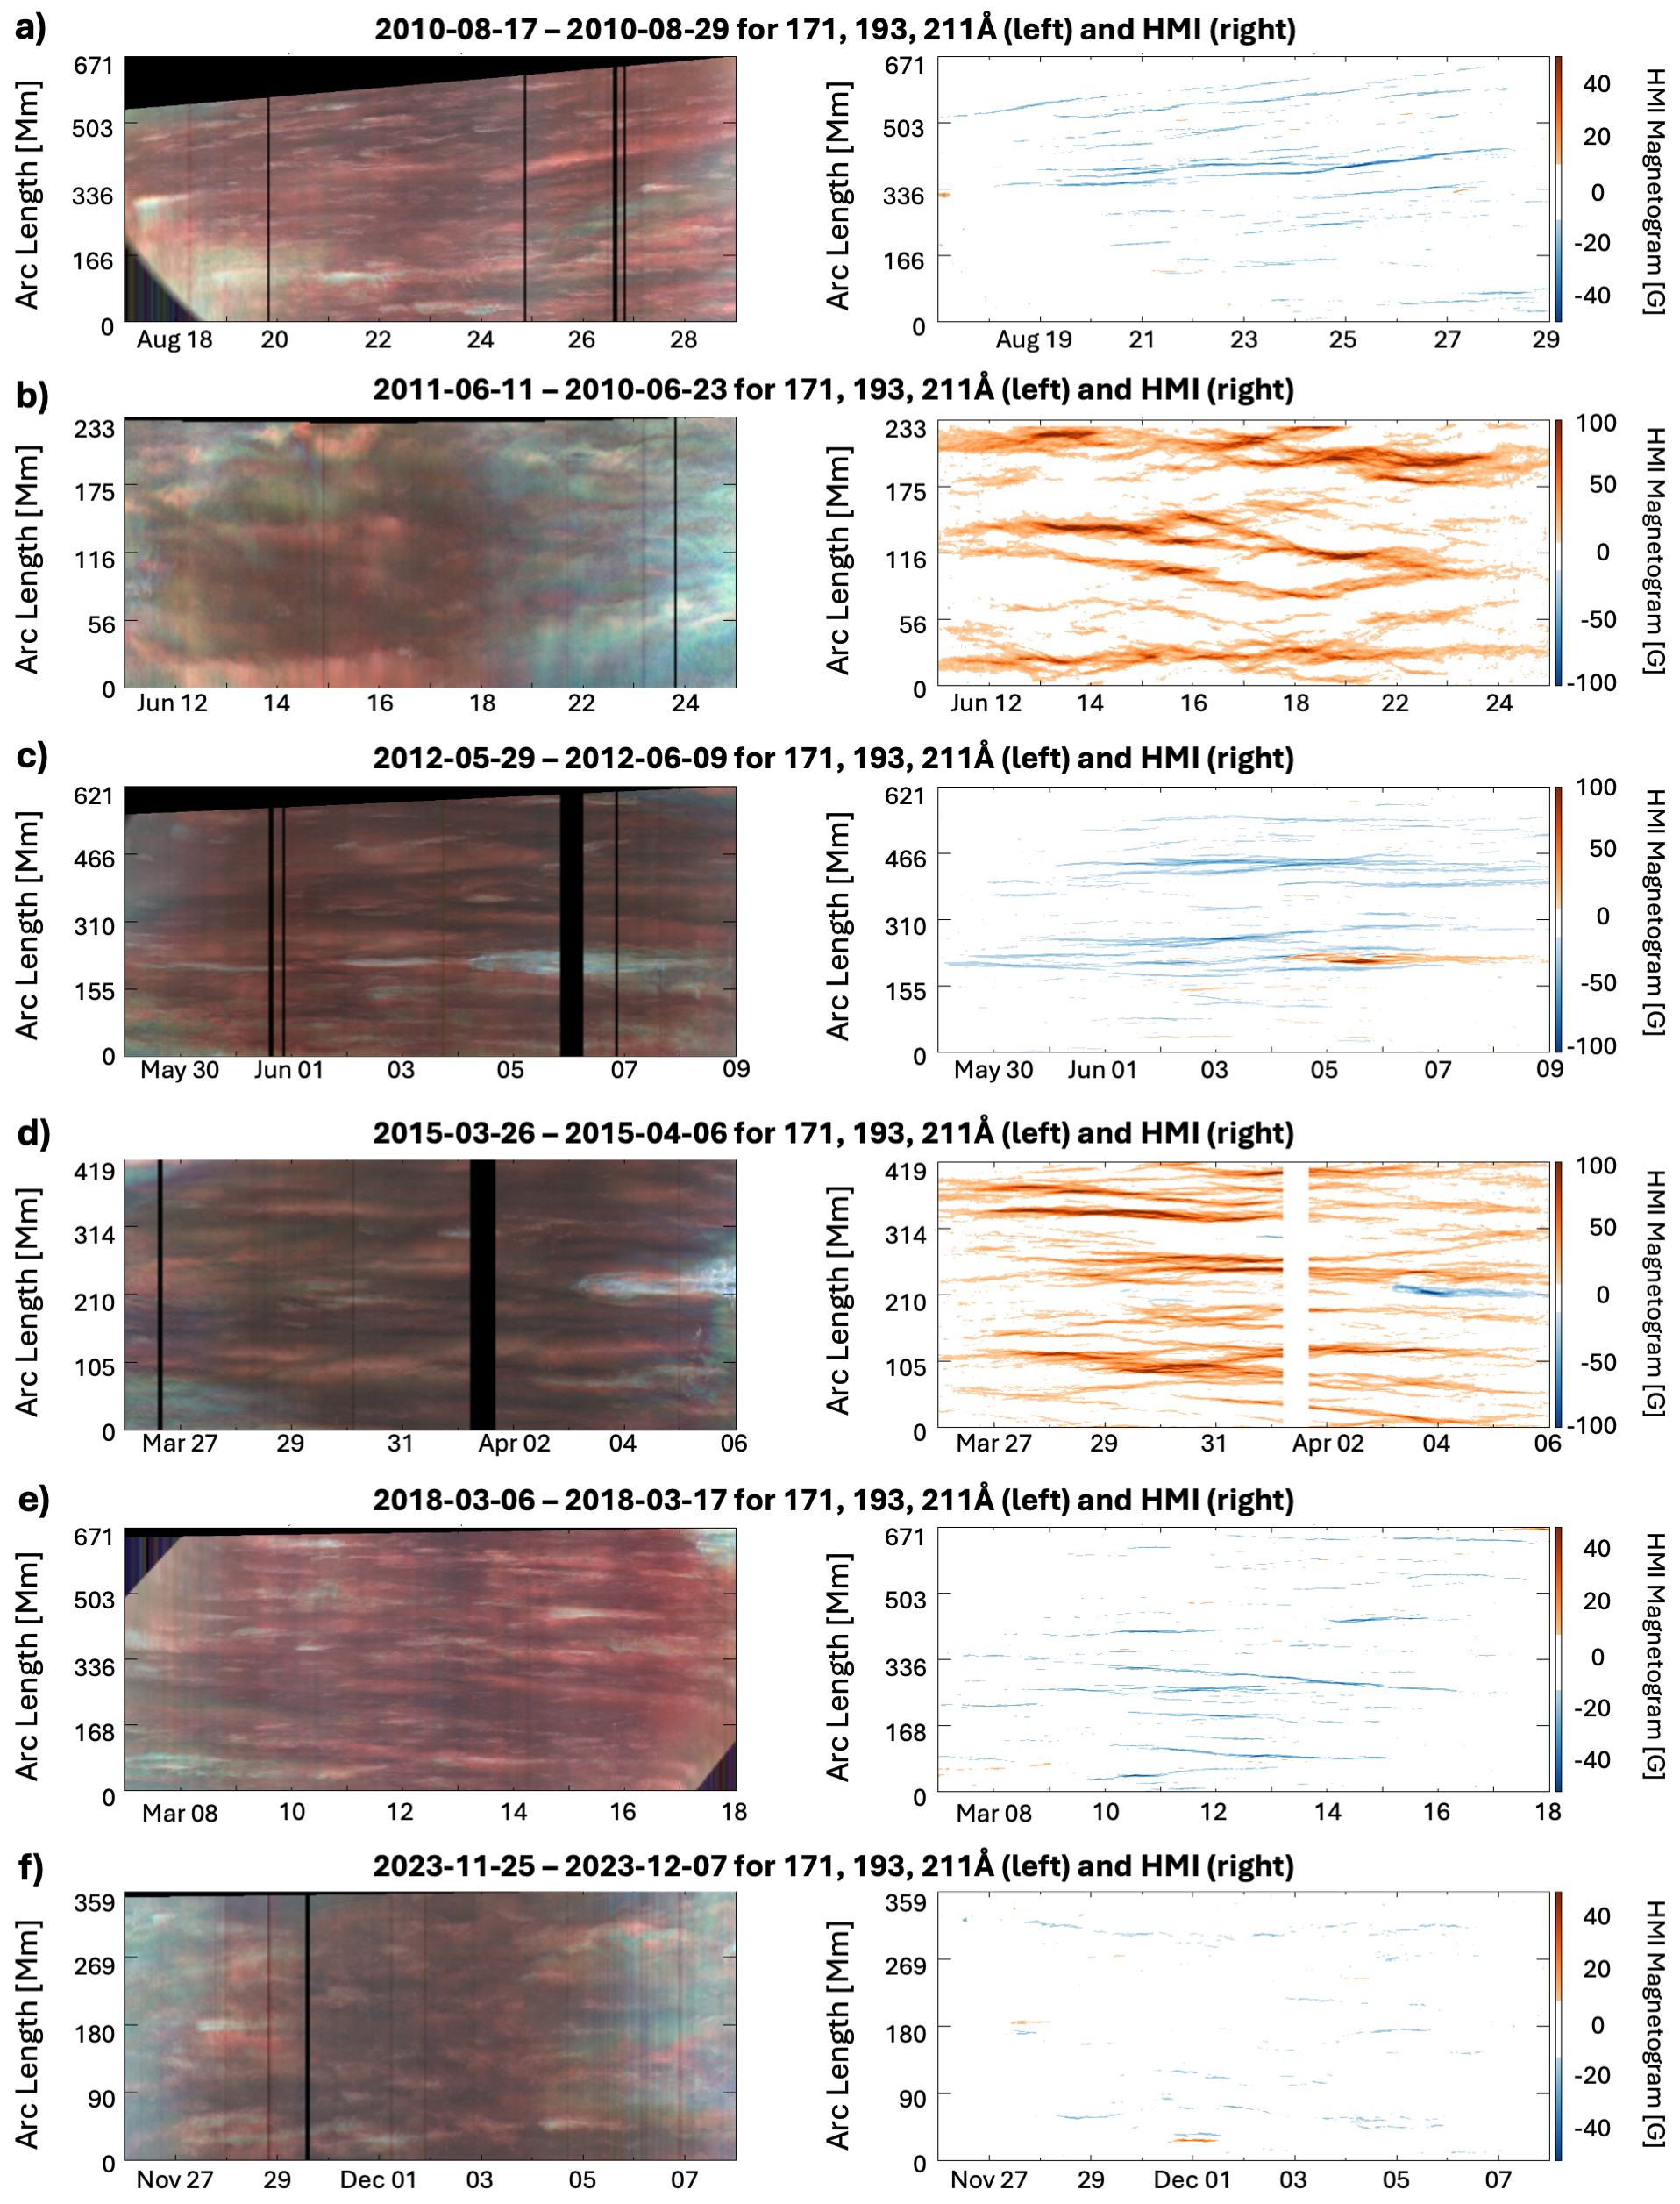
To estimate the lifetime and size scales of coronal cells, we extracted slits from white rectangles inside and outside each CH as identified in Figure 6. Note that for the event on 23 august 2010 there were no clear consecutive CF-cells which are usually more evident near an AR that in this case was visible only on the sun limb. Figure 7 shows the RGB composite of the brightness extracted from the slits inside each CH for a time period of at least 11 days. The vertical black band indicates data gaps. Due to the sun’s differential rotation the shape of the slit changes as the sun rotates affecting the actual length of the slit. This effect is reflected in the dark areas at the top and/or bottom of each plot. The -cells appear as bright patches that persist from a few hours to a few days. RGB composites in panels c and d show the emergence of isolated structures (cyan features) with high brightness also in 193 and 211 Å observations. To further investigate the nature , we extracted values of the HMI magnetograms along the same slits and reported the results on the right of each panel showing only regions with average magnetic field above 10 G . The -cells show a one-to-one correspondence with unipolar flux concentrations of the same polarity dominating the CHs. The brighter structures, also previously reported as coronal plumes (R. L. Moore et al., 2023), are associated with stronger magnetic flux concentrations. Lastly, bright structures in 193 and 211 Å wavelength find a one-to-one correspondence with the emergence of bipolar magnetic flux relating them to coronal bright points (M. S. Madjarska, 2019). Figure 8 shows the properties of CF-cells ranges from a few hours to a few days. Looking at the corresponding HMI magnetograms, on the right of each panel, we can see again how each cell is related to the emergence of unipolar magnetic flux concentrations. Also, note that the polarity of these flux concentrations is the same as the one in which the nearby -cells are rooted (except for the event on 3 June 2012, for which the selected CF-cells are far from the CH ) indicating that nearby - and CF-cells are part of the same large scale unipolar region. The differences in their properties reside in their magnetic field connectivity. Based on the RGB representation, CF-cells show similarities with the coronal bright points inside CHs (panels c and d in Figure 7) associated with closed filed lines. Interestingly, small bipoles emerge also outside the CH forming similar coronal bright points, clearly distinguishable from CF-cells (e. g., panel d and e in Figure 8). These observations suggest that cells are a manifestation of unipolar magnetic flux concentrations due to supergranular motion at the photosphere with CF-cell magnetic field closing into areas of magnetic field concentrations of opposite polarity. The -cells appear to be the building blocks of CHs with their magnetic field expanding outward to form the sun open field.
3.2 Size scales of coronal cells
Lastly, we investigate the possible relation of cells with supergranules by estimating the cell’s size scale. The average brightness length series (see example in section 2.3) shows quasi-periodic variations. The different amplitude and duration of the brightness variations are related to the characteristic scale of the cells but it could be affected by: (i) the particular choice of the slit, which might include only a portion of some cells; (ii) the lifetime and evolution of cells, which might make them move outside the slit or slowly disappear. We tested the MTM spectral analysis approach on brightness profiles extracted from various slits. For a poor choice of the slit, not including deliberately the full cells or only isolated ones, we obtained sporadic isolated identification of periodicities like the one in Figure 3d for scales of a few Mm. When we analyze slits containing a series of cells, the spectral analysis reveals a cluster of periodicity identifications persisting in time (see Figure 3d for scales of 25 Mm). It follows that isolated dots are likely related to the expected level of false positives (10%), while clusters persisting in time constitute a reliable identification of the characteristic size scale of cells. In this work, we consider the average size scale of each cluster as one identification of the characteristic size scale of cells. This approach effectively reduces arbitrary choices in the definition of the cells’ spatial extension and reduces possible sources of uncertainties.
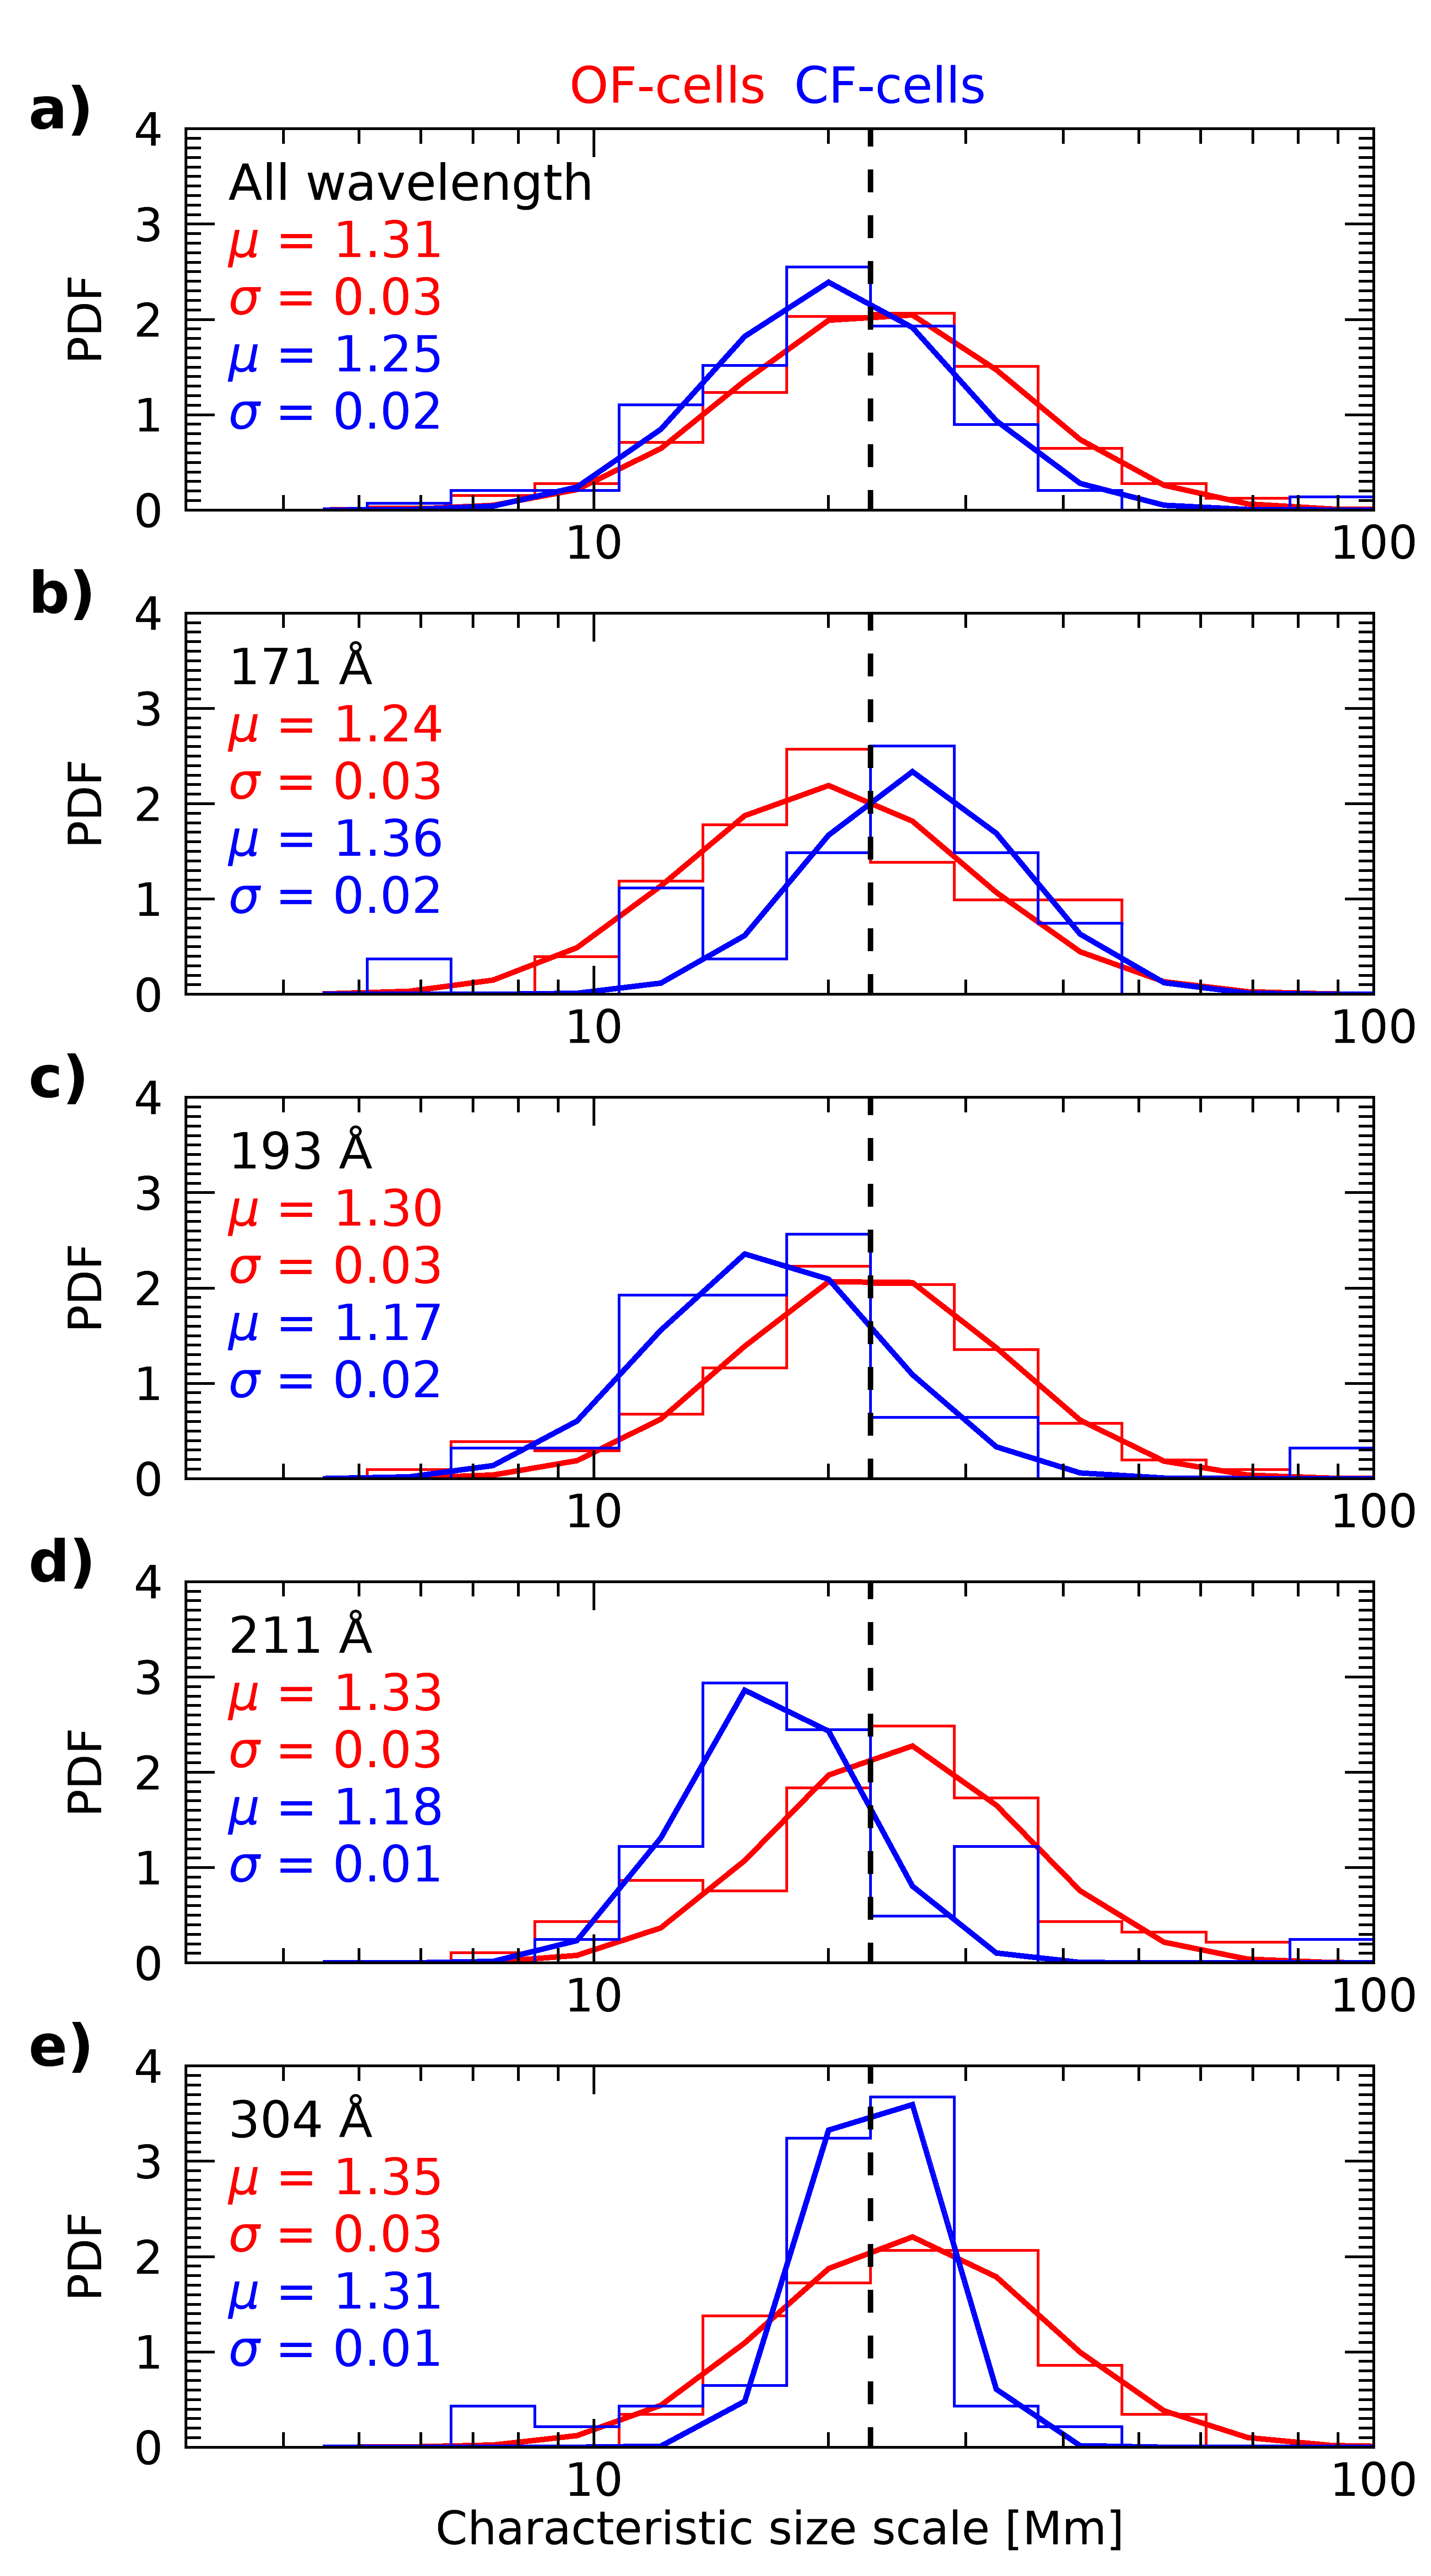
We applied the MTM spectral analysis approach to average brightness profiles extracted from MGN processed images for the six events covering the phases of the solar cycle and for four wavelengths (i. e., 171, 193, 211, and 304 Å; results for slits extracted from unprocessed and MGN processed 171 and 193 Å images for all events are ). Figure 9 shows the total and by wavelength probability density function (PDF) of the characteristic size scales of both -cells (red profiles) and CF-cells (blue profiles; except for the event on 23 August 2010 for which there was no clear series of CF-cells). The total PDF (panel a in Figure 9) reveals that the size scales of - and CF-cells follow a log-normal distribution (). By fitting a normal distribution in logarithmic space, we can estimate the parameters of the distributions which are summarized in . The of the log-normal distribution is for -cells and Mm for CF-cells. When divided by wavelength, the -cells show size scales close to the values in all wavelengths except for 171 Å for which they appear more often at smaller scales. On the other hand, CF-cells smaller when observed in 193 and 211 Å and larger in 171 Å. While these results are intriguing, a more extensive analysis is needed to confirm them and draw a robust conclusion.
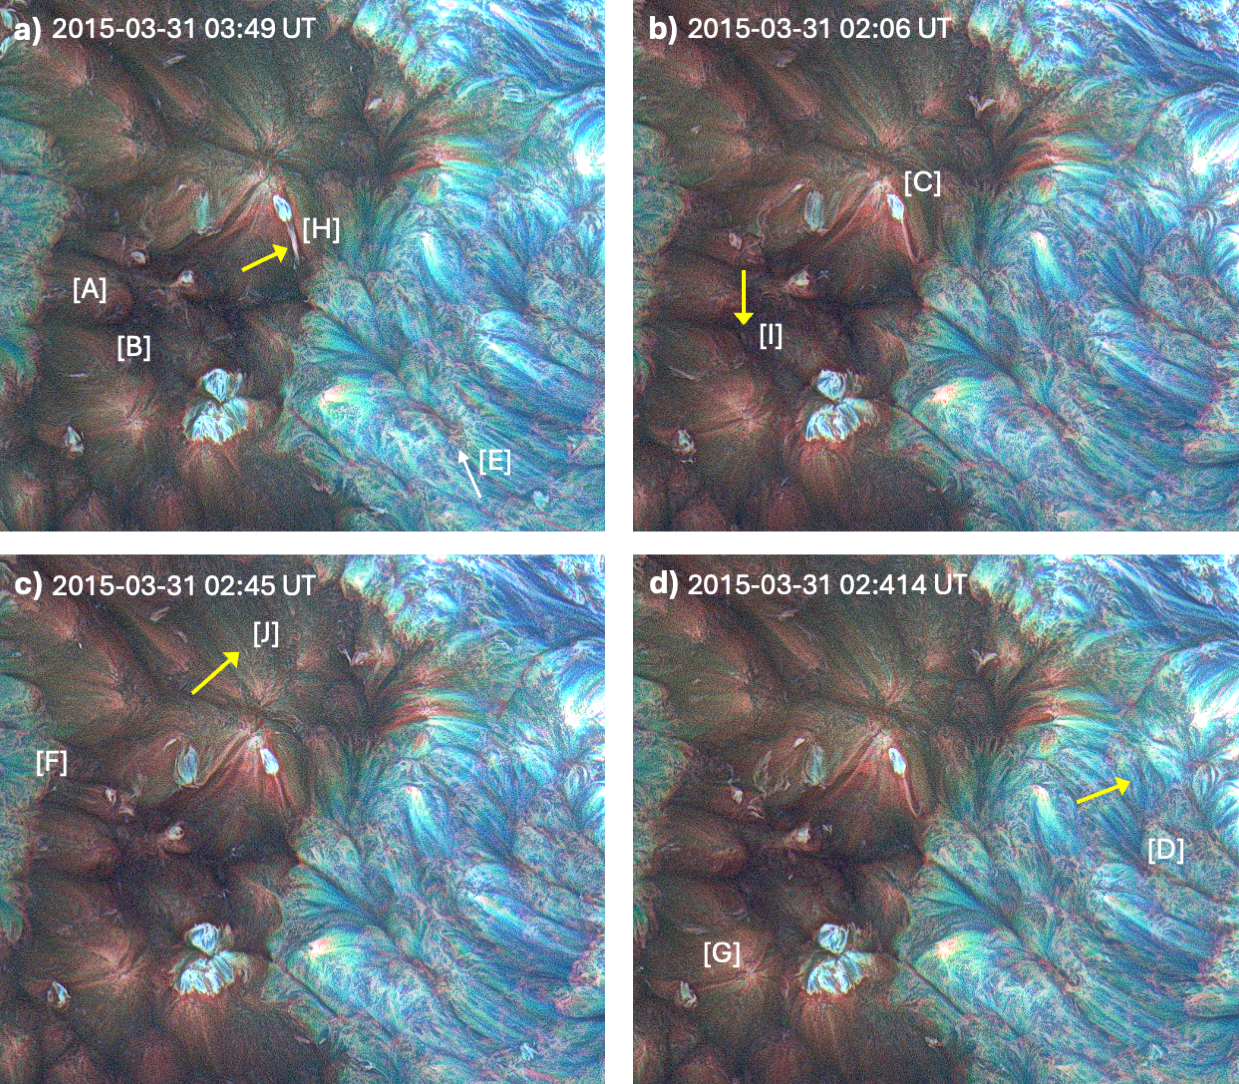
3.3 Small scale jetting activity inside coronal cells
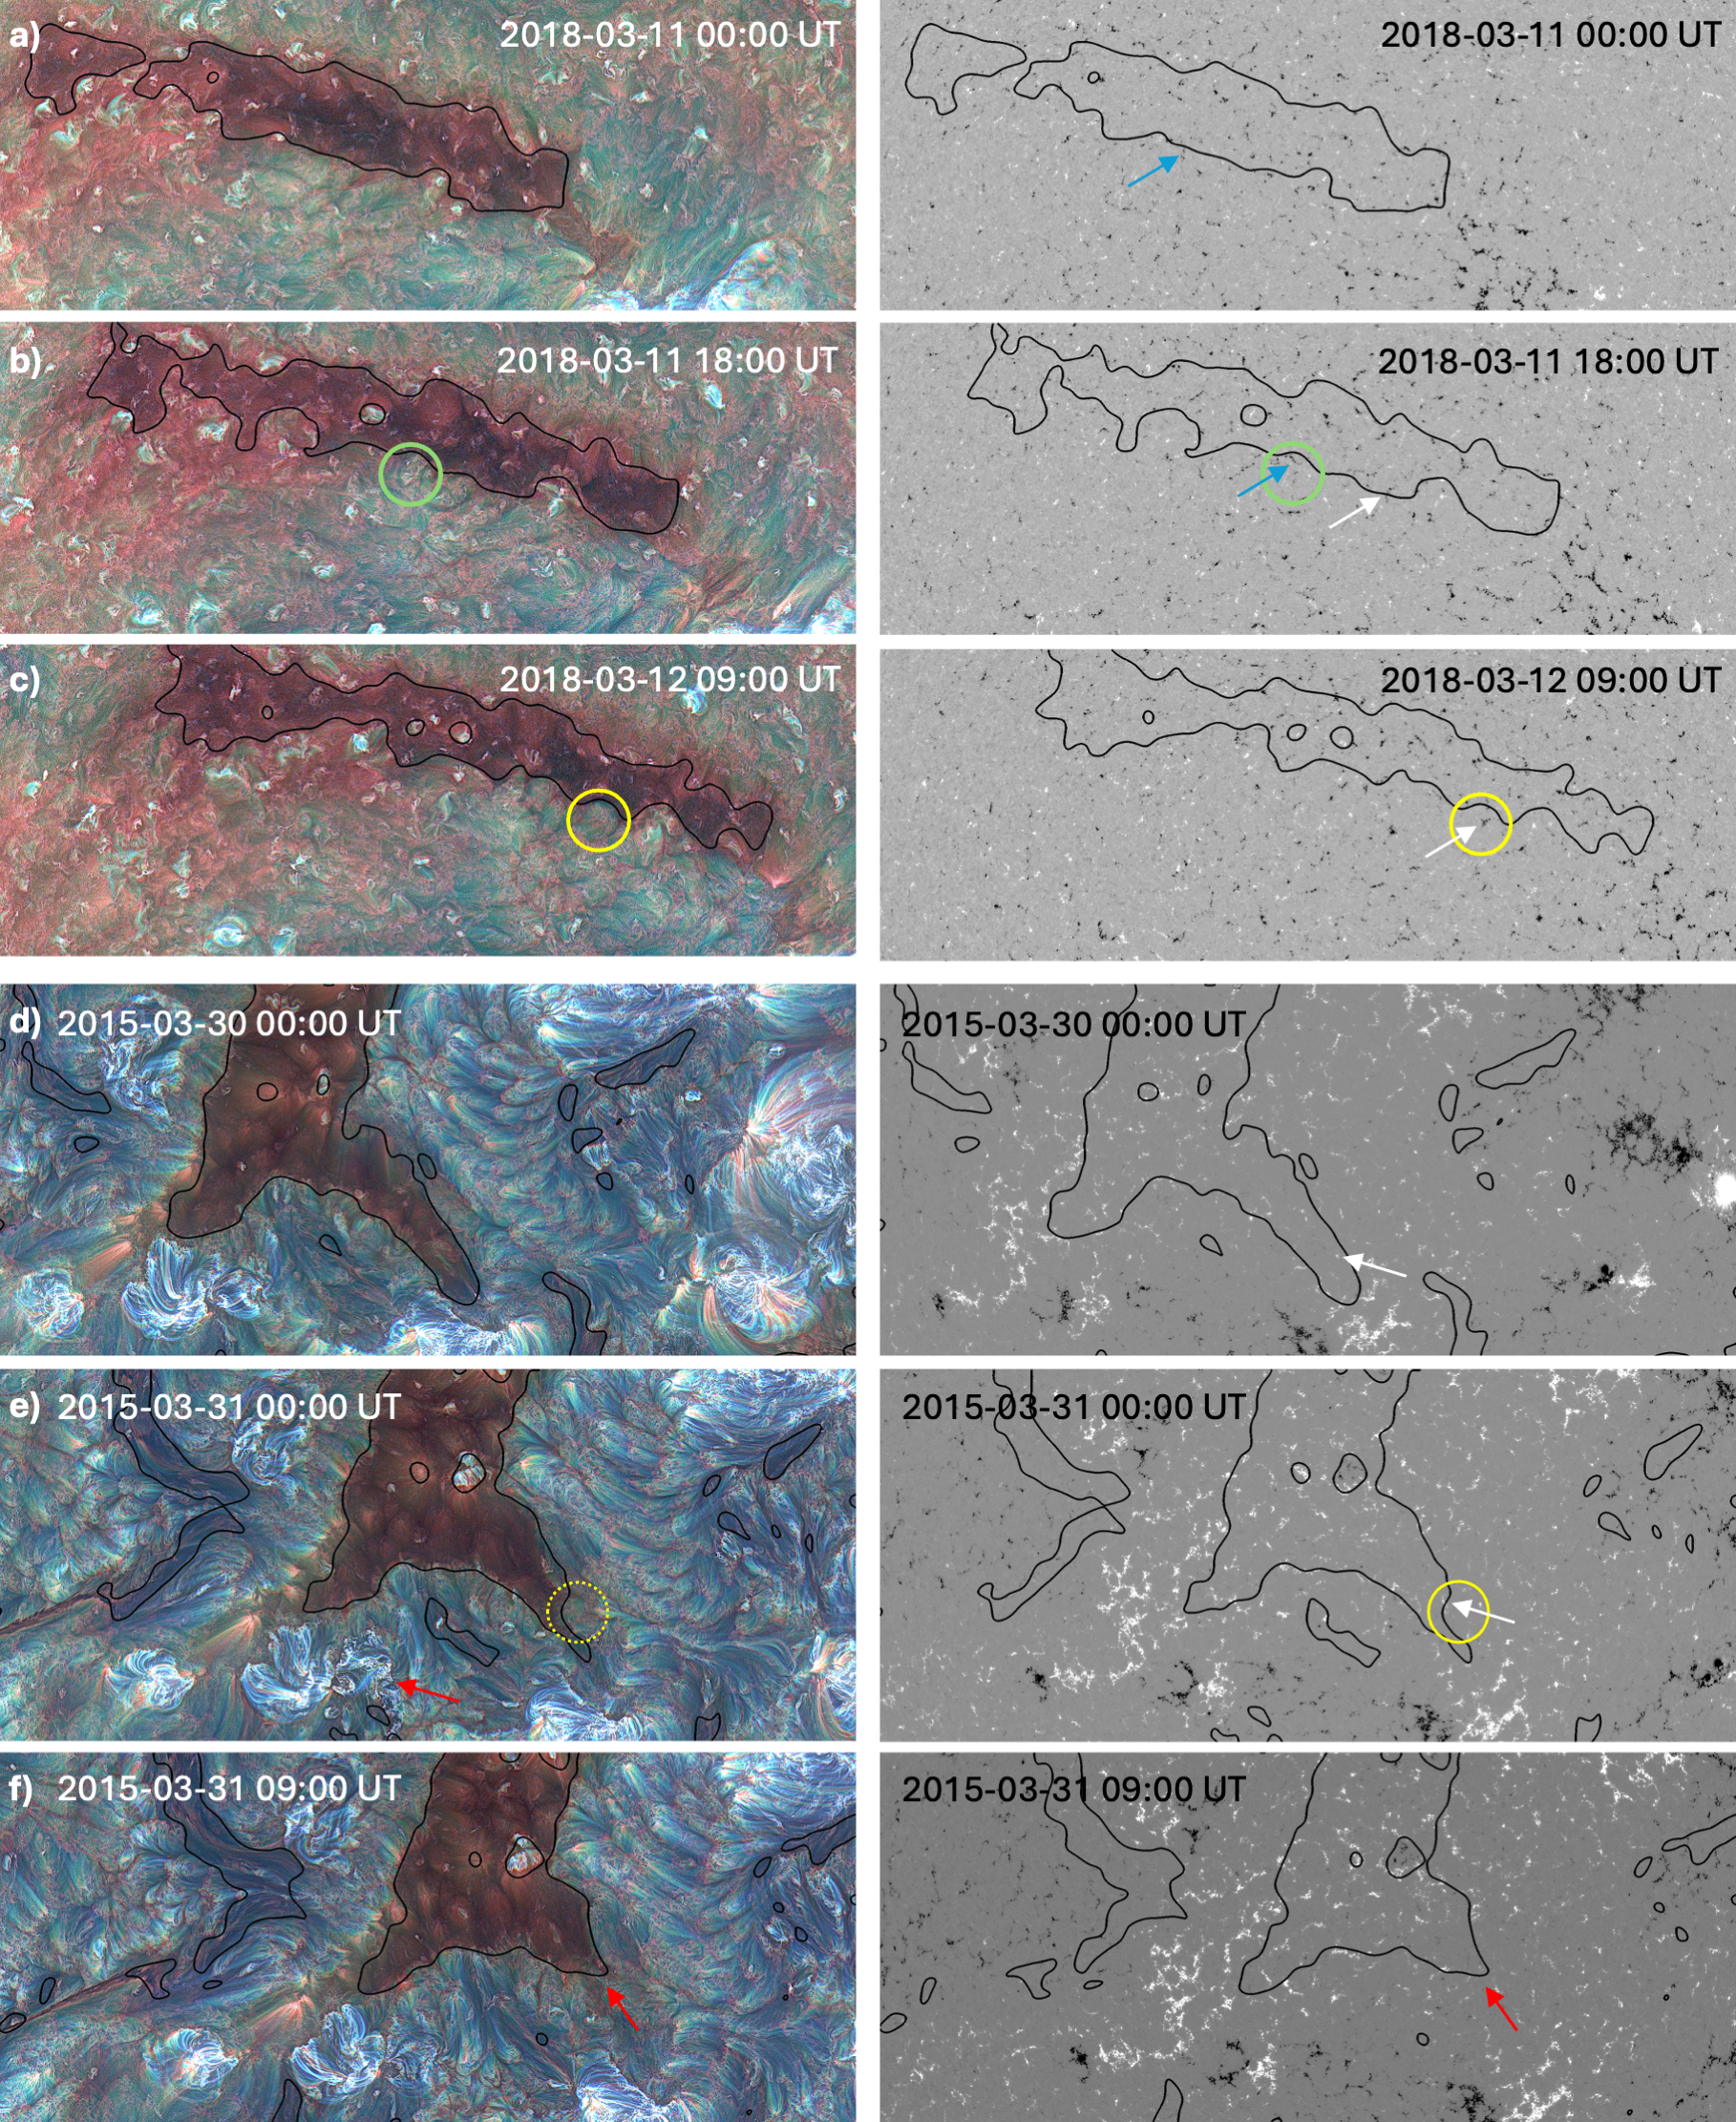
3.4 Coronal cells role in CH boundary dynamics
4 Discussion
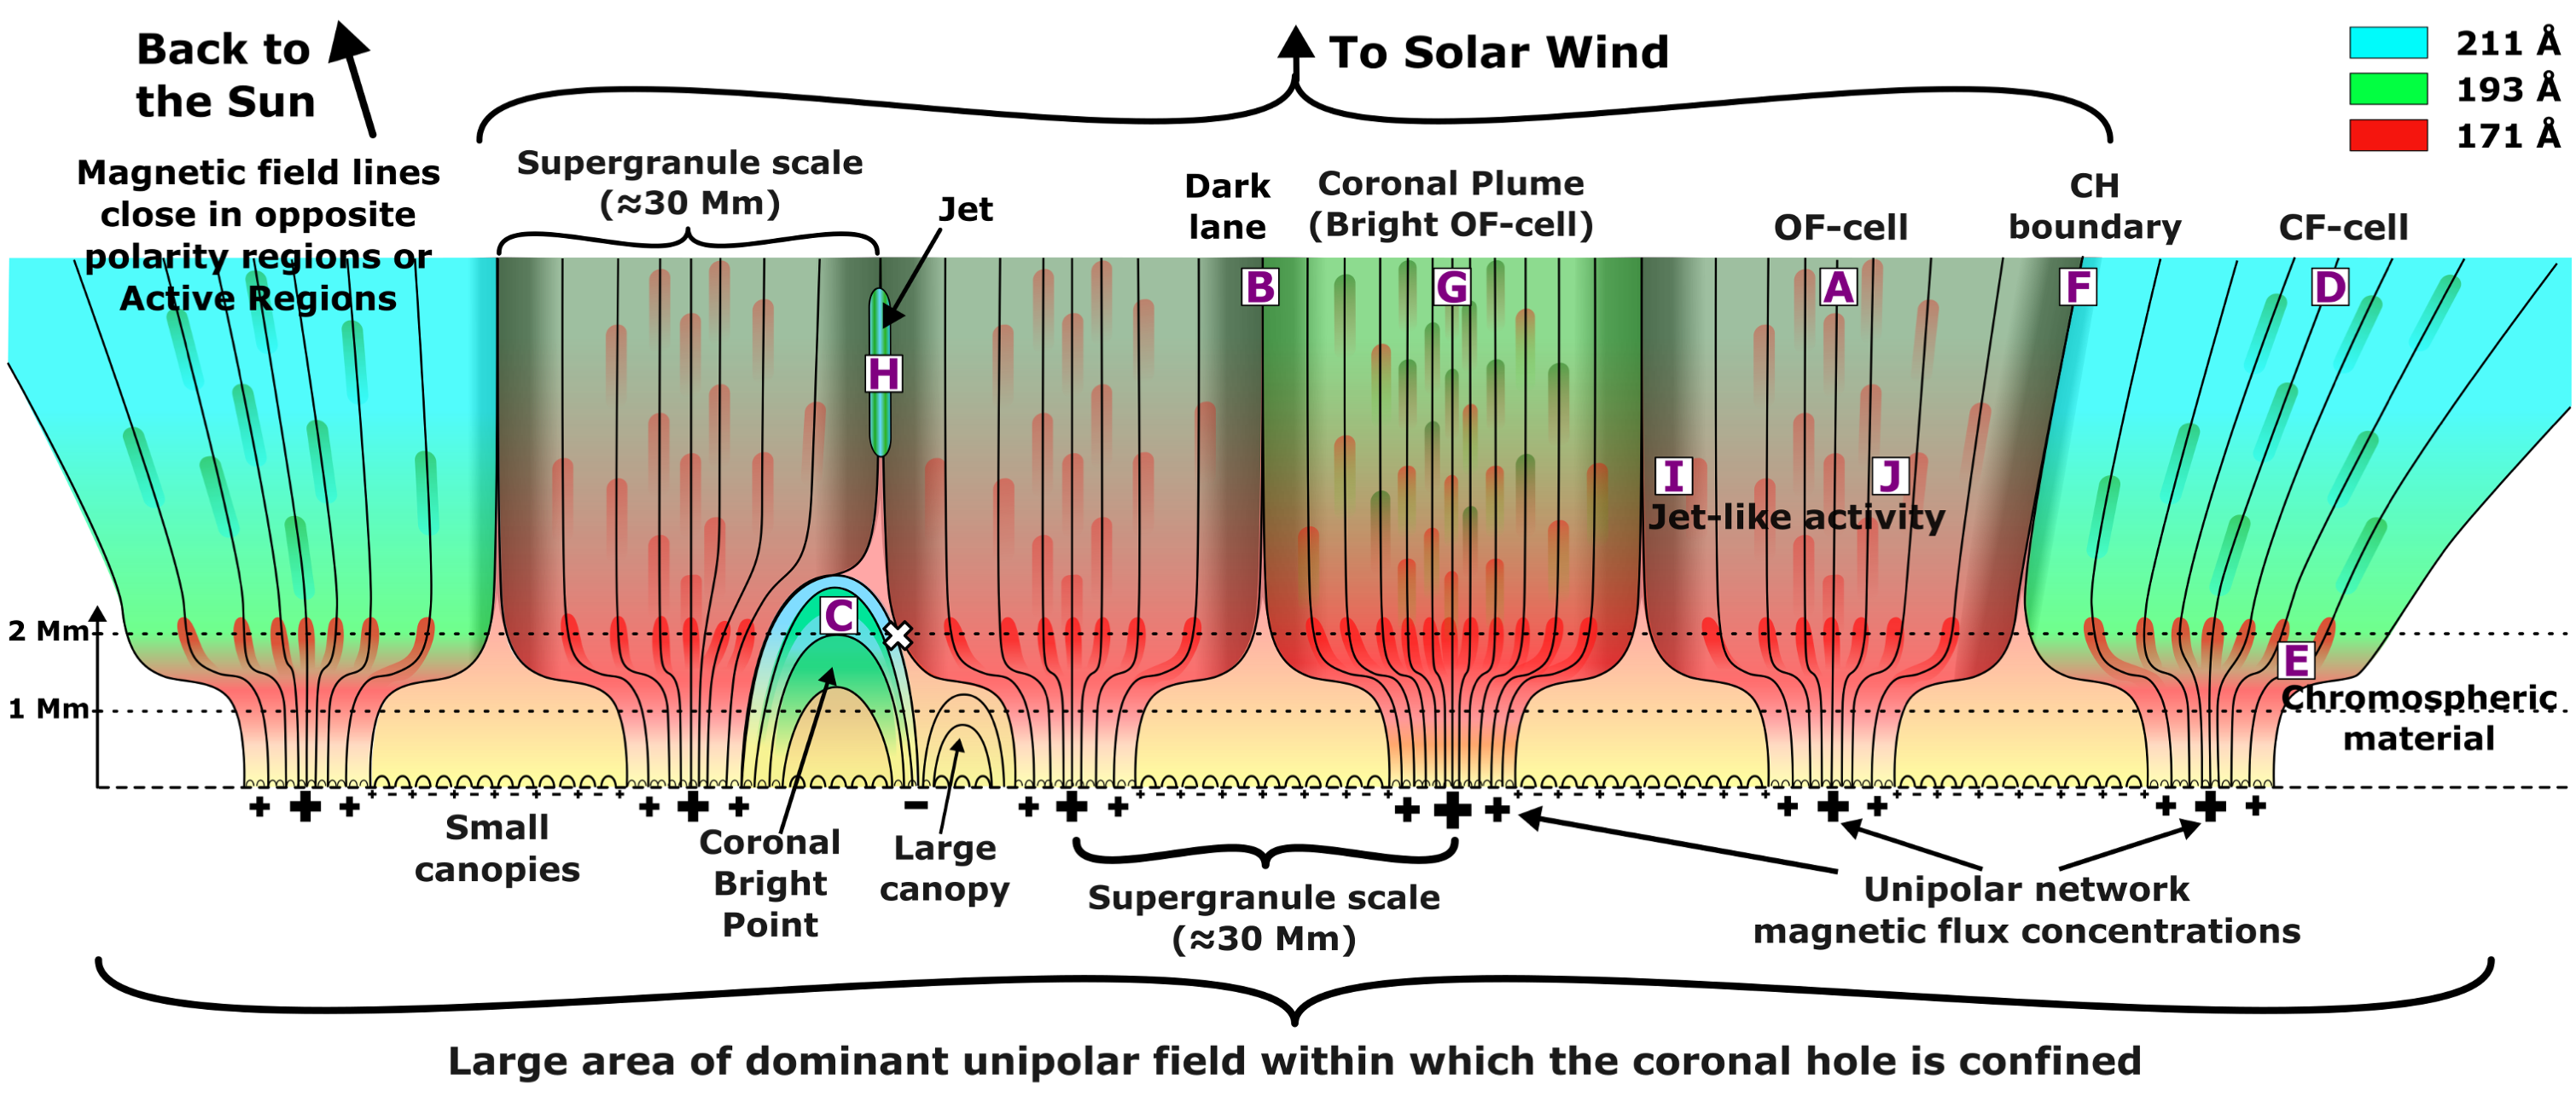
Our observations show that cells are an ubiquitous consequence of magnetic flux concentrations within a large unipolar area, both inside and outside CHs. In Figure 12 we present a schematic of the magnetic field and plasma conditions which help explain our observations, expanding on previously suggested magnetic furnace and coronal funnel models (J. F. McKenzie et al., 1998; C.-Y. Tu et al., 2005). capital letters relate features with their schematization in our interpretation. Similar to the RGB composite, we indicate with red, green, and blue a very simplified distribution of the regions from which observations in 171, 193, and 211 Å come from, respectively. The CH volume can be separated into different regions: (i) -cells [A], (ii) dark lanes delimiting -cells [B], (iii) occasional coronal bright points [C]. When the magnetic field funnel closes back to the sun in opposite polarity regions, we obtain hotter regions forming CF-cells [D]. These cells are not visible in 171 Å observations which instead show underlying isolated extensions apparently stemming from the magnetic flux concentration, which related to underlying [E]. The region between -cells and CF-cells defines the CH boundary [F]. Inside a CH, cells appear with different levels of brightness. The more concentrated the magnetic flux is, the brighter the structure appears, both at the base and up in the corona. Often, the bright structures [G] have been classified as coronal plumes (R. L. Moore et al., 2023). ubiquitous presence of -cells to polar CHs as well. Interestingly, our distinction between faint cells and bright cells is consistent with previous work which refers to similar structures as “network plumes” and “beam plumes” (A. Gabriel et al., 2009). It may be that just as cold plasma suspended in the corona is referred to as a “filament” when observed on disk and a “prominence” when observed off-limb, these -cells are in fact the on-disk signature of the same magnetic structure making up the polar network and beam plumes. In our picture, the schematic in Figure 12 is actually a view of the polar cells from Earth. However, multiple cells overlap along the field of view, result in a blurred view which is a mixture of ray-like features of different colors in our RGB composite that sometimes enable the distinction between -cells and CF-cells (see for example the poles in panel c of Figure 1 as well as panel a and b of Figure 6). While A. Gabriel et al. (2009) proposed plume-like extensions along the network lanes to form “curtains” to explain these observations, we suggest there is a presence of cells in magnetic flux concentrations along the lanes. If this is confirmed, the views of the sun pole would reveal the same cellular structures we are observing in mid-latitude CHs, but with dimensions and lifetimes reflecting the photosphere convection pattern at the sun poles. This prediction could be confirmed by pole observations by Solar Orbiter or by future missions dedicated to the observation of the sun poles (National Academies of Sciences, Engineering, and Medicine,, 2024).
the jet-like activity would be the jetlets (N. E. Raouafi & G. Stenborg, 2014; P. Kumar et al., 2022; L. P. Chitta et al., 2025), and our ray-like features would be plumelets (V. M. Uritsky et al., 2021). jets not required as a precursor to see similar activity. analysis found it difficult to reconcile how coronal plumes, estimated to occupy about 10% of a CH’s volume (I. A. Ahmad & G. L. Withbroe, 1977), could sustain the solar wind emanating from the entire CH. Our new observations show that cells, which intrinsically include coronal plumes, extend to the entire CH, are always present throughout the solar cycle, and therefore can, in principle, sustain the entire CH volume.
4.1 Possible implications of the “coronal cell” theory
5 Conclusions
In this work, we provide the first morphological overview of coronal cells as an ubiquitous and persistent consequence of magnetic flux concentrations. key points are as follows:
- •
-
•
The cells’ lifetime ranges from a few hours to a few days, emerging and together with their corresponding magnetic flux concentration in the photosphere. The cells have size scales on the order of super-granules and are always present over the course of a solar cycle.
-
•
The cells’ characteristics are related to properties of the photospheric magnetic flux in which they are rooted and the subsequent magnetic connectivity in the corona. cells extend to form the open field their brightness, in the 171 Å wavelength, related to the intensity of the magnetic flux concentration the presence of quasi-periodic . cells are among the components of the closed field and their brightness is mostly in the 193 Å wavelength.
-
•
Outward propagating jet-like features are present inside the CH and can be separated into categories depending on their source region: classic jets from bright jet-like activity stemming from
By quantifying the characteristics of coronal cells and organizing them in the context of previous observations (Sheeley coronal cells, coronal/EUV plumes, “network plumes”, etc.), we believe our schematic provides a unifying picture of many of these elements. By articulating the possible links of cells down to the chromosphere and up to the open/close coronal magnetic field, for fine scale coronal structures and heating, which subsequently has a direct effect on solar wind origin.
References
- I. A. Ahmad & G. L. Withbroe (1977) Ahmad, I. A., & Withbroe, G. L. 1977, \bibinfotitleEUV analysis of polar plumes., Sol. Phys., 53, 397, doi: 10.1007/BF00160283
- N. Alzate et al. (2025) Alzate, N., Di Matteo, S., & Higginson, A. 2025, \bibinfotitleSupporting Material for “Coronal Cells in Coronal Holes: Systematic Analysis and Implications for Coronal Evolution” by Alzate et al. (2025),, 1.0 doi: 10.5281/zenodo.15518645
- C. N. Arge et al. (2024) Arge, C. N., Leisner, A., Antiochos, S. K., Wallace, S., & Henney, C. J. 2024, \bibinfotitleProposed Resolution to the Solar Open Magnetic Flux Problem, ApJ, 964, 115, doi: 10.3847/1538-4357/ad20e2
- E. A. Avallone et al. (2018) Avallone, E. A., Tiwari, S. K., Panesar, N. K., Moore, R. L., & Winebarger, A. 2018, \bibinfotitleCritical Magnetic Field Strengths for Solar Coronal Plumes in Quiet Regions and Coronal Holes?, ApJ, 861, 111, doi: 10.3847/1538-4357/aac82c
- S. D. Bale et al. (2023) Bale, S. D., Drake, J. F., McManus, M. D., et al. 2023, \bibinfotitleInterchange reconnection as the source of the fast solar wind within coronal holes, Nature, 618, 252, doi: 10.1038/s41586-023-05955-3
- L. P. Chitta et al. (2025) Chitta, L. P., Huang, Z., D’Amicis, R., et al. 2025, \bibinfotitleCoronal hole picoflare jets are progenitors of both fast and Alfvénic slow solar wind, A&A, 694, A71, doi: 10.1051/0004-6361/202452737
- R. D’Amicis et al. (2025) D’Amicis, R., Velli, M., Panasenco, O., et al. 2025, \bibinfotitleOn Alfvénic turbulence of solar wind streams observed by Solar Orbiter during March 2022 perihelion and their source regions, A&A, 693, A243, doi: 10.1051/0004-6361/202451686
- S. Di Matteo et al. (2020) Di Matteo, S., Viall, N. M., & Kepko, L. 2020, \bibinfotitleSPD_MTM: a spectral analysis tool for the SPEDAS framework,, v1.0 doi: 10.5281/zenodo.3703168
- S. Di Matteo et al. (2021) Di Matteo, S., Viall, N. M., & Kepko, L. 2021, \bibinfotitlePower Spectral Density Background Estimate and Signal Detection via the Multitaper Method, Journal of Geophysical Research (Space Physics), 126, e28748, doi: 10.1029/2020JA02874810.1002/essoar.10502619.2
- N. Fargette et al. (2021) Fargette, N., Lavraud, B., Rouillard, A. P., et al. 2021, \bibinfotitleCharacteristic Scales of Magnetic Switchback Patches Near the Sun and Their Possible Association With Solar Supergranulation and Granulation, ApJ, 919, 96, doi: 10.3847/1538-4357/ac1112
- A. Gabriel et al. (2009) Gabriel, A., Bely-Dubau, F., Tison, E., & Wilhelm, K. 2009, \bibinfotitleThe Structure and Origin of Solar Plumes: Network Plumes, ApJ, 700, 551, doi: 10.1088/0004-637X/700/1/551
- H. Gutiérrez et al. (2013) Gutiérrez, H., Taliashvili, L., & Mouradian, Z. 2013, \bibinfotitleShort term topological changes of coronal holes associated with prominence eruptions and subsequent CMEs, Advances in Space Research, 51, 1824, doi: 10.1016/j.asr.2012.03.008
- A. K. Higginson et al. (2017) Higginson, A. K., Antiochos, S. K., DeVore, C. R., Wyper, P. F., & Zurbuchen, T. H. 2017, \bibinfotitleDynamics of Coronal Hole Boundaries, ApJ, 837, 113, doi: 10.3847/1538-4357/837/2/113
- J. Huang et al. (2025) Huang, J., Larson, D. E., Ervin, T., et al. 2025, \bibinfotitleThe Temperature Anisotropy and Helium Abundance Features of Alfvénic Slow Solar Wind Observed by Parker Solar Probe, Helios, and Wind Missions, ApJ, 986, L28, doi: 10.3847/2041-8213/ade0ac
- P. Kumar et al. (2023) Kumar, P., Karpen, J. T., Antiochos, S. K., et al. 2023, \bibinfotitlePlasmoids, Flows, and Jets during Magnetic Reconnection in a Failed Solar Eruption, ApJ, 943, 156, doi: 10.3847/1538-4357/acaea4
- P. Kumar et al. (2022) Kumar, P., Karpen, J. T., Uritsky, V. M., et al. 2022, \bibinfotitleQuasi-periodic Energy Release and Jets at the Base of Solar Coronal Plumes, ApJ, 933, 21, doi: 10.3847/1538-4357/ac6c24
- J. Lee et al. (2024) Lee, J., Wang, H., Wang, J., & Wang, M. 2024, \bibinfotitleSolar Spicules, Filigrees, and Solar Wind Switchbacks, ApJ, 963, 79, doi: 10.3847/1538-4357/ad23e0
- J. R. Lemen et al. (2012) Lemen, J. R., Title, A. M., Akin, D. J., et al. 2012, \bibinfotitleThe Atmospheric Imaging Assembly (AIA) on the Solar Dynamics Observatory (SDO), Sol. Phys., 275, 17, doi: 10.1007/s11207-011-9776-8
- M. S. Madjarska (2019) Madjarska, M. S. 2019, \bibinfotitleCoronal bright points, Living Reviews in Solar Physics, 16, 2, doi: 10.1007/s41116-019-0018-8
- J. F. McKenzie et al. (1998) McKenzie, J. F., Sukhorukova, G. V., & Axford, W. I. 1998, \bibinfotitleThe source region of the fast solar wind, A&A, 330, 1145
- R. L. Moore et al. (2023) Moore, R. L., Tiwari, S. K., Panesar, N. K., & Sterling, A. C. 2023, \bibinfotitleProspective Implications of Extreme-ultraviolet Coronal Plumes for Magnetic-network Genesis of Coronal Heating, Coronal-hole Solar Wind, and Solar-wind Magnetic Field Switchbacks, ApJ, 945, L16, doi: 10.3847/2041-8213/acbe46
- H. Morgan & M. Druckmüller (2014) Morgan, H., & Druckmüller, M. 2014, \bibinfotitleMulti-Scale Gaussian Normalization for Solar Image Processing, Sol. Phys., 289, 2945, doi: 10.1007/s11207-014-0523-9
- H. Morgan & M. B. Korsós (2022) Morgan, H., & Korsós, M. B. 2022, \bibinfotitleAn Improved Method for Estimating the Velocity Field of Coronal Propagating Disturbances, Sol. Phys., 297, 102, doi: 10.1007/s11207-022-02033-1
- National Academies of Sciences, Engineering, and Medicine, (2024) National Academies of Sciences, Engineering, and Medicine,. 2024, The Next Decade of Discovery in Solar and Space Physics: Exploring and Safeguarding Humanity’s Home in Space, doi: 10.17226/27938
- V. N. Nived et al. (2022) Nived, V. N., Scullion, E., Doyle, J. G., et al. 2022, \bibinfotitleImplications of spicule activity on coronal loop heating and catastrophic cooling, MNRAS, 509, 5523, doi: 10.1093/mnras/stab3277
- G. Poletto (2015) Poletto, G. 2015, \bibinfotitleSolar Coronal Plumes, Living Reviews in Solar Physics, 12, 7, doi: 10.1007/lrsp-2015-7
- N. E. Raouafi (2009) Raouafi, N. E. 2009, in Astronomical Society of the Pacific Conference Series, Vol. 415, The Second Hinode Science Meeting: Beyond Discovery-Toward Understanding, ed. B. Lites, M. Cheung, T. Magara, J. Mariska, & K. Reeves, 144, doi: 10.48550/arXiv.0902.0591
- N. E. Raouafi et al. (2008) Raouafi, N. E., Petrie, G. J. D., Norton, A. A., Henney, C. J., & Solanki, S. K. 2008, \bibinfotitleEvidence for Polar Jets as Precursors of Polar Plume Formation, ApJ, 682, L137, doi: 10.1086/591125
- N. E. Raouafi & G. Stenborg (2014) Raouafi, N. E., & Stenborg, G. 2014, \bibinfotitleRole of Transients in the Sustainability of Solar Coronal Plumes, ApJ, 787, 118, doi: 10.1088/0004-637X/787/2/118
- N. E. Raouafi et al. (2023) Raouafi, N. E., Stenborg, G., Seaton, D. B., et al. 2023, \bibinfotitleMagnetic Reconnection as the Driver of the Solar Wind, ApJ, 945, 28, doi: 10.3847/1538-4357/acaf6c
- T. Samanta et al. (2019) Samanta, T., Tian, H., Yurchyshyn, V., et al. 2019, \bibinfotitleGeneration of solar spicules and subsequent atmospheric heating, Science, 366, 890, doi: 10.1126/science.aaw2796
- P. H. Scherrer et al. (2012) Scherrer, P. H., Schou, J., Bush, R. I., et al. 2012, \bibinfotitleThe Helioseismic and Magnetic Imager (HMI) Investigation for the Solar Dynamics Observatory (SDO), Sol. Phys., 275, 207, doi: 10.1007/s11207-011-9834-2
- N. R. Sheeley et al. (2013) Sheeley, Jr., N. R., Martin, S. F., Panasenco, O., & Warren, H. P. 2013, \bibinfotitleUsing Coronal Cells to Infer the Magnetic Field Structure and Chirality of Filament Channels, ApJ, 772, 88, doi: 10.1088/0004-637X/772/2/88
- N. R. Sheeley & H. P. Warren (2012) Sheeley, Jr., N. R., & Warren, H. P. 2012, \bibinfotitleCoronal Cells, ApJ, 749, 40, doi: 10.1088/0004-637X/749/1/40
- N. R. Sheeley et al. (2014) Sheeley, Jr., N. R., Warren, H. P., Lee, J., et al. 2014, \bibinfotitleUsing Running Difference Images to Track Proper Motions of XUV Coronal Intensity on the Sun, ApJ, 797, 25, doi: 10.1088/0004-637X/797/2/131
- N. R. Sheeley Jr. et al. (1989) Sheeley Jr., N. R., Wang, Y.-M., & Harvey, J. W. 1989, \bibinfotitleThe Effect of Newly Erupting Flux on the Polar Coronal Holes, Sol. Phys., 119, 323, doi: 10.1007/BF00146182
- S. Subramanian et al. (2010) Subramanian, S., Madjarska, M. S., & Doyle, J. G. 2010, \bibinfotitleCoronal hole boundaries evolution at small scales. II. XRT view. Can small-scale outflows at CHBs be a source of the slow solar wind, A&A, 516, A50, doi: 10.1051/0004-6361/200913624
- D. J. Thomson (1982) Thomson, D. J. 1982, \bibinfotitleSpectrum Estimation and Harmonic Analysis, IEEE Proceedings, 70, 1055
- C.-Y. Tu et al. (2005) Tu, C.-Y., Zhou, C., Marsch, E., et al. 2005, \bibinfotitleSolar Wind Origin in Coronal Funnels, Science, 308, 519, doi: 10.1126/science.1109447
- V. M. Uritsky et al. (2021) Uritsky, V. M., DeForest, C. E., Karpen, J. T., et al. 2021, \bibinfotitlePlumelets: Dynamic Filamentary Structures in Solar Coronal Plumes, ApJ, 907, 1, doi: 10.3847/1538-4357/abd186
- V. M. Uritsky et al. (2023) Uritsky, V. M., Karpen, J. T., Raouafi, N. E., et al. 2023, \bibinfotitleSelf-similar Outflows at the Source of the Fast Solar Wind: A Smoking Gun of Multiscale Impulsive Reconnection?, ApJ, 955, L38, doi: 10.3847/2041-8213/acf85c
- Y.-M. Wang et al. (1996) Wang, Y.-M., Hawley, S. H., & Sheeley Jr., N.-R. 1996, \bibinfotitleThe Magnetic Nature of Coronal Holes, Science, 271, 464, doi: 10.1126/science.271.5248.464
- Y. M. Wang et al. (2016) Wang, Y. M., Warren, H. P., & Muglach, K. 2016, \bibinfotitleConverging Supergranular Flows and the Formation of Coronal Plumes, ApJ, 818, 203, doi: 10.3847/0004-637X/818/2/203
- S. Wedemeyer-Böhm et al. (2009) Wedemeyer-Böhm, S., Lagg, A., & Nordlund, Å. 2009, \bibinfotitleCoupling from the Photosphere to the Chromosphere and the Corona, Space Sci. Rev., 144, 317, doi: 10.1007/s11214-008-9447-8
- G. L. Withbroe (1988) Withbroe, G. L. 1988, \bibinfotitleThe Temperature Structure, Mass, and Energy Flow in the Corona and Inner Solar Wind, ApJ, 325, 442, doi: 10.1086/166015