Towards a Non-Binary View of IPv6 Adoption
Abstract.
Twelve years have passed since World IPv6 Launch Day, but what is the current state of IPv6 deployment? Prior work has examined IPv6 status as a binary: can you use IPv6, or not? As deployment increases we must consider a more nuanced, non-binary perspective on IPv6: how much and often can a user or a service use IPv6? We consider this question as a client, server, and cloud provider. Considering the client’s perspective, we observe user traffic. We see that the fraction of IPv6 traffic a user sends varies greatly, both across users and day-by-day, with a standard deviation of over 15%. We show this variation occurs for two main reasons. First, IPv6 traffic is primarily human-generated, thus showing diurnal patterns. Second, some services are IPv6-forward and others IPv6-laggards, so as users do different things their fraction of IPv6 varies. We look at server-side IPv6 adoption in two ways. First, we expand analysis of web services to examine how many are only partially IPv6 enabled due to their reliance on IPv4-only resources. Our findings reveal that only 12.5% of top 100k websites qualify as fully IPv6-ready. Finally, we examine cloud support for IPv6. Although all clouds and CDNs support IPv6, we find that tenant deployment rates vary significantly across providers. We find that ease of enabling IPv6 in the cloud is correlated with tenant IPv6 adoption rates, and recommend best practices for cloud providers to improve IPv6 adoption. Our results suggest IPv6 deployment is growing, but many services lag, presenting a potential for improvement.
1. Introduction
More than a decade has passed since World IPv6 Launch Day in 2012 (ISOC12a, 53). IPv6 is prominent in many mobile operators, and recently Vietnam announced all of their networks will support IPv6 (dobberstein_vietnam_2024, 19). IPv6 is clearly past the “early adopter” phase of the technology lifecycle (Beal57a, 11), but it also is not ubiquitous. How do we judge where IPv6 is today?
Prior studies have evaluated IPv6 maturity in several ways. Early evaluation asked the binary question: can one access IPv6? For example, first evaluations as IPv6 moved from design to deployment asked which countries supported IPv6 (white_internet_2005, 56). More recent work looks inside countries to explore what ISPs or Autonomous Systems offer IPv6 (InternetSocietyPulse, 26). Alternatively, one can summarize this evaluation as the fraction of users in a country with access, based on ISP market share. For example, Internet Society reports that 73% of users from India have IPv6 access (InternetSocietyPulse, 26). These questions are necessary—an individual cannot access IPv6 if their country or ISP does not support it. But they are not sufficient. Your country or ISP being “IPv6 ready” is quite different from actual IPv6 prefix delegation to specific users in all regions, and that is different from use of IPv6 by those users.
Contributions: The first contribution of this paper is to re-frame IPv6 deployment in non-binary terms. Rather than simply asking, “is IPv6 possible?”, we measure how much traffic is actually IPv6? Following Metcalfe’s Law (metcalfe_metcalfes_2013, 37), value in networking is not a function of me, but a function of us—me and those with whom I interact. Our non-binary view of IPv6 adoption leads us to the more nuanced question of how often do users and services interact using IPv6, beyond the prior: is it possible for a user or service to use IPv6 at all. This re-framing is of growing importance as IPv6 support grows, since the binary “is it possible” view no longer gives new insight since the answer is almost always “yes”. A practical benefit of understanding IPv6 transition today is to help evaluate the importance today’s markets built around IPv4 scarcity, such IPv4 marketplaces (livadariu_first_2013, 36, 43) and Amazon’s 2023 shift to charging for IPv4 addresses (barr_new_2023, 10, 31).
To develop this non-binary view, our second contribution is to design measurements to consider “how much IPv6” from three different perspectives. For users, how much of their traffic is actually IPv6? Which services that they regularly use are IPv4 laggards, holding back IPv6 from 100%? For services, how complete is a website’s support of IPv6? How many of its embedded resources are available over IPv6, and which widely used resources remain IPv4-only? For cloud providers, what fraction of tenants support IPv6? While all clouds offer IPv6 support, do they differ in how easily it can be enabled?
Our final contribution is the results of these measurements. We conduct a user study, finding large variation in IPv6 traffic by residence and by day, driven by human activity and showing a clear diurnal pattern. Our investigation of the top 100k websites shows that, of the 34,932 sites that are reachable via IPv6, nearly three-fourths of these sites depend on resources only accessible by IPv4, leaving only 10,308 (12.5%) websites fully functional over IPv6. Our analysis of cloud platforms finds substantial differences in tenant IPv6 adoption, closely tied to how easily IPv6 can be enabled on each provider. We conclude with recommendations for cloud providers to increase IPv6 adoption by improving defaults and minimizing configuration burden.
Ethical Considerations and Data Availability: Our user studies in this paper were IRB-reviewed (USC IRB #UP-24-00738) and done with user consent; we expand on ethical considerations in § A. Our client data is not available because of anonymization requirements, but we expect to release our server-side measurements with paper publication.
2. Related Work
Efforts to measure the progress of IPv6 adoption have been ongoing for more than a decade. IPv6 adoption has been examined along multiple dimensions, including end-user readiness, service availability, and organizational deployment.
IPv6 Use by Users: One major thread of research measures the extent to which end users have IPv6 connectivity. Early work by Karpilovsky et al. (karpilovsky_quantifying_2009, 30) found that IPv6 traffic was primarily limited to control traffic (DNS and ICMP), but later studies reported increasing volumes of user-generated traffic (sarrar_investigating_2012, 47, 35). Google’s IPv6 adoption tracker (Google22a, 23) shows that the share of IPv6-capable users grew from under 1% in 2012 (World IPv6 Launch) to nearly 50% by 2025. However, Pujol et al. (pujol_understanding_2017, 44) observed that despite the high connectivity reported by Google, actual usage remained low in a dual-stack ISP, often due to IPv6-incompatible customer premises equipment (CPE). Consistent with this finding, AMS-IX statistics show that IPv6 still accounts for only about 8% of total traffic in 2025 (AMS_IX, 2). Colitti et al. (colitti_evaluating_2010, 13) and later Zander et al. (zander_mitigating_2012, 60) measured end-user IPv6 capability by embedding JavaScript fragments in web pages, with the latter study reporting greater IPv6 availability at workplaces than at residences. However, a later study found the opposite (li_towards_2020, 35).
Our contribution: We introduce a non-binary perspective on IPv6 use by end-users in § 3 to explain the differences between IPv6 capability, as shown by Google’s “can do IPv6” reports, and actual usage, as shown in AMS-IX traffic fractions. We look at real user traffic from multiple residences, focusing on which specific applications drive IPv6 and which generate traffic that remains IPv4-only.
IPv6 Use by Services: Another line of work examines how widely online services have deployed IPv6. Nikkhah et al. (nikkhah_assessing_2011, 39) evaluated IPv6 accessibility and performance for Alexa’s Top 1M websites, attributing IPv6’s inferior performance to control-plane differences. Dhamdhere et al. (dhamdhere_measuring_2012, 18) confirmed that data-plane performance was comparable when AS paths matched. Czyz et al. (czyz_measuring_2014, 15) found that only 3.2% of Alexa Top 10k sites were reachable via IPv6 in 2014. However, these studies focused either on the main page (nikkhah_assessing_2011, 39, 15) or limited themselves to first-party resources (dhamdhere_measuring_2012, 18), without evaluating whether the websites were fully IPv6-enabled. Closest to our work, Bajpai and Schönwälder (bajpai_longitudinal_2019, 7) examined the Alexa Top 100 websites and resources embedded directly in the main page (including third-party), finding that 27% of IPv6-enabled websites included one or more IPv4-only resources.
Our contribution: We extend Bajpai and Schönwälder’s methodology two ways. We use full, browser-based page loads that resolve dependencies to arbitrary depth, rather than limiting analysis to directly embedded resources (§ 4). We also simulate user interaction by clicking on links to destinations within the same domain, capturing a broader and more realistic set of third-party dependencies. Our dataset covers 100k websites, more than Bajpai et al., and we provide compare results over two different years. We also perform a more detailed analysis of the types of resources that remain IPv4-only.
IPv6 Use by Organizations: A third dimension of IPv6 adoption research focuses on deployment by network infrastructure and organizations. Karpilovsky et al. (karpilovsky_quantifying_2009, 30) showed that although IPv6 prefix allocation was growing exponentially, nearly half of the allocated prefixes were never announced. Dhamdhere et al. (dhamdhere_measuring_2012, 18) found that while most core Internet transit providers had adopted IPv6, edge networks lagged behind—a finding reaffirmed five years later by Jia et al. (jia_tracking_2019, 29). In a complementary study, Zander and Wang (zander_are_2018, 59) surveyed Australian and Chinese organizations, revealing that two-thirds of participating media and telecommunications companies did not offer IPv6 services to customers. Streibelt et al. (streibelt_how_2023, 51) examined whether DNS infrastructure functions in IPv6-only environments and found that 10% of DNS providers account for over 97.5% of all zones that fail to resolve over IPv6.
Our contribution: Given the dominant role of CDNs and cloud platforms in today’s Internet—accounting for over half of all web traffic (sumits_internet_2017, 52) and used by 90% of companies (krivec_cloud_2024, 32)—we analyze, in § 5, how major cloud providers and their tenants are faring in terms of IPv6 adoption. We also explore how cloud platforms can better support IPv6 deployment. To our knowledge, we are the first to examine IPv6 adoption in cloud context.
Our most important difference is to pose the new perspective of looking at non-binary IPv6 use, rather than basic availability or if a given query can be done completely over IPv6. Clearly IPv4 will be with us for many, many years to come, so our view is that today’s focus should be on identifying laggard, IPv4-only services, so we can understand how they can add IPv6 support, or when they will sunset.
3. Client-side Adoption of IPv6
Our first goal is to understand how much actual IPv6 a dual-stack client sends and receives, and what factors affect that fraction.
Towards this goal, we observe all Internet traffic from routers at five residential locations in the Los Angeles area, Residence A through Residence E. ISPs of all residences provide native IPv6 connectivity, except for Residence B, where we provide IPv6 via a tunnel to our university. Each residence has multiple wired and wireless client devices. At Residences A and B, we manually verify that major devices (PCs, phones, tablets, TVs, consoles) are dual-stack, but do not perform this check at other locations.
We monitor all inbound and outbound traffic for six months, November 2024 through April 2025. We observe about 13 TB of traffic over this period; Table 1 shows traffic volumes by residence.
| Residence | Traffic Volume (GB) | Fraction IPv6 | |||||
| and Scope | Total | IPv4 | IPv6 | Overall | Daily mean (s.d.) | ||
| A | External | 4890.92 | 1496.11 | 3394.81 | 0.694 | 0.724 | (0.157) |
| Internal | 6.59 | 5.45 | 1.13 | 0.172 | 0.221 | (0.140) | |
| B | External | 2900.04 | 1402.71 | 1497.33 | 0.516 | 0.520 | (0.194) |
| Internal | 3.46 | 1.38 | 2.08 | 0.602 | 0.572 | (0.231) | |
| C | External | 5696.13 | 4772.74 | 923.39 | 0.162 | 0.139 | (0.232) |
| Internal | 2.09 | 1.62 | 0.47 | 0.226 | 0.028 | (0.088) | |
| D | External | 87.35 | 41.16 | 46.19 | 0.529 | 0.736 | (0.320) |
| Internal | 1.44 | 0.11 | 1.33 | 0.923 | 0.841 | (0.273) | |
| E | External | 15.99 | 2.53 | 13.46 | 0.842 | 0.784 | (0.187) |
| Internal | (0.01) | (0.01) | – | – | – | – | |
3.1. Design of Residence Measurement
Each residence collects data at its primary router to a single upstream ISP. We deploy commodity routers (Linksys E8450) supporting Wi-Fi 6 and wired connections inside the residence. When possible, we replace the ISP’s router, but in some cases we place our router downstream (closer to the user) of the ISP’s router, with devices connecting to our router only. At Residence D and Residence E, privacy choices prompt some individuals to prefer to use the ISP router, so we see only part of the household traffic.
On the routers, we deploy OpenWRT extended with a custom built, lightweight flow monitor. Our monitor records flow beginnings and ends using connection tracking events (conntrack, NEW and DESTROY events) from the Linux kernel. Connection accounting also provides information about the flow size in each direction (using nf_conntrack_acct) with each DESTROY event. We identify each flow by its 5-tuple of protocol (TCP, UDP, or ICMP) and source and destination IP addresses and ports. For ICMP flows, we record ICMP type, code, and ID. We log this information at each router and send data to our server each day.
3.2. What Fraction of Everyday Traffic is IPv6?
We begin by examining the question: given dual-stack Internet access, what fraction of a user’s actual traffic is IPv6?
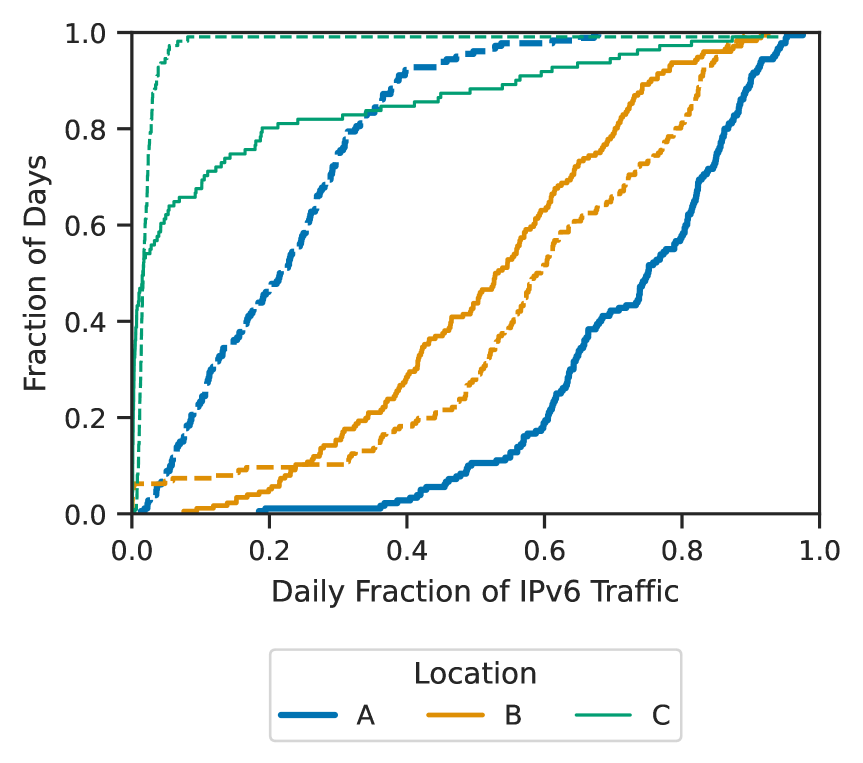
Table 1 shows our observations from our five residences over the six-month observation period. Figure 2 shows the daily fraction of IPv6 traffic for residences A, B, and C.
Overall, external and internal: We first compare overall traffic, both external (LAN-to-WAN) and internal (LAN-to-LAN) traffic separately. While we expect most residential traffic to be external, devices in the home may communicate when users play games or use network-attached storage, scanners, or printers.
For external traffic, we expect most dual-stack hosts to prefer IPv6 over IPv4, since all major web browsers and some other applications run the Happy Eyeballs algorithm (schinazi_happy_2017, 49), which attempts IPv6 connections first and falls back to IPv4 only after a brief delay (if IPv6 fails). We therefore expect any observed IPv4 traffic to be for services that are IPv4-only.
Overall, we see that the majority of traffic today is IPv6 for most residences (4 of our 5). The world is shifting to IPv6! However, this fraction varies considerably by residence as we explore below.
Second, we see that IPv6 traffic is less used inside the home (2 of 5 residences). In general, internal traffic is usually less than 1% of external, so the presence of some internal IPv6 may be more infrequent.
Traffic varies by site: We see that the fraction of external IPv6 varies widely across residences, from 0.16 to 0.85.
Since Happy Eyeballs prefers IPv6, the high level of IPv4 suggests that many services remain IPv4 only. Internal traffic shows similarly wide variation (0.17 to 0.93), but internal and external IPv6 usage are not well correlated—for instance, Residence D has higher internal IPv6 share compared to external, whereas Residence A shows the reverse.
In addition, we see that the daily mean fraction of traffic differs from the overall mean, suggesting the quantity of traffic varies by day. This daily variation is also seen by the high standard deviations of daily fractions (the last column).
Traffic varies by day: To understand the high standard deviations for day-by-day fractions of IPv6, Figure 1 shows the distribution of fractions at three residences by external (solid) and internal (dashed).
This result confirms the wide variation in IPv6 traffic over many different days, and highlights that even in an IPv6 dominant residence, like Residence A and Residence B, there are some IPv4-heavy days.
Fraction of IPv6 traffic at most residences varies linearly over most of the region, with a few heavy-hitter days at the IPv4 or IPv6 end. We investigated such days, finding that they are often associated with large downloads from specific services. For example, at both Residence A and Residence B, we see large amounts of IPv6 on days where IPv6 exceeds 90%. This traffic is mostly to Valve Corporation (AS 32590), suggesting it corresponds to large downloads (over 20 GB each) of video games for Valve’s Steam video gaming platform. The opposite effect occurs at Residence C, where the heavy IPv4 days correspond to large downloads (over 50 GB) from from Apple (AS 6185).
For Residence C, over half the days have no or very little IPv6. In discussing this case with the owner, we confirmed that IPv6 is supported. This deficit suggests that heavy Internet users at this house have IPv6 disabled.
Overall, this large variation by household and day suggests that IPv6 use depends heavily on specific services. High-traffic activities, such as large downloads, skew the traffic mix towards or against IPv6 depending on that service’s protocol support. This observation prompts us to study IPv6 adoption by services in § 3.4.
3.3. Is IPv6 Traffic Periodic?
Most Internet behavior has daily and weekly trends, including address use (Quan14c, 45), traffic volume in general (Papagiannaki05a, 42), and IPv6 traffic volume specifically (Strowes16a, 50). Often individuals spend weekdays at work and are at home on weekends, and user activity follows, with more leisure activities like gaming or media consumption on nights and weekends. We next investigate diurnal and weekly trends in our client-side traffic.
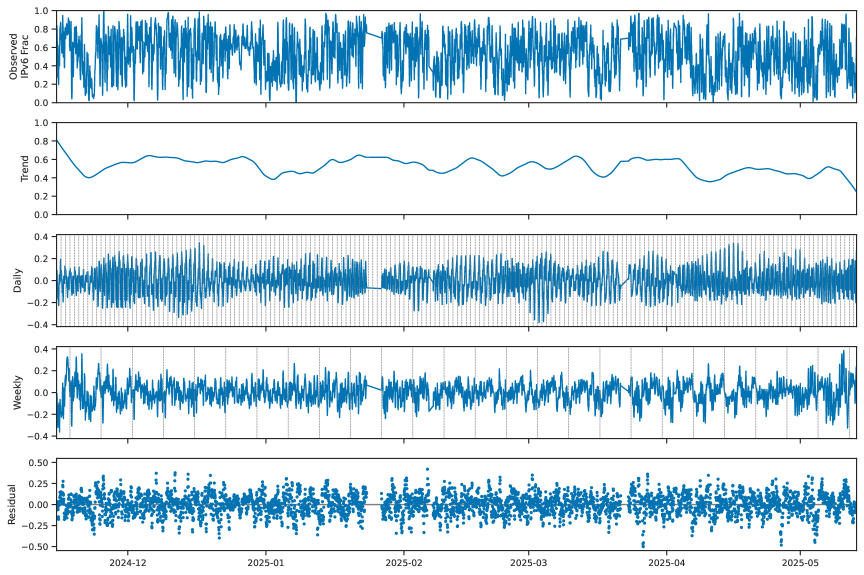
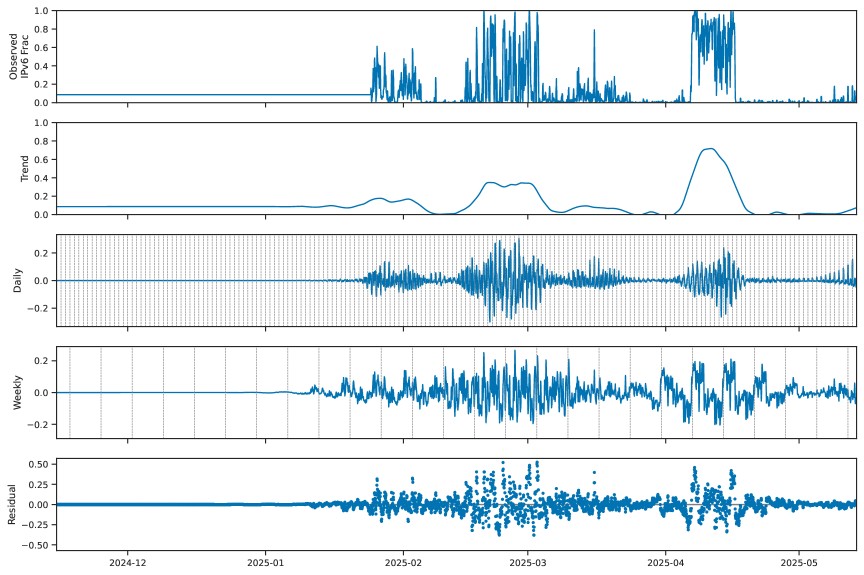
Following Baltra et al.(baltra_ebb_2024, 8), we apply Multi-Seasonal Trend Decomposition using LOESS (MSTL) (bandara_mstl_2021, 9) to the IPv6 traffic fraction. MSTL separates out the overall trend (the long-term running average) from daily and weekly trends, leaving a residual of variation.
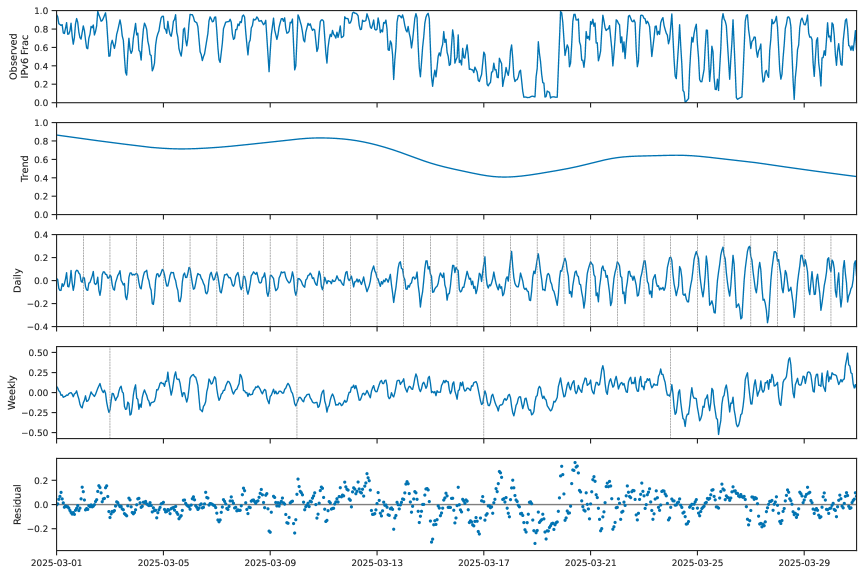
Figure 2 shows the MSTL decomposition of IPv6 fraction for external traffic at Residence A over March 2025. Here we show a single month so daily and weekly trends are apparent, but we see similar patterns in other months. We see similar behavior at Residence B and Residence C; results are in § B for space.
The top graph shows the daily IPv6 fraction. While IPv6 usage is generally high, there is a noticeable drop between March 16 and 19. This period coincides with the university’s spring break, when residence A was unoccupied. This reduction in traffic suggests that IPv6 traffic is primarily human-generated, whereas background traffic tends to be IPv4.
The second graph from the top shows long-term trends. Again, overall fractions range from 0.4 to 0.8, with no long-term direction, although a reduction and recovery of IPv6 mid-March. We believe this trend varies because the usage patterns of individuals vary over time.
The third graph shows the daily component, with midnight shown as vertical lines. We see strong, recurring IPv6 traffic peaks in evenings rising until midnight, with a secondary peak mid-morning. These observations support our observation that IPv6 traffic is largely human-driven, reflecting that residents are typically away during the day and return home in the evening.
The fourth panel shows the weekly component, with vertical lines on the midnight between Sunday and Monday. We do not see a strong weekly pattern, suggesting that residents are away from home both on weekdays and weekends.
These results provide a client-side view that complements prior work showing strong diurnal trends in server-side IPv6 traffic (Strowes16a, 50). While we also observe a diurnal pattern, the weekly pattern is weak. We conjecture that server-side measurements show greater variation because many users have IPv6 at home but not at work, leading to time-dependent usage. In contrast, our client-side data—collected from consistently dual-stack environments—suggests that when IPv6 is always available, usage depends on whether or not the user is at home and active, rather than the time of day or day of the week.
3.4. Which Services are Leaders and Laggards?
In § 3.2 we saw that the fraction of IPv6 varies considerably by residence, and even by day within each residence. We suggested that this variation is due to shifts in what specific services a user accesses each day. To understand the role services play, we next look at which services lead and lag in IPv6 adoption? Major services that lag in IPv6 support represent opportunities to improve deployment.
Here we identify services at the AS level, based on the external IP address. Our dataset identifies the destination IP address of each flow, but We do not collect service identities or URLs as part of our privacy policy, and they are unavailable due to encryption in TLS 1.3. To bridge this gap, map the external IP address to its AS from BGP routing tables, and to its domain using reverse DNS.
AS-Level Services: We identify service ASes from its external IP address. To focus on the most significant contributors, we consider only ASes whose traffic (in bytes) includes at least 0.01% of aggregate volume at that residence. We end up with 250 ASes or fewer per residence, and still over 97.4% of all observed traffic.
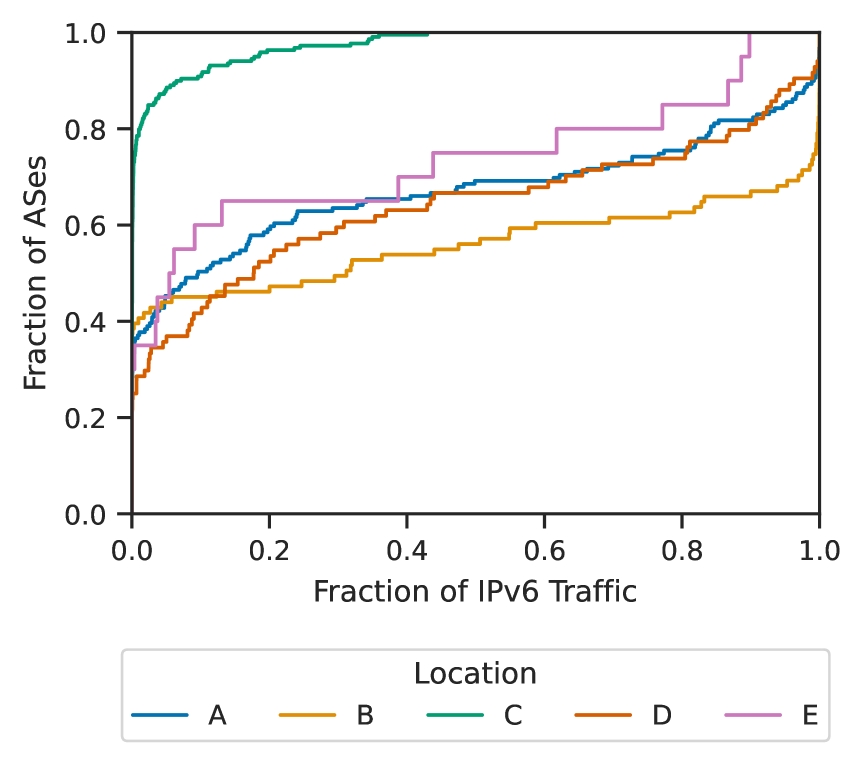
We show the cumulative fraction of IPv6 traffic by AS in Figure 3. We see that both IPv4-only and all-IPv6 ASes exist. IPv4-only ASes exist at all locations—at least one quarter of ASes at every location provide no IPv6 traffic. Thus, some ASes prefer not to do IPv6, even when the client is dual-stack. Conversely, not all locations have all-IPv6 ASes. In particular, the highest IPv6 fraction seen among ASes at Residence C is 40%. We believe this is because some devices at Residence C did not have IPv6 enabled, and therefore even the ASes that prefer IPv6 could not use it.
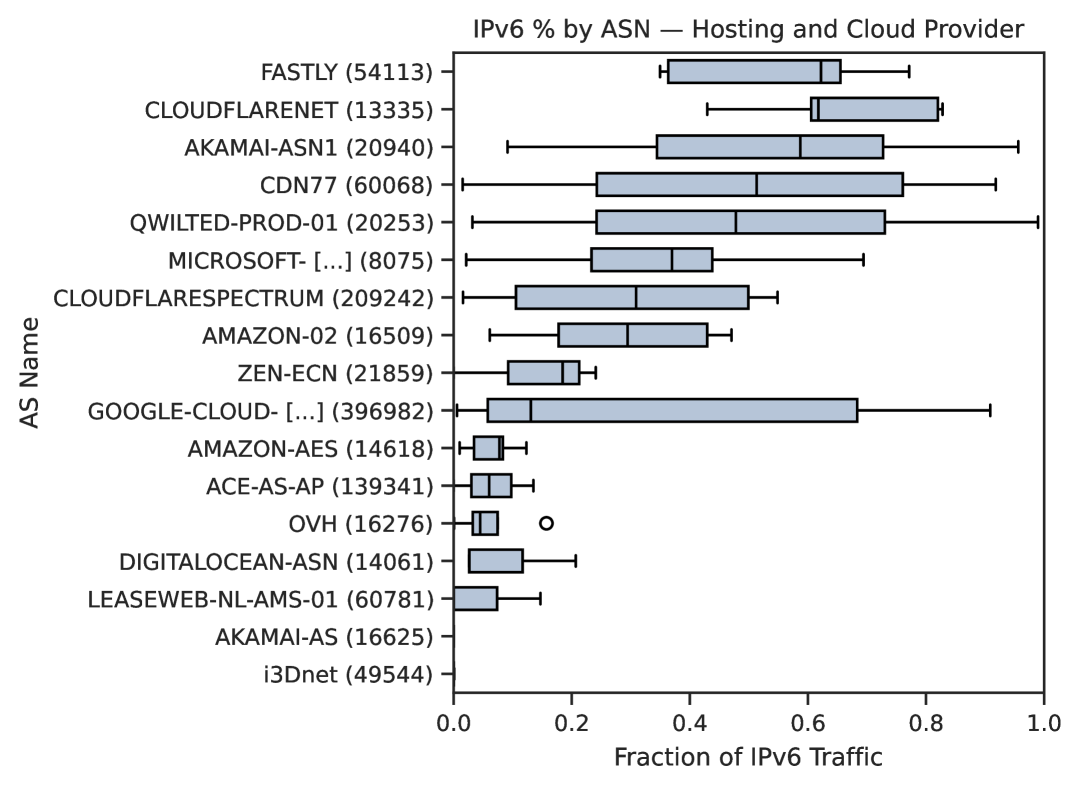
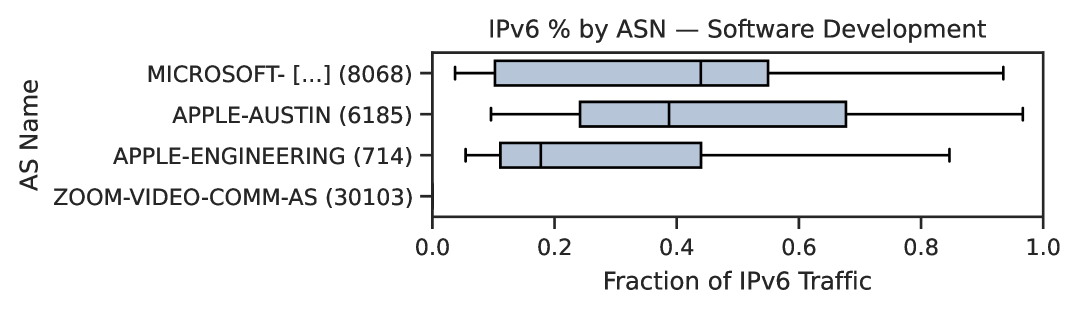
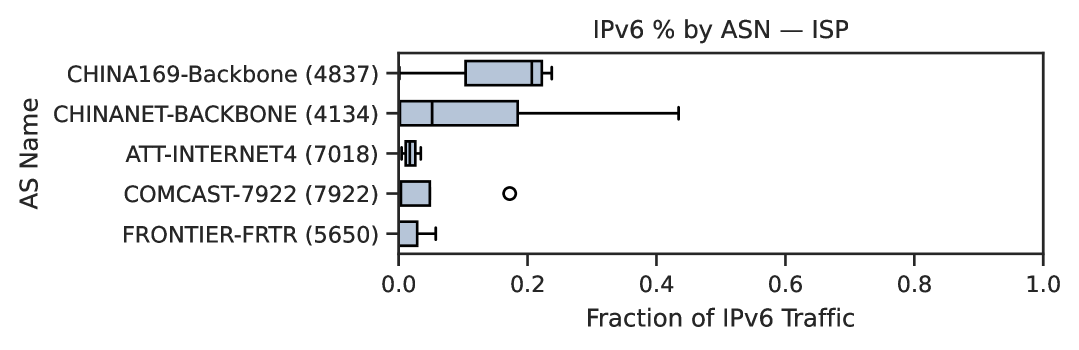
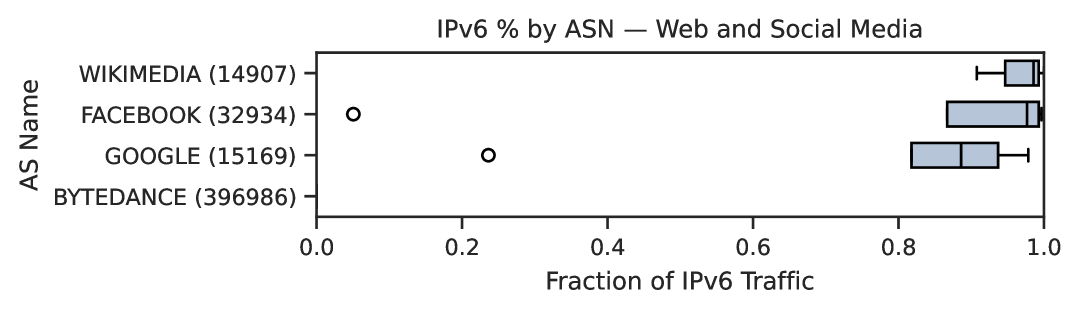
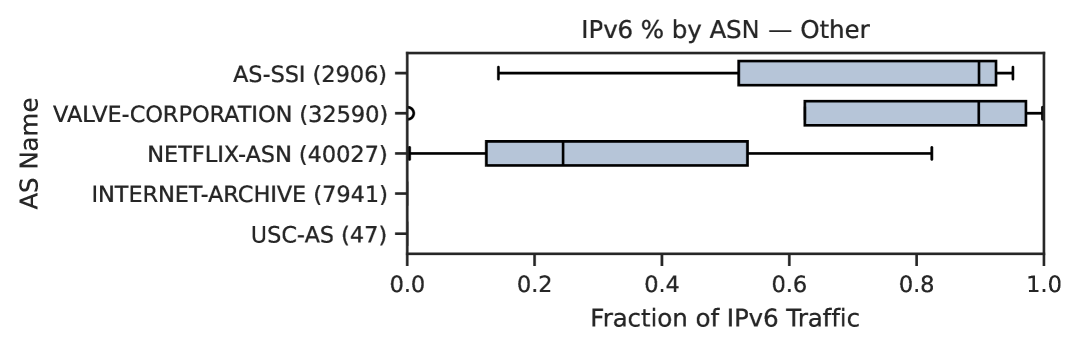
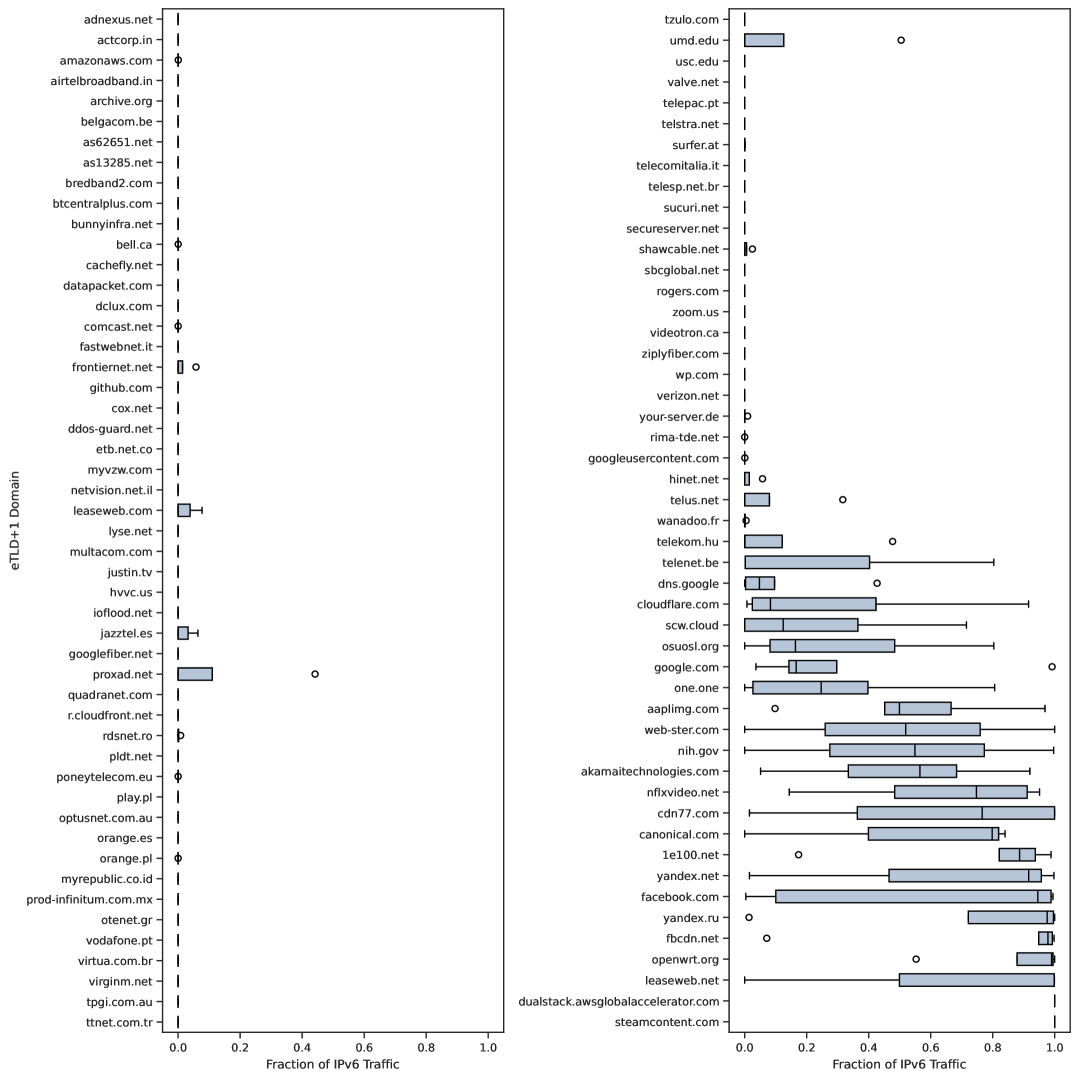
To identify ASes with a consistent IPv6 (or IPv4) preference, we focus on 35 ASes observed at three or more residences. We manually group them into five categories—Hosting, Software, ISP, Web and Social Media, and Other—based on primary function. Figure 4 shows the distribution of IPv6 traffic fractions for these ASes, with ASes in each category sorted by median IPv6 use. In the box plots, the boxes represent the interquartile range (25th to 75th percentiles), and whiskers extend to 1.5IQR.
We find that ISP ASes show consistently low IPv6 fractions, with medians at 20% or lower, and no AS exceeding 50%. On the opposite end, Web/Social Media ASes (with the exception of ByteDance, the company behind Tiktok) show consistently high IPv6 fractions, with medians exceeding 90%.
This AS-level analysis is helpful where it applies, but with many independent services hosted in shared clouds, AS-based analysis is limited. We see a wide variation in fractions of IPv6 traffic for cloud services, even though clouds all offer IPv6 support. Moreover, we know that some clouds are clear IPv6 laggards: OVH, DigitalOcean, and LeaseWeb show minimal IPv6 traffic, while i3D.net shows none. But even for IPv6-ready clouds, the seeming contradiction between offering and use prompts us to study clouds in § 5.
Domain Level. We identify the domain associated with each flow via reverse DNS lookups on destination IP addresses. We then aggregate traffic by domain, retaining only prominent domains: those that appear in three or more residences and generate at least 1 GB of traffic.
As the resulting list is long, we present it in the appendix as Figure 15. We observe many IPv4-laggard domains—those with zero or near-zero IPv6 traffic across all locations—including services not captured at the AS level, such as GitHub, Twitch (justin.tv), and WordPress (wp.com).
For services that use clouds or CDNs, reverse DNS often maps to canonical names of the cloud rather than the actual service. For example, a domain like example.com may resolve to subdomain.cdn.net, with reverse DNS revealing only the latter. Consequently, domain-level aggregates for cloud and CDN platforms largely mirror AS-level patterns, with variations driven by the specific mix of tenant services accessed at each residence. This limitation prompts our study of cloud-hosting in § 5.
Finally, we note that Zoom, GitHub and USC (a large U.S. university) generate no IPv6 traffic. This omission is significant: when key applications, workplaces, or campuses opt out of IPv6, it substantially limits users’ IPv6 exposure. We confirmed USC’s campus network lacks IPv6 support, meaning thousands of users are confined to IPv4. This contributes to a negative feedback loop—services see little IPv6 demand and deprioritize support, reinforcing the university’s decision. Yet, this “tragedy” also presents an opportunity: large campuses and enterprises can have a tangible impact on IPv6 adoption by enabling it, incentivizing services to adopt IPv6.
4. Server-side Adoption of IPv6
We now examine server-side IPv6 support. While previous work examined main pages (nikkhah_assessing_2011, 39, 15) and first-party resource (dhamdhere_measuring_2012, 18) of sites drawn from top lists, our goal here is to deepen this analysis to consider third-party resources and multiple pages at each website. Our goal is to provide a more nuanced understanding of server-side IPv6 use, and to understand to what extent third-party content is a barrier to IPv6.
We consider third-party resources because modern websites often depend on third-party components or CDNs to support social media (such as the Facebook “like” button or Disqus comment section), for user tracking and analytics, for ad delivery, and to support new fonts and JavaScript libraries. These resources are essential to get a full picture of a website; recent studies of cookies found that including third-party resources discovered about more cookies than just examining the top page (urban_beyond_2020, 54). While the website might be partially functional without some of these resources, we wish to evaluate the full website. (Users may not miss third-party ads, but they are essential to the economics of many websites.)
4.1. Measuring Servers
We next describe our approach to evaluating server more completely than prior work.
First we require a list of potential websites. We use the top 100k websites from the Tranco (LePochat2019, 33) top 1M list dated 2024-10-16 (ID: Z3Z3G). The Tranco list combines and averages website popularity rankings from multiple sources, including the Chrome User Experience Report (CrUX), Cloudflare Radar, Farsight, Majestic, and Cisco Umbrella, over a 30-day period. While several top lists have been introduced in the recent years, we choose Tranco for its use of multiple data sources and its widespread adoption in both academic and non-academic research. While studies have shown top-lists vary, and change over time (Scheitle18a, 48), and may not perfectly capture popularity (Ruth22a, 46), we believe this list provides a plausibly representative sample for our study.
We access websites using OpenWPM web privacy measurement framework (englehardt2016census, 21). For each website, OpenWPM spawns a Firefox browser to load and render the main page, including embedded resources. For a more accurate measurement, as suggested in prior work (urban_beyond_2020, 54), it then follows five randomly chosen links (or fewer if there are insufficient links), selected to be in the same domain. Some websites attempt to detect bots, so OpenWPM uses standard cloaking techniques such as simulating mouse movements, scrolling through the page, and pausing for a few seconds before simulating a click to navigate to the next page. For each top site, OpenWPM records the HTTP requests made by the browser, the DNS query results for each request, the IP address used to establish the connection, as well as the HTTP redirects and responses from the server(s). The measurements were conducted on a computer running OpenSUSE Tumbleweed with full support for both IPv4 and IPv6.
We conduct measurements in October 2024, then repeat them in April 2025 to evaluate how the results evolve over the six-month interval.
4.2. To what extent do websites support IPv6?
| Category | Oct 2024 | Apr 2025 | Change | |||
| Count | (%) | Count | (%) | Count | (%) | |
| Total | 100 000 | – | 100 000 | – | – | – |
| Loading-Failure (NXDOMAIN) | 12 355 | – | 13 107 | – | 0 | – |
| Loading-Failure (Others) | 4 457 | – | 4 567 | – | 0 | – |
| Connection Success | 83 188 | (100%) | 82 326 | (100%) | -862 | – |
| Unknown Primary Domain | 8 | (0.0%) | 6 | (0.0%) | -2 | (0.0) |
| IPv4-only (A-only domain) | 48 434 | (58.2%) | 47 388 | (57.6%) | -1 046 | (-0.6) |
| AAAA-enabled Domain | 34 746 | (41.8%) | 34 932 | (42.4%) | 186 | (0.6) |
| IPv6-partial (some A-only resources) | 24 779 | (29.8%) | 24 624 | (29.9%) | -155 | (0.1) |
| IPv6-full (AAAA for all resources) | 9 967 | (12.0%) | 10 308 | (12.5%) | 341 | (0.5) |
| Browser Used IPv4 | 1 122 | (1.4%) | 870 | (1.0%) | -252 | (-0.4) |
| Browser Used IPv6 Only | 8 845 | (10.6%) | 9 438 | (11.5%) | 593 | (0.9) |
Using the dataset we collected, we begin to address the question To what extent does each website support IPv6? Rather than categorizing top sites simply into a binary of fully loadable or not fully loadable over IPv6, we examine the individual steps involved in accessing a website on a machine with dual-stack connectivity and identify specific factors that may prevent a site from being fully accessible over IPv6. We then provide a detailed classification of top sites based on these factors.
Classifying Degrees of IPv6 Support. We convey the range of levels of IPv6 support as IPv4-only, IPv6-partial, IPv6-full, or loading-failure.
We classify websites lacking a AAAA DNS record as IPv4-only. We recognize that some resources may be accessible via IPv6, but without the main page, that matters little.
A website is IPv6-partial when the main page is available via IPv6, but some resources are IPv4 only. An IPv6-only user will likely see a degraded website for such pages. For these websites, we report the fraction of resources that are IPv6-capable.
A website is considered IPv6-full if both its main page and all embedded resources are accessible via IPv6.
Finally, we label websites loading-failure for pages with DNS or HTTP errors and TLS failures. Resources that face such failure are excluded from our analysis, as these failures are independent of IP version and thus are orthogonal to our discussion.
Evaluation Methodology. Two factors influence how much of a page we see as IPv6-ready.
First, the Happy Eyeballs algorithm requires web browsers to query IPv6 and IPv4 in parallel, with slight delays introduced to prioritize IPv6 (schinazi_happy_2017, 49). Because both protocols are queried simultaneously, it may change which protocol actually retrieves the content. However, we check IPv6 availability, rather than whether IPv6 is ultimately used, so our results are not affected by which protocol wins the happy eyeballs “race”.
Second, retrieving the main page and each resource involves multiple steps, any of which can fail. If the main page fails, the entire website is classified as a loading-failure. A full retrieval of each resource (the main page or an embedded resource) requires: a successful DNS query, TCP connection establishment, successful TLS negotiation (for HTTPS), an HTTP request, and finally the retrieval of the complete resource. Additionally, any resource can trigger one or more HTTP redirects. We follow all redirects whenever possible, and report the outcome for the final page in the redirect chain.
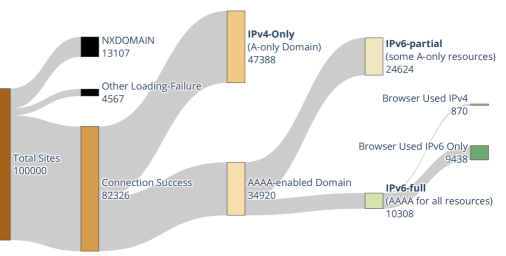
Results. We present the results of our analysis of Tranco top 100,000 websites, measured in October 2024 and April 2025, in Figure 5. Our discussion focuses on the April 2025 measurements, with comparisons to October 2024 to highlight changes over time. We ignore the 17,674 websites that fail to connect and examine the remaining 82,326.
First, we see that the majority of websites (47,388 or 57.6% of reachable sites) are IPv4-only. While this fraction is significant progress from the 96% of top-10k websites that were IPv4-only in 2014 (czyz_measuring_2014, 15), it is disappointing that, ten years later, more than half of the top-100k websites still lack IPv6 access.
Second, 29.9% of the reachable websites (24,624) are IPv6-partial. These web pages access some resources that are IPv4-only. Although the webpage author started to support IPv6 with the main page, as they drew in additional content, they were not careful to make sure their providers were as diligent.
Finally, 12.5% of sites (10,308) are IPv6-full. Although here, we see that only 11.5% (9,438) actually used IPv6 for all parts. We believe this final drop-off, about 1 in 10 times of pages that could be IPv6, occurs because IPv4 sometimes wins the Happy Eyeballs race.
A comparison of these results with the October 2024 measurements reveals a slight but consistent increase in IPv6 adoption: the share of IPv4-only websites decreased by 0.6%, while the proportion of IPv6-full websites increased by 0.5%. Although modest, these changes reflect ongoing progress toward broader IPv6 deployment.
4.3. Which Resources Make Websites IPv6-partial?
Given that two-thirds of IPv6-enabled websites are only IPv6-partial raises the question: Which resources are preventing IPv6-full? Resources lacking IPv6 support are “low-hanging fruit” to transition more websites to IPv6-full.
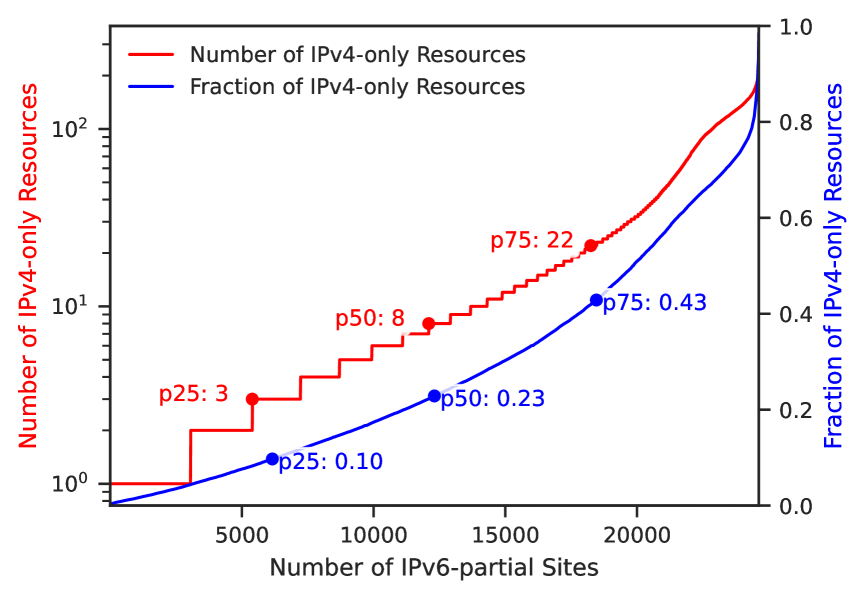
To understand how much change is needed to improve IPv6-partial websites, Figure 6 shows the number (red line and axis) and fraction (blue line and axis) of IPv4-only resources seen in IPv6-partial sites. We see that almost all IPv6-partial sites depend on multiple IPv4-only resources (75% of sites need three or more), even though the majority of of resources are usually available on IPv6 (from the blue curve, 75% of IPv6-partial sites have more than half the resources available via IPv6). Although most resources are IPv6-ready, the fact that most IPv6-partial sites depend on multiple IPv4-only domains means that widespread improvements are needed to achieve full adoption.
To distinguish between same-origin and cross-origin dependencies, we classify IPv4-only resources as either first-party or third-party by comparing their domain (specifically, their eTLD+1) to that of the crawled site; a mismatch indicates a third-party domain. Surprisingly, 557 out of 24,624 IPv6-partial websites (2.3%) are IPv6-partial because of IPv4-only first-party domains—presumably something the website can correct if they choose to do so, since they already operate IPv6-enabled servers. For example, IPv6-full www.national-geographic.org uses images from IPv4-only assets.national-geographic.org. While rare, these cases should be easy to correct.
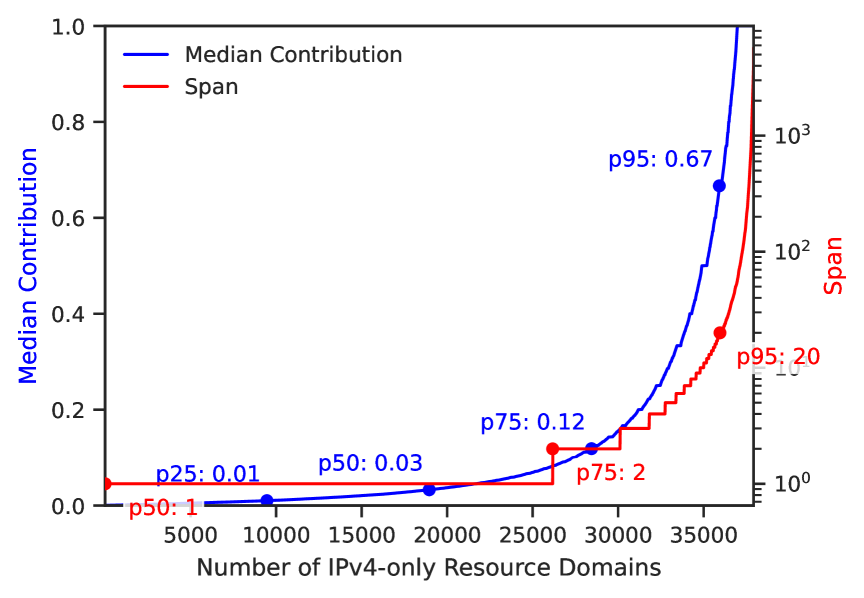
We assess the impact of IPv4-only domains using span and median contribution from prior work (bajpai_longitudinal_2019, 7). Span of an IPv4-only domain counts how many IPv6-partial websites depend on it, and median contribution of is median of the fraction of IPv4-only resources it supplies to all websites that depend on it. Larger values for either shows a more influential resource holding back more IPv6-partial websites than other resources.
Figure 7 presents the CDFs of span and median contribution for all IPv4-only eTLD+1 domains used by IPv6-partial websites. The span distribution is highly skewed, with a long tail: while most IPv4-only resources are used by only one or two other sites, a few are very widely used. Specifically, 75% of these domains are used by at most two websites, and for 75% of them, the median fraction of IPv4-only resources they provide to each dependent website is no more than 12%. In contrast, a small number of domains exert disproportionately high influence. At the 95th percentile, an IPv4-only domain appears on 20 websites and contributes, on median, 67% of the IPv4-only resources for each of those websites. A handful of such domains are used by over 1,000 websites, and some are responsible for all IPv4-only resources on the websites that depend on them.
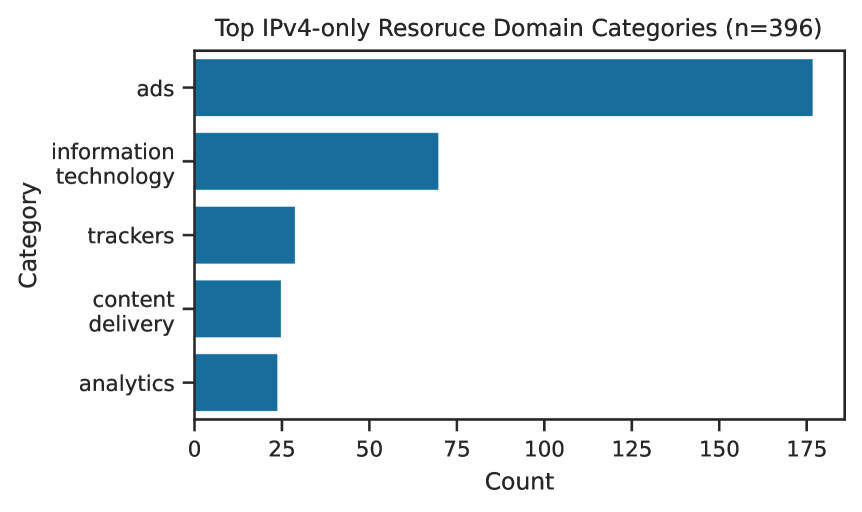
Heavy-hitter IPv4-only resources. We now focus on the “heavy-hitters”—396 IPv4-only resources with a span of at least 100 websites. What functionality do these domains provide? We answer this question two different ways.
First, we characterize these IPv4-only resources with VirusTotal’s domain categorization service (noauthor_virustotal_nodate, 55). VirusTotal itself does not perform the categorization; instead, it aggregates results from multiple third-party services such as BitDefender and Forcepoint ThreatSeeker. We manually reviewed and consolidated these results to assign final categories. Figure 8 shows the most common categories among these high-impact domains. Advertising is the dominant category, accounting for over 60% of the domains. While we expect many third-party advertising services, we are surprised that so many of them remain IPv4-only—especially given that advertising seeks to maximize reach and, in some cases, IPv6 may even enhance user tracking due to IPv4 address sharing among users. Other frequently observed categories include Tracking, CDN and analytics.
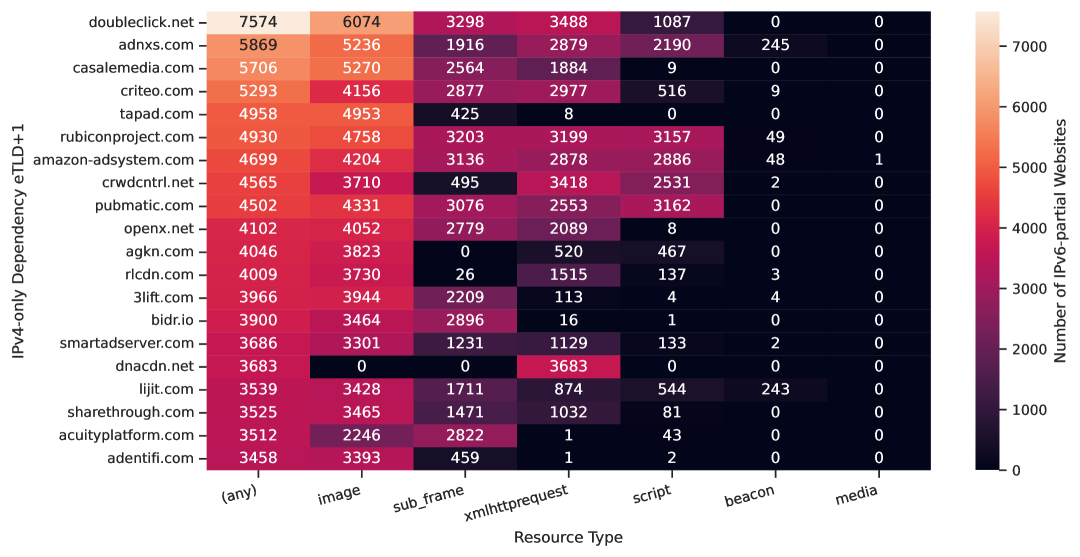
Next, we examine the resource types served by prominent IPv4-only resources through the heatmap shown in Figure 16 (in the appendix for space). Images are the most frequently served resource type, followed by sub_frame, xmlhttprequest, and JavaScript. Thus, IPv6-only users may encounter broken images or impaired functionality on websites that depend on these domains.
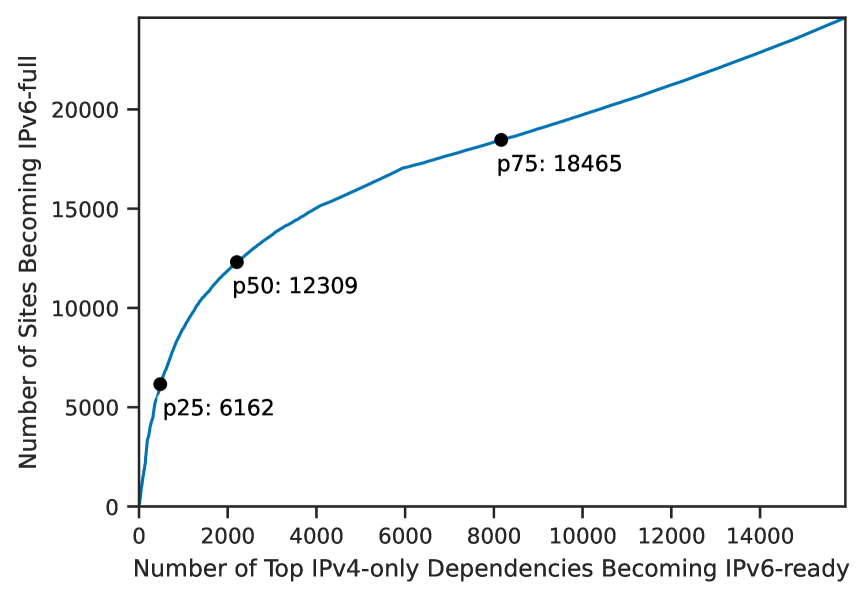
To identify specific third-party domains that would have large impact if they adopted IPv6, we simulate a scenario where IPv4-only third-party domains enable IPv6 one at a time, in descending order of their span. At each step, we compute the fraction of currently IPv6-partial websites that would transition to IPv6-full. The resulting CDF is shown in Figure 9. The distribution exhibits a long tail: enabling IPv6 on just the top 500 (3.1%) IPv4-only third-party domains would allow over 25% of IPv6-partial websites to become IPv6-full. However, for all 24,624 partially IPv6-partial websites to become IPv6-full, nearly 16,000 third-party domains would need to enable IPv6. Thus, prioritizing IPv6 adoption among a relatively small set of high-impact third-party domains can substantially increase the number of IPv6-full websites, but achieving universal IPv6 readiness will require a much broader effort.
5. Cloud Adoption of IPv6
With over half of all web traffic served via CDNs (sumits_internet_2017, 52) and 90% of companies using cloud computing (krivec_cloud_2024, 32), cloud and CDN support for IPv6 is essential. Today, all cloud and CDN platforms support IPv6, so one would think that customers can just “push a button” to enable IPv6 in their cloud servers. However, as shown in Figure 4, cloud and CDN traffic is a mix of IPv4 and IPv6, with the proportions varying widely across locations for many providers.
This section explores cloud and CDN (hereafter, just “cloud”) support for IPv6 and why it is more difficult than one might expect for a customer to turn it on. The line between cloud and CDN providers is increasingly blurred—clouds offer CDN services (e.g., Amazon CloudFront), and CDNs offer cloud services (e.g., Akamai Compute)—so we use cloud to refer to both.
5.1. Are Some Clouds IPv6-Heavy?
We first ask: are some clouds IPv6-heavy? That is, do some clouds or CDNs show more (or less) IPv6 traffic than typical? We assume IPv6 support is similar across all clouds, so differences in IPv6 use suggest something different about the clouds, and a possibility to improve on or emulate what they are doing.
To examine IPv6-use by cloud, we compare the proportion of IPv6-full domains hosted by each provider against those of others. We reuse the server-side data from § 4.1. As described there, we begin with the Tranco top 100k list, crawl each site, and simulate up to five random link clicks per site. For each page load, we record the fully qualified domain names (FQDNs) of all loaded resources, resulting in a dataset of 265,248 FQDNs. With a large list of popular websites, we expect it to include most major clouds as well as their customers.
As before, we classify domains as IPv4-only (A record only) or IPv6-full (both A and AAAA). Unlike top sites, we observe some domains that only have AAAA records; we classify AAAA-only domains as IPv6-only.
We identify a domain’s cloud provider by the AS to which its IP addresses are assigned. Because a single cloud may operate multiple ASes, we map each AS number to an organization name using CAIDA’s AS-to-Organization dataset (caida-as2org, 12).
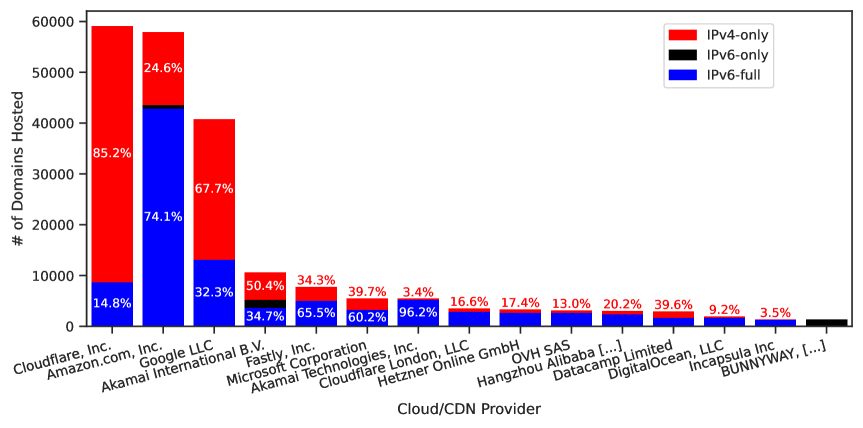
Figure 10 shows bar chart of the top 15 clouds ranked by the number of domains they host, and the degree of IPv6 readiness of each cloud. We provide the full breakdown in Figure 17 in the appendix. Collectively, these clouds account for 76% of all domains in our dataset.
While we expect uniform IPv6 support across clouds, instead we see cloud customers vary from 3% to 85% IPv6-ready—a huge range! While all of these cloud providers support IPv6 in theory, for some reason there is a huge variation in practice. Cloudflare, Amazon, and Google collectively host nearly 60% of the domains we analyze. Among them, Cloudflare (85.2%) and Google (67.7%) demonstrate strong IPv6 support, whereas Amazon trails considerably at 24.6%. Smaller clouds tend to have lower IPv6 adoption rates, with the notable exception of Bunnyway. Bunnyway—the organization behind the CDN bunny.net—is almost entirely IPv6-only (99.5%), with 1,203 domains whose AAAA records point to bunny.net IP addresses, while their A records resolve to Datacamp Limited (operator of CDN77). This relationship is a partnership between the two companies, with Bunnyway using Datacamp servers (Datapacket25a, 16), an organizational relationship not captured by the AS-to-Org dataset we used.
5.2. Do Some Clouds Make IPv6 Harder?
What accounts for the significant variation in IPv6 use we see in § 5.1? While all clouds support IPv6, we hypothesize that some make its use harder or easier. For example, some enable it by default, while others require one explicitly enable it on a control setting. Comparing IPv6 usage by tenant across clouds is complicated because our data combines two factors: the cloud’s support for IPv6, and the tenant’s interest in IPv6. To disambiguate these two factors, we consider tenants to that use multiple clouds, since that should hold the interest of the tenant constant and emphasize any differences in cloud mechanisms.
To evaluate tenant behavior, we define tenants by their effective top-level domain plus one (eTLD+1), that is, a domain name consisting of one label and a public suffix (Mozilla07a, 38). We look at all 265k FQDNs in our dataset described in § 5.1, and group them by eTLD+1, then identify tenants that use more than one cloud provider. As example, apnic.net is an eTLD+1 with a number of subdomains, including www, blog, cgi1, webdist.data, info, and login. Of these, most are hosted by Cloudflare and are IPv6-full, but the last two are hosted by Amazon and are IPv4-only. Finally, we identify multi-cloud tenants as those tenants that use at least two different clouds (after merging Akamai and Cloudflare’s two organizations). Our expanded Tranco dataset identifies 21,314 multi-cloud tenants, and Figure 10 shows the fraction of each cloud’s tenants that support IPv6.
For each cloud pair and for each eTLD+1 they both serve, we compute the fraction of subdomains that are IPv6-full under each cloud. To assess differences between cloud support we apply a two-sided Wilcoxon signed-rank test. The test requires at least two non-tie pairs (). That is, at least two domains where the fractions differ. For our data, 67 of the 78 possible cloud pairs meet this criterion. To quantify the magnitude of these differences, we calculate the effect size for each comparison where uses the Wilcoxon rank-sum test. Finally, we correct for multiple comparisons using the Holm-Bonferroni method (with significance level ) to control the family-wise error rate (Holm-Bonferroni, 25).
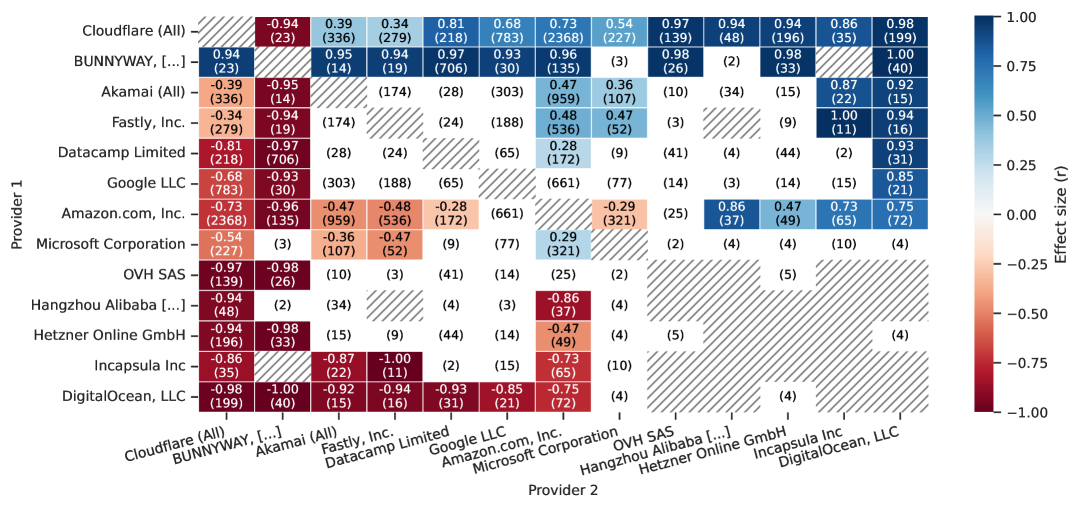
Figure 11 shows a heatmap comparing clouds by effect size . Each row and column is one of the 13 clouds, ordered here by how often the cloud outperforms the others by value. Each cell is colored by size of the difference (), with blue showing better IPv6 coverage and red, lower, while white regions exhibit statistically indistinguishable IPv6 coverage, and hatched regions are not comparable (insufficient examples, or a self-comparison). Parentheses show the number of non-tie pairs in parentheses. (The table is symmetric.)
This table shows there are large differences between different providers. Large providers Cloudflare and Akamai both have better than typical IPv6 support. Bunnyway also stands out, but this difference is largely because of their shared hosting with Datacamp as described in § 5.1. Several other large providers (Google, Amazon, and Microsoft) show typical performance, while smaller providers seem to show poorer-than-average IPv6 support (consistent with our findings in § 3.4). CDN-first providers generally show stronger IPv6 adoption, while traditional cloud providers tend to rank lower.
We attribute these differences to cloud deployment policies. The two providers with highest support, Cloudflare and Akamai, have had a default IPv6-on policy since 2014 and 2016 respectively (nygren_akamai_2018, 40, 34).
By contrast, the large cloud providers—Amazon, Google, and Microsoft—offer inconsistent IPv6 support across their products: while Amazon CloudFront and Azure CDN are IPv6-on-by-default (cloudfront_announcing_2016, 3, 20), other services remain IPv6-opt-in or lack support entirely (aws_ipv6_2025, 5, 41, 28).
5.3. Which Clouds Are Leaders and Laggards?
| Cloud Provider | Service | IPv6 Support | # IPv6-ready | # Total | % IPv6-ready |
| Cloudflare | Cloudflare CDN | Default-On, Opt-out (cloudflare_ipv6_2025, 27) | 3 086 | 4 402 | 70.1% |
| Bunny.net | bunny.net CDN | Default-On (dejan_grofelnik_pelzel_return_2019, 17) | 1 003 | 1 004 | 99.9% |
| Akamai | Akamai CDN | Default-On, Opt-out (yeung_akamai_2023, 58) | 3 620 | 7 419 | 48.8% |
| Akamai NetStorage | Default-On, Opt-out (yeung_akamai_2023, 58) | 791 | 1 633 | 48.4% | |
| DataCamp | CDN77 | Yes (cdn77enablesipv6_616404_2017, 1) | 673 | 759 | 88.7% |
| bunny.net CDN | Default-On (dejan_grofelnik_pelzel_return_2019, 17) | 217 | 1 300 | 16.7% | |
| Google Cloud Run | Yes (gcp_ipv6_2025, 28) | 334 | 334 | 100.0% | |
| Google App Engine | Default-On (googleappengineipv6, 4) | 150 | 150 | 100.0% | |
| Amazon | Amazon CloudFront CDN | Default-On, Opt-out (cloudfront_announcing_2016, 3, 6) | 9 142 | 12 851 | 71.1% |
| Amazon Elastic Load Balancer | Partial (aws_ipv6_2025, 5) | 201 | 2 731 | 7.4% | |
| Amazon Global Accelerator | Yes (aws_ipv6_2025, 5) | 4 | 150 | 2.7% | |
| Amazon S3 | Yes (aws_ipv6_2025, 5) | 7 | 1 862 | 0.4% | |
| Amazon API Gateway | Yes (aws_ipv6_2025, 5) | 0 | 419 | 0.0% | |
| Amazon Web Application Firewall | Yes (aws_ipv6_2025, 5) | 0 | 134 | 0.0% | |
| Microsoft | Azure Stack/IoT Edge | Yes | 1 134 | 1 134 | 100.0% |
| Azure Front Door CDN | Always On (microsoft_forwarding_2024, 22) | 913 | 913 | 100.0% | |
| Azure Cloud Services / VMs | Yes (azure_overview_2024, 41) | 2 | 607 | 0.3% | |
| Azure Websites | Unknown | 0 | 544 | 0.0% | |
| Azure Blob Storage | Unknown | 0 | 354 | 0.0% |
Which cloud services lead or lag in IPv6 adoption, and what factors explain these differences? Clouds offer a range of services, and even within a single provider, IPv6 adoption can vary by service. This variance may depend on factors such as when IPv6 support was introduced by the provider, and how easily it can be enabled. Understanding these patterns can help explain what drives or impedes adoption.
We identify cloud services by domain names. Following work by He et al. (he_next_2013, 24), we leverage the common use of CNAME records in cloud deployments to infer the identities of services. We start with our earlier list of 265k FQDNs and resolve the DNS records for each through CNAMEs or chains of CNAMEs, resulting in 430,924 unique domains. We then extract domain suffixes covering 100 or more FQDNs (e.g., *.s3.amazonaws.com) and manually map them to cloud services using official documentation. Figure 12 lists the 20 identified services, their 7 providers, and corresponding IPv6 adoption rates.
We first ask, how are the services with default IPv6-on policies performing? Cloudflare, Akamai and Amazon CloudFront CDNs have had default IPv6-on policies for nearly a decade (nygren_akamai_2018, 40, 34, 3), yet adoption remains incomplete, with 30-50% of domains still IPv4-only. These platforms allow tenants to opt out of IPv6, and many have done so. In contrast, Azure Front Door does not permit IPv6 to be disabled (microsoft_forwarding_2024, 22), and all its domains are IPv6-ready. This suggests that default-on policies alone are insufficient—tenants often disable IPv6 to avoid perceived complexity.
Although IPv6 support for Amazon S3 was announced along with Amazon CloudFront in 2016 (cloudfront_announcing_2016, 3), S3’s actual adoption is near zero (0.4%)! Unlike CloudFront, which enables IPv6 transparently, S3 requires tenants to switch from s3.¡region¿.amazonaws.com to s3.dualstack.¡region¿.amazonaws.com. Our data shows that many tenants hardcode S3 endpoints in their webpages, so enabling IPv6 requires not just opting in, but also modifying application code. Nine years later, only 0.4% have done so, highlighting the ineffectiveness of this model. By contrast, Elastic Load Balancers also require a CNAME update to enable IPv6 (elb_configure_ipv6, 14), but since ELB domains are rarely hardcoded, adoption is low but slightly higher at 7.4%.
These observations prompt us to recommend that all services should transparently add IPv6, adding AAAA records rather than requiring domain changes. Disabling IPv6 should be permitted only in cases of service-breaking issues. This default-on, no-disable approach achieves usage rates of 100%, instead of less than 10% or 1% when manual opt-in and code changes are required.
6. Conclusion
This paper advocates for a more nuanced, non-binary view of IPv6: not just whether IPv6 is supported, but how much it is actually used in practice. We apply this non-binary perspective through measurements at three levels of the ecosystem: users, services, and cloud providers. Our measurements show that even in dual-stack environments, IPv6 usage varies significantly with human activity, and many commonly accessed services remain IPv4-only. At the service level, while over 40% top websites now support IPv6 at the root, full IPv6 coverage across all embedded resources is rare. Among cloud platforms, we find that tenant adoption is strongly influenced by the ease of enabling IPv6—platforms with IPv6-on-by-default policies see much higher uptake. Moving toward full IPv6 adoption will require not just support, but seamless, default-on deployment from major applications, enterprises, third-party resources, and cloud providers.
Acknowledgements.
This work is partially supported by the U.S. National Science Foundation through projects “Privacy in Internet Measurements Applied To WAN and Telematics (PIMAWAT)” (CNS-2319409) and “A Traffic Map for the Internet” (CNS-2212480).References
- (1) “616404 - gentoo.org missing AAAA record”, 2017 URL: https://bugs.gentoo.org/616404#c4
- (2) AMS-IX “sFlow Statistics” https://stats.ams-ix.net/sflow/index.html, Last accessed on 2022-09-09
- (3) “Announcing Internet Protocol Version 6 (IPv6) support for Amazon CloudFront, AWS WAF, and Amazon S3 Transfer Acceleration”, 2016 URL: https://aws.amazon.com/about-aws/whats-new/2016/10/ipv6-support-for-cloudfront-waf-and-s3-transfer-acceleration/
- (4) “App Engine and IPv6, Round 2” URL: https://cloudplatform.googleblog.com/2010/07/app-engine-and-ipv6-round-2.html
- (5) “AWS services that support IPv6 - Amazon Virtual Private Cloud” URL: https://docs.aws.amazon.com/vpc/latest/userguide/aws-ipv6-support.html
- (6) “AWS::CloudFront::Distribution DistributionConfig - AWS CloudFormation” URL: https://docs.aws.amazon.com/AWSCloudFormation/latest/UserGuide/aws-properties-cloudfront-distribution-distributionconfig.html#cfn-cloudfront-distribution-distributionconfig-ipv6enabled
- (7) Vaibhav Bajpai and Jürgen Schönwälder “A Longitudinal View of Dual-Stacked Websites—Failures, Latency and Happy Eyeballs” In IEEE/ACM Transactions on Networking 27.2, 2019, pp. 577–590 DOI: 10.1109/TNET.2019.2895165
- (8) Guillermo Baltra, Xiao Song and John Heidemann “Ebb and Flow: Implications of ISP Address Dynamics” ISSN: 1611-3349 In Passive and Active Measurement Springer, Cham, 2024, pp. 132–149 DOI: 10.1007/978-3-031-56252-5˙7
- (9) Kasun Bandara, Rob J. Hyndman and Christoph Bergmeir “MSTL: A Seasonal-Trend Decomposition Algorithm for Time Series with Multiple Seasonal Patterns” arXiv, 2021 DOI: 10.48550/arXiv.2107.13462
- (10) Jeff Barr “New - AWS Public IPv4 Address Charge + Public IP Insights” In AWS News Blog, 2023 URL: https://aws.amazon.com/blogs/aws/new-aws-public-ipv4-address-charge-public-ip-insights/
- (11) George M. Beal and Joe M. Boklen “The Diffusion Process”, 1957 DOI: https://dr.lib.iastate.edu/handle/20.500.12876/90170
- (12) CAIDA “The CAIDA UCSD AS to Organization Mapping Dataset”, 2025 URL: https://www.caida.org/catalog/datasets/as-organizations/
- (13) Lorenzo Colitti, Steinar H. Gunderson, Erik Kline and Tiziana Refice “Evaluating IPv6 Adoption in the Internet” In Passive and Active Measurement, Lecture Notes in Computer Science Berlin, Heidelberg: Springer, 2010, pp. 141–150 DOI: 10.1007/978-3-642-12334-4˙15
- (14) “Configure a load balancer to work with IPv6 addresses” URL: https://repost.aws/knowledge-center/elb-configure-with-ipv6
- (15) Jakub Czyz et al. “Measuring IPv6 adoption” In Proceedings of the 2014 ACM conference on SIGCOMM, SIGCOMM ’14 New York, NY, USA: Association for Computing Machinery, 2014, pp. 87–98 DOI: 10.1145/2619239.2626295
- (16) Datapacket “How bunny.net scaled to manage over a million websites with DataPacket’s dedicated servers”, Website https://www.datapacket.com/case-study/bunnynet, 2025 URL: https://www.datapacket.com/case-study/bunnynet
- (17) Dejan Grofelnik Pelzel “The Return of IPv6 to BunnyCDN”, 2019 URL: https://bunny.net/blog/ipv6-returns-to-bunnycdn/
- (18) Amogh Dhamdhere et al. “Measuring the deployment of IPv6: topology, routing and performance” In Proceedings of the 2012 Internet Measurement Conference, IMC ’12 New York, NY, USA: Association for Computing Machinery, 2012, pp. 537–550 DOI: 10.1145/2398776.2398832
- (19) Laura Dobberstein “Vietnam plans to convert all of its networks to IPv6” In The Register, 2024 URL: https://www.theregister.com/2024/10/14/vietnam_digital_infrastructure_policy/
- (20) “Enable IPv6 on Azure CDN (Microsoft CDN) - Microsoft Q&A”, 2021 URL: https://learn.microsoft.com/en-us/answers/questions/640940/enable-ipv6-on-azure-cdn-(microsoft-cdn)
- (21) Steven Englehardt and Arvind Narayanan “Online tracking: A 1-million-site measurement and analysis” In Proceedings of ACM CCS 2016, 2016
- (22) “Forwarding IPV4 instead of IPV6 in Azure Front Door - Microsoft Q&A”, 2024 URL: https://learn.microsoft.com/en-us/answers/questions/1510869/forwarding-ipv4-instead-of-ipv6-in-azure-front-doo
- (23) Google “IPv6 Adoption” https://www.google.com/intl/en/ipv6/statistics.html#tab=ipv6-adoption, Last accessed on 2022-09-09, 2022
- (24) Keqiang He et al. “Next stop, the cloud: understanding modern web service deployment in EC2 and azure” In Proceedings of the 2013 conference on Internet measurement conference Barcelona Spain: ACM, 2013, pp. 177–190 DOI: 10.1145/2504730.2504740
- (25) Sture Holm “A Simple Sequentially Rejective Multiple Test Procedure” In Scandinavian Journal of Statistics 6.2 [Board of the Foundation of the Scandinavian Journal of Statistics, Wiley], 1979, pp. 65–70
- (26) Internet Society “Enabling Technologies” https://pulse.internetsociety.org/technologies, Last accessed on 2022-09-09
- (27) “IPv6 compatibility”, 2025 URL: https://developers.cloudflare.com/network/ipv6-compatibility/
- (28) “IPv6 support in Google Cloud — VPC” URL: https://cloud.google.com/vpc/docs/ipv6-support
- (29) Siyuan Jia et al. “Tracking the deployment of IPv6: Topology, routing and performance” In Computer Networks 165, 2019, pp. 106947 DOI: 10.1016/j.comnet.2019.106947
- (30) Elliott Karpilovsky et al. “Quantifying the Extent of IPv6 Deployment” In Passive and Active Network Measurement, Lecture Notes in Computer Science Berlin, Heidelberg: Springer, 2009, pp. 13–22 DOI: 10.1007/978-3-642-00975-4˙2
- (31) Zane Khan “Amazon finds $1B jackpot in its 100 million+ IPv4 address stockpile” In TechSpot, 2024 URL: https://www.techspot.com/news/101753-amazon-finds-1b-jackpot-100-million-ipv4-address.html
- (32) Rok Krivec “Cloud Computing Statistics (How Many Companies Use Cloud Computing?)”, 2024 URL: https://colorlib.com/wp/cloud-computing-statistics/
- (33) Victor Le Pochat et al. “Tranco: A Research-Oriented Top Sites Ranking Hardened Against Manipulation” In Proceedings of the 26th Annual Network and Distributed System Security Symposium, NDSS 2019, 2019 DOI: 10.14722/ndss.2019.23386
- (34) Martin J Levy “I joined CloudFlare on Monday along with 5,000 others”, 2014 URL: https://blog.cloudflare.com/i-joined-cloudflare-on-monday-along-with-5-000-others/
- (35) Frank Li and David Freeman “Towards A User-Level Understanding of IPv6 Behavior” In Proceedings of the ACM Internet Measurement Conference, IMC ’20 New York, NY, USA: Association for Computing Machinery, 2020, pp. 428–442 DOI: 10.1145/3419394.3423618
- (36) Ioana Livadariu, Ahmed Elmokashfi, Amogh Dhamdhere and kc “A first look at IPv4 transfer markets” In Proceedings of the ninth ACM conference on Emerging networking experiments and technologies, CoNEXT ’13 New York, NY, USA: Association for Computing Machinery, 2013, pp. 7–12 DOI: 10.1145/2535372.2535416
- (37) Bob Metcalfe “Metcalfe’s Law after 40 Years of Ethernet” In Computer 46.12, 2013, pp. 26–31 DOI: 10.1109/MC.2013.374
- (38) Mozilla “Public Suffix List”, https://publicsuffix.org/, 2007 URL: https://publicsuffix.org/
- (39) Mehdi Nikkhah, Roch Guérin, Yiu Lee and Richard Woundy “Assessing IPv6 through web access a measurement study and its findings” In Proceedings of the Seventh COnference on emerging Networking EXperiments and Technologies, CoNEXT ’11 New York, NY, USA: Association for Computing Machinery, 2011, pp. 1–12 DOI: 10.1145/2079296.2079322
- (40) Erik Nygren “Akamai Blog — Six Years Since World IPv6 Launch: Entering the Majority Phases”, 2018 URL: https://www.akamai.com/blog/performance/six-years-since-world-ipv6-launch
- (41) “Overview of IPv6 for Azure Virtual Network”, 2024 URL: https://learn.microsoft.com/en-us/azure/virtual-network/ip-services/ipv6-overview
- (42) Konstantina Papagiannaki, Nina Taft, Zhi-Li Zhang and Christophe Diot “Long-Term Forecasting of Internet Backbone Traffic” In IEEE Transactions on Neural Networks 16.5, 2005, pp. 1110–1124 DOI: 10.1109/TNN.2005.853437
- (43) Lars Prehn, Franziska Lichtblau and Anja Feldmann “When wells run dry: the 2020 IPv4 address market” In Proceedings of the 16th International Conference on emerging Networking EXperiments and Technologies, CoNEXT ’20 New York, NY, USA: Association for Computing Machinery, 2020, pp. 46–54 DOI: 10.1145/3386367.3431301
- (44) Enric Pujol, Philipp Richter and Anja Feldmann “Understanding the Share of IPv6 Traffic in a Dual-Stack ISP” In Passive and Active Measurement, Lecture Notes in Computer Science Cham: Springer International Publishing, 2017, pp. 3–16 DOI: 10.1007/978-3-319-54328-4˙1
- (45) Lin Quan, John Heidemann and Yuri Pradkin “When the Internet Sleeps: Correlating Diurnal Networks With External Factors” In ACM Internet Measurement Conference Vancouver, BC, Canada: ACM, 2014, pp. 87–100 DOI: http://dx.doi.org/10.1145/2663716.2663721
- (46) Kimberly Ruth et al. “Toppling top lists: evaluating the accuracy of popular website lists” In 22nd ACM Internet Measurement Conference ACM, 2022, pp. 374–387 DOI: https://doi.org/10.1145/3517745.3561444
- (47) Nadi Sarrar et al. “Investigating IPv6 Traffic” In Passive and Active Measurement, Lecture Notes in Computer Science Berlin, Heidelberg: Springer, 2012, pp. 11–20 DOI: 10.1007/978-3-642-28537-0˙2
- (48) Quirin Scheitle et al. “A Long Way to the Top: Significance, Structure, and Stability of Internet Top Lists” In ACM Internet Measurement Conference Boston, Massachusetts, USA: ACM, 2018 DOI: https://doi.org/10.1145/3278532.3278574
- (49) David Schinazi and Tommy Pauly “Happy Eyeballs Version 2: Better Connectivity Using Concurrency” Num Pages: 15, 2017 DOI: 10.17487/RFC8305
- (50) Stephen D. Stowes “Diurnal and Weekly Cycles in IPv6 Traffic” In Applied Networking Research Workshop ACM, 2016, pp. 65–67 DOI: https://doi.org/10.1145/2959424.2959438
- (51) Florian Streibelt et al. “How Ready is DNS for an IPv6-Only World?” In Passive and Active Measurement, Lecture Notes in Computer Science Cham: Springer Nature Switzerland, 2023, pp. 525–549 DOI: 10.1007/978-3-031-28486-1˙22
- (52) Arielle Sumits “The Internet is Closer to Home Than You Think”, 2017 URL: https://blogs.cisco.com/sp/the-internet-is-closer-to-home-than-you-think
- (53) The Internet Society “World IPv6 Launch: IPv6 is the New Normal”, website https://www.worldipv6launch.org/, 2012 URL: https://www.worldipv6launch.org/
- (54) Tobias Urban, Martin Degeling, Thorsten Holz and Norbert Pohlmann “Beyond the Front Page:Measuring Third Party Dynamics in the Field” In Proceedings of The Web Conference 2020, WWW ’20 New York, NY, USA: Association for Computing Machinery, 2020, pp. 1275–1286 DOI: 10.1145/3366423.3380203
- (55) “VirusTotal” URL: https://www.virustotal.com/
- (56) Garry White, Jaymeen Shah and James Cook “Internet Technology in 2010: The Issue of IPv6 Adoption in the U.S.A.” In Journal of International Technology and Information Management 14.3, 2005 DOI: 10.58729/1941-6679.1222
- (57) Jun Xu, Jinliang Fan, Mostafa H. Ammar and Sue B. Moon “Prefix-Preserving IP Address Anonymization: Measurement-Based Security Evaluation and a New Cryptography-Based Scheme” In 10th Washington, DC, USA: IEEE, 2002, pp. 280–289 URL: http://www.cc.gatech.edu/computing/Networking/projects/cryptopan/icnp02.ps
- (58) Kams Yeung “A CDN provider’s perspective on IPv6 in 2023”, 2023 URL: https://2023.apricot.net/assets/files/APPS314/apricot2023acdnprovi_1677569330.pdf
- (59) Sebastian Zander and Xuequn Wang “Are We There Yet? IPv6 in Australia and China” In ACM Transactions on Internet Technology 18.3, 2018, pp. 1–20 DOI: 10.1145/3158374
- (60) Sebastian Zander et al. “Mitigating sampling error when measuring internet client IPv6 capabilities” In Proceedings of the 2012 Internet Measurement Conference, IMC ’12 New York, NY, USA: Association for Computing Machinery, 2012, pp. 87–100 DOI: 10.1145/2398776.2398787
Appendix A Ethics
Our user studies in this paper were IRB-reviewed (USC IRB #UP-24-00738) and approved. As part of IRB approval we documented our user interaction scripts, user population, and opt-out procedures.
For client-side data collection, our measurement tool operates on household routers, recording the IP endpoints of traffic flows and the amount of data sent and received. Since this information is generally considered private, we took several steps to protect user privacy: The user’s router anonymized the user’s identity and IP address before uploading data to our servers, scrambling the lower 8 bits of IPv4 addresses and the lower /64 of IPv6 with CryptoPAN (Xu02b, 57). We we also transmit data from the user’s router to our server securely with TLS, and store the data with access limited to the authors.
Appendix B MSTL Results
Figure 13 and Figure 14 show the MSTL of daily IPv6 traffic fractions at Residence B and Residence C over the full observation period. Discussion of these results is in § 3.3.
| Cloud | # of Domains | # IPv4-only | # IPv6-full | # IPv6-only | |||
| Count | (%) | Count | (%) | Count | (%) | ||
| Overall | 272 964 | 153 786 | 56.3% | 114 465 | 41.9% | 4,713 | 1.7% |
| Cloudflare, Inc. | 59 106 | 8 743 | 14.8% | 50 355 | 85.2% | 8 | 0.0% |
| Amazon.com, Inc. | 57 856 | 42 885 | 74.1% | 14 254 | 24.6% | 717 | 1.2% |
| Google LLC | 40 735 | 13 138 | 32.3% | 27 584 | 67.7% | 13 | 0.0% |
| Akamai International B.V. | 10 533 | 3 654 | 34.7% | 5 305 | 50.4% | 1 574 | 14.9% |
| Fastly, Inc. | 7 739 | 5 072 | 65.5% | 2 655 | 34.3% | 12 | 0.2% |
| Microsoft Corporation | 5 480 | 3 300 | 60.2% | 2 177 | 39.7% | 3 | 0.1% |
| Akamai Technologies, Inc. | 5 416 | 5 211 | 96.2% | 184 | 3.4% | 21 | 0.4% |
| Cloudflare London, LLC | 3 474 | 2 899 | 83.4% | 575 | 16.6% | 0 | 0.0% |
| Hetzner Online GmbH | 3 303 | 2 715 | 82.2% | 576 | 17.4% | 12 | 0.4% |
| OVH SAS | 3 134 | 2 714 | 86.6% | 408 | 13.0% | 12 | 0.4% |
| Hangzhou Alibaba […] | 3 003 | 2 388 | 79.5% | 608 | 20.2% | 7 | 0.2% |
| Datacamp Limited | 2 885 | 1 742 | 60.4% | 1 142 | 39.6% | 1 | 0.0% |
| DigitalOcean, LLC | 1 899 | 1 718 | 90.5% | 175 | 9.2% | 6 | 0.3% |
| Incapsula Inc | 1 363 | 1 313 | 96.3% | 48 | 3.5% | 2 | 0.1% |
| BUNNYWAY, […] | 1 316 | 6 | 0.5% | 0 | 0.0% | 1 310 | 99.5% |