Measurement of photo- and radio-luminescence of thin ThF4 films
Abstract
We conducted measurements on the photo- and radio-luminescence of thin ThF4 films in both the UV and visible ranges. In the UV range, we found that both luminescences are at a similar level as the internal dark counting noise of the photo-multiplier-tube (PMT). Our results suggest that thin ThF4 crystals could be used as a target for the search for 229mTh and as a medium for the future nuclear clock. The measurements indicate that using a small and thin ThF4 film can reduce background noise while maintaining the signal at the same level, achieved by increasing the 229Th enrichment. Our developed apparatus is now ready for direct measurements of 229mTh excitation and decay in ThF4.
keywords:
Th-229 , photo-luminescence , radio-luminescence , nuclear clock1 Introduction
229mTh is the lowest known nuclear isomeric state. Its energy of 8.3 eV [1] is accessible with the currently available highly monochromatic lasers, opening the way to several practical applications. In particular, it enables the realization of a so-called nuclear clock [2, 3]. However, in order for the precision of a nuclear clock to surpass that of existing atomic optical clocks, Internal Conversion (IC), which is the dominant 229mTh decay channel [4, 5], must be suppressed. The suppression of IC decay was predicted in Refs. [6, 7] and recently was observed in ionized 229Th atoms [8] as well as in 229Th dispersed in solid matrices with a large bandgap [9, 10]. Crystals used to search for 229mTh in a solid matrix include CaF2[9], MgF2[10], and LiSrAlF6[11]. The crystals were all grown to sizes greater than 1 mm3, which increased the background radio-luminescence due to their large active volume that could fully absorb the -particles of the 229Th decay [9]. While the successful observation of 229mTh has been accomplished in these crystals, the efficiency of the detection process has not been determined. Furthermore, the refractive indices of the used crystals are very similar, which prevents precise testing of the theoretical -dependence of the signal [12]. We speculate that for the thin films with thickness smaller than the wavelength of emitted the 229mTh lifetime could depend on the film thickness.
In our current study, we are analyzing the photo-luminescence and radio-luminescence of ThF4 thin films. ThF4 is a material that is considered an excellent candidate as a working matrix for a 229mTh nuclear clock. This material naturally contains thorium, which helps avoid band distortions and lattice defects when doped with 229Th. Additionally, ThF4 is an insulator with a bandgap of 10.2(2) eV [13], wide enough to suppress 229mTh IC decay. ThF4 can be easily grown in the form of high-quality thin films and its refractive index at 150 nm is approximately 1.826 [14], which is significantly different from those of the other crystals tested so far (1.485 for LiSrAlF6, 1.488 for MgF2 and 1.586 for CaF2). Before searching for 229mTh excitation and -decay in ThF4, it is essential to characterize the major background sources, namely photo- and radio-luminescence.
In section 2, we will describe the experimental apparatus that we have designed and built, as well as the characteristics of the ThF4 thin layers. In section 3, we will explain the specific configuration for the photo-luminescence measurements and its simulations. The photo-luminescence data will be presented in section 4. A similar description will be provided for radio-luminescence measurements in sections 5 and 6. The interpretation of the obtained quantities compared to the expected 229mTh decay signal will be given in section 7, followed by the conclusions in section 8.
2 Experimental setup
2.1 VUV-photon source
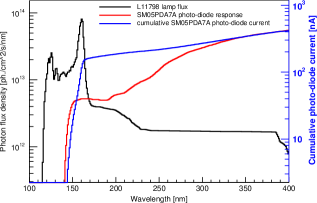
The experimental setup for photo-luminescence measurements is based on the vacuum ultraviolet (VUV) light source H2D2-lamp L11798 of Hamamatsu [15]. The lamp has a broad spectrum, peaked in the VUV range, shown in Fig. 3.
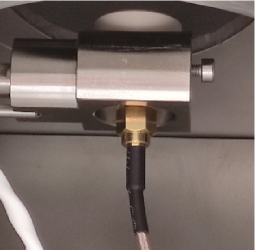
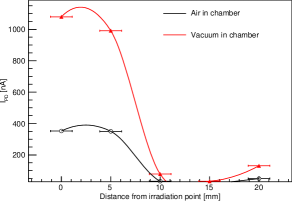
To normalize the known lamp emission spectrum [15], we performed a series of measurements using a VUV-sensitive photo-diode SM05PDA7A [16] installed in the location of the irradiated sample. Fig. 1 shows the picture of the experimental setup. Moving this diode along the translation stick axis from the central irradiation point, we measured the photon beam profile shown in Fig. 2. The photon beam spot had a full width at half maximum FWHM = 15 mm whilst the peak current of the photo-diode was 1080 nA under vacuum and 352 nA in air. Thus, in air, we observed only 33% of the light signal, due to absorption of the VUV part of the lamp emission spectrum.
The comparison of the lamp’s emission spectrum with the photo-diode sensitivity, as shown in Fig. 3, demonstrates that the primary contribution to the observed current comes from the peak around 161 nm (with a FWHM of 5 nm), where the photo-diode sensitivity is approximately 0.01 A/W. To estimate the total photon flux at the measured point, a simplified calculation was used with the following equation:
| (1) |
where is the measured photo-diode current, is the differential photon flux, is the wavelength dependent photo-diode response, is the photo-diode effective area, and is the photon energy. The photo-diode active region had a 2.2 mm side, thus cm2. In the region around 161 nm nA/nW, eV=12.3 nJ/ph and nm. Combining all these numbers we estimate the photon flux in the main peak ). Fig. 3 shows the results of a more careful assessment based on a bin-by-bin convolution. In this analysis, we have normalized the datasheet emission spectrum of the lamp to the observed photo-diode current. The fraction of the photo-diode current above 200 nm (air absorption) was estimated to be 55%, which is significantly higher than the observed 33%.
2.2 Readout electronics and DAQ
The PMT anode produces very fast direct signals. For instance, for R6835 we have measured signals with 3 ns rise and fall times [17]. This implies that a fast readout requires about 500 MHz analogue bandwidth. However, the expected signal is due to single photo-electrons, which generate roughly 0.1 pC (R6835 at 2500 V) charge on the PMT anode, translating to 2 mV peaks in a 50 Ohm load. The fast electronics generate competing noise in the order of a few mV/GHz, and there is significant electromagnetic interference (EMI) in this frequency domain. This makes it challenging to trigger signals below the single photo-electron amplitude and to differentiate them from signals generated by a few photo-electrons. Additionally, our measurements do not have fast coincidences, which could help improve noise rejection in a fast readout scheme. Consequently, we have opted to use the slow (1 MHz) charge-sensitive readout scheme. Reducing the bandwidth by three orders of magnitude enables much higher resolution and better noise rejection. In this scheme, EMI noise is not expected to be significant, thereby minimizing unwanted and uncontrollable electronic noise. This scheme is based on the charge-sensitive preamplifier Ortec-113 [18], connected to the PMT anode and the DT5730 digitizer featuring the DPP-PHA firmware [19].
The Ortec-113 is a parasitic capacitance preamplifier with about 45 pF internal capacitance. The rise and fall times of its signal are less than 20 ns and 50 s, respectively. With an integral non-linearity smaller than 0.02%, a temperature coefficient of 0.01%/∘C in the range 0 to 50 ∘C, and a noise of 0.1 mV RMS at the output, the Ortec-113 enables very stable measurements of low-rate, small-amplitude events. The signals from the preamplifier were acquired by the CAEN DT5730 digitizer [20], recording pulse heights for each event reconstructed by the trapezoidal filter of the DPP-PHA firmware [19]. For these measurements, we utilized the standard CAEN COMPASS Data Acquisition System (DAQ) [21]. To optimize the signal-to-noise ratio and charge resolution, we used the following configurations of COMPASS/DT5730:
-
1.
coarse gain 4,
-
2.
risetime 16 ns, corresponding to the observed Ortec 113 output signals,
-
3.
trigger threshold 5 lsb,
-
4.
fast discriminator smoothing 128 samples,
-
5.
trigger holdoff 8.2 s,
-
6.
trapezoid risetime of 5 s,
-
7.
trapezoid top of 1 s,
-
8.
averaged peak samples 64,
-
9.
peak holdoff 8 s.
The digitized signal PH in ADC channels can be used to estimate the absolute charge collected on the PMT anode by multiplying it by (0.5 V/16384 ch)445 pF=5.510-3 pC/ch, where the factor 4 comes from the Ortec 113 output and the digitizer input impedance matchings to 50 Ohm.
2.3 ThF4 samples
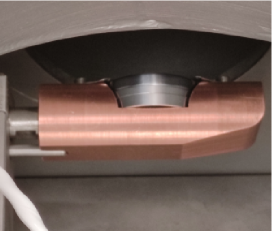
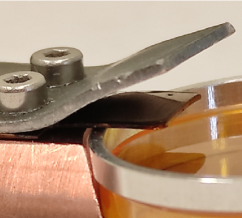
We have tested two commercial samples of optical elements featuring an amorphous ThF4 film at their outermost layer. The elements, shown in Fig. 4, are produced by II-VI GmbH [22].
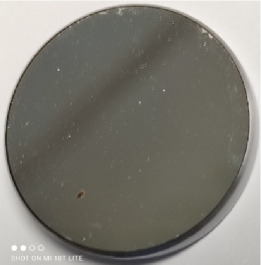
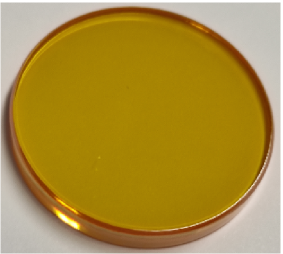
The first sample is a 3.05 mm thick silicon mirror of 1-inch diameter and a plane surface. One side of the mirror is opaque, while the other side is a so-called total reflector (see Fig. 4, left) with an outermost 300-nm-thick layer made of amorphous ThF4, which has high reflectivity at 10.6 m.There are additional coating layers between the external ThF4 layer and the silicon substrate, but for our purposes, we assume that their contribution to the radio- and photo-luminescence of the sample is negligible.
The second sample is a 3.05 mm thick ZnSe lens of 1-inch diameter. The ZnSe substrate is semi-transparent and has a yellow colour. One side of the lens acts as a partial reflector with an outermost polarization converter (PS) layer featuring high reflectivity at 10.6 m. This PS layer is made of amorphous ThF4 and has a thickness of 200 nm. Beneath the external ThF4 layer and above the ZnSe substrate, there are additional coating layers, although they are not specified. Upon visual inspection, there is no discernible difference between the two sides of this sample.
3 Photo-luminescence setup and Monte Carlo simulations
The experimental setup for measuring photo-luminescence involves a VUV light source (described in section 2.1) and a detection system. The sample is first placed in the irradiation station where it is exposed to VUV light for approximately 5 minutes. After the exposure, the lamp is switched off and the sample is moved to the measurement station. The detection system comprises a solar-blind, VUV-sensitive, Hamamatsu PMT R6835 and a veto Hamamatsu R1450 PMT, which is sensitive to visible light (see Fig. 5). The photo-luminescence induced by the VUV light during the irradiation is then measured for about 10 minutes. These measurements are repeated multiple times with different samples to minimize statistical uncertainties and eliminate various backgrounds.
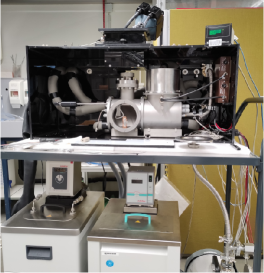
The stations for irradiation and measurement are kept under vacuum with a residual pressure of less than 510-4 mbar to prevent the absorption of VUV photons in air and minimize background luminescence from the atmospheric gas mixture. The vacuum is maintained continuously using a root pump and monitored by a pressure sensor. The macroscopic absorption cross-section of VUV light in O2 or air is about 500 1/cm [23] under normal temperature and pressure conditions. Since the distance between the sample and the PMT is approximately 2 cm, at the residual pressure we anticipate a residual absorption of less than 0.05%. Fig. 6 shows a photo of the apparatus.
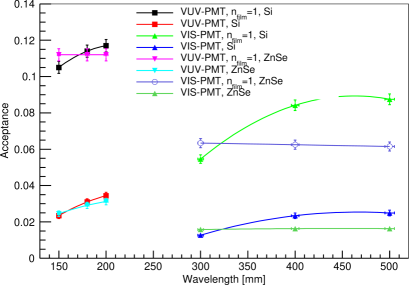
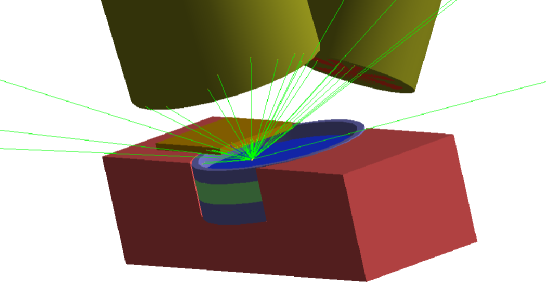
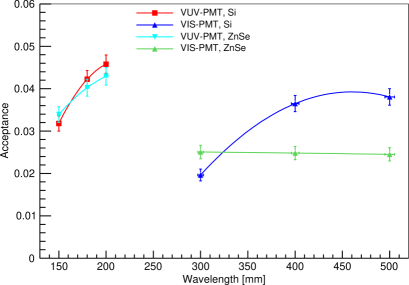
We used Monte Carlo simulations with the Geant4.11.2 library to estimate the acceptance of the two PMTs. The simulations considered the geometry and material properties of the sample holder, the sample, and the two PMTs. Photo-luminescence photons were generated uniformly and isotropically within the ThF4 film. We then calculated the fraction of photons reaching each PMT photocathode area to estimate the acceptance. Fig. 7 displays the results for both PMTs. Since the apparatus lacks spectroscopic capabilities, we conducted acceptance simulations for a few wavelengths within the sensitivity range of each PMT. Additionally, to assess the effect of Total Internal Reflection (TIR) in the ThF4 sample, we also provided results with . TIR significantly reduced the acceptance, from approximately 11% to 3% for the VUV PMT, and from about 7% to 2% for the visible PMT. This reduction can be partially mitigated in thin films due to frustrated TIR, which allows about 50% transmission at 1/3 of the wavelength. Therefore, for a 50-nm-thick ThF4 film, we expected an acceptance of about 7%.
The acceptance for ThF4 on Si substrate slightly increased with wavelength due to a rise in silver-based mirror reflectivity. The ZnSe-based sample displayed almost constant acceptance distributions.
The measured luminescence spectra can be divided into two main wavelength ranges: 120 to 200 nm for the VUV PMT and 300 to 650 nm for the visible PMT. In the VUV range, the main contribution to the counting is likely from photons around 180 nm, where the quantum efficiency (QE) of the VUV PMT is about 1%. For the visible PMT, the most likely wavelength is around 420 nm, which corresponds to the maximum QE point of about 25%.
4 Photo-luminescence measurements
To measure photo-luminescence, we mounted the samples (one at a time) on the movable samples holder as shown in Fig. 8. A vacuum of mbar was created and maintained during irradiation and measurements using a root pump. We performed many successive measurements by irradiating the sample with the VUV lamp for 5 minutes (some runs were recorded after 15 minutes of irradiation) and moved the sample to the measurement station after turning off the lamp. At the measurement station, data acquisition started about 10 seconds after the VUV lamp shutdown.
4.1 UV photo-luminescence measurements
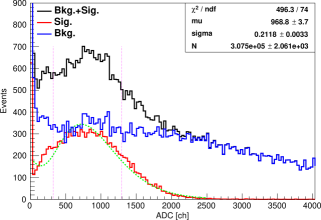
The expected signal rate is very low and is of a similar magnitude as the background. To make better use of the available experimental data, the definition of the signal was adjusted to enhance the signal-to-background ratio. To achieve this, the Pulse Height Distributions (PHDs) of the charge collected on the PMT anode were calibrated using the VUV lamp with the inter-chamber shutter lid slightly open. Fig. 9 shows the obtained PHD compared to the intrinsic background spectrum acquired with the sample removed. By comparing the two, we were able to determine the best selected ADC interval from 1/3 to 4/3 of the Single Photo-Electron (SPE) amplitude, while still preserving 69% of the signal statistics. This selection was applied to all the data discussed below and referred to as the SPE rate. A similar procedure was carried out for the visible PMT data.
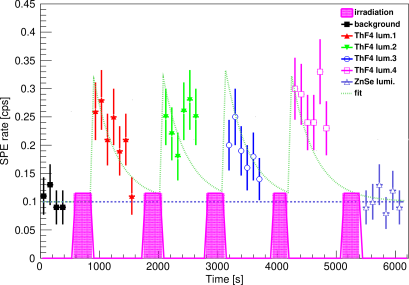
During the night before the photo-luminescence measurements, the UV-PMT background was 0.1 Hz. The background measurement was repeated just before the irradiation of the sample, as shown in the time evolution of the UV-PMT SPE rate reported in Fig 10. The sequence of ThF4+ZnSe sample irradiations and photo-luminescence decay measurements roughly follows the pattern indicated by the fitted curve. The UV photo-luminescence starts at about 0.23 cps and decays with a lifetime of roughly 400 s. The last measurement in Fig 10 represents the photo-luminescence of the ZnSe side of the target, with the sample flipped upside-down. This observed rate aligns with the previously measured background, indicating that ZnSe is opaque to UV light and does not produce significant contamination in UV photo-luminescence.
The low event rate affects the statistical precision of the data, resulting in relatively uncertain estimates for both the photo-luminescence amplitude and the lifetime. This uncertainty allows for the neglect of systematic uncertainties related to the stability of background yield. The difference between different runs is estimated to be of the same magnitude as the statistical uncertainties.
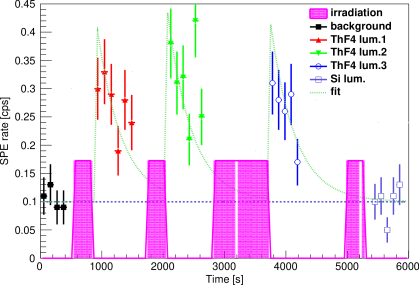
The irradiated ThF4+Si sample showed an expectedly higher UV photo-luminescence, peaked at about 0.35 Hz, as shown in Fig 11. This outcome was anticipated due to the increased thickness of ThF4 on the Si substrate, which changed from 200 nm to 300 nm. This change implied an enhancement of 3/2, which was effectively observed. These data are also compatible with a UV photo-luminescence lifetime of 400 s. In the last measurement of the ThF4 side, the irradiation time was extended from 5 to 15 minutes. However, the observed UV photo-luminescence remained consistent with previous measurements. This suggests that the rate of UV photo-luminescence is not influenced by the duration of irradiation, indicating that the excitation of fluorescent levels reaches saturation in a time frame shorter than the chosen 5 min.
Summarizing, in the UV range, we observed a photo-luminescence of 0.23 Hz/0.69 from a 200 nm thick ThF4 film, which decayed in about 400 s. The ThF4 film had a surface area of 4.84 cm2 whilst the UV PMT acceptance was about 0.03. Therefore, the estimated total UV photo-luminescence yield is 11 photons/s/PMT quantum efficiency, which varies from 0.1 to 0.001 in the range from 150 to 190 nm.
4.2 Visible photo-luminescence measurements
The measurements of photo-luminescence in the visible range were performed at the same time as the UV measurements. The visible-range PMT had a similar acceptance, but much higher quantum efficiency in its sensitivity interval. Moreover, the ZnSe sample is transparent to visible light, which creates a background source.
The analysis followed the same method applied to the UV photo-luminescence data. For the visible PMT,, the observed background SPE rate was approximately 2 Hz, which is negligible compared to the observed photo-luminescence shown in Fig. 12. The ThF4+ZnSe sample, irradiated for 5 minutes, exhibited a peak photo-luminescence of about 1.4 kHz. The time distribution of the photo-luminescence cannot be precisely described by a single exponential. However, a basic fit to the data gives a visible photo-luminescence lifetime of about 400 s, consistent with UV range measurements. Data obtained after ZnSe irradiation (ThF4 not exposed to the UV lamp and PMT) showed approximately 30% contribution of substrate photo-luminescence in the main observable.
The irradiated ThF4+Si sample showed a similar visible photo-luminescence of about 1 kHz and a similar lifetime. However, due to some contamination, a continuous luminescence build-up was observed independently from the target material and we excluded these data from the analysis.
Summarizing, we have observed a 1.4 kHz0.70/0.70 photo-luminescence in the visible range from a 200 nm thick ThF4 film, decaying in about 400 s. The ThF4 film had a surface area of 4.84 cm2 whilst the visible PMT acceptance was about 0.015. Therefore, the total visible photo-luminescence yield can be estimated as 4.7105 photons/s.
5 Radio-luminescence setup and Monte Carlo simulations
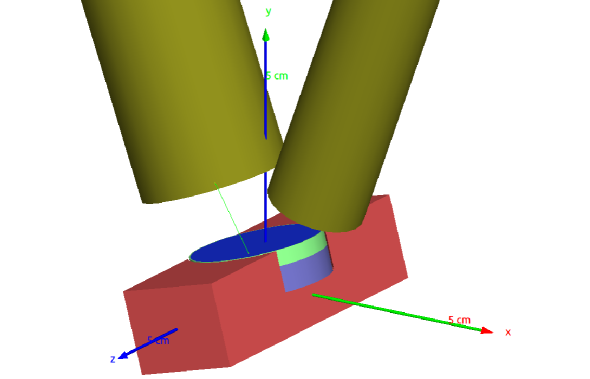
The experimental setup for the radio-luminescence measurements uses of a 241Am -source and the detection system described in section 3. The 241Am -source was positioned 2 mm above the sample, as shown in Fig. 13. The active surface of the source faced downwards, in the opposite direction of the PMTs, to prevent direct -particle hits. Additionally, a 1 mm-thick lead sheet covered the source substrate to absorb 60 keV gamma and other X-rays traveling towards the PMTs. The sample was initially placed in the irradiation station to begin background data acquisition. Subsequently, the sample was moved to the measurement station. The geometry was designed such that the PMTs only detected the secondary emission from the sample, enabling measurement of the radio-luminescence induced by the source over a period of approximately 10 minutes. These measurements were repeated multiple times to minimize statistical uncertainties and were conducted using different samples to eliminate various backgrounds.
We conducted Monte Carlo simulations using the Geant4.11.2 [24] library, as outlined in section 3. The simulations involved adding an -source and its shielding, as well as the ThF4 scintillation as an additional light production mechanism. The particles were uniformly and isotropically generated on the active surface of the 2 mm diameter source substrate. We found that a 0.264 fraction of particles reached the ThF4 film. Since the light yield and spectrum of ThF4 scintillation were unknown, we used scintillation parameters adapted to the measurement results. Given that the particle energy was fixed at about 5.5 MeV and the mean energy loss in ThF4 layers was 84 and 126 keV for 200 and 300 nm films, light quenching was excluded and we used absolute light yields separately for the VUV and visible ranges.
We calculated the percentage of scintillation photons that reach the PMT photocathode area to estimate the acceptance. Figure 15 shows the results for each PMT.
Because the equipment cannot perform spectroscopic analysis, we conducted acceptance simulations for several wavelengths within the sensitivity range of each PMT. The acceptance for ThF4 on Si substrate slightly increases with wavelength due to the rising reflectivity of the silver-based mirror. The ZnSe-based sample exhibits an almost constant acceptance distribution.
To simulate scintillation, common parameters of scintillator materials were chosen, namely 0.5 photons/keV with Birks coefficient set to zero and scintillation decay time set to 1 ns.
6 Radio-luminescence measurements
Measurements were taken at room temperature, with a chamber pressure of 510-4 mbar, using a specially prepared 241Am source of approximately 1.4 kBq activity (+-10% uncertainty). The source was positioned about 2 mm above the commercial sample and was covered by a 1 mm thick lead sheet, which was 2 mm wider on each side, to shield the PMTs from the direct background of 60 keV rays. The entire setup, including the source and shielding, covered nearly half of the sample, as shown in Fig. 13.
6.1 UV radio-luminescence
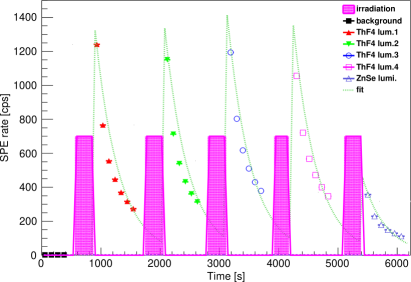
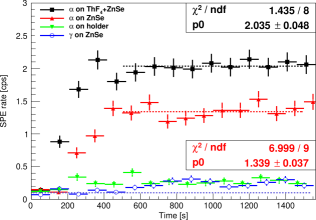
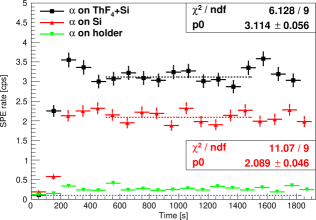
In the UV range, all signal rates are relatively low but emerge above the background of 0.1 Hz, as shown in Fig. 16. To monitor the PMT intrinsic background, all measurements started with the sample retracted into the irradiation station. After about 200 s (700 s for the -background measurement), the sample was transferred into the measurement station. This explains the rapid rise of the radio-luminescence rates at the beginning of the measurements. The steady-state radio-luminescence was obtained by averaging the rates starting from 500 s after the beginning of the run. Since the 5 MeV -particle crosses the 200-300 nm film, the radio-luminescence rate was estimated from the difference of measurements on opposite sides of the sample. In particular, for the 200 nm-tick ThF4 deposited on ZnSe, the ThF4 radio-luminescence was obtained from the difference: 2.04-1.34=0.700.06 Hz. Instead, for the 300 nm-thick ThF4 deposited on Si, the same difference yields: 3.11-2.09=1.030.07 Hz. The results are consistent with each other: the Si-mirror contains 1.5 times more ThF4, thus the observed UV-ratio Si/ZnSe, 1.03/0.70=1.460.16, is in perfect agreement with the ratio of thicknesses. Also in this case, the statistical uncertainties of about 7-8% are dominant, allowing for the neglect of systematic uncertainties caused by the intrinsic instability of the background rate.
The 241Am source also emits -rays, with a 35.9% branching fraction for the 60 keV emission. ZnSe is a good scintillator, so the impact of 60 keV rays on ZnSe will produce scintillation light. To measure this effect, we wrapped the 241Am source into a 100 m thick Aluminium foil. The foil absorbed all the particles emitted by the source, while the rays were unaffected. This contribution is shown by the blue circles in Fig. 16. Since ZnSe blocks UV light but allows rays to penetrate and interact within the material, we did not observe a significant contribution from the rays on ZnSe in UV radio-luminescence.
The measured radio-luminescence event rates must be normalized to the known 241Am alpha source activity (1.4 kBq), accounting for the probability for an -particle to reach the ThF4 layer (0.264), as given in section 5. Therefore, the observed (1.030.07 Hz)/0.69 of UV radio-luminescence must be divided by 370 Hz -particle impacts on the 300 nm ThF4 film. This provides an estimate of the UV light detection probability per each -particle interaction of about 0.00400.0003. The deduced probability represents the convolution of the PMT acceptance (0.02-0.04), PMT quantum efficiency, and ThF4 scintillation spectrum. Thus, one can estimate the ThF4 UV light yield as follows:
| (2) |
where is the UV PMT quantum efficiency and the acceptance of the UV PMT. For example, if we assume that the main contribution to the UV PMT counting comes from =180 nm photons, where of the PMT is still about 1%, we obtain a ThF4 light yield of about 0.09 photons/keV. In the case of =200 nm photons, the light yield could be as large as 15 photons/keV.
Given the small magnitude of the detection probability, the detection of double photons from the same alpha scintillation is unlikely. This was confirmed by the observation of the measured collected charge spectrum in the PMT, where the mean number of photo-electrons could not exceed a few per cent.
6.2 Visible radio-luminescence measurements
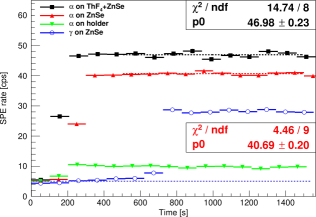
In the visible range, the signal rates are higher than in the UV, especially for the ZnSe sample, and significantly exceed the background of 5 Hz, as one can see in Fig. 17. However, in the case of substrate radio-luminescence dominance (ZnSe), the optical transmission through the ThF4 film must be considered. For the complex coupling ZnSeThF4Air, the Fresnel transmittance of the light emitted at small angles to the sample normal is 1.13 times larger than the transmittance of the direct coupling ZnSeAir. Thus, the signal from ThF4 on ZnSe was obtained from the difference of measurements on different sample sides, correcting for the Fresnel transmittance ratio: 47.0-40.7*1.13=1.00.3 Hz. It is also worth noting that ZnSe is a good scintillator in the visible range, but opaque in UV. This is because the radio-luminescence from ZnSe alone dominates the measurements by almost an order of magnitude.
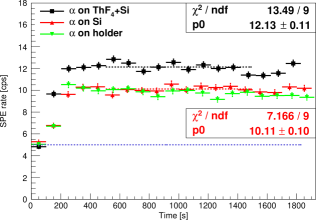
In the case of 300 nm of ThF4 on Si substrate, the same difference (not requiring Fresnel correction since the Si substrate is opaque) yields 12.1-10.1=2.00.15 Hz. In this case, the measurements performed on the Si substrate and sample holder alone agree, within statistical uncertainties. This suggests that the Si substrate does not emit visible light and the main background comes from the interaction in the PMT or supporting materials. The latter background is the same for the two samples and accounts for about 12 Hz.
The results are again compatible with each other, as the Si-mirror has 1.5 times more ThF4, thus the observed visible-ratio Si/ZnSe equals to 2.0/1.0=2.00.6 and agrees with the ratio of thicknesses within the uncertainties.
The observed 2 Hz of visible radio-luminescence from 370 Hz alpha particle impacts on ThF4 film provides an estimate of 0.008 for the visible light detection probability per each -particle interaction. In this case, the wavelength dependence of the acceptance is relatively flat. Thus, it is safe to assume that the dominant contribution to visible PMT counting comes from 400 nm photons, where the QE of the PMT has the main peak. Therefore, in the visible range, according to Eq. 2, the light yield of ThF4 is approximately 0.007 photons/keV.
7 Projection on signal rate expectations
To enable a qualitative evaluation of the experiment, the results described above must be compared to the expected signal. Such a comparison will allow us to verify if the obtained background rejection is sufficient to identify the 229mTh decays. Therefore, we report here an estimate of the signal rate based on the available knowledge of 229mTh.
Resonant cross sections are generally described by the (non-relativistic) Breit-Wigner formula [25]:
| (3) |
where is the center of mass energy, is the spin of the resonance, and the number of polarization states of the two incident particles are and . The center of mass momentum in the initial state is k, is the center of mass energy at the resonance, and is the full width at half the maximum height of the resonance. The branching fraction for the resonance into the initial-state channel is and into the final-state channel is .
For a narrow resonance (with being the energy resolution of the measurement), the peak can be approximated by a -function. Moreover, in the case of the resonant photo-absorption, we have , (here we use the system of units ). Finally, assuming that the IC decay branching is completely suppressed in ThF4 (, ) and defining we can rewrite the cross section as following:
| (4) |
To obtain an estimate of the 229mTh excitation rate, the cross-section has to be convoluted with the incident photon flux. The absolute photon source flux of our VUV-lamp in the region of the 229mTh resonance is shown in Fig. 18.
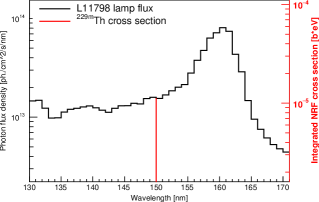
In the narrow width of the 229mTh resonance, the photon flux can be considered constant at about 1.6 1013 ph/(cm2 s nm). The Doppler broadening of the natural 229mTh linewidth does not violate this assumption. Therefore, the rate of 229mTh excitation events can be estimated as follows:
| (5) |
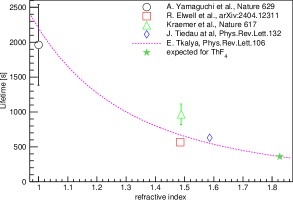
where is the surface density of 229Th atoms. For the reaction we have: , nm [1], and assuming 1 kBq of 229Th activity in 1 cm2 film we get 229Th atoms/cm2. The resonance decay width depends on the medium refractive index . The theoretical prediction was given by eV [26]. This can be compared to the existing data on 229mTh lifetimes in various media:
| (6) |
The data shown in Fig. 19 demonstrates good agreement with theoretical expectations. Moreover, the ThF4 refractive index at 150 nm is significantly higher than all the measured values [14] and may allow us to verify the theoretical n-dependence with better precision.
Combining all these numbers we obtain the estimate of the excitation rate:
| (7) |
Using the known photon flux of our VUV-lamp and the ThF4 refractive index [14], we can estimate a 229mTh production rate of about 1.1 Hz. As the production rate is much faster than the decay rate, the accumulated number of 229mTh isomers after irradiation time is given by:
| (8) |
Hence, the number of signal events which can be measured within the time after the irradiation can be written as follows:
| (9) |
The optimal decay time, which maximizes the ratio of the signal to statistical fluctuations of uncorrelated background, is equal to , where is the 229mTh lifetime. The irradiation time has no optimal value, but we propose to use yielding 86% of saturated activity. Combining these numbers, we can estimate the number of signal events to approximately 217. This value has to be compared to backgrounds due to PMT dark counts, photo- and radio-luminescence. In the comparison, we have to include a PMT quantum efficiency of about 10%. The PMT acceptance can be estimated from geometrical considerations: the R6835 PMT has an effective diameter of 23 mm, and it is located at 11 mm above the sample, resulting in a maximum angle of 45 degrees. The solid angle fraction, therefore, can be estimated as:
| (10) |
However, the angular distribution of the M1 transition is not constant:
| (11) |
enhancing the photon emission in forward and backward directions. The effect of the angular distribution can be estimated by an analytic integral:
| (12) |
Thus, the photon angular distribution of the M1 transition increases the acceptance of our measurement to 72%. These values can be reduced by the total internal reflection inside ThF4, but the choice of a small enough film thickness should allow recovering a large part of this loss.
Although photo- and radio-luminescences have similar acceptance and efficiency, depending on the number of emitted photons in the VUV range these corrections could be smaller than those required for the signal from 229mTh decay.
Summarizing, at the VUV PMT we expect signal events measured in 360 s, with an average rate of 0.017 Hz and the peak rate of 0.026 Hz. Therefore, the VUV photo-luminescence of the ThF4 background rate should be smaller than this value or the decay time significantly shorter. Instead, for continuous processes (independent from the VUV-light source), like radio-luminescence and PMT dark counting, the variances of both these backgrounds in 360 s should be smaller than 6 events. This means that the event rate of both these backgrounds should be less than 0.1 Hz. The latter condition can be loosened by performing a long series of repetitive measurements. However, in this case, the stability of background rates should be smaller than 0.1 Hz.
8 Conclusions
In this article, we present the first measurements of photo- and radio-luminescence of ThF4 thin films. The observed photo-luminescence is low in the UV range and not very high in the visible range. Similarly, the observed radio-luminescence is also low in both measured ranges.
These measurements have implications for the potential use of ThF4 thin films enriched with 229Th to detect 229mTh decay:
-
1.
the observed UV photo-luminescence of the tested ThF4 films is 8.7 times larger than the expected signal from 229mTh estimated in section 7.
However, this level of photo-luminescence was observed with a ThF4 sample that had an area of 4.84 cm2 and a thickness of 200 nm. A smaller sample will produce a proportionally smaller amount of photo-luminescence. Specifically, a proposed ThF4 film with an area of 1 cm2 and a thickness of 50 nm is expected to produce 20 times less photo-luminescence. As a result, we anticipate that the UV photo-luminescence of the proposed ThF4 film will be lower than the 229mTh signal rate. The decay time of the observed photo-luminescence was approximately 400 s, similar to the anticipated 229mTh decay lifetime in ThF4. Therefore, a comparison with a similar sample containing only natural Th is mandatory. Furthermore, the photo-luminescence is dependent on the quality of the crystal, which can potentially be improved in comparison to that of the utilized commercial samples.
-
2.
The observed visible photo-luminescence is not very large and allows us to use it as a veto for high light-yield luminescence signals. The probability of accidental coincidences with the signal is negligible.
-
3.
the observed UV radio-luminescence of the tested ThF4 films is 0.7 Hz, which is 41 times larger than the signal expected from 229mTh, as estimated in section 7. This rate is continuous and can be calibrated with the precision given by the statistical deviation of the background. As described in section 7, the continuous background should have an overall rate of less than 0.1 Hz. However, the observed rate is larger and it refers again to the 200 nm thick sample. The probability of producing a UV photon is proportional to the thickness crossed by the -particle. Furthermore, the particles from the external source used here cross the entire ThF4 film, while intrinsic activity s, on average, will cross only half of it. Therefore, we can rescale the presented measurements to the internal activity of 1 kBq in 50 nm thick ThF4 and obtain 0.2 Hz of internal radio-luminescence background. This is still within an acceptable range for the present proposal, although it may require the measurements to be repeated many times to increase the statistical power.
-
4.
The observed visible radio-luminescence is not very large, which allows us to use it as a veto for high light yield scintillation signals. However, the efficiency of the coincidence veto in the observed radio-luminescence was fairly small.
In summary, the measured backgrounds to the future 229mTh decay experiment in the ThF4 are significant but do not exceed acceptable limits. The measurements indicate that the using of a small and thin ThF4 film allows for reduced backgrounds, while keeping the signal at the same level by increasing the 229Th enrichment.
Acknowledgements
The authors would like to acknowledge the excellent support provided during the experiment by the staff and technical services of JRC (Karlsruhe).
The experimental data used in this research were generated through access to the ActUsLab/PAMEC under the Framework of access to the Joint Research Centre Physical Research Infrastructures of the European Commission (GRaDeTh229 project, Research Infrastructure Access Agreement N°36345/04.
References
- [1] B. Seiferle, et al., Energy of the 229Th nuclear clock transition, Nature 573 (2019) 243.
- [2] E. Tkalya, et al., Processes of the nuclear isomer 229mTh(3/2+, 3.5 +- 1.0 eV) resonant excitation by optical photons, Phys. Scr. 53 (1996) 296.
- [3] E. Peik, C. Tamm, Nuclear laser spectroscopy of the 3.5 eV transition in Th-229, Europhys. Lett. 61 (2003) 181.
- [4] L. von der Wense, et al., Direct detection of the 229Th nuclear clock transition, Nature 533 (2016) 47.
- [5] B. Seiferle, et al., Lifetime Measurement of the 229Th Nuclear Isomer, Phys. Rev. Lett. 118 (2017) 042501.
- [6] E. Tkalya, Spontaneous Emission Probability for M1 Transition in a Dielectric Medium: 229mTh(3/2+, 3.5 +- 1.0 eV) Decay, JETP Lett. 71 (2000) 311.
- [7] E. Tkalya, Decay of the low-energy nuclear isomer 229mTh(3/2+, 3.5 +- 1.0 eV) in solids (dielectrics and metals) A new scheme of experimental research, Phys. Rev. C 61 (2000) 064308.
- [8] A. Yamaguchi, et al., Laser spectroscopy of triply charged 229Th isomer for a nuclear clock, Nature 629 (2024) 62.
- [9] J. Tiedau, et al., Laser excitation of the Th-229 nucleus, Phys. Rev. Lett. 132 (2024) 182501.
- [10] S. Kraemer, et al., Observation of the radiative decay of the 229Th nuclear clock isomer, Nature 617 (2023) 706.
-
[11]
R. Elwell, et al., Laser excitation of
the 229th nuclear isomeric transition in a solid-state host,
arXiv:2404.12311 (2024).
URL https://arxiv.org/abs/2404.12311 - [12] E. Tkalya, Proposal for a Nuclear Gamma-Ray Laser of Optical Range, Phys. Rev. Lett. 106 (2011) 162501.
- [13] T. Gouder, et al., Measurements of the band gap of ThF4 by electron spectroscopy techniques, Phys. Rev. Research 1 (2019) 033005.
- [14] W. Heitmann, E. Ritter, Production and properties of vacuum evaporated films of thorium fluoride, Appl. Opt. 7 (1968) 307.
-
[15]
Hamamatsu Photonics K. K.,
L11798
datasheets (2022).
URL https://www.hamamatsu.com/us/en/product/light-and-radiation-sources -
[16]
Thorlabs, Inc.,
SM05PDA7A
datasheets (2022).
URL "https://www.thorlabs.com/thorproduct.cfm?partnumber=SM05PD7A" -
[17]
Hamamatsu Photonics K. K.,
R6835
datasheets (2022).
URL https://www.hamamatsu.com/us/en/product/optical-sensors/pmt -
[18]
ORTEC.
Available online: (2022).
URL https://www.ortec-online.com/products/electronic-instruments/preamplifiers/113 -
[19]
CAEN SpA, firmware DPP-PHA.
Available online: (2022).
URL https://www.caen.it/products/dpp-pha/ -
[20]
CAEN SpA, Digitiser DT5730.
Available online: (2022).
URL https://www.caen.it/products/dt5730/ -
[21]
CAEN SpA, software COMPASS.
Available online: (2022).
URL https://www.caen.it/products/compass/ -
[22]
II-VI Incorporated,
Ir
optics series (2022).
URL https://ii-vi.com/wp-content/uploads/2020/03/IR-Optics-Series-web-n.pdf - [23] K. Watanabe, et al., Absorption coefficients of oxygen in the vacuum ultraviolet., J. Chem. Phys. 21 (1953) 1026.
- [24] S. Agostinelli, et al., Geant4—a simulation toolkit, Nucl. Instr. and Meth. 506 (2003) 250.
- [25] D. Groom, et al., Particle Data Group, Eur. Phys. Jour. C15 (2000) 1.
- [26] A. M. Dykhne, E. Tkalya, Matrix element of the anomalously low-energy (3.5±0.5 eV) transition in 229Th and the isomer lifetime., J. Exp. Theor. Phys. Lett. 67 (1998) 251.