%=11
JADES and BlackTHUNDER: rest-frame Balmer-line absorption and the local environment in a Little Red Dot at
Abstract
We present a broad-line active galactic nucleus (AGN) at , observed with both NIRSpec/MSA and NIRSpec/IFU by the JADES and \blackthundersurveys. The target exhibits all the hallmark features of a ‘Little Red Dot’ (LRD) AGN. The combination of spatially resolved and high-resolution spectroscopy offers deeper insight into its nature. The H line has multiple components, including two broad Gaussians, yielding a black-hole mass of , while the narrow [O iii]5007 gives a galaxy dynamical mass of , suggesting a dynamically overmassive black hole relative to the host galaxy. The target has two satellites, and is immersed in a 7-kpc wide pool of ionized gas. A spatially detached outflow is also tentatively detected. H shows strong absorption with high equivalent width (EW), ruling out a stellar origin, and with velocity and velocity dispersion of and . There is tentative evidence (2.6 ) of temporal variability in the EW of the H absorber over two rest-frame months. If confirmed, this would suggest a highly dynamic environment. Notably, while the H absorber is clearly visible and even dominant in the high-resolution G395H observations, it is not detected in the medium-resolution G395M data of the same epoch. This implies that the current incidence rate of absorbers in LRDs – and especially of rest-frame absorbers – may be severely underestimated, because most LRDs rely on lower-resolution spectroscopy. In this context, the high incidence rate of rest-frame absorbers in LRDs may indicate a configuration that is either intrinsically stationary, such as a rotating disc, or that exhibits time-averaged stability, such as an oscillatory ‘breathing mode’ accretion of cyclic expansion and contraction of the gas around the SMBH.
keywords:
galaxies: active – quasars: supermassive black holes – galaxies: Seyfert1 Introduction
In the standard CDM cosmology, a key yet poorly understood agent in shaping galaxies is feedback from accreting supermassive black holes (SMBHs), which manifests via episodes of Active Galactic Nuclei (AGNs). In the past few years, SMBH feedback has been invoked mainly to explain the low stellar-to-total mass fraction at dark-matter halo masses higher than (Moster et al., 2010; Behroozi et al., 2010). However, more recently, AGNs are being revisited as drivers in the low-mass range too. This paradigm shift stems from the convergence of new observational evidence (Greene & Ho, 2004; Greene et al., 2006; Schramm et al., 2013; Satyapal et al., 2014; Greene et al., 2020) and of recent theoretical progress (Silk, 2017; Koudmani et al., 2022).
Observationally, the pivot of this revolution in our view of AGNs has been the discovery of a large population of low-luminosity AGN () at redshifts , thanks to the superior sensitivity of \jwst. These objects are primarily identified via their broad permitted line emission, with no matching counterpart in the forbidden lines (Kocevski et al., 2023; Übler et al., 2023). In addition, a complementary population of narrow-line AGN is also thought to exist (Scholtz et al., 2025b), but these objects have received far less attention, because identifying these hidden AGNs is significantly more challenging than for their broad-line counterparts. Due to a series of unfavourable coincidences, the optical tracers of narrow-line AGNs used at and for more massive AGNs, (such as the BPT diagram; Baldwin et al., 1981) are inapplicable. In particular, low metallicity and lack of an extended low-ionization zone conspire to cluster both AGN and star-forming galaxies in the same region of the BPT diagram. As a result, these standard diagrams have been shown to fail to identify even secure AGN, such as AGN with broad permitted lines (e.g., Kocevski et al., 2023; Übler et al., 2023; Juodžbalis et al., 2025). Nevertheless, even the broad-line population alone presents new challenges to our view of AGN, with the discovery of their X-ray and radio weakness, relative to the expectations derived from more luminous AGN. This weakness could be due to high covering factors of neutral and/or ionized gas Juodžbalis et al., 2024a, hereafter: \al@juodzbalis+2024b; Rusakov et al., 2025, or super-Eddington accretion rates (Pacucci & Narayan, 2024; Lambrides et al., 2024). Modelling the spectral energy distribution (SED) of these AGN has led to conflicting claims of ‘over-massive’ SMBHs (relative to the host stellar mass \mstarand to local scaling relations; Maiolino et al., 2024; Harikane et al., 2023; Juodžbalis et al., 2024b), or of normal SMBH–\mstarscaling (Sun et al., 2025), of possibly extremely massive host galaxies (Wang et al., 2025, 2024), or even of no SMBHs at all (Baggen et al., 2024; Kokubo & Harikane, 2024). Part of this confusion may be due to the use of the same terminology for different sample selections, so a clarification of our subjective language choice may be helpful. Several low-luminosity, spectroscopically identified broad-line AGN appear red and compact in NIRCam imaging (‘Little Red Dots’, LRDs; Matthee et al., 2024). Many of these broad-line AGN have ‘v’-shaped SEDs Furtak et al., 2024; Wang et al., 2025, 2024; \al@juodzbalis+2024b, which has led to searching for similar objects in photometry (Greene et al., 2024; Kocevski et al., 2024). However, many of these photometrically-identified LRDs appear consistent with stellar-dominated SEDs (Williams et al., 2024; Pérez-González et al., 2024). Conversely, the overall fraction of spectroscopically identified broad-line AGN that displays the photometric properties of LRDs is fairly low ( per cent; Hainline et al., 2024). In light of the above, in this work we aim to study and discuss only broad-line AGN, with no bearing on photometrically identified samples.
Among low-luminosity, broad-line AGN, there is a high detection rate of Balmer-series absorption (Matthee et al., 2024), with velocities ranging from -340 to +50 \kms. The equivalent width (EW) of this absorption is generally too high to be explained by stellar atmospheric absorption (Matthee et al., 2024; Juodžbalis et al., 2024a; D’Eugenio et al., 2025a), implying the existence of dense absorbing gas clouds near the broad-line region Matthee et al., 2024; Wang et al., 2025; \al@juodzbalis+2024b. The high detection rate of these absorbing clouds provides essential information for deciphering the structure of this new population of AGN. In particular, a high covering factor could explain the X-ray weakness of these sources Wang et al., 2025; \al@juodzbalis+2024b. Moreover, the physical conditions, kinematics and chemical composition of these clouds may help us understand the balance between SMBH fuelling and outflows in this unexplored regime.
In this work, we present \jwst/NIRCam and NIRSpec observations of a broad-line AGN at with rest-frame Balmer-line absorption (Section 2). This galaxy was initially discovered by JADES (Eisenstein et al., 2023a) and then re-observed by \blackthunderone year later. We present a full analysis of the images and integrated spectroscopy (Section 3), and present the resulting physical properties in Section 4; among these, we identify a rest-frame H absorber, with tentative evidence of EW variation. In Section 5 we present the surrounding environment. We conclude with a discussion of our findings (Section 6) and with a brief summary (Section 7).
Throughout this work, we assume a flat CDM cosmology with \kms Mpc-1 and (Planck Collaboration et al., 2020), giving a physical scale of 6.37 kpc arcsec-1 at redshift (all physical scales are given as proper quantities). Stellar masses are total stellar mass formed, assuming a Chabrier (2003) initial mass function, integrated between 0.1 and 120 \Msun. All magnitudes are in the AB system (Oke & Gunn, 1983) and all EWs are in the rest frame, with negative EW corresponding to line emission.
2 Data
2.1 Target galaxy 159717
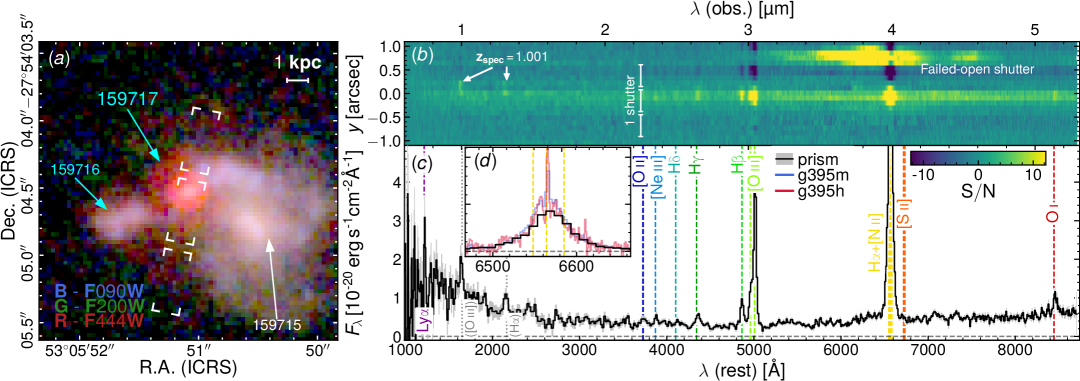
Galaxy JADES-GS+033223.41-275404.5 at (hereafter, 159717) is located in the GOODS-South cosmological deep field (Giavalisco et al., 2004). It was first reported as a -band drop-out, GSWV 2234354045, with a photometric redshift (Bouwens et al., 2015). It was selected for follow-up spectroscopy as part of the \jwstAdvanced Deep Extragalactic Survey (JADES; Bunker et al., 2020; Rieke, 2020; Eisenstein et al., 2023a), as a relatively bright NIRCam source (F444W mag) with photometric redshift Hainline et al., 2024; priority 7.5 in table 4 of D’Eugenio et al., 2025c. JADES spectroscopy identified this galaxy as a Ly emitter (Jones et al., 2024). Subsequently, the source was also targeted by \blackthunder(Section 2.3). As a result, this galaxy is one of few such systems with deep, multi-epoch \jwst/NIRSpec spectroscopy to date (in addition to Abell 2744-QSO1; Ji et al., 2025; Furtak et al., 2025).
2.2 JADES Data
We use \jwst/NIRCam imaging from JADES programme IDs PID 1180, 1210 and 1286, (Rieke et al., 2023; Eisenstein et al., 2023a) and from FRESCO (the First Reionization Epoch Spectroscopic COmplete Survey, PID 1895; Oesch et al., 2023), in combination with legacy \hst/ACS and WFC3 imaging from the Hubble Legacy Field data (Whitaker et al., 2019). The NIRCam data reduction from JADES has been presented in the public data release (DR) articles (Rieke et al., 2023; Eisenstein et al., 2023b; D’Eugenio et al., 2025c). We also use NIRSpec (Jakobsen et al., 2022) Micro-Shutter Assembly spectroscopy (MSA; Ferruit et al., 2022), obtained as part of PID 1286. These data were selected and observed in the ‘medium jwst gs’ tier of JADES (Eisenstein et al., 2023a). An RGB false-colour image of the target, with the MSA shutters overlaid is shown in Fig. 1, with a bright interloper in the foreground. The MSA observations consist of 8009 s with prism, G140M and G395H, and 9322 s with G235M and G395M. These integration times were split into two times three nodded exposures, using the NRSIRS2 readout mode (Rauscher et al., 2012, 2017). We used the nodded exposures to subtract the background, leading to possible foreground-source subtraction due to the contaminant. For the prism, we use only half the nodded pairs, to avoid subtracting the light from a ‘disobedient’ open shutter, which contains a bright feature (possibly PAH emission; visible in the top 0.5 arcsec of Fig. 1). Apart from this tailored setting, the data reduction process is the same as described in the JADES DR1 and DR3 articles (Bunker et al., 2024; D’Eugenio et al., 2025c). We used point-source path-loss corrections appropriate for an unresolved source. Due to the presence of multiple nearby sources, it is essential to separate physically associated systems from foreground and background systems. Where spectra are not available, we use photometric redshifts from eazy (Brammer et al., 2008), using photometry from JADES DR2 (Eisenstein et al., 2023b) and the methods outlined in Hainline et al. (2024). The JADES DR1 and DR3 NIRSpec data reduction has a 15 per cent systematic offset between the gratings and prism fluxes (Bunker et al., 2024; D’Eugenio et al., 2025c). Since the prism flux calibration is in agreement with NIRCam (Bunker et al., 2023), we downscale all the grating spectra from JADES by a factor of 0.85. This brings the H flux measured from the gratings in agreement with both the prism value and with the value from the \blackthunderG395H spectrum, which uses a more recent calibration (Section 2.3).
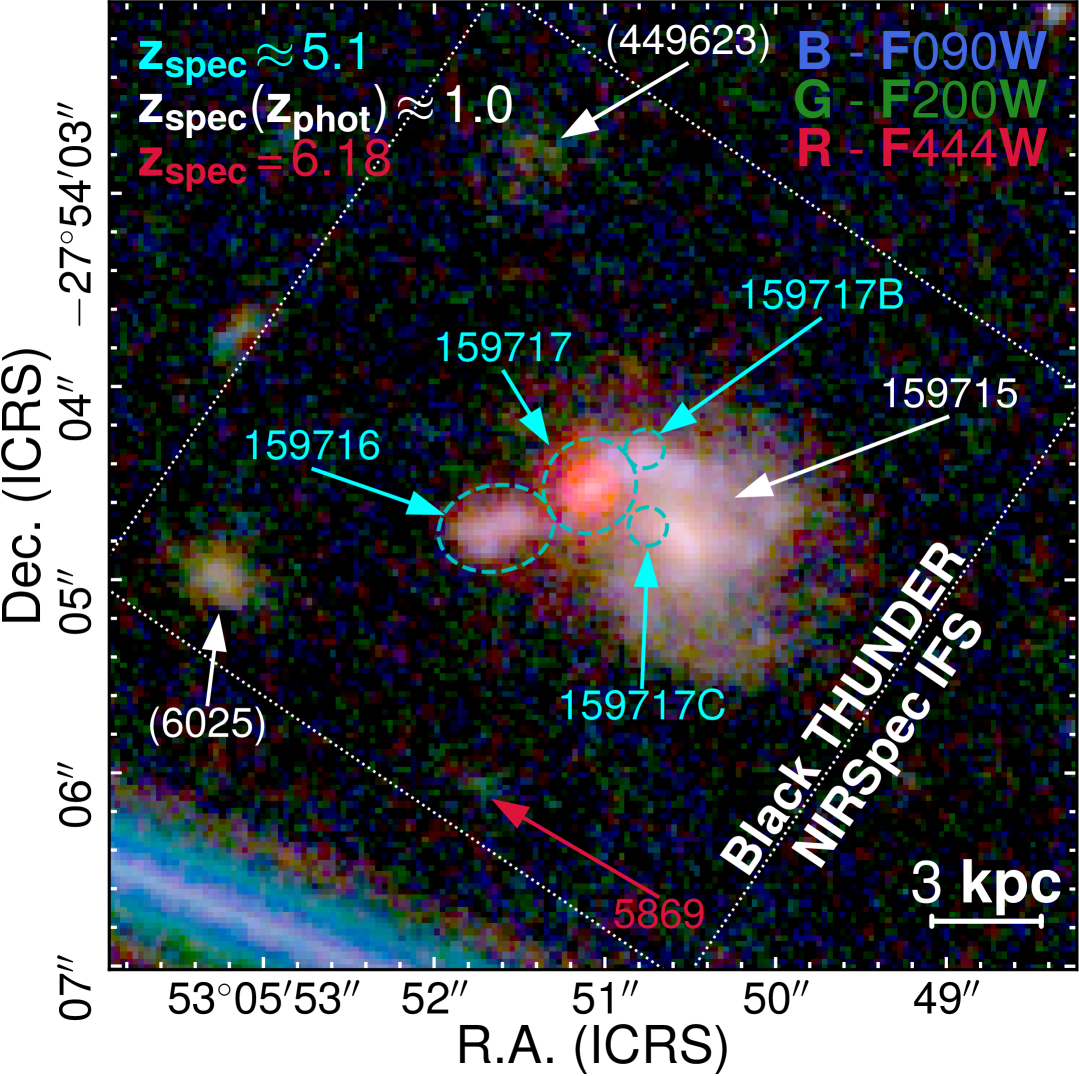
NIRCam shows a crowded field (Fig. 1), with a satellite JADES-GS+033223.44-275404.7 (hereafter: ID 159716) at photometric redshift (; Section 5.1), and behind the foreground spiral galaxy J033223.38-275404.6 (CANDELS ID GS-1826; JADES ID JADES-GS-159715; hereafter: 159715) at (; Appendix A). The presence of this interloper complicates significantly our analysis; most relevant to this work, we estimate that the additional foreground dust attenuation correction for the AGN is a secondary effect (Section 3.9) and there is no significant magnification from gravitational lensing (Appendix B).
The prism spectrum shows the characteristic ‘v’-shaped inflection of some LRDs, combining a blue UV slope with a red rest-frame optical continuum, with the inflection point near the Balmer limit (Setton et al., 2024). We lack MIRI coverage to explore if the SED of our target displays the rest-frame 1.6-\mumturnover typical of stellar-dominated spectra (Williams et al., 2024; Pérez-González et al., 2024).
The rest-UV spectrum shows tentative evidence of Ly emission (Jones et al., 2024, but see Appendix A), and a possible 2- or damped Ly absorption continuum. These features have been associated with AGN in the past Tacchella et al., 2025; Wu et al., 2024; Li et al., 2024, but see Cameron et al., 2024; Terp et al., 2024 for different interpretations. The rest-frame UV spectrum also shows evidence for two lines at and 1.36 \mum, present in both the prism and medium-resolution G140M data. The 1.05-\mumline is spectrally resolved into a doublet; these are therefore the [O iii]4959,5007 doublet and H from the northern spiral arm of 159715 at . At this redshift, and due to the low resolution of the prism, Ly could also correspond to [O ii]3726,3729 in the foreground. Similarly, a tentative line at 1.16 \mummatches very well both C iii]1909 in the AGN but also He i5875 at .
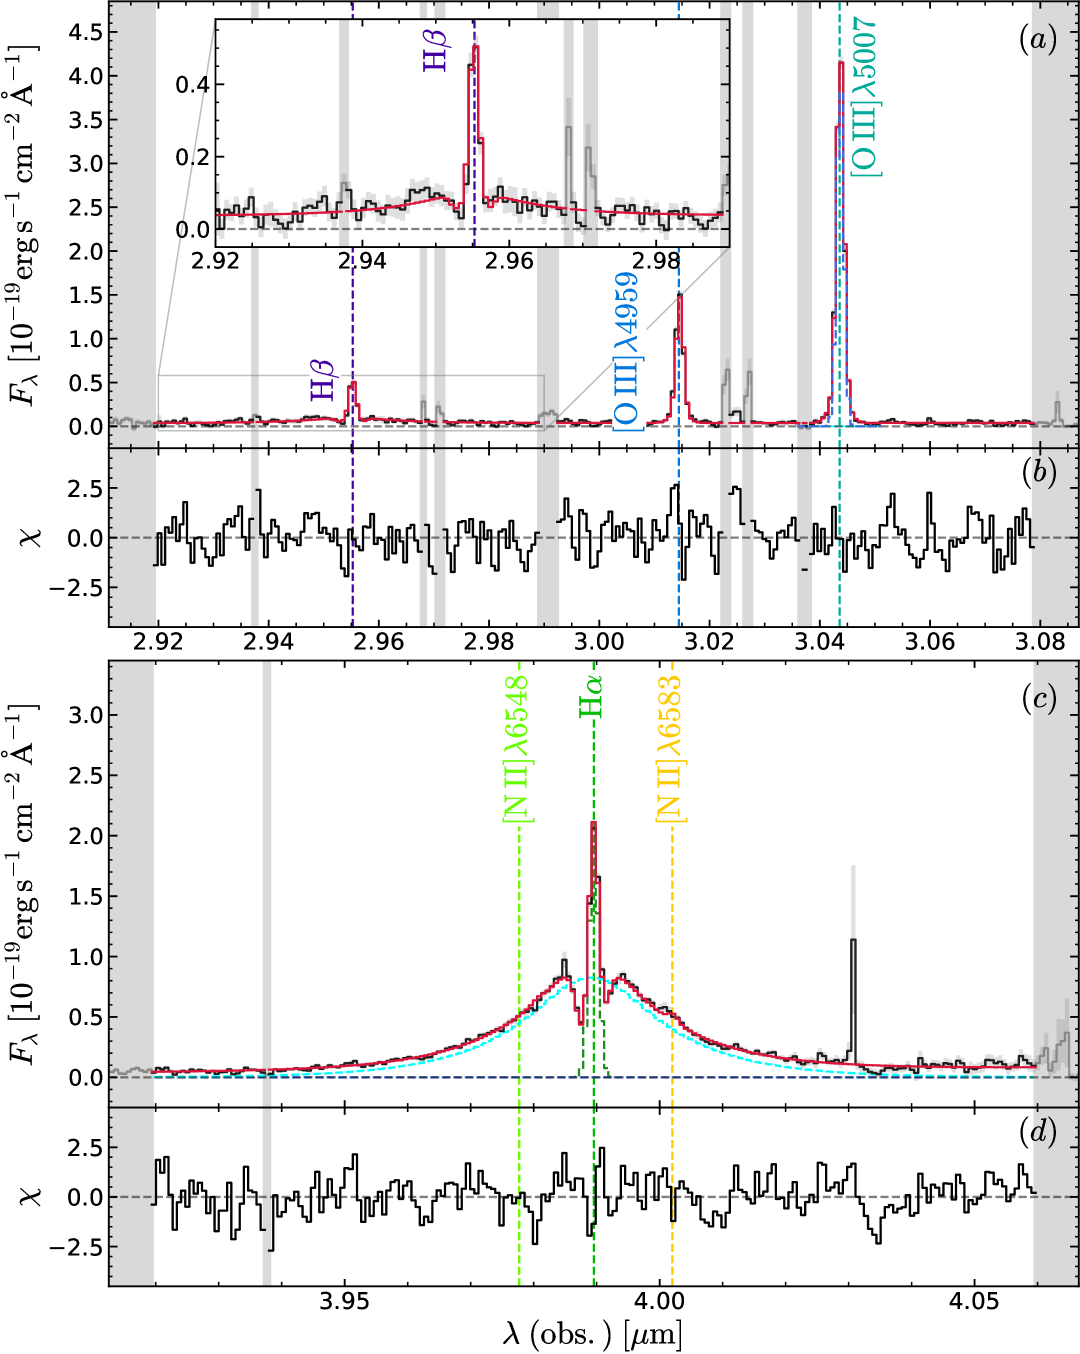
The rest-frame optical spectrum shows both Balmer and metal-line emission. The latter include [O ii]3726,3729, [Ne iii]3869, [O iii]4959,5007, and the fluorescent O i8446. The Balmer emission is broad, as highlighted also in Fig. 1, where we show H as observed in the medium and high-resolution gratings. The width of H exceeds a full-width half-maximum of ; coupled with the narrow emission from the forbidden [O iii]4959,5007 lines (dispersion ), this is strong evidence for an AGN broad-line region. This explanation resonates with the detection of the O i8446 line, a high-energy resonant line which is very faint in star-forming galaxies (Strom et al., 2023), but is common in AGN hosts (Rudy et al., 1989; Juodžbalis et al., 2024a). The Balmer emission is dominated by the broad component, but a narrow component is clearly visible. The high-resolution spectrum shows clear evidence for H absorption too (Section 3).
2.3 \blackthunderData
(Black holes in THe early Universe aNd their DensE surRoundings) is a \jwst/NIRSpec programme (PID 5015; PIs H. Übler and R. Maiolino) that targets 20 low-luminosity broad-line AGN using NIRSpec integral-field spectroscopy (IFS; Böker et al., 2022). The sample consists of broad-line AGN at , so 159717 was included for follow-up spectroscopy after being first identified in JADES. The observing setup has two visits, using the prism and the G395H grating, consisting of 14 dithered integrations each. For the prism, we used the NRSIRS2RAPID readout mode, with 37 group per integration and a single integration per dither, totalling 7,761 seconds. For the grating, we used NRSIRS2 and 23 groups per integration, totalling 23,692 seconds. The observations were strongly affected by anomalous proton flux, resulting in a higher rate of artefacts.
We processed the raw files using the \jwstScience Calibration pipeline jwst (Alves de Oliveira et al., 2018), version 1.15.0, with the calibration files specified by the Calibration Reference Data System (CRDS) context file number 1281. Additional processing steps were performed, following the procedure developed by Perna et al. (2023). Residual pink noise was corrected using a polynomial fit. We manually masked regions affected by open shutters from the NIRSpec micro-shutter assembly (Ferruit et al., 2022), and by strong cosmic rays. Remaining outliers were flagged in individual exposures using the Laplacian edge detection algorithm (van Dokkum, 2001), as implemented by D’Eugenio et al. (2024). From the reduced 2-d frames, we created the rectified datacubes using the ‘drizzle’ algorithm and an output grid with 0.05-arcsec spaxels.
The background was subtracted by creating a white image and an emission-line image, obtained respectively by taking the median across all wavelengths, and across a narrow wavelength window centred on [O iii]5007. We ran sextractor (Bertin & Arnouts, 1996) to create a segmentation map for each of the two images, we then padded these segmentation maps by two spaxels, and finally defined the source mask as the union of the two padded segmentation maps. We estimate the background for each wavelength pixel using the background algorithm from the astropy package (Astropy Collaboration et al., 2013, 2018), with a 55 filtering window, and with spatial interpolation across the windows and across the source mask. The resulting background datacube was smoothed in wavelength using median filtering and a window of 25 pixels. The quality of the resulting background-subtracted cube was assessed by taking random apertures (outside of the source mask) and verifying that their flux was consistent with 0.
2.4 Field characterisation and redshift determination
The IFS field of view is illustrated in Fig. 2, where we also indicate foreground and background sources detected from photometry. The known interloper 159715 has already been discussed (Section 2.2), but \blackthunderhigh-resolution spectroscopy detects Pa in the northern spiral arm, enabling a precise redshift measurement (Appendix A). The two galaxies JADES-GS-449623 and JADES-GS-6025 are identified in the JADES catalogue v1.0 (JADES Collaboration, in prep.); they have photometric redshift (Hainline et al., 2024), but we are unable to provide spectroscopic confirmation, because no emission lines are detected by \blackthunder. We confirm spectroscopically JADES-GS-5869, via detection of [O iii]4959,5007 and H in the prism spectrum, yielding . We also indicate the locations of 159717B, a much fainter emission-line source at the same redshift as 159717, and yet another emission-line source (159717C); these two objects are not visible in Fig. 2, but are discussed in Section 5.
2.5 \blackthunderaperture spectra
To study the main target 159717, we define two aperture spectra: a ‘total’ aperture of semi-major axis arcsec (1.6 kpc; to capture the total flux of the galaxy) and a smaller aperture with arcsec (0.8 kpc), to maximise the signal-to-noise ratio (SNR) at the expense of inaccurate aperture losses, due to the resolved nature of the target in [O iii]5007. To define these apertures, we use a curve-of-growth approach. We create an image of the broad-line H by co-adding the cube along the wavelength slices in the wings of the broad line, at a wavelength of 4 \mum. We then model the resulting image as a Gaussian light profile plus linear background, using \galfit(Peng et al., 2002, 2010), with the assumption that the source is unresolved in broad H , and that this emission line traces the instrument point spread function (PSF). The best-fit Gaussian model has axis ratio 0.9 and position angle -25.4°. The PSF is elongated in the direction along the IFU slices, in agreement with D’Eugenio et al. (2024), but here we find a considerably larger full-width at half maximum than in D’Eugenio et al. (2024), with arcsec along the slicers. An independent measurement of the PSF at this wavelength from NIRSpec/IFS observations of the bright quasar J0224-4711 (Perna M., in prep.) confirms this larger PSF. The disagreement is due to D’Eugenio et al. (2024) using a less accurate method than here, based on forward modelling an extended target starting from the NIRCam images.
We create a set of aperture spectra by summing the light inside elliptical apertures with the same shape and centre as the best-fit Gaussian model, with increasing semi-major axis in steps of one 0.05-arcsec spaxel, starting from one and reaching ten spaxels. For each wavelength pixel of the aperture spectrum, the flux is determined by adding all spaxels from the corresponding wavelength slice, weighting each spaxel only by the fractional area inside the current elliptical aperture. This approach does not benefit from the increased precision of inverse variance, but avoids biasing the result. To remove outliers, we use 4-clipping for each wavelength slice: we first divide the current slice by the PSF (point spread function), then we calculate the median and define as half the 84th-16th inter-percentile range of the data. Finally, we assign weight zero to all voxels deviating more than 4 from the median. The uncertainties are estimated by repeating the same procedure on the variance datacube. The resulting error spectrum is upscaled to match the empirical noise observed in the aperture spectrum. To do so, we estimate the effective noise on the aperture spectrum by calculating the standard deviation about the median-filtered spectrum inside a moving window, neglecting emission-line regions. We then upscale the original error spectrum to match the median value of the empirical error spectrum. This preserves wavelength-specific noise features like photon noise around bright emission lines and under-exposed pixels.
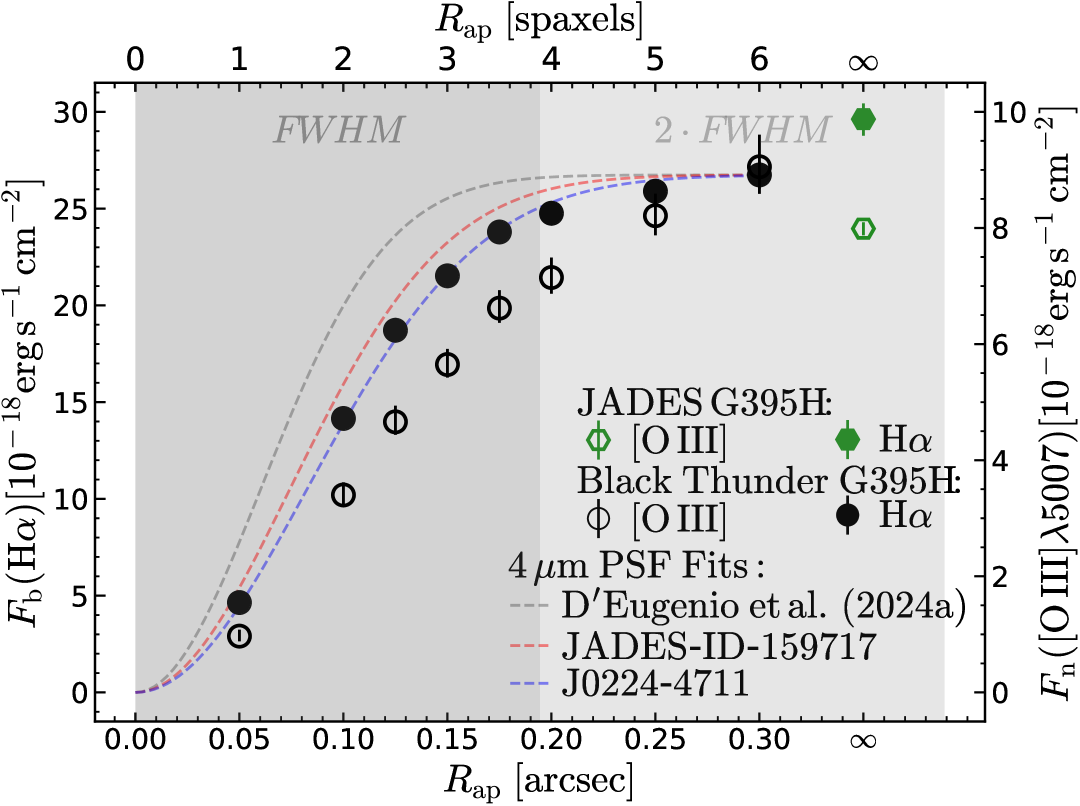
Our fiducial aperture to study 159717 has semi-major axis of 0.25 arcsec, which encloses percent of the PSF flux at the wavelength of H (cyan dashed circle in Fig. 2; see also Zamora et al., 2024). We also consider a smaller aperture of radius 0.125-arcsec; this second aperture maximises the SNR of the spectrum, but we apply an aperture-correction factor of 1.22 to capture the total H flux. This accuracy of aperture choice is validated in Fig. 3, where we show the emission-line fluxes from narrow [O iii]5007 and from broad H as a function of aperture radius, without applying any aperture-loss correction. The circles with uncertainties are measurements from \blackthunder(sections 3.2–3.3), while the green hexagons are measurements from JADES (Section 3.4). The empty/filled symbols refer to the fluxes of [O iii]5007 and of broad H . The dashed lines compare the curve of growth of three PSFs: the model from D’Eugenio et al. (2024, grey line), which clearly under-estimates the FWHM; a simple Gaussian fit to the broad-H image (red), and a Gaussian fit to the broad H wing of the J0224-4711 QSO.
The different curves of growth between the filled and empty symbols highlight the spatially resolved nature of [O iii]5007, while the broad H follows closely a Gaussian profile as expected from a point source. The satellites’ contribution to [O iii]5007 begins around arcsec.
Having located the satellites, we create aperture spectra to measure their systemic redshift and emission-line ratios. For 159717B and 159717C, which are not spatially resolved (Section 3.1), we use circular apertures of radius 0.1 arcsec, which ensure maximum possible SNR. For 159716, which is extended, we use an elliptical aperture that encloses the full NIRCam-detected flux. These three apertures are outlined in Fig. 2.
As noted by Übler et al. (2023), aperture spectra that assume uncorrelated noise result in severely under-estimated uncertainties. We therefore upscale the uncertainties spectrum by a factor of four, estimated by comparing the robust standard deviation of the fit residuals to the nominal uncertainties.
3 Analysis
3.1 Size measurement
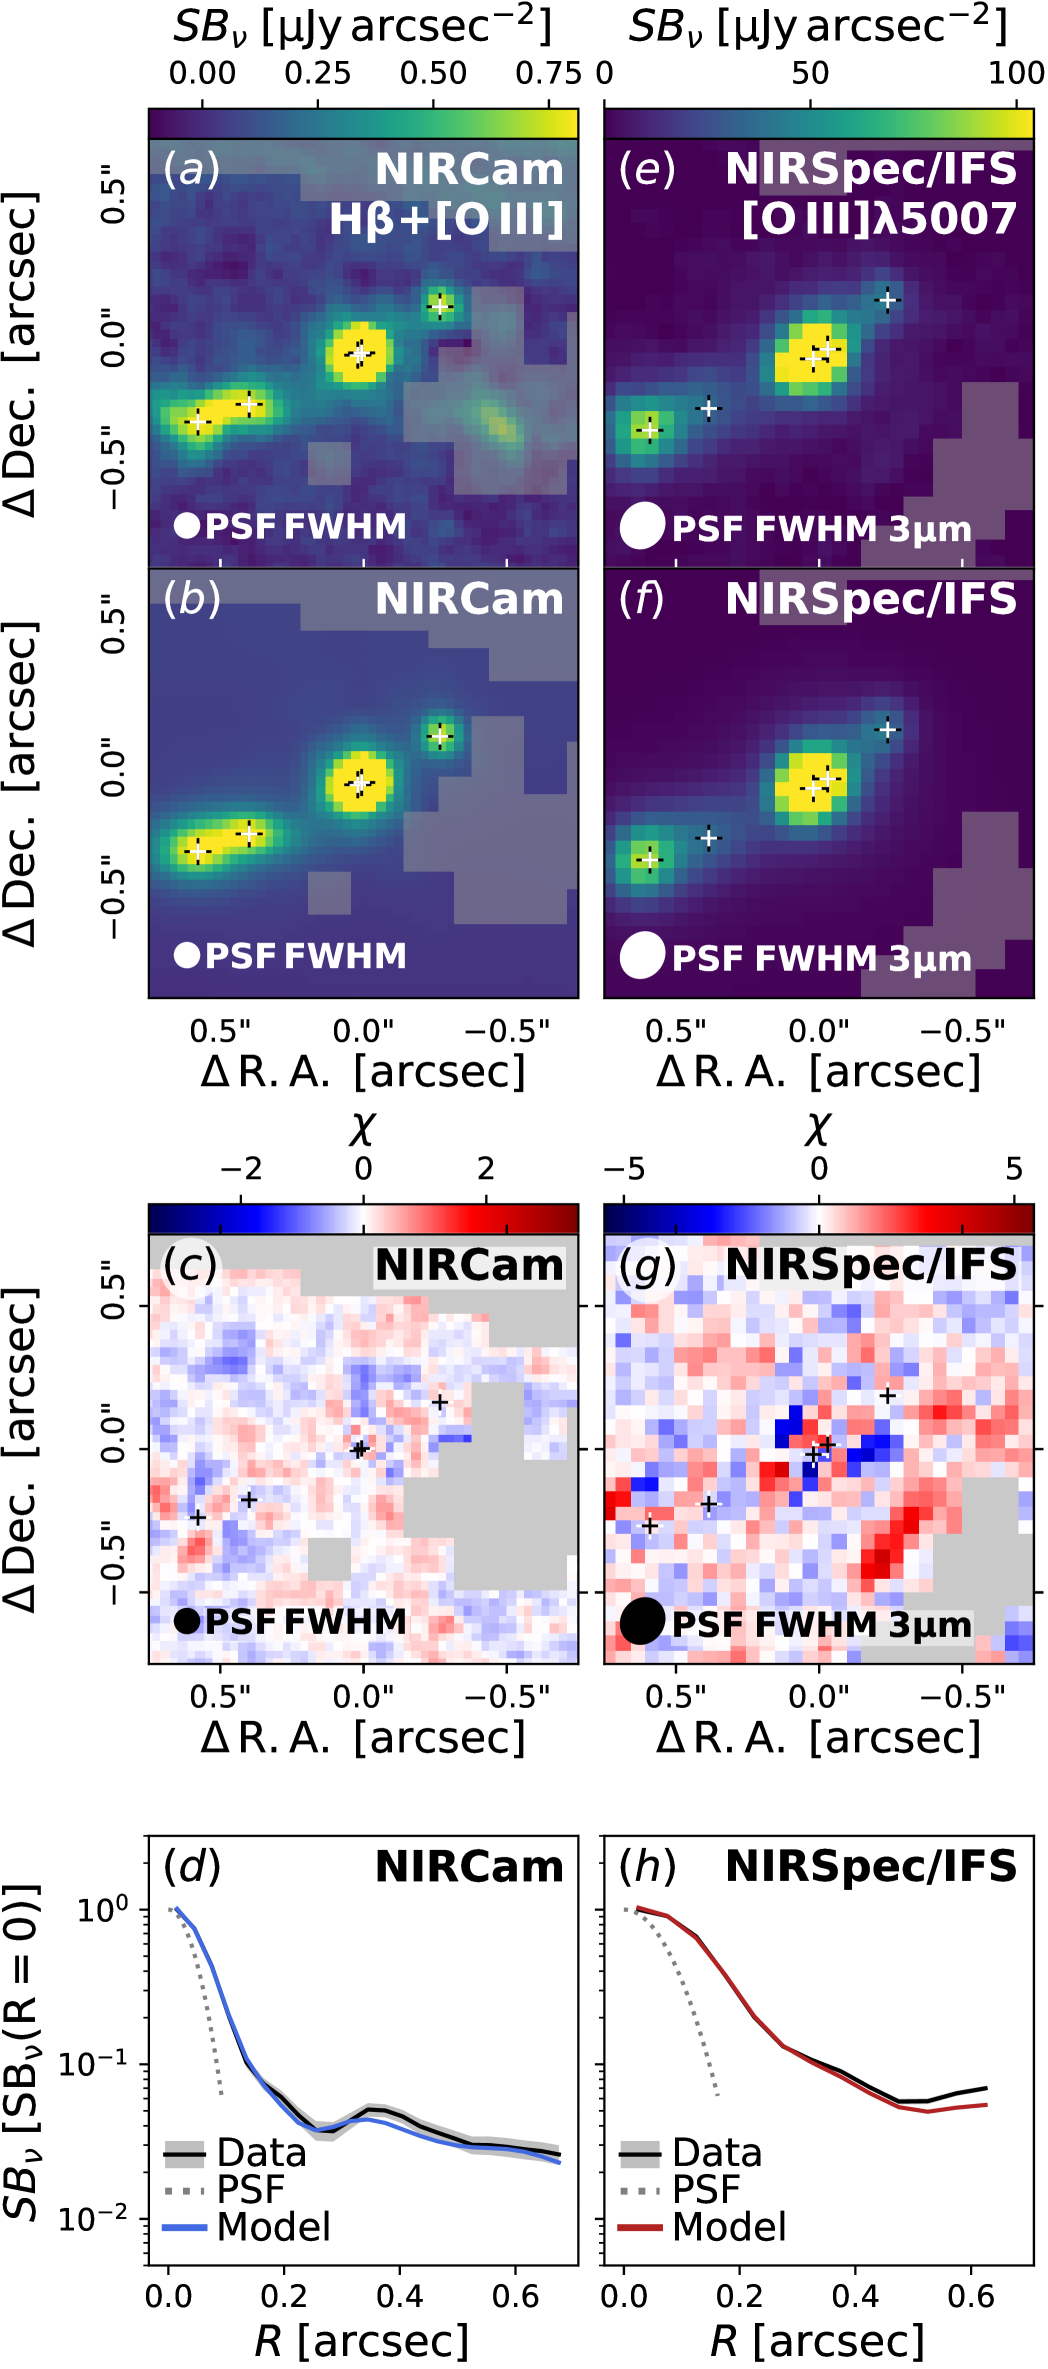
LRDs are known to have compact sizes in the rest-frame optical (Furtak et al., 2023; Killi et al., 2024), consistent with the broad lines and optical continuum being dominated by AGN (Ji et al., 2025; Naidu et al., 2025; de Graaff et al., 2025). Where sufficiently deep NIRCam imaging is available, the rest-frame UV sizes are often extended Killi et al., 2024; \al@juodzbalis+2024b, often displaying complex UV morphologies (Rinaldi et al., 2024). However, the case in hand is complicated by the presence of the foreground contaminant. We adopt two complementary approaches. The first method leverages the well understood PSF and noise properties of NIRCam, but suffers from considerable contamination by 159715 and self-contamination from the red LRD continuum. The second method uses the [O iii]5007 line map from the NIRSpec/IFS G395H observations, which suffer from no continuum contamination but have a larger PSF and poorer noise performance than NIRCam, due to correlated noise in the aperture (Section 2.5).
For the first method, we create an emission-line map of the target by subtracting the PSF-matched F200W image (which does not contain strong emission lines) from the F277W image (which contains H and [O iii]5007). The resulting image is shown in Fig. 4. Due to the complex nature of the field, we adopt generous masking around the bulge of 159715 and, to the north, a diffraction spike from a bright star. We model five sources, based on fitting and inspecting the residuals. These consist of a point source and a Sérsic profile at the location of 159717, two Sérsic profiles to describe the ‘cigar-shaped’ 159716, and a point source to describe 159717B. The centre of each source is marked by a cross marker in Fig. 4-4. We infer the model parameters using \pysersic(Pasha & Miller, 2023), adopting the empirical F277W PSF from Ji et al. (2024). The fitting setup is the same as D’Eugenio et al. (2025b).
The marginalized posterior probabilities on key model parameters are reported in Table 1, and the fiducial (maximum a-posteriori; MAP) model and the data-model residuals are illustrated in Fig. 4–4. The map highlights the presence of significant residual sub-structure, but we deem this a satisfactory model, given the complexity of the field and the ongoing interaction between the galaxies. For 159717, we find a flux ratio between the point-source and Sérsic component of ; the Sérsic component has a very large index , albeit the uncertainties are also large. The semi-major axis half-light radius is extremely compact, kpc; for reference, a galaxy with stellar mass has kpc at redshift (Miller et al., 2024). For 159717, we tested forcing an exponential disc profile using a Gaussian prior probability with mean and standard deviation 0.1; this results in a twice larger \re, but also in two times lower flux, with the point-source component becoming the brightest of the two. The satellite galaxy 159716 has larger size than 159717, with the two (spatially offset) components having and 0.9 kpc, respectively. These values are close to the expectations for a galaxy as massive as 159716 (Section 5.2).
The second approach is equivalent, aside from the data and mask used, and from the larger and non-circular PSF of NIRSpec/IFS (Section 2.5). The emission-line map has been created by taking the median of the datacube in a 150-\kmswindow centred on [O iii]5007 (Fig. 4). We find no evidence of contamination from the foreground galaxy, but there are low-intensity artefacts that we mask. A relatively bright, elongated feature is not masked; this could be an artefact, but is very close to the location of 159717C. We use the same five components to model the system and the same inference method as for NIRCam.
The inference results are displayed in Fig. 4–4 and are reported in the bottom five rows of Table 1. For 159717, we find kpc, 4.5 times larger than for NIRCam. A likely explanation is that the NIRCam emission-line map suffers from substantial contamination from the object continuum, which may arise from a compact or even unresolved component (Naidu et al., 2025; de Graaff et al., 2025). In contrast, NIRSpec/IFS can accurately identify [O iii]5007 emission and eliminate any underlying continuum. The Sérsic index is significantly lower than for NIRCam (3-difference) and the shape is considerably rounder. The origin of this discrepancy is unclear, but a possibility is that the NIRCam emission- line map F277-F200W is heavily biased by a point-source continuum, thus yielding a more compact solution. However, the flux ratio between the point-source and Sérsic components is , consistent with the NIRCam value, so overall the difference may be dominated by systematics, e.g. in the PSF determination. For 159716, the sizes are in good agreement with NIRCam.
In Section 5, we will show that the kinematic properties of the [O iii]5007-emitting gas surrounding 159717 suggest a merger scenario, such that the half-light [O iii]5007 size measured from the NIRSpec/IFS data cannot be used for calculating the dynamical mass of the system. For this reason, hereafter we adopt the NIRCam \revalue of kpc as the fiducial size measurement for 159717. We neglect the contribution of the unresolved component; this would only make \reeven smaller, giving even lower constraints on the dynamical mass.
 \phantomsubcaption
| Source ID | Data | Profile | P.A. | \re | \re | |||
| µJy | — | — | rad | pixelsb | kpc | |||
| 159717 | NIRCam | Sérsic | 0.0630.011 | 4.51.6 | 0.440.17 | 2.00.2 | 1.10.3 | 0.210.06c |
| 159717 | " | Point Source | 0.0420.011 | — | — | — | — | — |
| 159716 | " | Sérsic | 0.0530.008 | 1.80.7 | 0.400.09 | 1.70.1 | 4.60.9 | 0.90.2 |
| 159716 | " | Sérsic | 0.0360.006 | 2.51.1 | 0.160.06 | 1.60.07 | 4.00.8 | 0.80.2 |
| 159717B | " | Point Source | 0.0150.001 | — | — | — | — | — |
| 159717 | NIRSpec/IFS | Sérsic | 8.20.4 | 1.90.2 | 0.980.02 | 1.7 0.8 | 2.90.06 | 0.920.02c |
| 159717 | " | Point Source | 4.70.2 | — | — | — | — | — |
| 159716 | " | Sérsic | 6.50.5 | 6.01.0 | 0.950.05 | 1.5 0.9 | 2.50.3 | 0.80.1 |
| 159716 | " | Sérsic | 2.90.3 | 0.80.1 | 0.530.05 | 1.860.07 | 3.40.3 | 1.10.1 |
| 159717B | " | Point Source | 1.00.1 | — | — | — | — | — |
a For NIRCam, is the difference in flux density between the F200W and F277W wide-band filters. For NIRSpec/IFS, is the average flux density inside a narrow wavelength window of 150 \kms, centred on [O iii]5007 (hence the much higher in NIRSpec than in NIRCam). b We use 0.03-arcsec pixels for NIRCam and 0.05-arcsec spaxels for NIRSpec/IFS. c The large difference between NIRCam and NIRSpec could be due to NIRSpec being more sensitive to the emission-line morphology, while the NIRCam emission-line map may suffer from contamination from the point-source continuum.
3.2 Emission-line measurement methods
To measure the emission lines, we use a Bayesian approach, using different models as specified in the following sections. To integrate the posterior distribution, we use the Markov Chain Monte Carlo method, with the software emcee (Foreman-Mackey et al., 2013). Before comparing to the data, all models are convolved with the wavelength-dependent line-spread function (LSF) of NIRSpec (Jakobsen et al., 2022). For JADES only, we use the LSF corrected for slit underfill in NIRSpec/MSA (de Graaff et al., 2024). After this step, the model is integrated over each spectral pixel. To initialize the chains, we first identify the minimum- solution using the specified model and ordinary least-squares minimization. We mask any spectral pixel deviating more than 3 from the best-fit model; this bad-pixel mask is saved and used later for the Bayesian estimate step. We estimate the uncertainties on this solution using the resulting Jacobian matrix. We use 140 chains initialized from truncated Gaussians, with mean equal to the minimum- solution, and dispersion equal to twice the least-squares uncertainty. The truncation uses very generous bounds; we inspected the marginalised posterior probabilities after each fit, and increased the truncation bounds whenever a bound was within 3 away from the median. The exception being when a physically motivated solution is being enforced (e.g, non-negative flux for forbidden emission lines, covering factors between 0 and 1). We run 10,000 steps for each chain, with 50 per cent burn-in steps. All chains are concatenated and visually inspected for convergence. As fiducial parameters, we adopt the median and 16th–84th percentile range of the marginalized posterior. Hereafter, the fiducial model is always the MAP model.
3.3 High-resolution \blackthunder spectrum – black-hole properties
For the properties of the SMBH, we rely on the high-resolution \blackthunderG395H data around H –[O iii]4959,5007 and H , using the ‘total’ elliptical aperture with arcsec. We use the Bayesian approach outlined in \al@juodzbalis+2024b, but model simultaneously both line groups. The continuum is parametrized as two first-order polynomials in two windows centred at 3 and 4 \mum(rest-frame 4935 and 6565 Å), requiring 4 free parameters. All narrow lines share the same redshift and velocity dispersion (2 free parameters); is adopted as the spectroscopic redshift of the galaxy . We assume Gaussian velocity distributions, which for the range of velocities considered here, can be approximated as Gaussians in wavelength space too, as
| (1) |
where is the observed wavelength and is the vacuum rest-frame wavelength of a given emission line (). The [O iii]4959,5007 and [N ii]6548,6583 doublets require 1 free parameter each the doublet flux ratios are fixed to 0.335, see Storey & Zeippen, 2000, and 0.327, see Dojčinović et al., 2023, respectively. Narrow H and H require 2 free parameters. Broad H emission requires two Gaussians; their common redshift is , parametrised by the velocity of the broad component relative to the redshift of the narrow component. Their flux is parametrized by the total flux and by the flux ratio , while their FWHMs are free parameters, subject to . Broad H is also modelled as a double Gaussian, but is parametrized only with the flux ratio between H and H , while all other parameters are tied to the broad H . The broad components require 6 free parameters. A simpler model using a single Gaussian is manifestly inadequate and is statistically disfavoured we used the Bayesian information criterion, BIC, Schwarz, 1978, and we obtain ; we find consistent results using the distribution. As pointed out in D’Eugenio et al. (2025a), a double Gaussian model for the BLR is adopted as an effective line profile, without interpreting it as two SMBHs. For the broad-line Gaussians only, we also model the effect of a foreground hydrogen absorber, using a geometric covering factor and the optical-depth approach, with the residual intensity at wavelengths given by
| (2) |
where is the spectral flux density before absorption, is the optical depth at the centre of the line (with or H ) and is the velocity distribution of the absorbing atoms. The latter is approximated again using Eq. 1, with , and replacing and with and , where and describe the Gaussian velocity distribution of the absorbing gas. is related to the absorber redshift by , thus the velocity of the absorber is measured relative to the redshift of the narrow lines. The 5 free parameters for the absorption are , and from Eq. 2, and and from the equivalent of Eq. 1, giving a total of 21 free parameters in the model. We also model a broader component in [O iii]4959,5007 only, which adds three free parameters, the doublet velocity and velocity dispersion and the broad-[O iii]5007 flux. In addition to the standard flat priors (Section 3.2), we also use three erfc priors. We penalize the narrow [N ii]6583/H ratio against values higher than 1 (based on the very low detection rate of [N ii]6548,6583 at ; Cameron et al., 2023). We also penalize the ratios and against values higher than 1, to avoid swapping the narrow-line flux with the much fainter broader [O iii]5007 emission. Since none of these ratios can be negative, we normalize the erfc prior by its integral over the non-negative numbers.
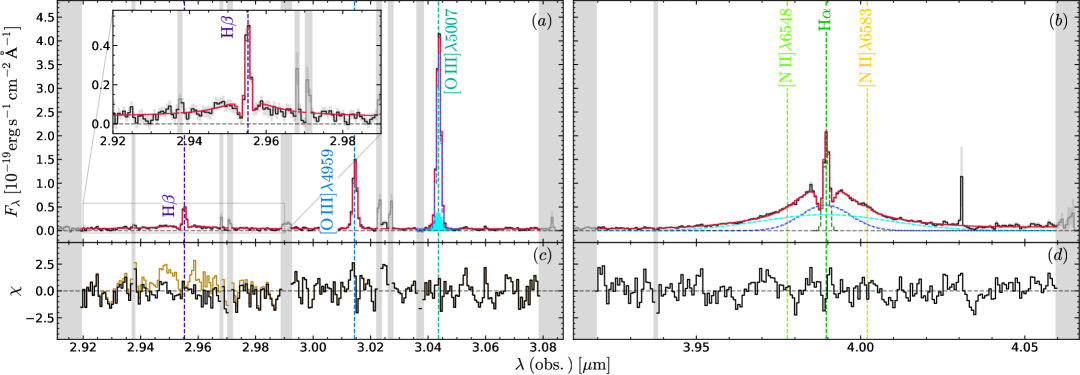
The posterior parameters of the fit to the fiducial aperture spectrum are listed in Column 1 of Table 2. In Fig. 5 instead we show the data and fiducial model from the high-SNR aperture with arcsec. Compared to the -arcsec aperture, this smaller aperture spectrum has biased emission-line ratios but offers higher SNR in the broad lines. The model correctly reproduces the shape of the emission lines, including the complex profile around H and H . Broad H emission is clearly present, with a 7 detection ( \fluxcgs[-18]; Table 2, Column 2), whereas the -arcsec aperture yields only a 4-result (Table 2, Column 1), consistent with the expectations for an unresolved source. Fig. 5 shows , the data-minus-model residuals normalised by the noise (black line). The sand-coloured line highlights the systematically higher residuals when omitting the broad-H component. Tentative H absorption is also seen, with a slightly blue-shifted centroid (inset panel). The broad [O iii]4959,5007 component is detected too, albeit only at the 5-level, but is discussed more in detail in Section 3.5.
We detect a marginal blueshift of the broad H (), but this is driven by the large aperture, which may bias the narrow-line redshift estimate due to contamination from possible extended emission along the axis connecting 159717B to 159716 (Fig. 2). In agreement with this hypothesis, when repeating the fit for the 0.125-arcsec aperture (Table 2, Column 2), we find indeed a lower systemic redshift (2-significance) and, therefore, less blue-shifted broad H (). There are some positive residuals at the spectral position of the narrow H line and at the blue wing of the H absorption. These residuals are not statistically significant, but they can be removed by decoupling the narrow H from the bluer narrow lines, and by introducing a second H absorber.
The H absorption has relative to the broad-line flux density. This value is deceptively small: the strength of the absorption can be fully appreciated when related to the broad-H equivalent width, Å, or when relating the absorption to the continuum ().
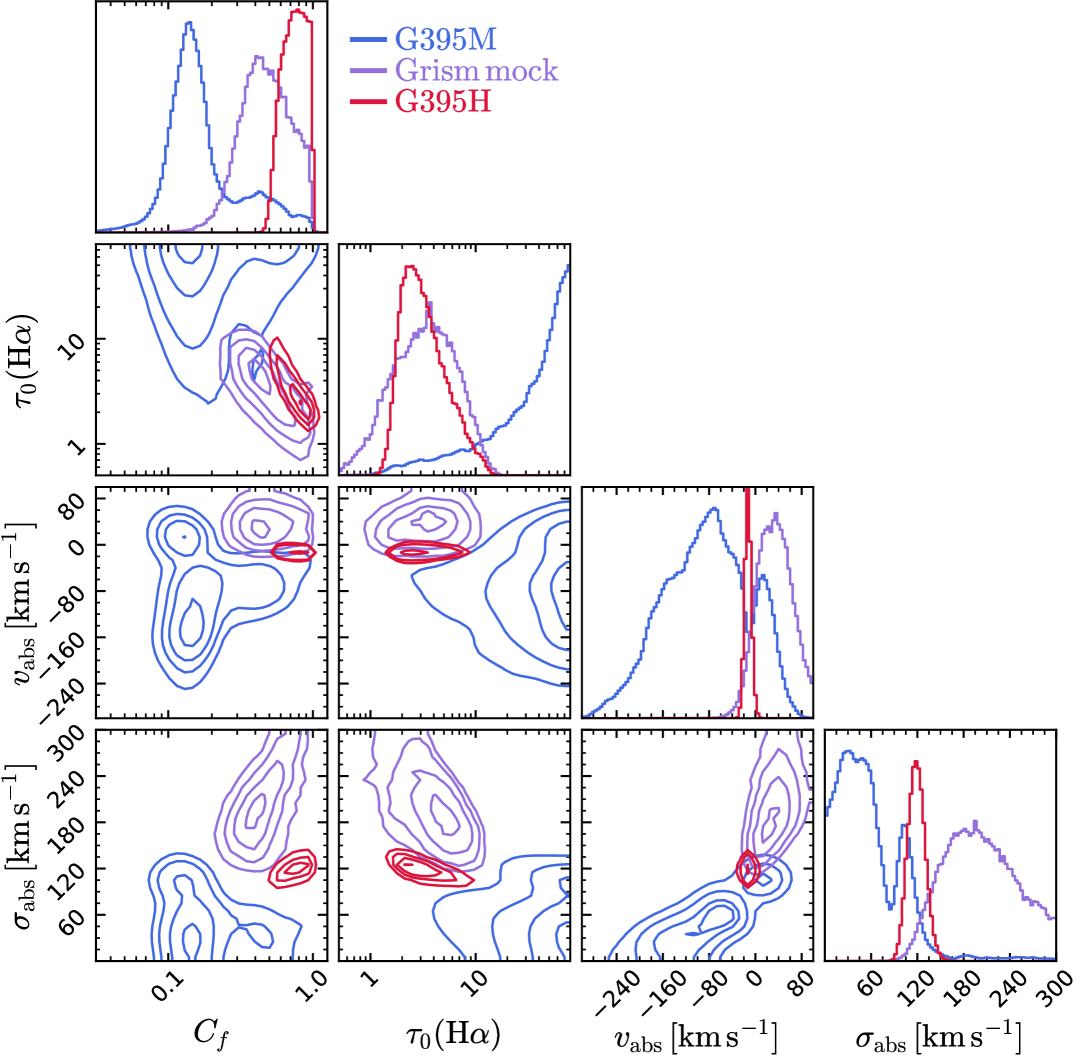
A selected subset of model parameters is shown in Fig. 8, showing that the G395H data can meaningfully constrain and , even though a strong degeneracy between these two parameters persists as expected; e.g., Davies et al., 2024, \al@juodzbalis+2024b. The velocity dispersion of the absorber is similar to other results reported in the literature (e.g., \al@juodzbalis+2024b, ), but strikingly, the absorber velocity is remarkably low, , statistically consistent with the velocity of the BLR ().
3.4 High-resolution JADES spectroscopy
The availability of JADES G395H spectroscopy enables us to test 159717 for time variability. We fit the G395H JADES data with the same approach as for the \blackthunderG395H aperture data, with two differences. We remove the broad H component, the H absorber and the broad [O iii]4959,5007 component, since we find no supporting statistical evidence for any of these features (five less free parameters than the model in the previous section), but we add the narrow [S ii]6716,6731 doublet, with free [S ii]6716 flux and doublet flux ratio (constrained to the physical range from Sanders et al., 2016, adding two more free parameters).
The resulting best-fit model is shown in Fig. 6, while the percentiles of the posterior probabilities are in Table 2, Column 3. Several parameters have different posterior probability distributions between JADES and \blackthunder. The lack of broad [O iii], broad H and H absorption is consistent with the lower SNR of the JADES observations. The JADES data show clear detections of [S ii]6716,6731, but we discard these as unreliable (Section 3.6). JADES finds higher redshift with high significance (11 ), but this corresponds to only one third of a spectral pixel at 4 \mum, so the discrepancy could be due to systematics in the wavelength solution, which for sources smaller than the MSA microshutter depends on the intra-shutter position – itself known only approximately. An error of this magnitude could be due to the bias between intra-shutter position and wavelength solution in the JADES MSA data reduction D’Eugenio et al., 2025c; see Scholtz J., in prep., for a solution to this problem. We tested that decoupling the redshift of the spectral regions around H –[O iii]4959,5007 from the redshift of the lines closest to H does not substantially improve the fit. The velocity dispersion is marginally different from \blackthunder, with instrument-deconvolved \kms(2-difference). Systematic uncertainties in the LSF may be responsible for this discrepancy. In fact, we assumed the LSF for point sources from de Graaff et al. (2024), but in our case this choice likely over-estimates the actual resolution, because while 159717 is compact, the narrow lines are spatially resolved (Section 3.1), so the effective resolution is intermediate between the nominal value assuming uniform slit illumination and the LSF for point-sources. The JADES data has lower observed (2-significance). This small difference leads the model to infer higher dust attenuation, mag, but this latter difference is not statistically significant (1.4 ). Lower narrow H flux is consistent with the bias deriving from assuming point-source path-loss corrections in the JADES data reduction, which assume a higher flux loss at redder wavelengths, thereby potentially leading to a spurious increase in the Balmer decrement. These non-consequential differences have plausible explanations and overall do not affect our results.
However, there are two important mismatches. The FWHM of the broad-H line is for JADES and for \blackthunder(a 3-discrepancy). This 20 percent difference alone propagates to an error on the SMBH mass of 45 per cent (Section 4.1), only marginally reduced by the 14 percent larger H flux in JADES than in \blackthunder. This flux difference (4 ) reflects the difficulty of inferring the emitted H flux in the presence of strong absorption ().
3.5 Ionized outflows
The broad [O iii]4959,5007 component (shown separately by the filled cyan line under [O iii]5007 in Fig. 5) is clearly much broader than the narrow lines, yet significantly narrower than the broad Balmer lines. It is not detected in JADES (), while the deeper \blackthunderdata favours multiple components, with an improvement of for the double-component model over the single-component model.
According to the \blackthunderdata, both [O iii]4959,5007 components are kinematically narrow ( \kmsvs. \kms) and they are consistent with the same systemic velocity (velocity offset ). The narrowest component is the brightest, with an [O iii]5007 flux of , while the broad component has flux (5 significance). The significance does not change with aperture size, suggesting a spatially resolved nature. However, the SNR is too low for detecting the broader component in individual spaxels, hence we omit it from the spatially resolved analysis (Section 5).
Repeating the deblending analysis performed on [O iii]5007 for H and H is not possible due to degeneracies with the absorption profile shape and, in the case of H , the low SNR. Given this lack of information, it is impossible to provide a physical interpretation of the two components. We present three simple scenarios. The narrowest component may be tracing the host galaxy, while the broadest component is due to tidally disrupted material following the interaction with the satellites (Section 5). Alternatively, if the broadest component traces the host galaxy, then the narrowest component could be either a star-forming clump, or gas photo-ionized by the AGN. Faint outflows are also a possibility, with an outflow velocity that can be estimated (Rupke et al., 2005; Veilleux et al., 2005) as , in agreement with the values found in star-forming galaxies at (Carniani et al., 2024). The possible detection of a localized outflow resonates with the finding of the detached outflow component 159717C (Section 5.1).
3.6 Absence of nitrogen, sulphur, and helium
Near H , we find no evidence for [N ii]6548,6583 and [S ii]6716,6731, as expected from the generally low detection rate of these lines at (Cameron et al., 2023; D’Eugenio et al., 2025c; Mascia et al., 2024; Juodžbalis et al., 2025). Performing the inference while including [N ii]6548,6583 (with the same redshift and intrinsic dispersion as the other narrow lines) yields a 3-upper limit on the [N ii]6583 flux \fluxcgs[-18] (depending on the survey and aperture considered). For [S ii]6716 and [S ii]6731, the JADES G395H fit yields 6- and 5-detections respectively. The nominal fluxes are and , with a plausible doublet ratio of 1.2. The \blackthunderG395H data cannot confirm this detection, because at the position of 159717, the doublet falls in the detector gap. However, neither of these two lines are confirmed in the medium-resolution grating or in the prism (even though the low spectral resolution of the prism is expected to increase the SNR of the doublet). Besides, [S ii]6731 is very near some noise features. Therefore, we dismiss the signal observed in G395H as an artefact. Similarly, we find no evidence for He ii, in agreement with similar findings in other LRDs (see e.g. the objects included in the AGN sample of Juodžbalis et al., 2025).
3.7 Other tests and model parameters
Using G395H data from both JADES and \blackthunder, we tested the impact of wavelength-calibration issues on the recovered parameters. We repeated the Bayesian inference by decoupling the H and [O iii]4959,5007 region of the spectrum from H . This was done by introducing a new free parameter for the line broadening of the narrow H and [O iii]4959,5007 lines () and a velocity offset between this set of narrow lines and narrow H . The marginalized posterior on is 10 percent larger than , suggesting that our LSF characterization does not fully capture the instrument performance. For we find either no offset (for JADES, ), or a 4-offset of H and [O iii]4959,5007 towards the blue (for \blackthunder, ). In both cases, there is a strong correlation between and the velocity of the absorber, which propagates to other physical quantities like and . This is understandable, because a velocity offset of the absorber can shift the peak of the narrow-H line. The exact effect on and is complicated by the inter-dependence of these two quantities. However, for , using a free (as opposed to in the fiducial models) leads to changes in the EW measurement of 10 per cent.
3.8 Importance of high-resolution \jwstspectroscopy
To evaluate the bias of our measurements for different dispersers, we repeat the above modelling analysis on the medium-resolution JADES data, with spectral resolution , and with a mock realisation of NIRCam/WFSS F444W data. Besides differences in the data and LSF, the models are identical. However, for the NIRCam mock spectrum, we exclude the model and data near H and [O iii]4959,5007, because these would not be normally available. We do not correct for the generally higher noise of the NIRCam slitless spectroscopy. The comparison between the high- and medium-resolution NIRSpec/MSA spectroscopy is shown in Fig. 7 (for NIRCam/WFSS see Appendix C). The contrast between panel 7 and panels 7 is stark. In the medium-resolution data, there is almost no trace and certainly no statistical evidence of H absorption. For the NIRCam mock data, the presence of the absorber is still clear (Appendix C), and its physical properties and are reasonably well constrained (Fig. 8), though these constraints may stem from an unreasonably good data quality, which would require very long integration for NIRCam/WFSS. However, even the best-quality NIRCam/WFSS data cannot constrain well the kinematic properties of the absorber, with 5 larger uncertainties. From here on, we adopt the high-resolution G395H model as the fiducial model for deriving the galaxy redshift, the narrow-line velocity dispersion, and the SMBH parameters.


| Survey | \blackthunder | \blackthunder | JADES | JADES | ||
| Aperture | arcsec | arcsec | MSA | MSA | ||
| Disperser | G395H | G395H | G395H | G235M & G395M | ||
| Parameter | Fit | Unit | (1) | (2) | (3) | (4) |
| Y | \fluxcgs[-18][] | — | — | — | ||
| Y | — | — | — | — | ||
| Y | \fluxcgs[-18][] | — | — | — | ||
| Y | \fluxcgs[-18][] | — | — | — | ||
| Y | \fluxcgs[-18][] | — | — | — | ||
| Y | \fluxcgs[-18][] | |||||
| Y | \fluxcgs[-18][] | |||||
| Y | \fluxcgs[-18][] | |||||
| Y | \fluxcgs[-18][] | |||||
| Y | \fluxcgs[-18][] | — | — | —b | ||
| a | N | mag | ||||
| N | mag | — | — | |||
| Y | \kms | |||||
| Y | — | |||||
| Y | \fluxcgs[-18][] | — | — | |||
| Y | \kms | — | — | |||
| Y | \kms | — | — | |||
| Y | \kms | |||||
| Y | — | — | — | |||
| N | \fluxcgs[-18][] | — | — | |||
| Y | \fluxcgs[-18][] | |||||
| Y | — | |||||
| Y | \kms | |||||
| Y | \kms | |||||
| N | \kms | |||||
| Y | \kms | |||||
| Y | \kms | |||||
| Y | — | |||||
| Y | — | — | — | |||
| Y | — | |||||
| N | Å | — | — | |||
| N | Å | — | ||||
| N | K | — | — | — | ||
| N | K | — | — | — | ||
| N | \pcm | — | — | — | ||
| N | dex | — | — | — | ||
| N | dex | — | — | — | ||
| N | dex | — | — | — | ||
| N | dex | — | ||||
| N | dex | — | — |
Notes. aFor the medium-gratings only, we fix the intrinsic flux ratio between the narrow Balmer lines and apply a dust attenuation. Hence, for this fit, is a free parameter, while the and are not. b[S ii]6716 and [S ii]6731 are formally detected at 6 and 5 in the JADES G395H data, but not in the other configurations (and fall in the detector gap in the \blackthunderG395H data). We interpret the observed signal as spectral overlap from other sources (Section 3.6). cFor the flux of the broad-line regions we report the flux before the Balmer absorber.
3.9 Dust attenuation
The dust attenuation in 159717 consists of an intrinsic component, and a foreground screen due to the interloper 159715. In principle, we should distinguish between the intrinsic and foreground terms. In practice, the dust attenuation from the interloper is negligible (Appendix A), due to a combination of low intrinsic attenuation in the interloper and to the fact that the optical emission lines from 159717 are already at observed-frame 1 \mumwhen they pass through 159715 at . For the main analysis, we assume the Gordon et al. (2003, hereafter: \al@gordon+2003) attenuation law, parametrized by the -band attenuation and expressed as a spline interpolating the data presented in \al@gordon+2003. To infer , we compare the Balmer decrement to the assumed intrinsic ratio.
For the galaxy ISM we use the narrow-line fluxes measured from the fiducial \blackthunderaperture, where bias due to aperture losses is minimal. We assume Case-B recombination, electron temperature \Telec=10,000 K, and electron density \nelec=500 \pcm, giving (Osterbrock & Ferland, 2006). In the fiducial aperture, we find an effective dust-attenuation value mag (Table 2, Column 1). The smaller -arcsec aperture instead yields mag. While these two values are statistically consistent, the higher attenuation in the smallest aperture suggests that the larger aperture captures additional narrow-line emission for which our aperture correction is inadequate (based as it is on the curve-of-growth of the broad-H line, which is a point source). Alternatively, the innermost region may suffer from higher dust attenuation relative to the outskirts.
As we have noted, is an equivalent dust attenuation, which includes reddening in 159717, as well as additional reddening due to crossing the interloper 159715 at . This latter reddening is hard to estimate accurately, because we do not detect H in the foreground star-forming regions. We detect either the spectrally blended H –[O iii]4959,5007 complex (in the prism), or just [O iii]5007 (in the G140M grating). Flux calibration uncertainties between the NIRSpec dispersers are of the same order of magnitude as the effect of moderate dust attenuation (D’Eugenio et al., 2025c), so we do not attempt to infer H by subtracting the grating [O iii]4959,5007 flux from the H –[O iii]4959,5007 blend in the prism. A physically motivated fit of the interloper spectrum finds , and is thus consistent with no dust attenuation (Appendix A). We thus do not attempt to breakdown , the effective dust attenuation in 159717, into a local and a foreground component.
For the BLR, we find a Balmer decrement of . Estimating the attenuation towards the BLR is highly uncertain, because in the high-density BLR the Balmer lines can be powered by other processes such as collisional excitation. Assuming an intrinsic ratio of 3.06 (from observations of blue quasars; Dong et al., 2008), we obtain mag, which would imply an intrinsic H flux 25 times brighter than what we measure. On the other hand, an intrinsic Balmer ratio of 10 (Ilić et al., 2012) would give a dust attenuation mag, fully consistent with the dust attenuation inferred from the narrow-line ratios and implying no additional dust towards the BLR.
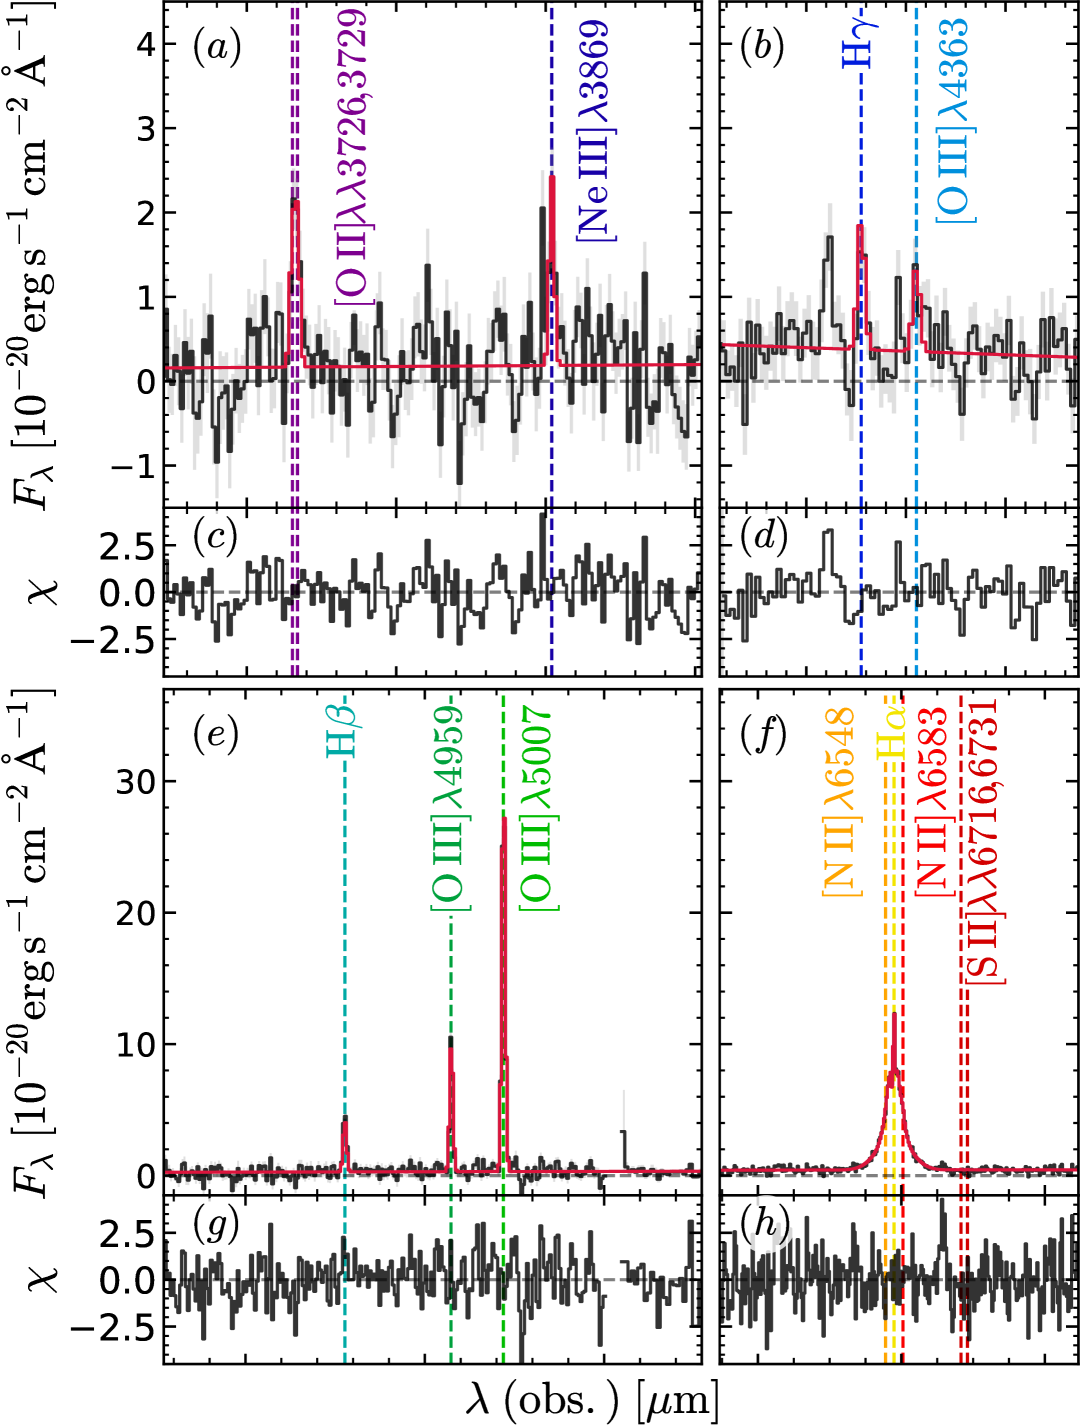
3.10 Medium-resolution spectrum – host-galaxy ISM
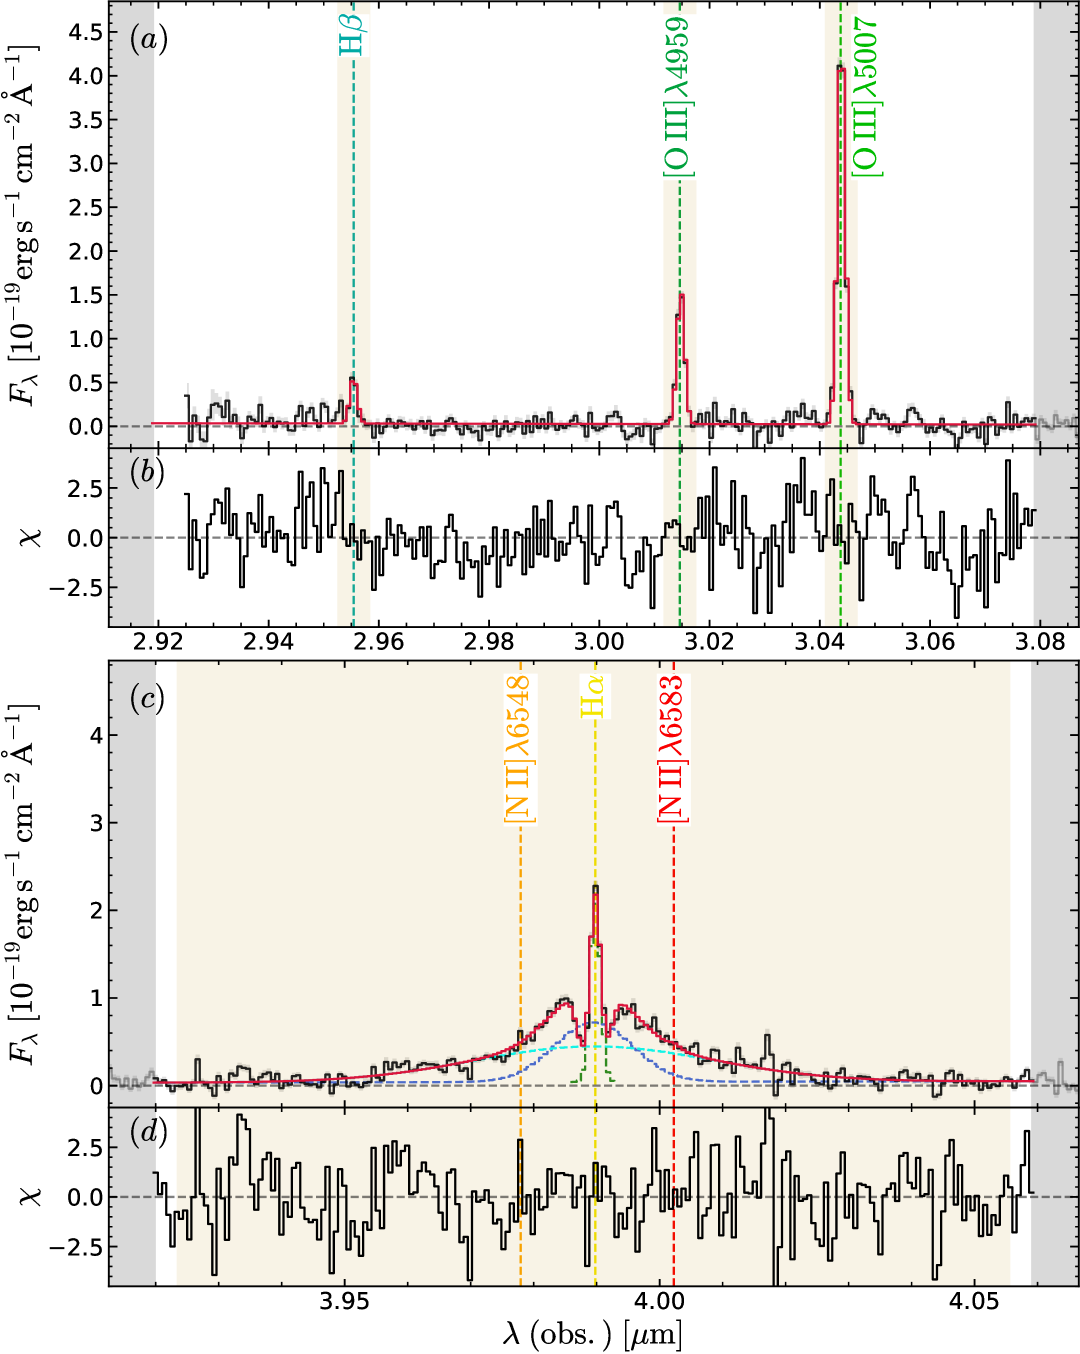
To derive the physical properties of the host galaxy, we use the medium-resolution spectra, because they cover the full range of rest-optical strong lines, unlike high-resolution G395H spectroscopy. We detect no line emission in the G140M spectrum (except for rest-frame optical lines from the interloper, Appendix A), so we use only the G235M and G395M spectra. We define four spectral windows around [O ii]3726,3729 and [Ne iii]3869, H and [O iii]4363, H and [O iii]4959,5007, and H , and we use a joint model to fit the spectrum simultaneously in each window (Fig. 9). The background is modelled piecewise inside each window as a first-order polynomial (2 free parameters per window, 8 total). The narrow lines are all modelled with the same redshift and intrinsic velocity dispersion (2 free parameters). All lines are parametrized via their dust-corrected flux, requiring one free parameter for the \al@gordon+2003 dust attenuation. This approach models simultaneously the entire spectrum (similar to Greene et al., 2024), and ensures a Bayesian approach to estimate the dust attenuation. [O ii]3726,3729 is parametrized by the [O ii]3726 flux and the [O ii]3729/[O ii]3726 ratio 2 free parameters; the doublet ratio is constrained to the range 0.3839–1.4558, following Sanders et al., 2016. [O iii]4363 and [O iii]5007 are parametrized via their flux, whereas the flux of [O iii]4959 is fixed to 0.335 the [O iii]5007 flux (2 free parameters).
The narrow-component Balmer lines H , H and H are parametrized via the H flux alone (one free parameter). The fluxes of H and H are fixed to their Case-B recombination ratios with respect to H , where we assumed K and \pcm. These values are justified as follows; for the density, we use the mean density of star-forming galaxies at (Isobe et al., 2023); a posteriori, this value is not inconsistent with the mean value we infer from the measured [O ii]3729/[O ii]3726 ratio (although the uncertainties are very large). The impact of this density choice on our model is in any case small; for example, the mean density of narrow-line AGN in the local Universe is found to be significantly higher, when estimated from higher-ionization species (; Binette et al., 2024), but even at these higher densities the H /H and H /H ratios changes by less than 2 per cent. McClymont et al. (2025b) reported the discovery of galaxies at with observed Balmer-line ratios which are inconsistent with Case-B recombination. However, these galaxies seem associated with density-bounded nebulae, and tend to exhibit blue continuum and Ly emission, contrary to what we observe here. For the temperature, we reason that regions of higher temperature (as those producing auroral [O iii]4363 emission) have lower Balmer- line emissivity, as highlighted by the anti-correlation between [O iii]5007/H and [O iii]4363/[O iii]5007 in the narrow-line regions of type 1 AGN (Baskin & Laor, 2005); therefore, the overall Balmer ratio should be biased towards lower-temperature regions. In any case, also the assumptions on \Telecdo not have a major impact on our findings.
Four more narrow lines are included: [N ii]6548,6583 and [S ii]6716,6731; these are parametrized by 3 free parameters as in Section 3.3. Based on the fit residuals, the only clearly detected broad-line component is that of H , which is modelled in the same way as for the G395H data (Section 3.3), using two Gaussians and five free parameters. Finally, we add the H absorber, with its 4 free parameters. In total, this model has 28 free parameters, 11 for the narrow lines, 5 for the broad H , 4 for the absorber, and 8 for the local background. Given that these data are unable to constrain the properties of the absorber (Section 3.8), for the four free parameters describing the absorber we adopt informative priors based on the 1-d marginalised posterior probabilities from the G395H model inference from JADES (Table 2, Column 3), without considering the covariance in the posterior probability. We broaden these posteriors by a factor of two (we use a log-normal for and ). The goal of this setup is to capture the uncertainty in the narrow-line flux due to poorly constrained absorption, while still adopting a physically motivated range of absorber properties.
The resulting properties from the above model are reported in Table 2 (Column 4). These measurements are the basis for our analysis of the galaxy ISM. To avoid confusion, we do not use the posterior for the broad-H and absorber parameters; these model components are included only to obtain an unbiased flux of the narrow H and of the dust attenuation. For analysing the broad component, we used the G395H data (Section 3.3; Table 2, Column 2).
From the medium gratings, we obtain a dust attenuation mag, lower than the value inferred from the G395H spectrum ( mag; Table 2). The main result of our joint fit to the Balmer lines is to up-weight the H /H ratio in the estimate of the dust attenuation, yielding a higher value compared to fitting the lines separately and then estimating (a method that yields mag). Our high attenuation values are not implausible, given the red slope of the rest-optical continuum (e.g., Figs. 1 and 9), and other reported measurements of in the literature (Killi et al., 2024; Furtak et al., 2024; Akins et al., 2025b; Ji et al., 2025), including from narrow-lines (Brooks et al., 2024; D’Eugenio et al., 2025a). The uncertainties are large, correctly reflecting the uncertainties in the properties of the absorber (which in our case are informed by the results of the G395H fit).
Including the known absorber is essential for recovering unbiased emission-line properties. For instance, removing the absorber altogether from the model leads to severely under-predicting the narrow H flux; with our physically motivated model we obtain and of and , respectively. This yields a dust attenuation mag, consistent with no dust and much lower than the true value. In fact, the H flux is so severely underestimated that the model under-predicts H too, since our model enforces a minimum Balmer decrement of 2.86. Removing this constraint, we would obtain an unphysical Balmer decrement of 1.5.
4 Physical properties
4.1 The supermassive black hole
From the G395H H model of the fiducial -arcsec \blackthunderspectrum (Section 3.3), we obtain a BLR (Table 2, Column 1). The best-fit value for the higher-SNR -arcsec spectrum has smaller uncertainties but is fully consistent (; Column 2). We use the larger aperture because it minimizes aperture-loss corrections, ensuring the highest accuracy in the inferred dust attenuation. The absorption-corrected H luminosity is , increasing to after correcting for dust attenuation using mag (for all derived quantities, we calculate the uncertainties from the MCMC chains, in the same way as the posterior probability on the other model parameters). Using the single-epoch black-hole mass estimator of Reines & Volonteri (2015), appropriate for SMBHs at the low-mass end of the calibration, we obtain ( without dust correction), dominated by uncertainties in the calibration, of order 0.3 dex.
Alternatively, instead of applying a dust-attenuation correction based on the Balmer decrement of the narrow-line region, we can apply the higher attenuation inferred from the Balmer decrement of the BLR. We estimate a maximum value of mag, giving a broad H luminosity of . With this much higher luminosity, we get , which we treat as an upper limit on the SMBH mass, due to the large range of possible intrinsic Balmer ratios for BLRs Dong et al., 2008; Ilić et al., 2012; see Section 3.9.
To obtain the bolometric luminosity, we use the calibration of Stern & Laor (2012) based on H . The resulting Eddington ratio is (0.24 without dust-attenuation correction). For the extreme case of a highly obscured BLR, we would estimate , driven by the fact that (with our single-epoch calibration and for fixed FWHM), we have approximately .
There is also the possibility that the double-Gaussian profile is due to two SMBHs; dual AGNs have already been reported (e.g., Maiolino et al., 2024; Übler et al., 2024) and their rate is more common at high redshift, at least on kpc scales (Perna et al., 2025). However, while ‘double-Gaussian’ profiles are widespread among LRDs (e.g., Juodžbalis et al., 2025), there is currently very little evidence for kinematic offsets between the two broad-line components. At plausible separations of 1–100 pc, the orbital velocity of two SMBHs with mass comparable to 159717 would range between 60–600 \kms; admittedly our observations cannot fully constrain the low-velocity envelope of this range, due to the difficulty of measuring a velocity offset that is small compared to the line widths, without even considering inclination effects or the complication of the narrow line and H absorber. However, while some confirmed cases do have small velocity offsets (e.g., Übler et al., 2024, ), the general paucity of larger offsets seems to be a problem for the double-SMBH interpretation.
4.2 The host galaxy
We do not attempt to measure the stellar mass of 159717. The usual uncertainties about the stellar mass of LRDs Wang et al., 2025, 2024; \al@juodzbalis+2024b; Setton et al., 2024; Ma et al., 2025b are compounded by the presence of 159715 and of its UV-bright spiral arm (Fig. 2). Besides, two other LRDs have been confirmed to have time-variable111We note that the prevalence of time variability among LRD is debated, with NIRCam studies of large samples of LRDs showing no time variability (Zhang et al., 2025). rest-frame optical continuum (Ji et al., 2025; Naidu et al., 2025), implying that the AGN dominates the optical continuum, from which stellar masses are usually inferred. With the interloper contaminating the UV, we have no handle on the stellar SED.
From the narrow-line width we can estimate the galaxy dynamical mass, following the approach outlined in Übler et al. (2023) and Maiolino et al. (2024). We adopt the calibration of van der Wel et al. (2022), with Sérsic index , projected axis ratio , and pc (Table 1). We correct the observed narrow-line velocity dispersion upward by 0.2 dex, following the calibration of Bezanson et al. (2018) that converts gas velocity dispersions to stellar values. With these numbers, we obtain dex, which we also use as an upper limit on the stellar mass. The large uncertainties on and \retranslate into uncertainties on \mdynof order 0.1 dex. For comparison, the virial calibration from Stott et al. (2016) gives , meaning that our dynamical mass is dominated by systematics. We remark that within a factor of 2, \mdynof 159717 is comparable to the stellar mass of the satellite 159716 (Section 5.2).
4.3 ISM properties
From the narrow-line parameters of the medium-resolution model (Table 2, second column), we can estimate the physical properties and chemical abundances of the ISM of the host galaxy. In principle, we can estimate the electron temperature ) of the O iii-emitting gas directly from the dust-corrected [O iii]4363/[O iii]5007 ratio. This diagnostic is insensitive to the electron density over a wide range of values, so we assume , which is typical of the O ii-emitting regions of star-forming galaxies at (Isobe et al., 2023), and agrees with our (very uncertain) measurements based on the [O ii]3726,3729 doublet ratio. To infer we use \pyneb(Luridiana et al., 2015), and we do so for each of the MCMC chains, obtaining K. From this value, we estimate the O++ abundance to be using the calibration of Dors et al. (2020). Further using the calibration of Izotov et al. (2006), we estimate also K (but we note that this calibration is used outside its established validity range). From \nelecand , using again the calibration of Dors et al. (2020), we find that the O+ abundance is small (6.6 dex). The total metallicity is , or 10 per cent solar (Asplund et al., 2009).
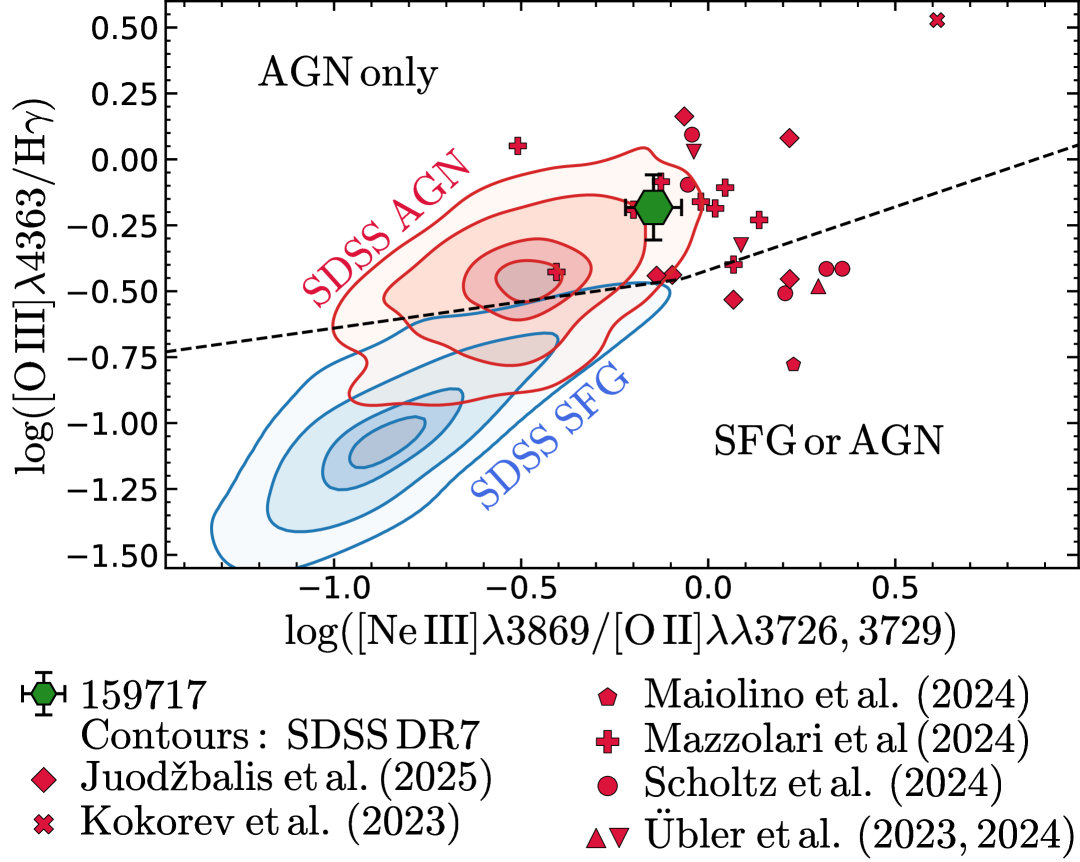
To assess the photoionization source, we use the methods of Mazzolari et al. (2024, Fig. 10). We show the emission-line ratios [O iii]4363/H vs [Ne iii]3869/[O ii]3726,3729, since these two ratios are robust against dust attenuation (unlike the version of the diagram that replaces [Ne iii]3869 with [O iii]5007). Our main target 159717 is found in the AGN-only region of the diagram, driven by the high [O iii]4363/H ratio. A number of high-redshift AGNs are also shown, including both Type 1 AGN (Juodžbalis et al., 2025; Kokorev et al., 2023; Maiolino et al., 2024; Mazzolari et al., 2024; Übler et al., 2023, 2024) and Type 2 AGN (Mazzolari et al., 2024; Scholtz et al., 2025b; Übler et al., 2024).
4.4 The absorbing clouds
As shown in Fig. 7, there is a clear absorption component near the rest-frame centroids of narrow and broad H emission lines in 159717. Such Balmer absorption is frequently seen in spectroscopically confirmed broad-line LRDs revealed by \jwst, with a detection fraction of percent (Juodžbalis et al., 2024a; Matthee et al., 2024). Clearly, the case of 159717 shows that the occurrence rate of Balmer absorption can be even higher as NIRSpec medium-resolution spectroscopy is not effective in selecting such narrow absorption close to the line centroids (see Fig. 7). The absorption in LRDs are unlikely to have a stellar origin, as the absorption is usually deeper than the underlying continuum with a high EW, meaning the absorbing medium must (also) be absorbing the broad Balmer lines. The same situation is seen in 159717 as shown in Fig. 6.
Naively, one can model the absorption as a slab of gas obscuring our line-of-sight (LOS), as done in Juodžbalis et al. (2024a). To produce a strong Balmer absorption, the gas needs to be dense enough to collisionally excite hydrogen to the level , and/or thick enough to trap Ly photons. With the optical depths we fit for the Balmer absorption lines in Table 2, we calculate the column density of the excited hydrogen using
| (3) |
where is the electron mass, is the speed of light, is the ‘Gaussian electron charge’ ( is the electron charge and is the vacuum permittivity), is the oscillator strength, is the central wavelength, and is the integrated optical depth with a dimension of velocity. From the value of we can use \cloudymodels to infer the density and column density of hydrogen, and . Unfortunately, due to the lack of constraints on the ionization fraction, the conversion between and the total hydrogen column density is very uncertain, resulting in poorly constrained (Fig. 11).

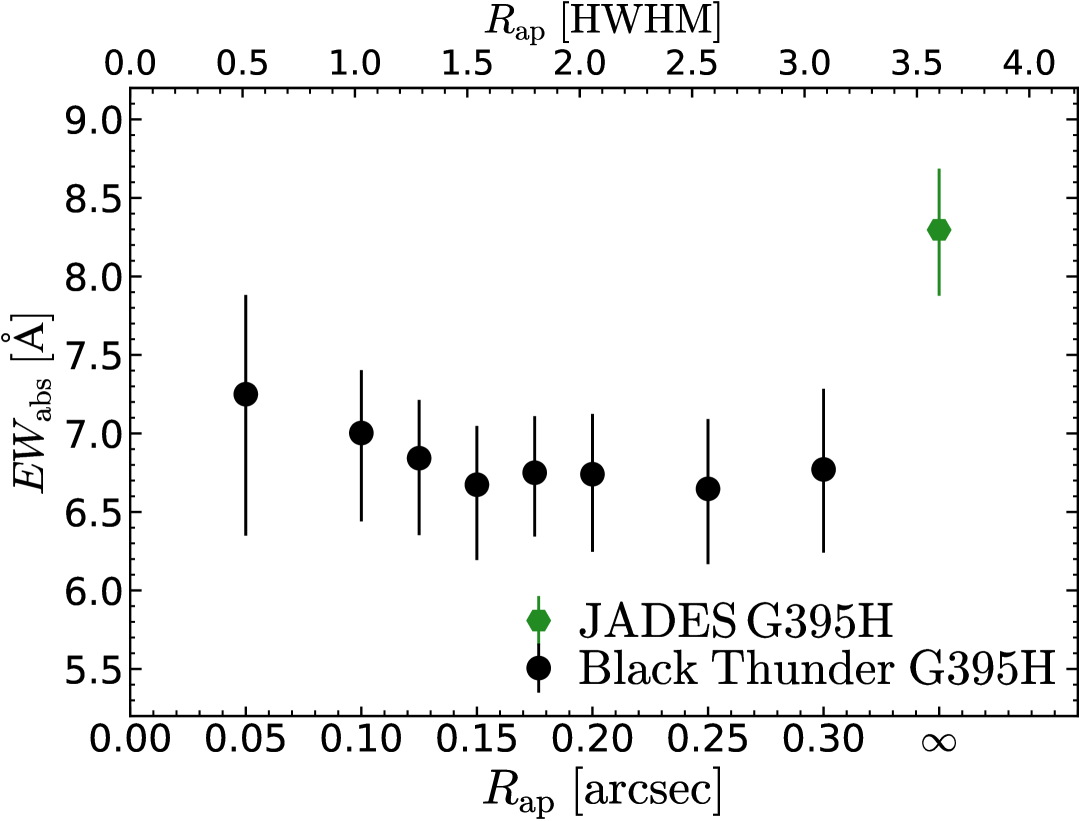
Intriguingly, the EW of the H absorption is different between the JADES and \blackthunderG395H observations. In Fig. 12 we compare the EW measured from JADES (hexagon) to the EWs measured from \blackthunder. To check for systematics, for \blackthunderwe extended the measurements of Section 3.3 to a set of apertures of increasing radius. It is clear that the value from \blackthunderis systematically lower, with 2.6-significance (P-value). This result is unchanged if we repeat the \blackthundermeasurements but modelling only H , without including broad H , hence the systematic difference is not due, e.g., to tying the absorber kinematics and covering factor between the two Balmer lines. Moreover, we can rule out that the observed difference is due to errors in the flux calibration, because EW measurements are completely insensitive to flux calibration. In principle, aperture losses could play a role, since our EW measurements combine flux emitted on different spatial scales; however, the \blackthunderdata also rules out this possibility, because the EW stays constant (within the uncertainties) as we change the aperture radius.
Under the hypothesis that the absorber is in front of both the broad lines and the continuum, the EW of a non-saturated absorber would not change with the underlying continuum. This would suggest that it may be the absorber itself that is varying on a rest-frame timescale of two months. The picture is complicated by the fact that in the JADES observations, the absorber is nearing saturation (; Table 2). New observations are needed to both confirm the time variability, and to establish if it originates in the absorber itself or rather in the underlying continuum and BLR.
5 Satellites
5.1 Aperture spectra
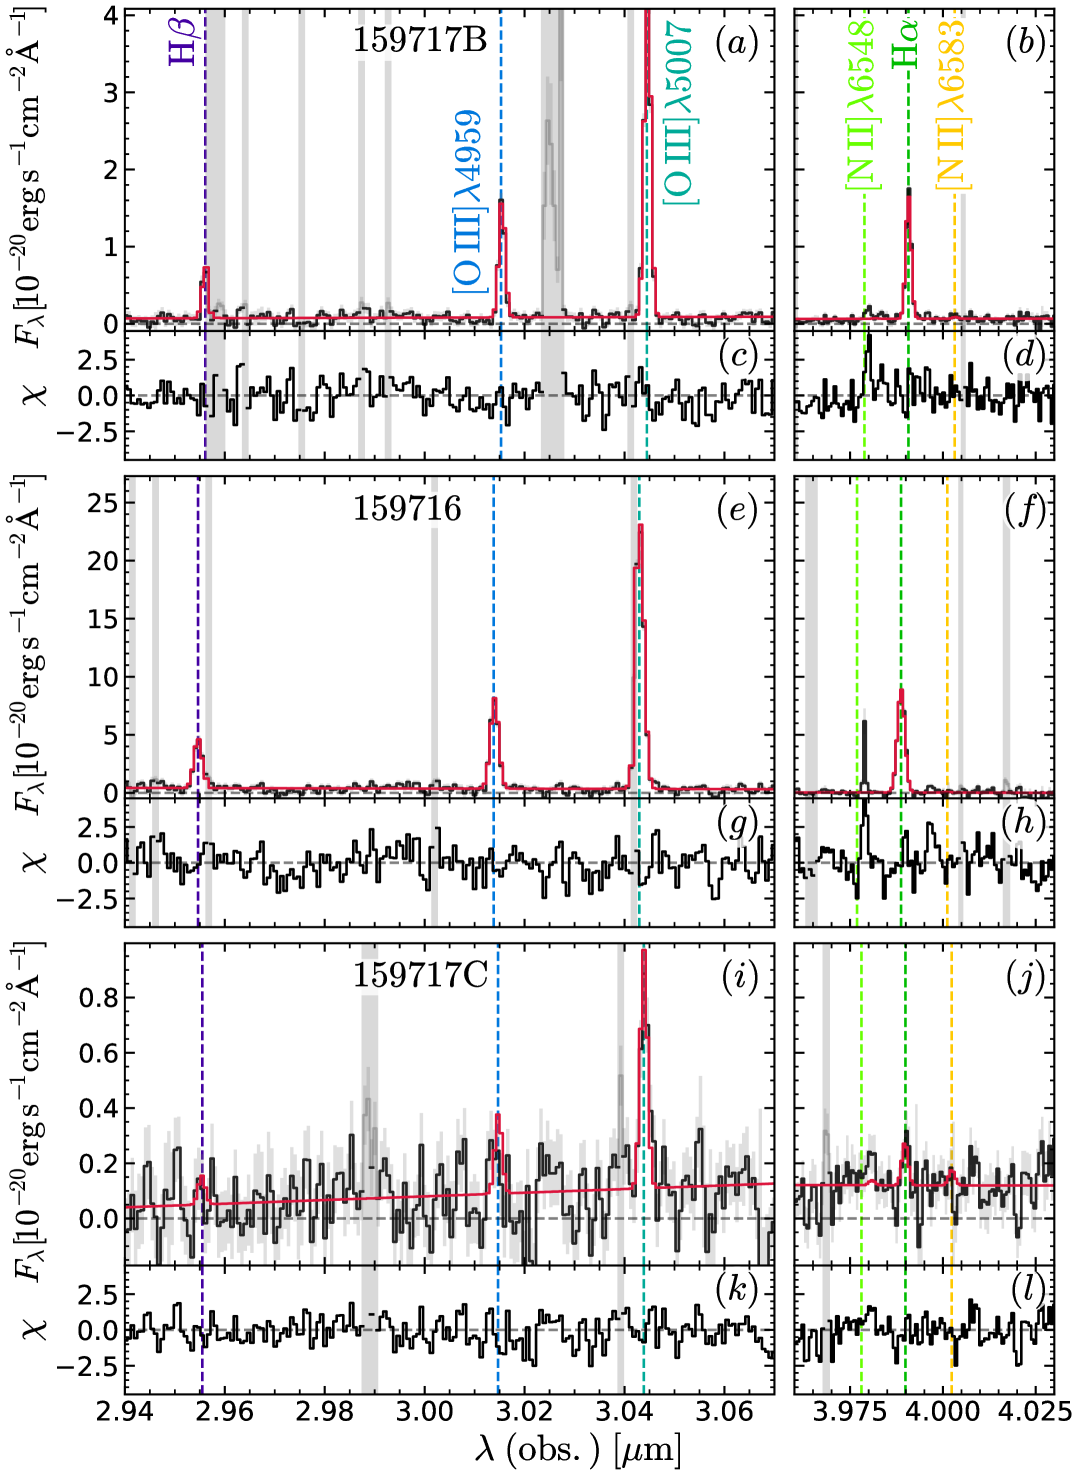
The aperture spectra of three satellites are shown in Fig. 13. 159716 and 159717B are undoubtedly detected and associated with 159717 (panels 13–13). To the south west, we find evidence for a spatially detached emission-line source, detected only in [O iii]5007, which we call 159717C (panels 13 and 13). Below we report the emission-line properties of these three sources, using a simplified version of the model from Section 3.3, where we removed both the broad-line H and H , and the gas absorber.
159717B (Fig. 13–13) is spatially unresolved (Section 3.1) and has Gaussian line profiles with \kms, narrower than for 159717. Using the Balmer lines, and under the same assumptions as for 159717 (Section 3.3), we infer mag, consistent with no dust. We estimate the star-formation rate (SFR) using the H -to-SFR scaling of Shapley et al. (2023). After applying an aperture correction of 1.5, we obtain . We do not attempt to measure a stellar mass for this target, but we note that if it lay on the star-forming sequence it would have a stellar mass , where the lowest value is from Cole et al. (2025, their redshift bin), while the largest value is from the bias-corrected theoretical work of McClymont et al. (2025a) and the corresponding empirical measurements of Simmonds C., (in prep.). Of course, this estimate is very uncertain, not just due to the large scatter about the main sequence (0.3 dex; Cole et al., 2025), but primarily due to the possibility that the galaxy may not lie on the main sequence (e.g., due to environment-driven quenching in close environments; Alberts et al., 2024; D’Eugenio et al., 2025b), and to the possibility that the emission lines are not powered by star-formation photoionization. The source is tentatively detected in the continuum, but this could be due to residual foreground contamination from 159715 and its bright north-east spiral arm (Fig. 2).
159716 (Fig. 13–13) is much more extended. This source is clearly detected in the continuum, both in NIRSpec and NIRCam, hence it is clearly a satellite galaxy with stellar content (Section 5.2). Its emission lines are also Gaussian, but have velocity dispersion \kms, broader than both 159717B and 159717.
The last satellite, 159717C, is a tentative detection (Fig. 13–13). As for 159717B, there is substantial contamination from 159715 in the foreground, hence the continuum level is unreliable. This system has a diffuse morphology. While the SNR is low, three arguments support the detection of this system. In addition to [O iii]5007 in the aperture spectrum (8-detection), we also detect this source in the emission-line maps (Section 5.3). Moreover, there is a marginal detection of H at the same redshift as [O iii]5007 (4-significance). Finally, we have some indications that weak [O iii]5007 emission may be present in the NIRCam F200W-F277W image (Section 5.3), at a location that matches very well the NIRSpec findings. This source has an intrinsic velocity dispersion \kms, which is large for such a faint source. We also find a .
Unfortunately, none of these satellites has useful constraints on the dynamical mass. For 159717B and 159717C, we lack an accurate measurement of their size and morphology. Using the same formula as in Section 4.2, and adopting conservatively pc, and , we obtain and for 159717B and 159717C, respectively. For 159716, the use of the virial theorem seems inappropriate, since this galaxy may be out of stationary equilibrium, as discussed in Section 5.3.
5.2 Stellar mass measurement for 159716
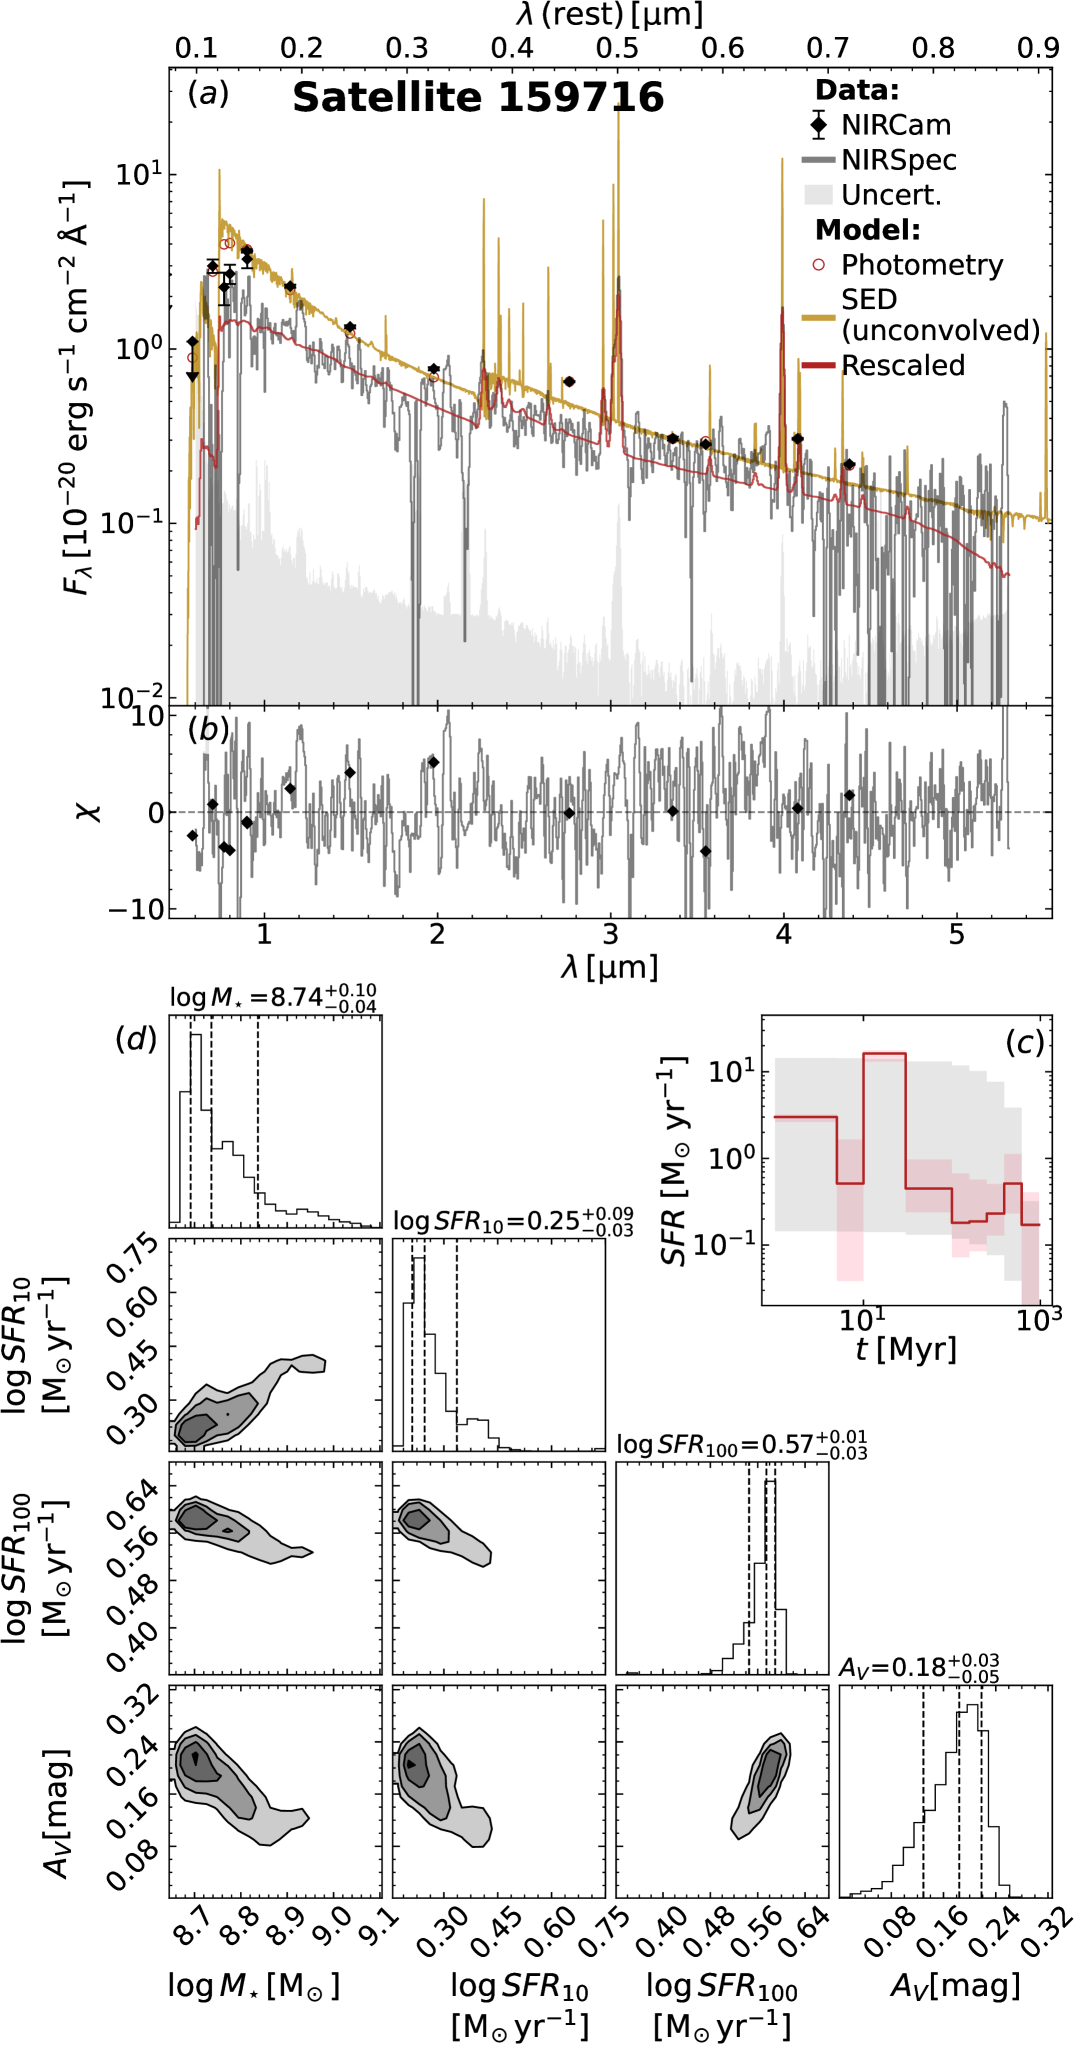
We measure the stellar mass of only one galaxy, 159716. Our method of choice is the Bayesian inference framework \prospector(Johnson et al., 2021). The SED model is derived from Tacchella et al. (2022), while the comparison with observations follows the setup of D’Eugenio et al. (2025d), with improvements described in Baker et al. (2025); Carniani et al. (2025). Here we summarize the most important aspects. We use stellar-population template spectra derived from the mist isochrones (Choi et al., 2016) and C3K model atmospheres (Conroy et al., 2019), synthesized using fsps (Conroy et al., 2009; Conroy & Gunn, 2010). The nebular continuum uses pre-computed cloudy models (Byler et al., 2017). The dust attenuation law follows Noll et al. (2009) and the implementation of Kriek & Conroy (2013). A dual dust screen captures attenuation due to diffuse dust, and the additional birth-cloud attenuation toward star-forming regions (Charlot & Fall, 2000), following the parametrization of Tacchella et al. (2022). We adopt a non-parametric star-formation history (SFH) with 9 time bins between and the epoch of observation . The first four bins are manually set to , 10, 30, and 100 Myr, while the remaining five bins are logarithmically spaced between 100 Myr and . We use a ‘rising’ probability prior (Turner et al., 2025), where the SFH follows the increasing mass accretion rate on dark-matter haloes (Tacchella et al., 2018). We also use a 2nd-order Chebyshev polynomial to rescale the best-fit model to the level and shape of the observed spectrum; this means that our extensive quantities (\mstar, SFR) are driven by the photometry, while the high-frequency spectral information (e.g., emission-line ratios) is preserved. Overall, this model has 22 free parameters, and we calculate the posterior probability distribution using the Markov-Chain Monte-Carlo method. The data are shown in Fig. 14, with the \blackthunderaperture spectrum in grey. There is a systematic flux mismatch between the NIRCam photometry and NIRSpec spectrum, probably due to the photometry suffering from contamination while the spectroscopy suffers from aperture losses. The spectrum of this satellite galaxy displays a clear Balmer break. Unlike for LRDs, the shape of the continuum is blue both bluewards and redwards of the break, as expected from a Balmer break due to an older stellar population. This break therefore suggests that there was likely a decline in the SFR in the last few 10’s million years. The Balmer break is also supported by NIRCam, since the flux in F335M and F356W (which does not have strong line contamination) is considerably higher than the SED extrapolation from the UV. The \prospectorSFH shows a drop, which drives the observed Balmer break. We show only a subset of the model parameters (Fig. 14), highlighting the most relevant physical properties. In particular, we infer .
5.3 Spatially resolved gas kinematics
To fit the spatially extended emission, we use \qubespec(Scholtz et al., 2025a). The narrow lines are modelled as single-component Gaussians, and broad Gaussians are added to model the BLR H . [O iii]4959,5007 can also use a broader component, but a single component is favoured everywhere, which is in agreement with the expectations, since we barely detect a second, broader [O iii]4959,5007 component even in the aperture-integrated spectrum, which has much higher SNR than individual spaxels (Section 3.5). For the same reason, no model of the BLR H is used.
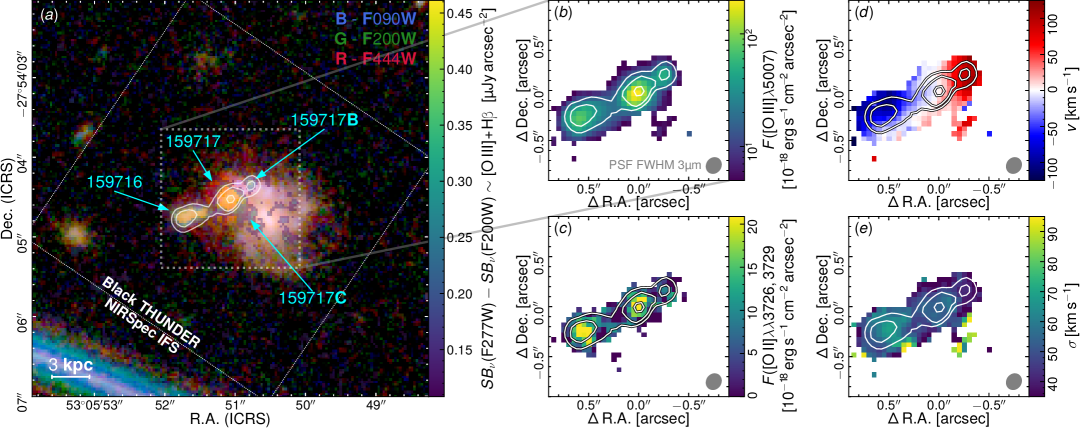
The SNR map of [O iii]5007 is overlaid as white contours on the NIRCam RGB image in Fig. 15, highlighting values of 15, 30 and 60. The colour bar measures the emission-line map derived from NIRCam F277W-F200W (Section 3.1), also overlaid in transparency. The two independent emission-line maps match reasonably well. NIRSpec detects an extended ionized-gas bridge connecting all three of 159716, 159717 and 159717B, with a noticeable gap separating 159717C (Fig. 15). The [O ii]3726,3729 emission-line map from the prism observations (Fig. 15) shows significant detections both in 159717 and in 159716, indicating the presence of some lower-ionization gas too, except for 159717C.
The velocity map (Fig. 15) displays a smooth gradient across the entire gas distribution, with an end-to-end amplitude of 200 \kms, while the velocity dispersion map is relatively low at around 50 \kms(Fig. 15). There is a 70-\kms peak about one spaxel east of the centre of 159716, and a second, weaker peak between 159717 and 159717B. The fact that is overall narrow, with the highest values found between the surface-brightness maxima suggests a merger scenario, where gas is being removed from the galaxies and has formed an extended, common reservoir. Alternatively, the superposition along the line of sight of multiple systemic kinematic components could also broaden the velocity dispersion. However, in this case the observed broadening (50–70 \kms) requires such a small difference in systemic velocity, as to make interaction a more plausible scenario. Significant disturbance of stationary equilibrium can be inferred from the kinematics of 159716; for this galaxy, the photometric major axis is aligned with the kinematic axis, implying prolate rotation which is dynamically unstable for such an elongated object (Fridman & Poliachenko, 1984; Merritt & Hernquist, 1991). The disturbed nature of 159716 suggests an advanced interaction stage. This hypothesis resonates with the presence of the fainter 159717B on the far side with respect to 159717, possibly due to tidally stripped material during the first passage. In this case, 159717 would be interpreted naturally as the most massive of the three systems. Overall, these observations imply that 159717, far from being isolated, is located at the centre of a relatively dense region, where gas is collapsing , leading to both star formation and SMBH accretion.
159717C instead represents a separate case; it has velocity dispersion \kms, which is small, but noticeably higher than the rest of the system – a fact that is even more striking when we recall that this is the faintest of the satellites. This larger dispersion is confirmed by the aperture spectra, although the measurement uncertainties are large, due to the low SNR. This source could represent a tidally disrupted system or a tidal tail. Its location, orthogonal to the axis connecting 159717B to 159716, disfavours an origin from either of 159717, 159717B or 159716, but we cannot fully rule out 159717C being a smaller system involved in the merger. Still, the relatively large dispersion, together with the non detection in both H and H (the latter line has SNR = 4), could point to 159717C being a ionized gas outflow, or, alternatively, a gas cloud photoionized by the AGN. It is located at right angles to both the elongated gas distribution and to the spatially resolved component of 159717 (Section 3.1; Table 1), which also favours the interpretation of an outflow or photoionized cloud. If we accept the hypothesis that 159717 is the dominant galaxy in the system, and given the clear presence of a SMBH, it is natural to attribute the origins of this outflow to 159717 itself.
5.4 Gas ionization sources
We do not detect [N ii]6583 or other low-ionization lines useful for the BPT (Baldwin et al., 1981) and VO diagrams (Veilleux & Osterbrock, 1987), but thanks to the depth of these observations, we can provide stringent limits on the [N ii]6583/H . In Fig. 16 we highlight the four components of the system around 159717 as large diamonds, which are colour coded to match the segmentation map in panel 16. The largest three systems, 159717, 159716 and 159717C display [O iii]5007/H ratios (or lower limits) consistent with star-forming galaxies (Cameron et al., 2023) and type-1 AGN (Juodžbalis et al., 2025) at the same epoch. These three galaxies have very similar locations on the BPT diagram, despite 159717 being seemingly dominated by AGN emission. In Fig. 16 we also show individual spaxels, with the same colour coding. When detected, [O iii]5007/H displays a relatively broad range of values, from 3 to 12, including high-SNR detections. This variation suggests that the ionization conditions vary across the system. This is confirmed by the [O iii]5007/[O ii]3726,3729 map (Fig. 16), derived from fitting the \blackthunderprism data. The Balmer decrement map is shown in Fig. 16; in 159717 the decrement is larger than the Case-B value of 2.86, while 159716 shows no appreciable deviation, indicating little dust content. Overall, these findings are consistent with the spatially integrated view of star-forming galaxies and LRDs at (Shapley et al., 2023; McClymont et al., 2025b; Sandles et al., 2024; Taylor et al., 2024; Juodžbalis et al., 2025).
Probably the most interesting source is 159717C. While the lower limit on [O iii]5007/H is not constraining, in Fig. 16 we show instead the ratio , where we treat the 4-measurement of H as a detection, and we derive H from Case-B recombination and no dust. This lower limit is larger than the integrated value for the other three galaxies, suggesting a different source of photoionization. The harder ionizing spectrum implied by the large inferred [O iii]5007/H supports the hypothesis that 159717C is not a star-forming clump or tidal tail, but either an outflow, or a AGN-illuminated cloud (Section 5.3).
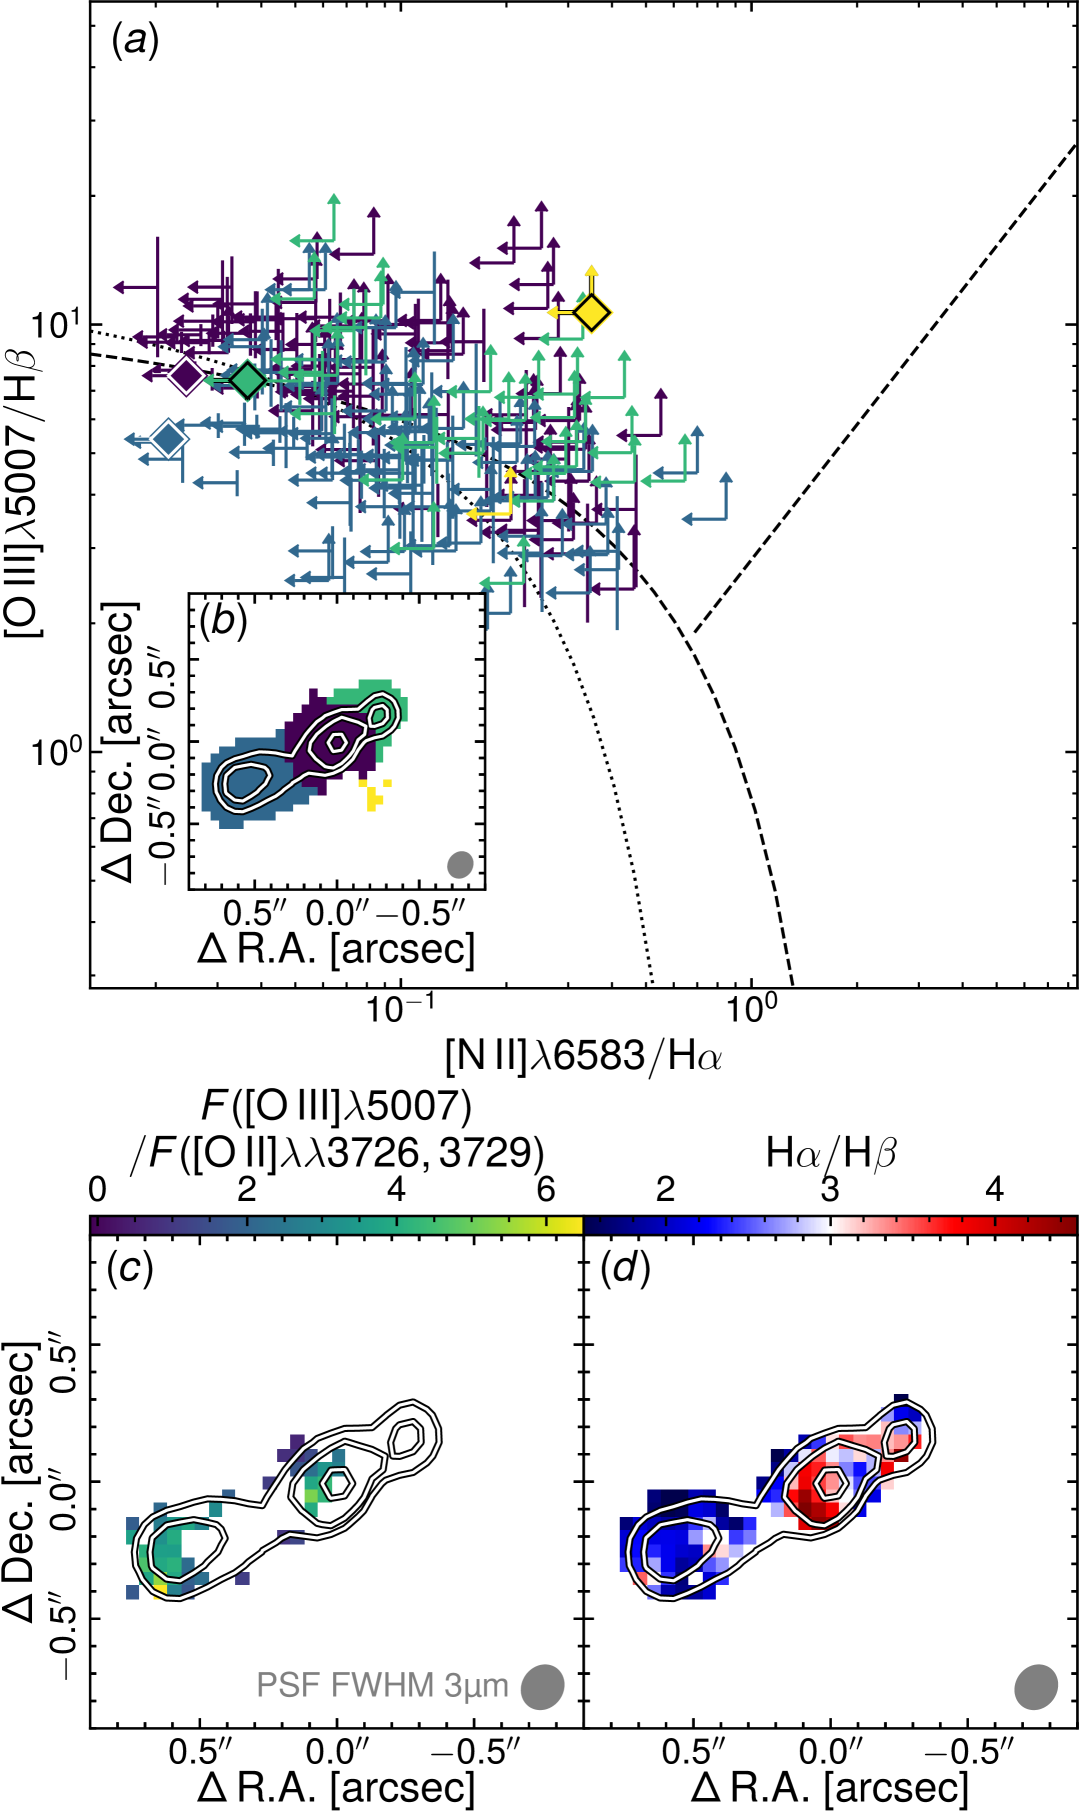
6 Discussion
6.1 Overmassive black hole
The stellar mass of the host galaxy of 159717 is difficult to determine, due to a combination of intrinsic and accidental difficulties (sections 3.9 and 4.2). Nevertheless, maximal stellar models for this kind of source consistently exceed the physical limit imposed by dynamical mass Wang et al., 2025; \al@juodzbalis+2024b; Ma et al., 2025b; Ji et al., 2025; D’Eugenio et al., 2025a; Akins et al., 2025a. For this reason, projection effects alone cannot explain why is very common among broad-line AGN with ‘v’-shaped SEDs. Unless one assumes a preferential viewing angle to the host galaxy, the maximal mass scenario seems ruled out. In addition, the finding of time variability in the rest-frame optical continuum in Abell 2744-QSO1 (Ji et al., 2025) disfavours a stellar-dominated continuum in 159717 too, since the two objects share at least four similarities: the ‘v’-shaped SED, a relatively high /\mdynratio (discussed below), a broad H line that is best fit by a double Gaussian, and a strong H absorber in the rest frame (D’Eugenio et al., 2025a). In Fig 17 we show 159717 on the –\mstarplane, together with sources from the literature. Since we cannot measure a reliable \mstar, we use \mdynas an upper limit; the conclusion of an over-massive black hole (relative to local scaling relations) seems thus warranted, in agreement with previous findings in the redshift range (Harikane et al., 2023; Maiolino et al., 2024). While recent works have challenged the inference of over-massive black holes (Sun et al., 2025; Li et al., 2025), both these works focus on lower redshifts and more massive galaxies.
It is important to note that, in addition to the uncertainties on their \mstar, LRDs also have uncertain . While virial SMBH mass estimates from single-epoch spectra are widely used, they are subject to systematic uncertainties from assumptions about the geometry, kinematics, and ionization of the BLR. Calibrations can vary by up to 0.5 dex depending on the line used (e.g., H vs C iv1548,1551; Bertemes et al., 2025) and the adopted virial factor or line width (e.g., Dalla Bontà et al., 2025). These systematics must be kept in mind, especially when comparing across redshifts, and particularly for a seemingly new class of AGN, such as LRDs. While a few direct measurements do exist beyond the local Universe (Abuter et al., 2024), these do not extend to LRDs.
More recently, Rusakov et al. (2025) proposed that broad-line profiles that cannot be modelled by a single Gaussian are best modelled with an exponential profile, which represents the effect of electron scattering by ionised gas. With their approach, the intrinsic FWHM is much narrower than what inferred from a single-Gaussian fit, leading to much smaller SMBH masses. However, since we use two Gaussians, and given the inferred flux ratio between the two components, the decrease in FWHM between the fiducial fit (Table 2) and the exponential fit (Appendix D) is only a factor of two, leading to four times smaller SMBH mass of . Even with this reduced value, 159717 remains above the local –\mstarrelation of Reines & Volonteri (2015), indicating that it is overmassive under the scenario of Rusakov et al. (2025). This demonstrates that overmassive black holes can exist even against the most conservative modelling assumptions.
Our results are consistent with the redshift evolution between a regime of large –\mstarscatter at early epochs and the settling of the local scaling relation around , as proposed by Juodžbalis et al. (2025). In contrast to stellar mass, our target is fully consistent with the –\mdynrelation (Fig. 17), in agreement with the sample of Maiolino et al. (2024).
It is interesting to note that both the stellar mass and the upper limit on the dynamical mass of 159716 are of the same order as the dynamical mass of 159717. If true, this would imply that we are witnessing a major merger, which intuitively seems at odds with the disrupted nature of 159716. Admittedly, this different behaviour could also be explained by an encounter between galaxies of similar mass but significantly different size, such that the more diffuse nature of 159716 relative to 159717 could have made the former more susceptible to external perturbations, unlike 159717.
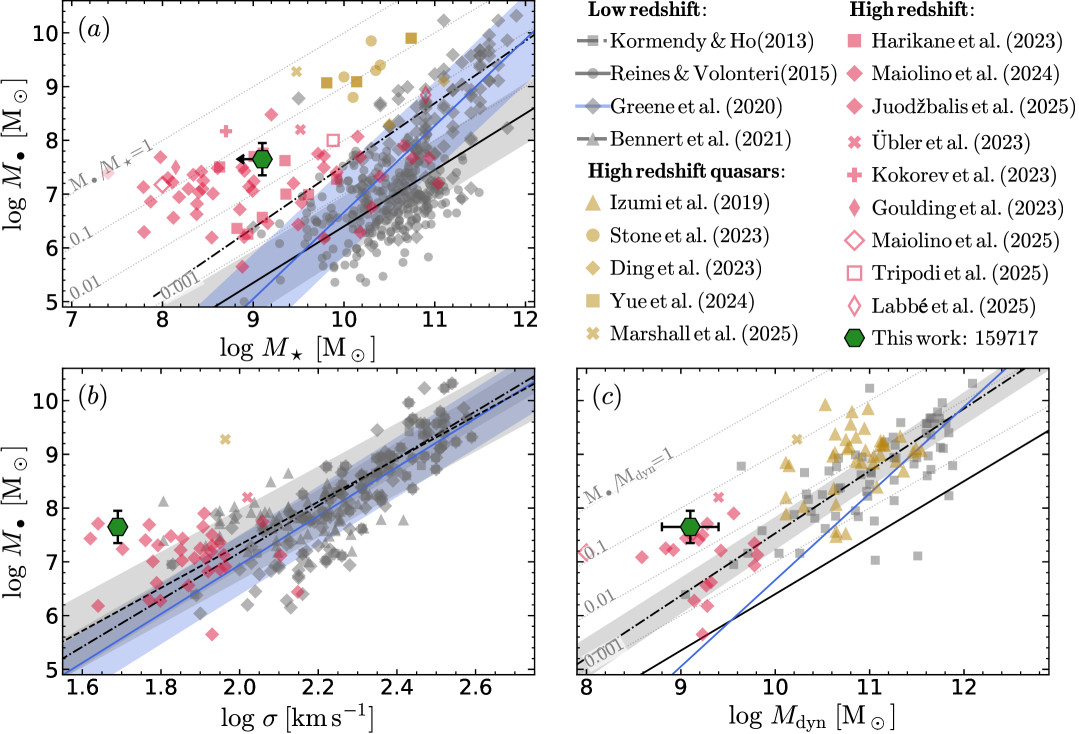
6.2 Gas metallicity
For the metallicity, we find a gas-phase value of , but these measurements are subject to large uncertainties, due to insufficient information to explore the possibility of a multi-zone ISM. The key unknown is the possible presence of a high-density zone () in the narrow-line region (e.g., Binette et al., 2024). If present, this zone would significantly affect the [O iii]4363/[O iii]5007 ratio, yielding a higher , a higher emissivity, and, therefore, lower metallicity. The auroral-to-strong O iii ratio may be enhanced in the densest zone of the narrow-line region due to collisional suppression of [O iii]5007. This would explain both the high \nelecinferred from high-ionization species in local narrow-line AGN (; Binette et al., 2024) and the anti-correlation between the ratio [O iii]5007 to narrow H and [O iii]4363/[O iii]5007 in type 1 AGN (where, according to the unified model of AGNs, we should be seeing the deepest zone of the narrow-line region). As a reference, from the observed [O iii]5007/H and assuming K and , \pynebgives dex, an O++ abundance that is three times higher than the fiducial value reported in Table 2. Nevertheless, the scatter about the metallicity relations at these redshifts is large, hence our value is still plausible for a galaxy with the dynamical mass of 159717. We do not attempt a multi-line approach due to the relatively low number of emission lines, with key density diagnostics undetected (C iii]1907,1909, [S ii]6716,6731), or not adequately resolved ([O ii]3726,3729).
We find substantial dust attenuation through the narrow-line ratios, in agreement with previous works (D’Eugenio et al., 2025a). This result is somewhat in tension with two findings. On one hand, our dust attenuation is larger than for typical star-forming galaxies at (Shapley et al., 2023; Sandles et al., 2024). This could be alleviated by attributing some of the narrow-line emission to AGN photoionization. In addition, LRDs seem to require low dust attenuation, based on constraints from mid- and far-infrared observations (Casey et al., 2024; Akins et al., 2024; Setton et al., 2025; Casey et al., 2025).
6.3 The broader picture
The fact that 159717 is found at the centre of an extended distribution of ionized gas seems significant. Indeed, many LRDs seem accompanied by fainter blue dots (Rinaldi et al., 2024; Chen et al., 2025), suggesting a physical association. The presence of dense gas clouds in 159717 could be due to gas being accreted towards the central regions, aided by gravitational torques during the ongoing merger with 159716. LRDs are certainly capable of driving outflows, which are generally observed through nuclear hydrogen absorption Matthee et al., 2024; \al@juodzbalis+2024b; Rusakov et al., 2025, or through broad, centrally concentrated [O iii]5007 emission (\al@juodzbalis+2024b). In 159717, for the first time, we see tentative evidence of a spatially detached ionized gas outflow (Section 5). If confirmed, this detection could indicate past feedback. The gap between this cloud and 159717 may indicate that feedback was interrupted, perhaps in relation to the recent merger with 159716. For instance, if the rate of gas accretion towards the central regions was too high, it could have overwhelmed the outflows driving an accumulation of gas.
This scenario would be in agreement with recent works, which have highlighted the complex morphology of many LRDs (Rinaldi et al., 2024; Torralba et al., 2025). Although there are notable examples of LRDs without prominent companions (e.g., Furtak et al., 2023, 2024; Naidu et al., 2025; Carranza-Escudero et al., 2025), several others are known to have neighbours (Tanaka et al., 2024; Mérida et al., 2025).
6.4 Gas absorber
The observed H absorption is undoubtedly originating in a gas cloud between the BLR and the observer. A stellar origin is excluded because when measuring the EW of H with respect to the continuum (by subtracting the un-absorbed model BLR from the data), we find , much higher than in any stellar-atmosphere model. Similarly, if the absorber was not positioned in front of the BLR, the absorption depth would reach unphysical negative values. However, even with high-quality, high-resolution data, it is impossible to provide a tight constraint on the total column density, due to the uncertain conversion between the hydrogen population and the other levels, and between the bound and ionized hydrogen populations. This uncertainty is reflected in the broad range of column and volume densities that can reproduce our observations (Fig. 11). Tighter constraints are available when H absorption is also clearly detected (Juodžbalis et al., 2024a), but this would require deeper spectra – particularly for sources with large Balmer decrement, such as LRDs (Brooks et al., 2024; Furtak et al., 2024). In the future, deep \jwstprograms using high-resolution G235H and G395H gratings may be able to better characterize Balmer absorption in AGNs at redshifts . The range would additionally cover He i1.08\mum, useful to characterize the ionization state of the absorbing gas and thereby the distance of the absorber to the black hole accretion disk (Juodžbalis et al., 2024a). From current data, we can constrain the total column density of hydrogen to be , with the upper range reaching the Compton-thick threshold; such high values have been proposed to explain the low X-ray to bolometric luminosity ratio of low-luminosity AGNs at Maiolino et al., 2025b; Yue et al., 2024b; \al@juodzbalis+2024b, and would be consistent with the non-detection of 159717 in X-rays, despite lying in one of the deepest zones of the 7-Ms Chandra mosaic of GOODS-S (Luo et al., 2017).
Just like for Abell2744-QSO1 (Furtak et al., 2023, 2024), also in 159717 we can rule out completely a stellar origin of the absorber, based on the same two arguments as used in D’Eugenio et al. (2025a). First, the absorber EW is too large to absorb only the continuum. As noted also by \al@juodzbalis+2024b, the depth of the absorption is so large that if we were to remove the BLR line, we would be left with negative flux. Additionally, thanks to the superior resolution of G395H, we can infer that the absorber turbulence is \kms. This value is similar to what has been found independently in Abell2744-QSO1 by Ji et al. (2025) and D’Eugenio et al. (2025a, using respectively the shape of the Balmer break and the shape of H absorption). Such a large turbulence parameter is an order of magnitude higher than what is found in the stellar atmospheres of luminous stars (Smith & Howarth, 1998), hence constituting a second, independent argument ruling out stellar absorption. To these two compelling arguments, we can add EW variability (Section 4.4). While admittedly tentative, time variability is completely inconsistent with stellar absorption, while being in perfect agreement with a scenario where the absorbing clouds are located relatively near to the SMBH.
For a typical gas temperature of K, the speed of sound is of order of 10–15 \kms, implying a Mach number around 10 for the absorbing gas. Although it remains unclear how such high turbulence is sustained, the consistency with previous LRD studies reporting supports the measurement (Ji et al., 2025; D’Eugenio et al., 2025a; Naidu et al., 2025). Similar turbulent velocities are also required to explain Fe ii emission regularly seen in the UV spectra of local AGN and QSOs, yet the physical origin of this turbulence remains unresolved (Baldwin et al., 2004).
As an alternative to absorption, scenarios such as Balmer-line resonant scattering have been considered (Naidu et al., 2025). In this case, the intrinsic Balmer lines would be much narrower than the observed profiles, with the broadening primarily due to scattering. A key advantage of this scenario is that it explains why the absorber appears near rest-frame wavelengths. However, this mechanism would likely produce different line profiles for H and H . While our data cannot rule out such differences, deep observations of bright targets e.g., \al@juodzbalis+2024b; Ma et al., 2025a will be able to test this possibility.
6.5 Towards atmospheric models?
An intriguing finding is that the optical depth of H and H are inconsistent with the absorption cross sections of these two lines, which are set by the oscillator strengths. In our model, this ratio should be exactly equal to the value dictated by atomic physics, which is 0.139. While of course this mismatch could be only apparent, due to the low SNR of our observations, this seems to be the case in other objects too e.g., D’Eugenio et al., 2025a; PID 4106, priv. comm., hence we are inclined to believe this observation to be worth further tests. At face value, the only possible explanation then is that a simple absorber modelled as a gas slab may be inadequate, much like in the atmosphere of A-type stars the absorption strength of H and higher-order Balmer lines is larger than for H – contrary to the expectations from the relative cross sections of these lines. This explanation could imply that H and H arise from different depths in the absorbing gas, mimicking what happens in stellar atmospheres. For reference, the density where H arises in A-type stars is , larger but not too different from the findings of Naidu et al. (2025).
6.6 Absorber kinematics
Gas absorbers along the line-of-sight of AGNs are interpreted as inflows/outflows Matthee et al., 2024; \al@juodzbalis+2024b; Wang et al., 2025. In our case, the absorbing cloud is consistent with no velocity component along the line of sight (relative to the systemic velocity determined from the narrow lines). In principle, this low projected velocity could be due to orbital motion of a cloud bound to the SMBH. In the local Universe, this configuration would require both a high-inclination orbit, line-of-sight alignment and the right orbital phase, as found in local AGNs (NGC 1365; Maiolino et al., 2010). However, the combination of all these occurrences is unlikely, making NGC 1365 one of very few cases where the inclination is suitable for observing transiting clouds. The particular geometric configuration seen in NGC 1365 should not be common at either. Moreover, in this case, there is no direct evidence of a dusty torus, with several claims of LRDs being deficient in mid-IR emission (e.g., Wang et al., 2025; Setton et al., 2025; de Graaff et al., 2025), and the highest-redshift MIR detection of an LRD unambiguously attributed to a dusty torus being at (\al@juodzbalis+2024b). A rotating configuration is therefore possible in our case, although other absorbers have been measured with line-of-sight velocities between and Matthee et al., 2024; \al@juodzbalis+2024b; Rusakov et al., 2025, which are clearly inconsistent with rotation and favour non-equilibrium configurations.
While the remarkably low outflow velocity could be due to projection effects (with the inclination of the outflow axis close to °), this solution seems disfavoured too. For example, observing only from a typical deprojected outflow velocity of 350 \kms(Carniani et al., 2024), we would need which requires °. For a randomly oriented galaxy, the corresponding probability is only . While this is not a small value, 159717 is already the third case of an absorbing cloud very near to rest frame (D’Eugenio et al., 2025a; Naidu et al., 2025), out of LRDs with clearly detected absorption. This suggests that the low velocity is not due to projection, but reflects low intrinsic velocity.
This scenario would indicate therefore a long-lived cloud lingering near the SMBH, or even a ‘stalling’ outflow, caused by insufficient AGN power or by inefficient coupling (Arakawa et al., 2022; Fabian et al., 2008). Insufficient energy seems at odds with our relatively high Eddington ratio (). The other possibility, that feedback is inefficient, e.g. due to poor coupling with the gas, seems also unlikely. Such a scenario could be plausible in low-metallicity gas, if we assume that most of the opacity is driven by metals and dust (Fabian et al., 2008). However, in our case, the galaxy appears decidedly dusty, based on the narrow-line ratios ( mag) and the metallicity of the host galaxy seems fairly high too (; Table 2). Furthermore, our metallicity values could be underestimated, since any contribution from high-density regions to the [O iii]4363 emission would decrease and hence further increase metallicity (Section 6.2).
Kido et al. (2025) argue that typical LRDs occupy a region of the –\mstarplane where strong outflows are expected. The general absence of such outflows in sources like 159717 therefore suggests an alternative scenario: the dense gas envelope model proposed by Naidu et al. (2025), de Graaff et al. (2025), and Kido et al. (2025). In the case of 159717, not only is the combination of its large /\mstar ratio and lack of outflows notable, but its relatively high and rest-frame Balmer absorption are also consistent with the predictions of the envelope model.
6.7 Breathing-mode accretion?
Hydrodynamic simulations of cold-gas accretion onto SMBHs which include radiative transfer suggest a self-regulated behaviour, with highly turbulent gas flows near the ionization front (Park et al., 2017; Inayoshi et al., 2022), but even in this case the turbulence is ten times lower than what inferred from our measurements.
Park et al. (2017) also find that during quiescent periods between bursts of accretion, the ionized bubble around the SMBH shrinks in size, leading to an increase in the density of the gas near and before the ionization front. Moreover, the dense gas is not dissipated, but following the accretion rate on the central SMBH, gives rise to an oscillatory behaviour of expansion and contraction. This ‘breathing mode’ of the gas could explain the observation of H absorption with a range of inflow, outflow, and rest velocities. Depending on the distance travelled, the gas would spend different amounts of time near the inversion points. The formation of a shell of neutral gas around accreting black holes is also consistent with the models of Milosavljević et al. (2009, for ) and Park & Ricotti (2012, for ), thus further supporting the presence of gas capable of Balmer absorption. If this breathing-mode picture is true, then the relative abundance of absorbers with different velocities could hold valuable information about the interface between the accreting SMBH and the host galaxy. As we have seen, the incidence of Balmer absorbers may be underestimated by current medium-resolution observations (Section 3.8). This is particularly true at high redshifts, where most LRD spectra use either the NIRSpec medium-resolution gratings or the prism (but to some extent it is a problem also in the local Universe, where large survey such as SDSS and LAMOST have , in the relevant wavelength region). Clearly, current \jwst/NIRSpec observations underestimate the total incidence of absorbers. The problem must be relatively more severe for rest-frame absorbers, since symmetric narrow-line infill would be more effective at removing the absorber, and would still result in a symmetric line profile. This suggests that the fraction of red- and blue-shifted absorbers relative to rest-frame ones could also be over-estimated by current data.
Still, key issues with the model of Park et al. (2017) remain, most notably the large discrepancy in density between their simulations and those inferred for LRD absorbers \pcm[3]; \al@juodzbalis+2024b; Ji et al., 2025; Naidu et al., 2025. The models of Park et al. (2017) reach maximum densities of only . This discrepancy may be due to the ad-hoc assumptions of the Park et al. (2017) simulations, which may not consider the appropriate cosmological context for LRDs – particularly if LRDs occupy somehow atypical dark-matter haloes compared to the general galaxy population (e.g., Pacucci & Loeb, 2025). For instance, theory supports the possibility of rapid gas inflow towards the central region of galaxies (e.g., Tacchella et al., 2016). While these results apply to dark matter haloes that are more massive than for LRDs (Pizzati et al., 2025), recent zoom-in simulations such as THESAN-Zoom (Kannan et al., 2025; McClymont et al., 2025a) suggest that the accretion rate onto the central regions of lower-mass, high-redshift galaxies can be substantial too, potentially supporting the accumulation of high-density gas near the SMBHs powering LRDs. However, while THESAN-Zoom preserves the cosmological context (Kannan et al., 2025), it still lacks the spatial resolution of high-resolution simulations like those of Park et al. (2017) and thus it cannot resolve the immediate environment around SMBHs. A promising path would be to use constraints from zoom-in simulations like THESAN-Zoom to supply the boundary conditions for even higher-resolution simulations targeting galactic nuclei.
6.8 Soft ionizing spectrum
The absence of high-ionization lines, including metallicity independent lines, such as He ii, could be due to an intrinsically red SED, or to ionizing photons being absorbed by hydrogen (Inayoshi & Maiolino, 2025; Ji et al., 2025; Naidu et al., 2025). This would be in agreement with the weakness of some bright LRDs at mid- and far-IR wavelengths (Setton et al., 2025). This hydrogen absorption should drive damped Ly absorption (DLA) and possibly a Balmer break, which are not seen in this and in many other LRDs (e.g., Greene et al., 2024; Rusakov et al., 2025; Juodžbalis et al., 2025). Arguably, the Balmer break could be hidden by dust reddening, which in this and in other objects is inferred independently from the Balmer decrement e.g., Killi et al., 2024; \al@juodzbalis+2024b; D’Eugenio et al., 2025a, or it could be masked by emission from the host galaxy (Naidu et al., 2025). Either way, if Balmer breaks were common to all LRDs (whether hidden or not), we should always see Balmer-line absorption. While this is seemingly contradicted by current observations, we showed that this conclusion may be driven by inadequate spectral resolution (Section 3.8). Future surveys using high-resolution spectroscopy would be an easy way to check the incidence of (possibly hidden) Balmer breaks.
7 Conclusions
We presented the broad-line AGN 159717 at , observed by the JADES and \blackthunderprogrammes using \jwst/NIRCam, NIRSpec/MSA in multiple dispersers, and NIRSpec/IFS. While a full analysis of this system is complicated by the foreground system, extensive \jwstdata and deep, multi-epoch high-resolution observations provide new insights into the nature of low-luminosity, ‘Little Red Dot’ AGN.
-
•
The prism spectroscopy shows a ‘v’-shaped continuum spectrum (Fig. 1), characterizing this source as a LRD. In the medium- and high-resolution spectrum, the H line has multiple components, including two broad Gaussians, with an overall broad-component width . [O iii]5007 has a narrow (). Combined, this is evidence for a broad-line region.
-
•
The resulting SMBH mass of dex places 159717 very near the scaling relation of nearby galaxies. From the dynamical mass, used as an upper limit on \mstar, we infer that the SMBH is overmassive relative to the local scaling relations (Fig. 17).
-
•
The overmassive nature of 159717 remains true (but less severe) even if we model the broad line as a single Gaussian plus electron scattering (Rusakov et al., 2025).
-
•
The metallicity of this system from the direct method is 0.06 \Zsun; while 159717 is metal poor, it is far from pristine, also in agreement with the large Balmer decrement of the narrow Balmer lines ( mag).
-
•
Far from being isolated, 159717 is found in the process of interacting with a companion, 159716, in what is a possible major merger. Interestingly, 159716 exhibits a Balmer break likely driven by a recent period of lowered star formation. Another source, 159717B, may be material stripped from 159716, while the whole triple is immersed in a pool of [O iii]5007 emitting gas. The merger may be helping in funnelling gas towards the central regions of 159717, ultimately feeding the SMBH.
-
•
Despite their differences in luminosity, morphology, and AGN presence, the three sources have similar ionization properties, such as a similar location on the BPT diagram.
-
•
One more source, 159717C, is spatially detached. Its higher ionization and dispersion suggest a possible outflow origin. If confirmed, this would be the first evidence of kpc-scale AGN feedback in a LRD.
-
•
H presents clear absorption with velocity and velocity dispersion of and . We interpret the low projected velocity and large turbulence as a ‘stalling’ outflow, or lingering gas cloud.
-
•
Intriguingly, there is tentative evidence (2.6 ) of time variability in the EW of the H absorber. If confirmed, this would indicate a highly dynamic environment.
-
•
This LRD, like others, lacks high-ionization lines, which could be due to hydrogen bound-free absorption. We do not observe a Balmer break, but this could be due to dust attenuation, since dust is seen in the narrow lines too. If Balmer breaks were widespread in LRDs (including many hidden by dust), this should still give rise to Balmer line absorption.
-
•
We highlight that the absorber in 159717, despite being clearly evident and even dominant in the G395H observations, is not detected in the medium-resolution G395M data, implying that current incidence of absorbers may be severely underestimated.
These findings resonate with earlier results pointing to LRDs being ‘more than just a dot’ (Rinaldi et al., 2024). The presence of rest-frame Balmer absorption, determined here with unprecedented precision, highlights how dense gas near LRDs may display properties that are not common in massive SMBHs, as highlighted by several studies (Inayoshi & Maiolino, 2025; Ji et al., 2025; D’Eugenio et al., 2025a; Rusakov et al., 2025; Naidu et al., 2025; Ma et al., 2025a). Overall, our findings highlight the exciting opportunities offered by multi-epoch, high-resolution observations of LRDs, to investigate both their local environment, SMBHs, and time variability. The use of high-resolution NIRSpec spectroscopy is essential for a complete census of gas absorbers in broad-line AGN, because estimates based on NIRSpec medium-resolution spectroscopy may severely under-estimate the incidence of absorbers (Fig. 7).
Acknowledgements
We thank Debora Sijacki, Sergio Martin-Alvarez, William McClymont, Gabriele Pezzulli, and Harley Katz for useful discussions. FDE, RM, XJ, JS, IJ and GCJ acknowledge support by the Science and Technology Facilities Council (STFC), by the ERC through Advanced Grant 695671 “QUENCH”, and by the UKRI Frontier Research grant RISEandFALL. RM also acknowledges funding from a research professorship from the Royal Society. IJ also acknowledges support by the Huo Family Foundation through a P.C. Ho PhD Studentship. MP, SA and BRP acknowledge grant PID2021-127718NB-I00 funded by the Spanish Ministry of Science and Innovation/State Agency of Research (MICIN/AEI/ 10.13039/501100011033). MP also acknowledges the grant RYC2023-044853-I, funded by MICIU/AEI/10.13039/501100011033 and European Social Fund Plus (FSE+). GM and HÜ acknowledge funding by the European Union (ERC APEX, 101164796). Views and opinions expressed are however those of the authors only and do not necessarily reflect those of the European Union or the European Research Council Executive Agency. Neither the European Union nor the granting authority can be held responsible for them. SC and GV acknowledge support by European Union’s HE ERC Starting Grant No. 101040227 - WINGS. AJB acknowledges funding from the “FirstGalaxies” Advanced Grant from the European Research Council (ERC) under the European Union’s Horizon 2020 research and innovation program (Grant agreement No. 789056). ECL acknowledges support of an STFC Webb Fellowship (ST/W001438/1). KI acknowledges support from the National Natural Science Foundation of China (12073003, 11721303, 11991052), and the China Manned Space Project (CMS-CSST-2021-A04 and CMS-CSST- 2021-A06). YI is supported by JSPS KAKENHI Grant No. 24KJ0202. ZJ, BDJ, BER and CNAW acknowledge support from the NIRCam Science Team contract to the University of Arizona, NAS5-02015. BER also acknowledges support from JWST Program 3215. ST acknowledges support by the Royal Society Research Grant G125142. The research of CCW is supported by NOIRLab, which is managed by the Association of Universities for Research in Astronomy (AURA) under a cooperative agreement with the National Science Foundation. JW gratefully acknowledges support from the Cosmic Dawn Center through the DAWN Fellowship. The Cosmic Dawn Center (DAWN) is funded by the Danish National Research Foundation under grant No. 140. The authors acknowledge use of the lux supercomputer at UC Santa Cruz, funded by NSF MRI grant AST 1828315.
This work made extensive use of the freely available Debian GNU/Linux operative system. We used the Python programming language (van Rossum, 1995), maintained and distributed by the Python Software Foundation. We made direct use of Python packages astropy (Astropy Collaboration et al., 2013, 2018), corner (Foreman-Mackey, 2016), emcee (Foreman-Mackey et al., 2013), jwst (Alves de Oliveira et al., 2018), matplotlib (Hunter, 2007), numpy (Harris et al., 2020), prospector (Johnson et al., 2021) v2.0, pyneb (Luridiana et al., 2015), python-fsps (Johnson et al., 2023), pysersic (Pasha & Miller, 2023), qubespec (Scholtz et al., 2025a), and scipy (Jones et al., 2001). We also used the softwares fsps (Conroy et al., 2009; Conroy & Gunn, 2010), topcat, (Taylor, 2005), fitsmap (Hausen & Robertson, 2022) and ds9 (Joye & Mandel, 2003).
Data Availability
The data used in this article are all available through the MAST archive.
Affiliations
11 INAF - Osservatorio Astrofisico di Arcetri, largo E. Fermi 5, 50127 Firenze, Italy
12Centre for Astrophysics Research, Department of Physics, Astronomy and Mathematics, University of Hertfordshire, Hatfield AL10 9AB, UK
13Steward Observatory, University of Arizona, 933 N. Cherry Ave., Tucson, AZ, 85721, USA
14Kavli Institute for Astronomy and Astrophysics, Peking University, Beijing 100871, China
Center for Astrophysics Harvard & Smithsonian, 60 Garden St., Cambridge MA 02138 USA
16Department for Astrophysical and Planetary Science, University of Colorado, Boulder, CO 80309, USA
17Department of Astronomy and Astrophysics University of California, Santa Cruz, 1156 High Street, Santa Cruz CA 96054, USA
18Institut d’Astrophysique de Paris, Paris, 98 bis Boulevard Arago, 75014 Paris, France
19NSF National Optical-Infrared Astronomy Research Laboratory, 950 North Cherry Avenue, Tucson, AZ 85719, USA
20NRC Herzberg, 5071 West Saanich Rd, Victoria, BC V9E 2E7, Canada
21Cosmic Dawn Center (DAWN), Copenhagen, Denmark
22Niels Bohr Institute, University of Copenhagen, Jagtvej 128, DK-2200, Copenhagen, Denmark
References
- Abuter et al. (2024) Abuter R., et al., 2024, Nature, 627, 281
- Akins et al. (2024) Akins H. B., et al., 2024, arXiv e-prints, p. arXiv:2406.10341
- Akins et al. (2025a) Akins H. B., et al., 2025a, arXiv e-prints, p. arXiv:2503.00998
- Akins et al. (2025b) Akins H. B., et al., 2025b, ApJ, 980, L29
- Alberts et al. (2024) Alberts S., et al., 2024, ApJ, 975, 85
- Alves de Oliveira et al. (2018) Alves de Oliveira C., et al., 2018, in Observatory Operations: Strategies, Processes, and Systems VII. p. 107040Q (arXiv:1805.06922), doi:10.1117/12.2313839
- Arakawa et al. (2022) Arakawa N., Fabian A. C., Ferland G. J., Ishibashi W., 2022, MNRAS, 517, 5069
- Asplund et al. (2009) Asplund M., Grevesse N., Sauval A. J., Scott P., 2009, ARA&A, 47, 481
- Astropy Collaboration et al. (2013) Astropy Collaboration et al., 2013, A&A, 558, A33
- Astropy Collaboration et al. (2018) Astropy Collaboration et al., 2018, AJ, 156, 123
- Baggen et al. (2024) Baggen J. F. W., et al., 2024, ApJ, 977, L13
- Baker et al. (2025) Baker W. M., et al., 2025, MNRAS, 539, 557
- Baldwin et al. (1981) Baldwin J. A., Phillips M. M., Terlevich R., 1981, PASP, 93, 5
- Baldwin et al. (2004) Baldwin J. A., Ferland G. J., Korista K. T., Hamann F., LaCluyzé A., 2004, ApJ, 615, 610
- Baskin & Laor (2005) Baskin A., Laor A., 2005, MNRAS, 358, 1043
- Behroozi et al. (2010) Behroozi P. S., Conroy C., Wechsler R. H., 2010, ApJ, 717, 379
- Behroozi et al. (2013) Behroozi P. S., Wechsler R. H., Conroy C., 2013, ApJ, 770, 57
- Bennert et al. (2021) Bennert V. N., et al., 2021, ApJ, 921, 36
- Bertemes et al. (2025) Bertemes C., et al., 2025, A&A, 693, A176
- Bertin & Arnouts (1996) Bertin E., Arnouts S., 1996, A&AS, 117, 393
- Bezanson et al. (2018) Bezanson R., et al., 2018, ApJ, 868, L36
- Binette et al. (2024) Binette L., et al., 2024, A&A, 684, A53
- Böker et al. (2022) Böker T., et al., 2022, A&A, 661, A82
- Bouwens et al. (2015) Bouwens R. J., et al., 2015, ApJ, 803, 34
- Brammer et al. (2008) Brammer G. B., van Dokkum P. G., Coppi P., 2008, ApJ, 686, 1503
- Brooks et al. (2024) Brooks M., et al., 2024, arXiv e-prints, p. arXiv:2410.07340
- Bullock et al. (2001) Bullock J. S., Kolatt T. S., Sigad Y., Somerville R. S., Kravtsov A. V., Klypin A. A., Primack J. R., Dekel A., 2001, MNRAS, 321, 559
- Bunker et al. (2020) Bunker A. J., NIRSPEC Instrument Science Team JAESs Collaboration 2020, in da Cunha E., Hodge J., Afonso J., Pentericci L., Sobral D., eds, IAU Symposium Vol. 352, Uncovering Early Galaxy Evolution in the ALMA and JWST Era. pp 342–346 (arXiv:2112.15207), doi:10.1017/S1743921319009463
- Bunker et al. (2023) Bunker A. J., et al., 2023, A&A, 677, A88
- Bunker et al. (2024) Bunker A. J., et al., 2024, A&A, 690, A288
- Byler et al. (2017) Byler N., Dalcanton J. J., Conroy C., Johnson B. D., 2017, ApJ, 840, 44
- Cameron et al. (2023) Cameron A. J., et al., 2023, A&A, 677, A115
- Cameron et al. (2024) Cameron A. J., Katz H., Witten C., Saxena A., Laporte N., Bunker A. J., 2024, MNRAS, 534, 523
- Cardelli et al. (1989) Cardelli J. A., Clayton G. C., Mathis J. S., 1989, ApJ, 345, 245
- Carniani et al. (2024) Carniani S., et al., 2024, A&A, 685, A99
- Carniani et al. (2025) Carniani S., et al., 2025, A&A, 696, A87
- Carranza-Escudero et al. (2025) Carranza-Escudero M., et al., 2025, arXiv e-prints, p. arXiv:2506.04004
- Casey et al. (2024) Casey C. M., Akins H. B., Kokorev V., McKinney J., Cooper O. R., Long A. S., Franco M., Manning S. M., 2024, ApJ, 975, L4
- Casey et al. (2025) Casey C. M., et al., 2025, arXiv e-prints, p. arXiv:2505.18873
- Chabrier (2003) Chabrier G., 2003, PASP, 115, 763
- Charlot & Fall (2000) Charlot S., Fall S. M., 2000, ApJ, 539, 718
- Chen et al. (2025) Chen C.-H., Ho L. C., Li R., Inayoshi K., 2025, arXiv e-prints, p. arXiv:2505.03183
- Choi et al. (2016) Choi J., Dotter A., Conroy C., Cantiello M., Paxton B., Johnson B. D., 2016, ApJ, 823, 102
- Cole et al. (2025) Cole J. W., et al., 2025, ApJ, 979, 193
- Conroy & Gunn (2010) Conroy C., Gunn J. E., 2010, FSPS: Flexible Stellar Population Synthesis, Astrophysics Source Code Library, record ascl:1010.043 (ascl:1010.043)
- Conroy et al. (2009) Conroy C., Gunn J. E., White M., 2009, ApJ, 699, 486
- Conroy et al. (2019) Conroy C., Naidu R. P., Zaritsky D., Bonaca A., Cargile P., Johnson B. D., Caldwell N., 2019, ApJ, 887, 237
- D’Eugenio et al. (2024) D’Eugenio F., et al., 2024, Nature Astronomy, 8, 1443
- D’Eugenio et al. (2025a) D’Eugenio F., et al., 2025a, arXiv e-prints, p. arXiv:2503.11752
- D’Eugenio et al. (2025b) D’Eugenio F., et al., 2025b, arXiv e-prints, p. arXiv:2503.15590
- D’Eugenio et al. (2025c) D’Eugenio F., et al., 2025c, ApJS, 277, 4
- D’Eugenio et al. (2025d) D’Eugenio F., et al., 2025d, MNRAS, 536, 51
- Dalla Bontà et al. (2025) Dalla Bontà E., et al., 2025, A&A, 696, A48
- Davies et al. (2024) Davies R. L., et al., 2024, MNRAS, 528, 4976
- Ding et al. (2023) Ding X., et al., 2023, Nature, 621, 51
- Dojčinović et al. (2023) Dojčinović I., Kovačević-Dojčinović J., Popović L. Č., 2023, Advances in Space Research, 71, 1219
- Dong et al. (2008) Dong X., Wang T., Wang J., Yuan W., Zhou H., Dai H., Zhang K., 2008, MNRAS, 383, 581
- Dors et al. (2020) Dors O. L., Maiolino R., Cardaci M. V., Hägele G. F., Krabbe A. C., Pérez-Montero E., Armah M., 2020, MNRAS, 496, 3209
- Dutton & Macciò (2014) Dutton A. A., Macciò A. V., 2014, MNRAS, 441, 3359
- Eisenstein et al. (2023a) Eisenstein D. J., et al., 2023a, arXiv e-prints, p. arXiv:2306.02465
- Eisenstein et al. (2023b) Eisenstein D. J., et al., 2023b, arXiv e-prints, p. arXiv:2310.12340
- Fabian et al. (2008) Fabian A. C., Vasudevan R. V., Gandhi P., 2008, MNRAS, 385, L43
- Ferruit et al. (2022) Ferruit P., et al., 2022, A&A, 661, A81
- Foreman-Mackey (2016) Foreman-Mackey D., 2016, The Journal of Open Source Software, 1, 24
- Foreman-Mackey et al. (2013) Foreman-Mackey D., Hogg D. W., Lang D., Goodman J., 2013, PASP, 125, 306
- Fridman & Poliachenko (1984) Fridman A. M., Poliachenko V. L., 1984, Physics of gravitating systems. II - Nonlinear collective processes: Nonlinear waves, solitons, collisionless shocks, turbulence. Astrophysical applications. Springer-Verlag
- Furtak et al. (2023) Furtak L. J., et al., 2023, ApJ, 952, 142
- Furtak et al. (2024) Furtak L. J., et al., 2024, Nature, 628, 57
- Furtak et al. (2025) Furtak L. J., et al., 2025, arXiv e-prints, p. arXiv:2502.07875
- Giavalisco et al. (2004) Giavalisco M., et al., 2004, ApJ, 600, L93
- Gordon et al. (2003) Gordon K. D., Clayton G. C., Misselt K. A., Landolt A. U., Wolff M. J., 2003, ApJ, 594, 279
- Goulding et al. (2023) Goulding A. D., et al., 2023, ApJ, 955, L24
- Greene & Ho (2004) Greene J. E., Ho L. C., 2004, ApJ, 610, 722
- Greene et al. (2006) Greene J. E., Ho L. C., Ulvestad J. S., 2006, ApJ, 636, 56
- Greene et al. (2017) Greene T. P., et al., 2017, = 2.4 to 5 m spectroscopy with the James Webb Space Telescope NIRCam instrument, Technical Report JWST-STScI-005001
- Greene et al. (2020) Greene J. E., Strader J., Ho L. C., 2020, ARA&A, 58, 257
- Greene et al. (2024) Greene J. E., et al., 2024, ApJ, 964, 39
- Grogin et al. (2011) Grogin N. A., et al., 2011, ApJS, 197, 35
- Hainline et al. (2024) Hainline K. N., et al., 2024, ApJ, 964, 71
- Harikane et al. (2023) Harikane Y., et al., 2023, ApJ, 959, 39
- Harris et al. (2020) Harris C. R., et al., 2020, Nature, 585, 357
- Hausen & Robertson (2022) Hausen R., Robertson B. E., 2022, Astronomy and Computing, 39, 100586
- Hunter (2007) Hunter J. D., 2007, Computing in Science and Engineering, 9, 90
- Ilić et al. (2012) Ilić D., Popović L. Č., La Mura G., Ciroi S., Rafanelli P., 2012, A&A, 543, A142
- Inayoshi & Maiolino (2025) Inayoshi K., Maiolino R., 2025, ApJ, 980, L27
- Inayoshi et al. (2022) Inayoshi K., Nakatani R., Toyouchi D., Hosokawa T., Kuiper R., Onoue M., 2022, ApJ, 927, 237
- Isobe et al. (2023) Isobe Y., Ouchi M., Nakajima K., Harikane Y., Ono Y., Xu Y., Zhang Y., Umeda H., 2023, ApJ, 956, 139
- Izotov et al. (2006) Izotov Y. I., Stasińska G., Meynet G., Guseva N. G., Thuan T. X., 2006, A&A, 448, 955
- Izumi et al. (2021) Izumi T., et al., 2021, ApJ, 914, 36
- Jakobsen et al. (2022) Jakobsen P., et al., 2022, A&A, 661, A80
- Ji et al. (2024) Ji Z., et al., 2024, ApJ, 974, 135
- Ji et al. (2025) Ji X., et al., 2025, arXiv e-prints, p. arXiv:2501.13082
- Johnson et al. (2021) Johnson B. D., Leja J., Conroy C., Speagle J. S., 2021, ApJS, 254, 22
- Johnson et al. (2023) Johnson B., et al., 2023, dfm/python-fsps: v0.4.4, doi:10.5281/zenodo.8230430, https://doi.org/10.5281/zenodo.8230430
- Jones et al. (2001) Jones E., Oliphant T., Peterson P., et al., 2001, SciPy: Open source scientific tools for Python, http://www.scipy.org/
- Jones et al. (2024) Jones G. C., et al., 2024, A&A, 683, A238
- Joye & Mandel (2003) Joye W. A., Mandel E., 2003, in Payne H. E., Jedrzejewski R. I., Hook R. N., eds, Astronomical Society of the Pacific Conference Series Vol. 295, Astronomical Data Analysis Software and Systems XII. p. 489
- Juodžbalis et al. (2024a) Juodžbalis I., et al., 2024a, MNRAS, 535, 853
- Juodžbalis et al. (2024b) Juodžbalis I., et al., 2024b, Nature, 636, 594
- Juodžbalis et al. (2025) Juodžbalis I., et al., 2025, arXiv e-prints, p. arXiv:2504.03551
- Kannan et al. (2025) Kannan R., et al., 2025, arXiv e-prints, p. arXiv:2502.20437
- Kauffmann et al. (2003) Kauffmann G., et al., 2003, MNRAS, 346, 1055
- Kewley et al. (2001) Kewley L. J., Dopita M. A., Sutherland R. S., Heisler C. A., Trevena J., 2001, ApJ, 556, 121
- Kewley et al. (2006) Kewley L. J., Groves B., Kauffmann G., Heckman T., 2006, MNRAS, 372, 961
- Kido et al. (2025) Kido D., Ioka K., Hotokezaka K., Inayoshi K., Irwin C. M., 2025, arXiv e-prints, p. arXiv:2505.06965
- Killi et al. (2024) Killi M., et al., 2024, A&A, 691, A52
- Kocevski et al. (2023) Kocevski D. D., et al., 2023, ApJ, 954, L4
- Kocevski et al. (2024) Kocevski D. D., et al., 2024, arXiv e-prints, p. arXiv:2404.03576
- Kokorev et al. (2023) Kokorev V., et al., 2023, ApJ, 957, L7
- Kokubo & Harikane (2024) Kokubo M., Harikane Y., 2024, arXiv e-prints, p. arXiv:2407.04777
- Kormendy & Ho (2013) Kormendy J., Ho L. C., 2013, ARA&A, 51, 511
- Koudmani et al. (2022) Koudmani S., Sijacki D., Smith M. C., 2022, MNRAS, 516, 2112
- Kriek & Conroy (2013) Kriek M., Conroy C., 2013, ApJ, 775, L16
- Labbe et al. (2024) Labbe I., et al., 2024, arXiv e-prints, p. arXiv:2412.04557
- Lambrides et al. (2024) Lambrides E., et al., 2024, arXiv e-prints, p. arXiv:2409.13047
- Laor (2006) Laor A., 2006, ApJ, 643, 112
- Li et al. (2024) Li Y., Leja J., Johnson B. D., Tacchella S., Naidu R. P., 2024, ApJ, 969, L5
- Li et al. (2025) Li J., Shen Y., Zhuang M.-Y., 2025, arXiv e-prints, p. arXiv:2502.05048
- Luo et al. (2017) Luo B., et al., 2017, ApJS, 228, 2
- Luridiana et al. (2015) Luridiana V., Morisset C., Shaw R. A., 2015, A&A, 573, A42
- Ma et al. (2025a) Ma Y., et al., 2025a, arXiv e-prints, p. arXiv:2504.08032
- Ma et al. (2025b) Ma Y., et al., 2025b, ApJ, 981, 191
- Maiolino et al. (2010) Maiolino R., et al., 2010, A&A, 517, A47
- Maiolino et al. (2024) Maiolino R., et al., 2024, A&A, 691, A145
- Maiolino et al. (2025a) Maiolino R., et al., 2025a, arXiv e-prints, p. arXiv:2505.22567
- Maiolino et al. (2025b) Maiolino R., et al., 2025b, MNRAS, 538, 1921
- Marshall et al. (2024) Marshall M. A., et al., 2024, arXiv e-prints, p. arXiv:2410.11035
- Mascia et al. (2024) Mascia S., et al., 2024, A&A, 690, A2
- Matthee et al. (2024) Matthee J., et al., 2024, ApJ, 963, 129
- Mazzolari et al. (2024) Mazzolari G., et al., 2024, A&A, 691, A345
- McClymont et al. (2025a) McClymont W., et al., 2025a, arXiv e-prints, p. arXiv:2503.00106
- McClymont et al. (2025b) McClymont W., et al., 2025b, MNRAS, 540, 190
- Mérida et al. (2025) Mérida R. M., et al., 2025, arXiv e-prints, p. arXiv:2501.17925
- Merritt & Hernquist (1991) Merritt D., Hernquist L., 1991, ApJ, 376, 439
- Miller et al. (2024) Miller T. B., et al., 2024, arXiv e-prints, p. arXiv:2412.06957
- Milosavljević et al. (2009) Milosavljević M., Couch S. M., Bromm V., 2009, ApJ, 696, L146
- Moster et al. (2010) Moster B. P., Somerville R. S., Maulbetsch C., van den Bosch F. C., Macciò A. V., Naab T., Oser L., 2010, ApJ, 710, 903
- Moster et al. (2013) Moster B. P., Naab T., White S. D. M., 2013, MNRAS, 428, 3121
- Naidu et al. (2025) Naidu R. P., et al., 2025, arXiv e-prints, p. arXiv:2503.16596
- Navarro et al. (1997) Navarro J. F., Frenk C. S., White S. D. M., 1997, ApJ, 490, 493
- Noll et al. (2009) Noll S., Burgarella D., Giovannoli E., Buat V., Marcillac D., Muñoz-Mateos J. C., 2009, A&A, 507, 1793
- Oesch et al. (2023) Oesch P. A., et al., 2023, MNRAS, 525, 2864
- Oke & Gunn (1983) Oke J. B., Gunn J. E., 1983, ApJ, 266, 713
- Osterbrock & Ferland (2006) Osterbrock D. E., Ferland G. J., 2006, Astrophysics of gaseous nebulae and active galactic nuclei. University Science Books, Sausalito, California
- Pacucci & Loeb (2025) Pacucci F., Loeb A., 2025, arXiv e-prints, p. arXiv:2506.03244
- Pacucci & Narayan (2024) Pacucci F., Narayan R., 2024, ApJ, 976, 96
- Park & Ricotti (2012) Park K., Ricotti M., 2012, ApJ, 747, 9
- Park et al. (2017) Park K., Wise J. H., Bogdanović T., 2017, ApJ, 847, 70
- Pasha & Miller (2023) Pasha I., Miller T. B., 2023, The Journal of Open Source Software, 8, 5703
- Peng et al. (2002) Peng C. Y., Ho L. C., Impey C. D., Rix H.-W., 2002, AJ, 124, 266
- Peng et al. (2010) Peng C. Y., Ho L. C., Impey C. D., Rix H.-W., 2010, AJ, 139, 2097
- Pérez-González et al. (2024) Pérez-González P. G., et al., 2024, ApJ, 968, 4
- Perna et al. (2023) Perna M., et al., 2023, A&A, 679, A89
- Perna et al. (2025) Perna M., et al., 2025, A&A, 696, A59
- Pizzati et al. (2025) Pizzati E., Hennawi J. F., Schaye J., Eilers A.-C., Huang J., Schindler J.-T., Wang F., 2025, MNRAS, 539, 2910
- Planck Collaboration et al. (2020) Planck Collaboration et al., 2020, A&A, 641, A6
- Rauscher et al. (2012) Rauscher B. J., et al., 2012, in Holland A. D., Beletic J. W., eds, Society of Photo-Optical Instrumentation Engineers (SPIE) Conference Series Vol. 8453, High Energy, Optical, and Infrared Detectors for Astronomy V. p. 84531F, doi:10.1117/12.926089
- Rauscher et al. (2017) Rauscher B. J., et al., 2017, PASP, 129, 105003
- Reines & Volonteri (2015) Reines A. E., Volonteri M., 2015, ApJ, 813, 82
- Rieke (2020) Rieke M., 2020, in da Cunha E., Hodge J., Afonso J., Pentericci L., Sobral D., eds, IAU Symposium Vol. 352, Uncovering Early Galaxy Evolution in the ALMA and JWST Era. pp 337–341, doi:10.1017/S1743921319008950
- Rieke et al. (2023) Rieke M. J., et al., 2023, ApJS, 269, 16
- Rinaldi et al. (2024) Rinaldi P., et al., 2024, arXiv e-prints, p. arXiv:2411.14383
- Rudy et al. (1989) Rudy R. J., Rossano G. S., Puetter R. C., 1989, ApJ, 342, 235
- Rupke et al. (2005) Rupke D. S., Veilleux S., Sanders D. B., 2005, ApJS, 160, 115
- Rusakov et al. (2025) Rusakov V., et al., 2025, arXiv e-prints, p. arXiv:2503.16595
- Sanders et al. (2016) Sanders R. L., et al., 2016, ApJ, 816, 23
- Sandles et al. (2024) Sandles L., et al., 2024, A&A, 691, A305
- Satyapal et al. (2014) Satyapal S., Secrest N. J., McAlpine W., Ellison S. L., Fischer J., Rosenberg J. L., 2014, ApJ, 784, 113
- Schawinski et al. (2007) Schawinski K., Thomas D., Sarzi M., Maraston C., Kaviraj S., Joo S.-J., Yi S. K., Silk J., 2007, MNRAS, 382, 1415
- Schlafly & Finkbeiner (2011) Schlafly E. F., Finkbeiner D. P., 2011, ApJ, 737, 103
- Scholtz et al. (2025a) Scholtz J., et al., 2025a, MNRAS, 539, 2463
- Scholtz et al. (2025b) Scholtz J., et al., 2025b, A&A, 697, A175
- Schramm et al. (2013) Schramm M., et al., 2013, ApJ, 773, 150
- Schwarz (1978) Schwarz G., 1978, The Annals of Statistics, 6, 461
- Setton et al. (2024) Setton D. J., et al., 2024, arXiv e-prints, p. arXiv:2411.03424
- Setton et al. (2025) Setton D. J., et al., 2025, arXiv e-prints, p. arXiv:2503.02059
- Shapley et al. (2023) Shapley A. E., Sanders R. L., Reddy N. A., Topping M. W., Brammer G. B., 2023, ApJ, 954, 157
- Silk (2017) Silk J., 2017, ApJ, 839, L13
- Smith & Howarth (1998) Smith K. C., Howarth I. D., 1998, MNRAS, 299, 1146
- Stern & Laor (2012) Stern J., Laor A., 2012, MNRAS, 423, 600
- Stone et al. (2023) Stone M. A., Lyu J., Rieke G. H., Alberts S., 2023, ApJ, 953, 180
- Storey & Zeippen (2000) Storey P. J., Zeippen C. J., 2000, MNRAS, 312, 813
- Stott et al. (2016) Stott J. P., et al., 2016, MNRAS, 457, 1888
- Strom et al. (2023) Strom A. L., et al., 2023, ApJ, 958, L11
- Sun et al. (2025) Sun Y., et al., 2025, ApJ, 978, 98
- Tacchella et al. (2016) Tacchella S., Dekel A., Carollo C. M., Ceverino D., DeGraf C., Lapiner S., Mandelker N., Primack Joel R., 2016, MNRAS, 457, 2790
- Tacchella et al. (2018) Tacchella S., Bose S., Conroy C., Eisenstein D. J., Johnson B. D., 2018, ApJ, 868, 92
- Tacchella et al. (2022) Tacchella S., et al., 2022, ApJ, 926, 134
- Tacchella et al. (2025) Tacchella S., et al., 2025, MNRAS, 540, 851
- Tanaka et al. (2024) Tanaka T. S., et al., 2024, arXiv e-prints, p. arXiv:2412.14246
- Taylor (2005) Taylor M. B., 2005, in Shopbell P., Britton M., Ebert R., eds, Astronomical Society of the Pacific Conference Series Vol. 347, Astronomical Data Analysis Software and Systems XIV. p. 29
- Taylor et al. (2024) Taylor A. J., et al., 2024, arXiv e-prints, p. arXiv:2409.06772
- Terp et al. (2024) Terp C., Heintz K. E., Watson D., Brammer G., Carnall A., Witstok J., Smit R., Vejlgaard S., 2024, A&A, 690, A70
- Torralba et al. (2025) Torralba A., et al., 2025, arXiv e-prints, p. arXiv:2505.09542
- Turner et al. (2025) Turner C., et al., 2025, MNRAS, 537, 1826
- Übler et al. (2023) Übler H., et al., 2023, A&A, 677, A145
- Übler et al. (2024) Übler H., et al., 2024, MNRAS, 531, 355
- Veilleux & Osterbrock (1987) Veilleux S., Osterbrock D. E., 1987, ApJS, 63, 295
- Veilleux et al. (2005) Veilleux S., Cecil G., Bland-Hawthorn J., 2005, ARA&A, 43, 769
- Wang et al. (2024) Wang B., et al., 2024, ApJ, 969, L13
- Wang et al. (2025) Wang B., et al., 2025, ApJ, 984, 121
- Whitaker et al. (2019) Whitaker K. E., et al., 2019, ApJS, 244, 16
- Williams et al. (2024) Williams C. C., et al., 2024, ApJ, 968, 34
- Wu et al. (2024) Wu S., et al., 2024, MNRAS, 532, 4703
- Yue et al. (2024a) Yue M., et al., 2024a, ApJ, 966, 176
- Yue et al. (2024b) Yue M., Eilers A.-C., Ananna T. T., Panagiotou C., Kara E., Miyaji T., 2024b, ApJ, 974, L26
- Zamora et al. (2024) Zamora S., et al., 2024, arXiv e-prints, p. arXiv:2412.02751
- Zhang et al. (2025) Zhang Z., Jiang L., Liu W., Ho L. C., 2025, ApJ, 985, 119
- de Graaff et al. (2024) de Graaff A., et al., 2024, A&A, 684, A87
- de Graaff et al. (2025) de Graaff A., et al., 2025, arXiv e-prints, p. arXiv:2503.16600
- van Dokkum (2001) van Dokkum P. G., 2001, PASP, 113, 1420
- van Rossum (1995) van Rossum G., 1995, CWI Technical Report, CS-R9526
- van der Wel et al. (2012) van der Wel A., et al., 2012, ApJS, 203, 24
- van der Wel et al. (2022) van der Wel A., et al., 2022, ApJ, 936, 9
Appendix A Interloping galaxy.
Emission from 159717 is plagued by a foreground spiral galaxy, JADES ID 159715 (Fig. 1). By inspecting \hstimaging at wavelengths shorter than 7,000 Å(the Ly drop in 159717), we can readily identify a star-forming region near to the line of sight to 159717; this region is detected in [O iii]4959,5007 and H in the 2-d and 1-d NIRSpec spectra (see Fig. 1). The redshift of these emission lines is consistent with what found from the \blackthunderhigh-resolution spectrum, where we find Pa at 3.75 \mum, giving a redshift of .
To analyse this lower-redshift interloper, we start by correcting the G140M/F070LP spectrum for foreground Milky-Way attenuation, using the Cardelli et al. (1989) extinction law with from (Schlafly & Finkbeiner, 2011). This has minimal impact (0.02 mag) on the recovered . We extract the 1-d spectrum from three spaxels of the JADES 2-d spectrum, identified from the 2-d SNR map as displaying clear evidence of [O iii]5007 emission in the prism spectrum (cf. Fig. 1). The resulting spectrum is shown in Fig. 18, with clear evidence of both [O iii]4959,5007 (panel 18) and H (panel 18), while H is superimposed to a noise feature. We model this spectrum using two local backgrounds around H –[O iii]4959,5007 and H , and four Gaussians, the latter having the same redshift and (instrument-convolved) velocity dispersion. The H flux is a free parameter, while the H flux is derived from H assuming the intrinsic Case-B recombination ratio of 2.86 for K and cm-3, and a \al@gordon+2003 dust law with free . We also limit the observed [O iii]5007/H ratio to be less than 20, which effectively limits to realistic values of mag. The model is fit to the data using the Bayesian approach described in sections 3.2 and 3.3. We find a redshift , higher than the fiducial value from \blackthunder, but still compatible, given the known wavelength calibration discrepancies between different NIRSpec dispersers (e.g., D’Eugenio et al., 2025c). The resulting dust attenuation is mag, consistent with no attenuation. A consistent result is obtained by fitting jointly Pa together with H , [O iii]4959,5007 and H , where we assume an intrinsic Pa /H =0.339, consistent with the assumptions for the intrinsic H /H . This fit is performed on the prism spectrum, because Pa is not detected in the gratings. This model gives mag.
The most stringent constraints come from the \blackthunderdata; we extract prism spectra from two apertures, one centred on the target AGN, and one capturing the brightest star-forming region to the north west of the AGN. Modelling these spectra yields respectively and mag. Of these two values, the most relevant one for the foreground screen is the lowest, given that it is closer to the line of sight of 159717.
In any case, H and H light from 159717 passing through the interloper had observed-frame wavelengths of 1.48 and 1.99 \mum. At these wavelengths, with the fiducial of the interloper, the attenuation would be dominated by dust within 159717, with a foreground attenuation of only 6 and 4 per cent for H and H , respectively.
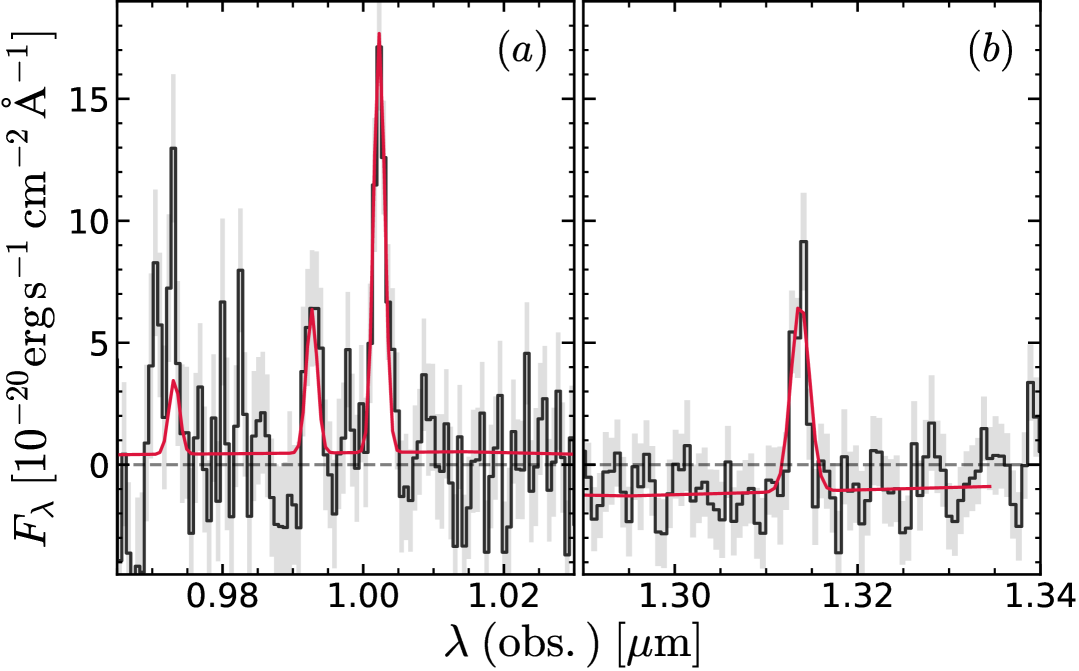
To assess the Ly emission, we compare the spatial distribution of secure emission lines in the main 159717 and in the interloper. In Fig. 19, we use the \blackthunderprism data to create emission-line maps at the wavelengths of [O iii]5007 at (cyan), of [O iii]5007 at (magenta), and at the coincident wavelengths of Ly (at ) and [O ii]3726,3729 (at ; black contours). The cyan contours are clearly misaligned with respect to the black contours, but this in itself is not sufficient reason to discard the Ly interpretation, since Ly can have substantially different morphology than optically thin emission lines (e.g., Torralba et al., 2025). To further test the Ly or [O ii]3726,3729 origin of the black contours, all emission-line contours are overlaid on a RGB image that shows the rest-frame UV and optical from the interloper in \hst/ACS F606W and \jwst/NIRCam F090W, respectively. UV-bright regions are seen in pink hues, and coincide with the core of the foreground galaxy and with its northern spiral arm. The latter also coincides perfectly with both the northern magenta contour ([O iii]5007 at ) and with the black contours, suggesting the latter should be conservatively identified as [O ii]3726,3729 arising from the foreground.
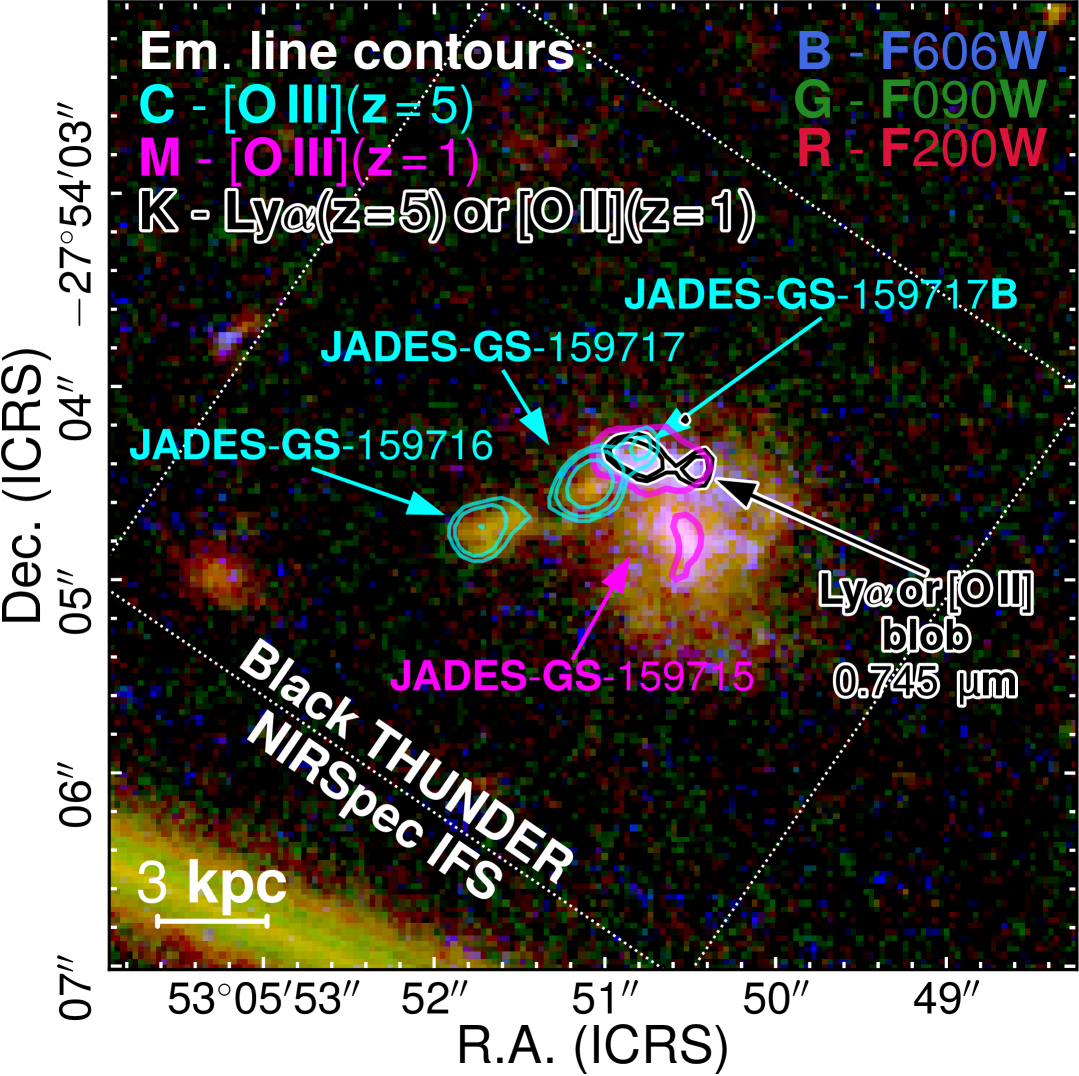
Appendix B Gravitational lens
Finding a bright LRD within only 0.6-arcsec separation from a foreground galaxy raises the question of possible gravitational-lens magnification . To evaluate this possibility and to infer , we need to estimate the mass of the lens galaxy inside the circle of radius -arcsec, corresponding to 4.94 kpc at . We start from the stellar mass measurement from the CANDELS catalogue (Grogin et al., 2011), and we use the stellar-to-halo mass relation of (Behroozi et al., 2013) to derive a dark-matter halo mass of , with a scatter of 0.2–0.3 dex (Behroozi et al., 2013; Moster et al., 2013). For this halo, the virial radius is kpc (Bullock et al., 2001). Assuming a NFW profile (Navarro et al., 1997), and a concentration value (Dutton & Macciò, 2014), we can estimate both the scale density and scale radius of the NFW profile, from which we derive enclosed masses of . This value is still much larger than \mstar, without even considering that some of the stellar mass lies beyond the separation radius arcsec, because the half-light radius of the lens is arcsec (van der Wel et al., 2012). We derive a magnification factor , which is below the typical uncertainties on both \mstar, \reand . From similar considerations, applied to the source 159717C (which lies closer to the centre of 159715, about 0.1-arcsec away), we still derive .
Appendix C NIRCam/WFSS fits

To probe the ability of NIRCam/WFSS to identify rest-frame absorbers, we mock a NIRCam spectrum by convolving the G395H JADES data to match the resolution of NIRCam F444W (Greene et al., 2017) (Fig. 20). We then fit this spectrum with the same setup as Fig. 7, with the resulting absorber parameters shown in the corner diagram of Fig. 8 (purple). With resolution , NIRCam/WFSS can clearly identify the absorber, although we note that the actual SNR achieved here would require significantly longer than the 2 hours used for NIRSpec. Nevertheless, NIRCam/WFSS seems very well suited to assess the incidence of rest-frame (and other) absorbers in bright sources. As for the inferred parameters, NIRCam/WFSS performs significantly better than the medium-resolution NIRSpec gratings (Fig. 8), but the posterior probabilities are both significantly broader and biased compared to the results from the high-resolution NIRSpec grating.
Appendix D Line broadening due to electron scattering
The broad-line profiles of some AGN display a distinctively exponential profile (Laor, 2006). This has been also found in LRD-like AGN (Rusakov et al., 2025). In this section, we repeat the fit on the high-SNR aperture, using the scattering assumption. We use the same framework from Section 3.3, but the broad line is modelled as a single emitted Gaussian, which we convolve with a symmetric exponential kernel in wavelength space, , where is a free parameter. The emitted and transmitted Gaussian are then rescaled by factors of and , respectively, where the optical depth is also a free parameter.
The resulting model is illustrated in Fig. 21. We find , implying that over 98 per cent of the intrinsic broad line has been scattered. , in the terminology of Laor, 2006 instead takes a value of 870 \kms, while the broad-line FWHM is \kms, two times narrower than the fiducial value. With these numbers, and using the calibration from Reines & Volonteri (2015), we obtain a SMBH mass , four times smaller than the fiducial value, implying a super-Eddington ratio of order 1.6.
The best-fit model is illustrated in Fig. 21, with the same meaning as the fiducial fit in the main text (Fig. 5). Both models reproduce the data, but there is a possible inconsistency between the large optical depth and the relatively narrow scatter parameter . Using the relation from Rusakov et al. (2025), we can in fact estimate directly from , with scaling as . With the narrow value of inferred from the model, we need K to have , i.e., the large optical depth inferred from the line shapes does not match the width of the exponential. This is also confirmed if we repeat the inference procedure with a model where is not a free parameter, but is inferred using the relation from Rusakov et al. (2025), with and as free parameters.