Joint analysis of reactor and accelerator CENS data on germanium: implications for the Standard Model and nuclear physics
Abstract
This work presents the first comprehensive joint analysis of all available Coherent Elastic Neutrino-Nucleus Scattering (CENS) data on germanium: those observed at the Spallation Neutron Source (SNS) by the COHERENT collaboration and those of the nuclear reactors revealed by the CONUS+ experiment using germanium detectors. In addition to COHERENT and CONUS+, we incorporate reactor data from TEXONO and GeN, thereby enhancing both the statistical significance and the systematic reliability of our study. We provide state-of-the-art determinations of key nuclear physics and Standard Model parameters, including the neutron root-mean-square (rms) radius of germanium nuclei, the weak mixing angle, and the neutrino charge radius. The observed tension of about between the COHERENT germanium measurement and the Standard Model prediction motivates a detailed reassessment of the theoretical cross-section. In particular, we examine the impact of nuclear form factors and uncertainties in the nuclear radius, as well as the potential influence of a systematic shift in the neutrino flux normalisation at the SNS. Our results highlight the reliability of CENS as a precision tool, reinforced by the complementarity of different experimental inputs, and lay the groundwork for future advances in the field.
I Introduction
Coherent elastic neutrino-nucleus scattering (CENS), first predicted in 1974 Freedman (1974), has emerged in recent years as a powerful low-energy probe for both testing the Standard Model (SM) and searching for phenomena beyond it Cadeddu et al. (2023); Atzori Corona et al. (2025a). This process was first observed in 2017 by the COHERENT collaboration Akimov et al. (2017, 2018, 2022) using a CsI detector exposed to the stopped-pion neutrino source at the Spallation Neutron Source (SNS), and subsequently confirmed using a liquid argon target Akimov et al. (2021a). These landmark results opened the door to precision neutrino physics in the low-energy regime De Romeri et al. (2024a); Akimov et al. (2024); De Romeri et al. (2024b); Majumdar et al. (2024); Pandey (2024); Coloma et al. (2023); Aristizabal Sierra et al. (2024); Cadeddu et al. (2018a, b, 2020a, 2020b); Cadeddu and Dordei (2019); Cadeddu et al. (2021a, b); Atzori Corona et al. (2022a, b, 2023, 2024a); Coloma et al. (2017); Liao and Marfatia (2017); Lindner et al. (2017); Giunti (2020); Denton et al. (2018); Aristizabal Sierra et al. (2018); Miranda et al. (2020); Banerjee et al. (2021); Papoulias et al. (2020); Denton et al. (2018); Aristizabal Sierra et al. (2018); Papoulias and Kosmas (2018); Dutta et al. (2020); Abdullah et al. (2018); Ge and Shoemaker (2018); Miranda et al. (2021); Flores et al. (2020); Farzan et al. (2018); Brdar et al. (2018), stimulating a new generation of CENS experiments across various platforms.
A major step forward has now been achieved with the first observation of CENS on a germanium target with an active mass of at the SNS, as reported by the COHERENT collaboration Adamski et al. (2025). This marks the first CENS detection from a pion-decay-at-rest neutrino source on a high-purity germanium detector, adding a crucial third nuclear target to the experimental landscape. This result has been implemented with the recent CENS observations by the CONUS+ Ackermann et al. (2025) collaboration using reactor antineutrinos on a similar germanium target, representing the first unambiguous CENS detection at a reactor site.
These two independent observations on germanium, realised under very different neutrino flux conditions, namely prompt, pulsed neutrinos from pion decay at the SNS versus steady, lower-energy antineutrinos from a commercial reactor, provide a unique opportunity for a simultaneous analysis. In reactor-based CENS experiments, such as those conducted by CONUS+ but also the recent intriguing constraints posed by the TEXONO Karmakar et al. (2025) and GeN Belov et al. (2025) collaborations, the antineutrino energies are limited to a few MeV. At these low energies, the momentum transfer is small enough that the nuclear form factor remains essentially flat and close to unity. As a result, the scattering cross section becomes largely insensitive to nuclear structure effects, offering a cleaner experimental environment for probing fundamental SM parameters, neutrino properties and possible non-standard interactions.
On the other hand, CENS measurements at the SNS involve neutrinos in the tens-of-MeV range, where the finite momentum transfer begins to probe the nuclear interior, introducing sensitivity to nuclear models and related uncertainties. Moreover, while reactor data is only sensitive to the electronic flavour, accelerator data offers a unique opportunity to probe both electron and muon neutrino flavours.
This complementarity between reactor and accelerator sources is especially valuable when considering data from a common target such as germanium. We present the first combined analysis of CENS results on germanium, integrating data from both SNS and reactor-based experiments. We provide state-of-the-art determinations of key nuclear physics parameters such as the neutron root-mean-square (rms) radius of germanium nuclei and fundamental SM quantities, including the weak mixing angle, and the neutrino charge radius.
II Theory
The CENS differential cross section as a function of nuclear recoil energy for a neutrino () scattering off a nucleus with protons and neutrons is Cadeddu et al. (2023)111In this work we use natural units such that .
| (1) |
where is the Fermi constant, the neutrino energy, the nuclear mass222For the isotopic composition of germanium, we use the values from Ref. Berglund and Wieser (2011). and the weak nuclear charge is
| (2) |
We indicate with and the proton and neutron form factors of the nucleus and with and the coefficients which quantify the weak neutral-current interactions of neutrons and protons. In the SM, the values of these coefficients are Atzori Corona et al. (2024a)
| (3) | ||||
| (4) |
when taking into account radiative corrections in the scheme Atzori Corona et al. (2023); Erler and Su (2013); Navas (2024). The flavor dependence of is due to the neutrino charge radii (CR), which represent the only non-zero electromagnetic properties of neutrinos in the SM Giunti et al. (2024). The SM neutrino CR prediction can be written as Bernabeu et al. (2000, 2002)
| (5) |
where is the boson mass, is the mass of the charged lepton . The SM values of the neutrino CR of interest for this work are:
| (6) | ||||
| (7) |
The proton, , and neutron, , nuclear form factors (FFs) in Eq. (2) encode the dependence of the process on the nuclear structure, and are defined as the Fourier transform of the corresponding nucleon density
distributions in the nucleus, , respectively. Their effect becomes more relevant for increasing momentum transfers, Cadeddu et al. (2018a) leading to a suppression of the full coherence Atzori Corona et al. (2023) in the CENS process. As stated in the introduction, while the FFs are crucial ingredients in the interpretation of COHERENT data, in the low-energy regime of reactor experiments, the FF of both protons and neutrons is practically equal to unity, making the particular choice of the parameterisation almost irrelevant.
We employ the analytical Helm parameterisation to describe both proton and neutron FFs Helm (1956).
This parameterisation is practically equivalent to other two well-known parameterisations, i.e., the symmetrised Fermi Piekarewicz et al. (2016) and Klein-Nystrand Klein and Nystrand (1999) ones.
The Helm form factor depends on the rms radius of protons and neutrons.
While the proton rms radii can be obtained from the charge radius Cadeddu et al. (2020b), which is extracted from muonic atom spectroscopy and electron scattering data Fricke et al. (1995); Fricke and Heilig (2004); Angeli and Marinova (2013), the neutron rms radii lack precise measurements for the target nuclei employed in CENS experiments. Therefore, some assumptions need to be made.
| [fm] | [fm] | |||||
|---|---|---|---|---|---|---|
| Ref. Fricke et al. (1995) | D1S Berger et al. (1991) | D1M Chabanat et al. (1998) | D1S Berger et al. (1991) | D1M Chabanat et al. (1998) | NSM Hoferichter et al. (2020) | |
| 70Ge | 4.055(1) | 3.99 | 3.93 | 4.02 | 3.97 | 4.14 |
| 72Ge | 4.073(1) | 4.01 | 3.96 | 4.07 | 4.02 | 4.20 |
| 73Ge | 4.079(1) | 4.03 | 3.97 | 4.10 | 4.04 | 4.22 |
| 74Ge | 4.091(1) | 4.05 | 3.98 | 4.13 | 4.06 | 4.26 |
| 76Ge | 4.099(1) | 4.06 | 3.99 | 4.16 | 4.10 | 4.30 |
Here, we consider the values obtained from the recent nuclear shell model (NSM) estimate of the corresponding neutron skins (i.e. the differences between the neutron and the proton rms radii) in Ref. Hoferichter et al. (2020) (see also Ref. Khaleq et al. (2025)). The considered proton and neutron rms radii are summarized in Tab. 1.
Given that the differences in the prediction for the radii of different isotopes is below the current experimental precision, when using the Helm phenomenological model, we consider as a reference for our analysis the average values of the nuclear rms proton and neutron radii weighted by the isotopic composition, namely and respectively.
Moreover, we investigate the uncertainties related to the
nuclear model Co’ et al. (2020) by considering also proton and neutron density distributions obtained
by carrying out Hartree-Fock plus Bardeen-Cooper-Schrieffer calculations (HF+BCS) Co et al. (2021). These calculations have been performed by using two different parameterisations of the
effective nucleon-nucleon finite-range interaction of Gogny type, namely the D1M Chabanat et al. (1998) and the D1S Berger et al. (1991) forces. The corresponding rms proton and neutron distribution radii have been reported in Tab. 1.
Therefore, the FF for protons (neutrons) is evaluated as
| (8) |
where is the zero-order Bessel function.
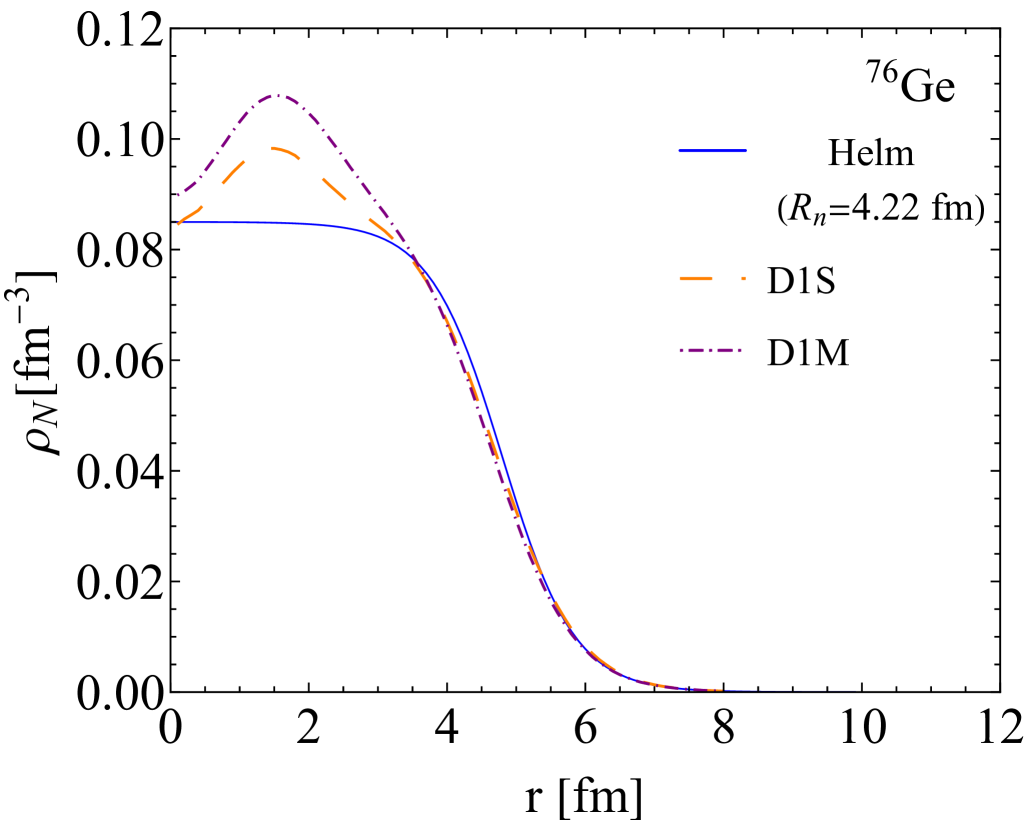
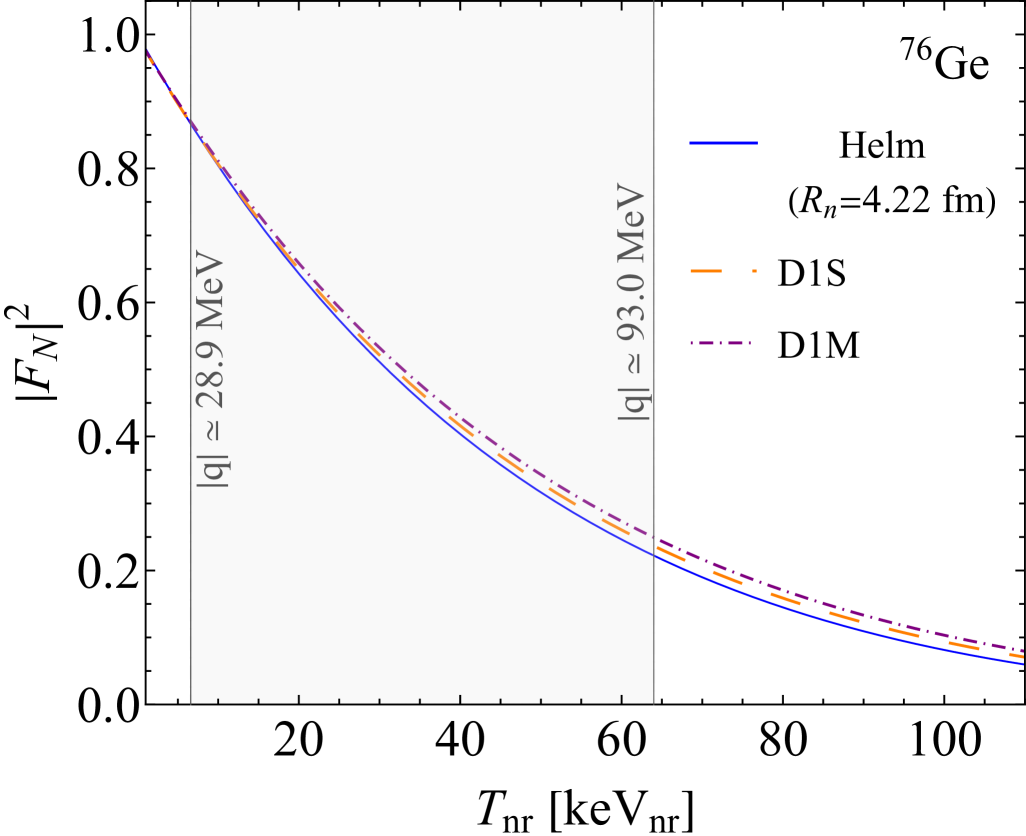
We show in Fig. 1 (a) the neutron densities of the 76Ge nucleus obtained by the HF+BCS calculation and compare it with our reference Helm neutron distribution obtained by considering the average neutron rms radius . In Fig. 1 (b) we show the related FFs. The sensitivity of the CENS results to the use of the different FFs is discussed in the next section.
(a)
 3.5cm2cm
\topinset(b)
 3.5cm2cm
III Anaysis of CENS data
We analysed the reactor CONUS+ Ackermann et al. (2025) and TEXONO Karmakar et al. (2025) data
by using the procedure outlined in detail
in Ref. Atzori Corona et al. (2025b).
We consider, in addition,
the
data of the recent GeN CENS experiment Belov et al. (2025), which employs a 1.41 kg high-purity, low-threshold germanium detector located at
11.1 m from the Kalinin Nuclear Power Plant. We parametrize the GeN reactor neutrino flux using the prescriptions
of Ref. Perissé et al. (2023), which yields a total neutrino flux of . Hereafter, we will refer to the joint analysis of CONUS+, GeN and TEXONO data as Reactors.
When needed for comparisons, the COHERENT CsI Akimov et al. (2021b) and Ar Akimov et al. (2021a, 2020) data are analysed following the strategy explained in detail in Refs. Atzori Corona et al. (2023, 2022a). For the COHERENT Ge analysis, we instead follow the procedure described in Ref. Adamski et al. (2025) and the prescriptions summarised in the following. The total neutrino flux from pion decays at rest includes three components: prompt ’s from pion decay, and the and delayed components, from the subsequent muon decay. The neutrino flux depends on the number of protons-on-target , the number of neutrinos produced for each POT, , and the baseline between the source and the detector, Akimov et al. (2020). In each nuclear-recoil energy-bin , the expected CENS event number on a germanium target is given by
| (9) |
Here, is the neutrino flux, is the reconstructed nuclear recoil kinetic energy, is the true nuclear recoil kinetic energy, is the energy-dependent detector efficiency Adamski et al. (2025), is the energy resolution Adamski et al. (2025), , MeV, , being the muon mass, and is the number of target atoms in the detector per unit mass. It is important to consider that the energy actually observed in the detector is the electron-equivalent recoil energy , which is transformed into the nuclear recoil energy in the CENS rate by inverting the relation
| (10) |
where is the quenching factor. For the latter, we adopt the Lindhard model Lindhard et al. (1963) with Bonhomme et al. (2022), as used in the reactor data analysis. Accounting for the time structure of the COHERENT data is crucial for distinguishing between the different neutrino components. We extract the arrival-time distribution of the different neutrino components from Ref. Bouabid (2024), and incorporate the timing information by dividing the theoretical CENS event numbers in Eq. (III) into time bins of . This yields , where and label the energy and time bins, respectively. To compare the prediction with the data, we perform a simultaneous fit of beam-on (ON) and beam-off (OFF) data by using the least-squares function Adamski et al. (2025)
| (11) |
where
| (12) |
and
| (13) | ||||
Here, we are following the prescription from the COHERENT collaboration to remove the energy bins in the range 333
It is important to highlight that due the 2D binning of the data provided by the COHERENT collaboration, we are excluding the energy range , while the official result excludes the energy range ., which corresponds to Adamski et al. (2025).
Moreover, is the observed number of events from beam-ON (OFF) data as extracted from Ref. Adamski et al. (2025) in the th (energy) and th (time) bin, while is the steady state background (SSB) from internally-triggered data. The latter is extracted from Fig. 3 of Ref. Adamski et al. (2025),
where the spectral shape of the SSB is provided in a time window, for the exposure of the beam-ON data set. The two-dimensional distribution of the SSB is obtained by assuming it to be constant over time. Finally, is the predicted number of CENS events that depends on the physics model under consideration.
The systematic uncertainty on the signal prediction is and it is dominated by the uncertainty on the neutrino flux (10%), but includes also the uncertainty on the detector location (0.5%), energy calibration (1%), active mass (1%) and form factors (1%). The systematic uncertainty on the SSB is , thanks to the fact that the simultaneous fit of ON and OFF data allows one to constrain the normalisation of the SSB in the fit precisely.
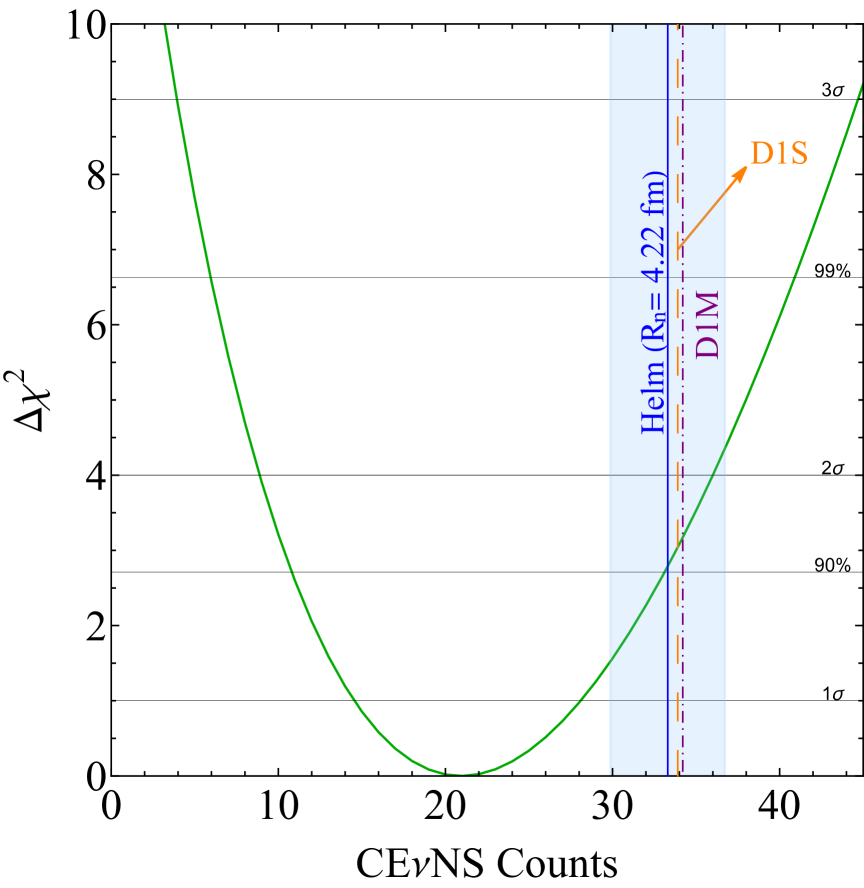
We employ Eq. (11) to extract the experimental number of CENS events obtained leaving the CENS normalisation free to vary in the fit, while removing the systematic uncertainty .
The marginal distribution is shown in Fig. 2, which is in excellent agreement with that released by the COHERENT collaboration Adamski et al. (2025).
We find about CENS events, which should be compared with our theoretical prediction of 33.33.4 events assuming a Helm neutron FF with an average neutron rms radius from NSM, which increases to 33.93.5 (34.23.5) considering the D1S (D1M) model for the neutron nuclear density. Our theoretical prediction obtained using the NSM is 1.7 above the best-fit value. This small tension increases to about 1.8 when assuming the D1S and D1M nuclear models.
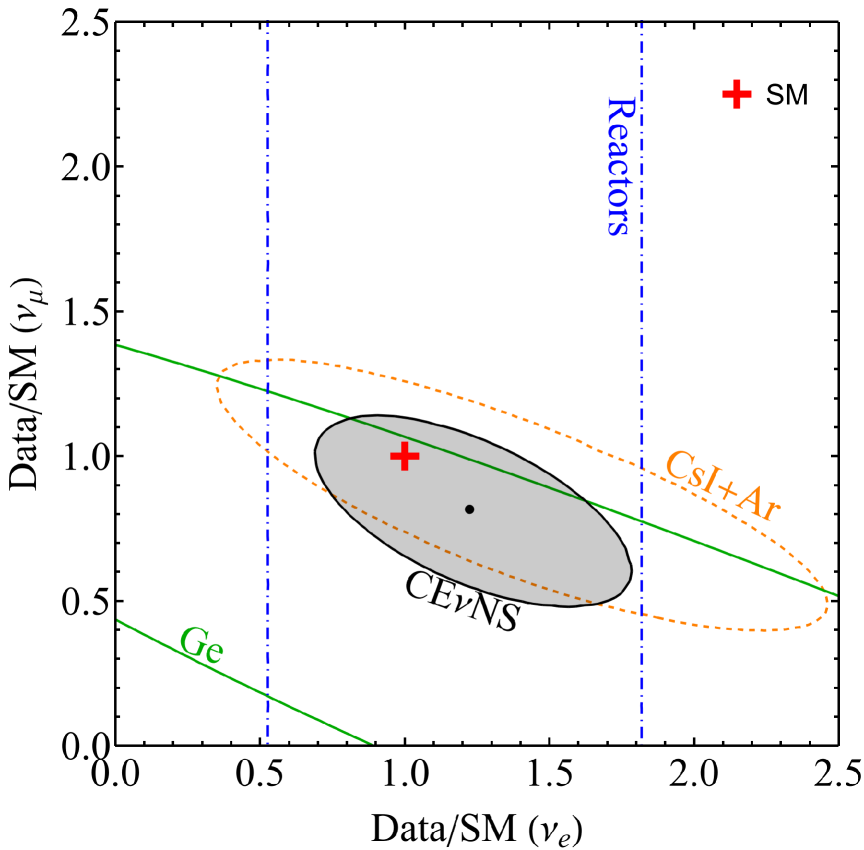
In order to search for potential flavour-dependent effects in the COHERENT germanium data and exploit the power of the timing information, we split the signal normalisation, , according to the neutrino flavour. This strategy, introduced in Ref. Atzori Corona et al. (2025b), allows for a meaningful comparison with reactor CENS data, which are sensitive only to the flavour. The result is shown in Fig. 3 at the 90% confidence level (CL). Within this combined analysis, we find a general agreement among all CENS probes, obtaining
| (14) |
The best fit indicates a preference for a slightly higher normalisation of the electronic flavour, but consistent with the SM within 1, while a slight under fluctuation is observed for the muonic flavour, at the 1 level. Nevertheless, both normalisations remain consistent with one at the 90% CL. Future datasets with improved statistical precision will allow for a more accurate testing of SM predictions.
IV Implications for Electroweak and Nuclear Physics
In Fig. 4 we show the constraints on the value of the weak mixing angle, , from the COHERENT Ge data-set, by fixing the neutron nuclear radius to the theoretical predictions from NSM and the D1S model (which practically overlaps with the D1M one). We notice that the extracted values of the weak mixing angle are not strongly dependent on the parameterisation of the nuclear structure, making CENS a robust probe for studying SM key parameters. In the same figure, we also show the constraints from the joint CsI Atzori Corona et al. (2023) and Ar Cadeddu et al. (2020b) analysis, from reactor data, i.e. CONUS+, TEXONO with the inclusion of GeN, and the result of a combined analysis when fixing the neutron nuclear radius to the NSM prediction. The result of this combined analysis is
| (15) |
This result represents the state-of-the-art determination on the low-energy value of the weak mixing angle from CENS probes, and it is consistent with the SM and the recent re-evaluation in Ref. Atzori Corona et al. (2024b).

When using electroweak probes with nuclei, the weak mixing angle is known to be correlated with the neutron nuclear radius Cadeddu et al. (2021b, 2024); Atzori Corona et al. (2024b); Cadeddu and Dordei (2019); Atzori Corona et al. (2023). Therefore, we also perform a two-dimensional analysis by considering both and as free parameters. The outcome is shown in Fig. 5, where we also display the result of a fit to reactor germanium data under this configuration. This result clearly highlights the complementarity between the findings obtained by fitting data from accelerator-based neutrino experiments and those from reactor-based experiments. The former exhibits a band with a strong correlation between the weak mixing angle and the neutron nuclear radius. On the contrary the reactor CENS data are practically insensitive to . To further restrict the phase-space available on the weak mixing angle, in our analysis we also consider low-energy scattering data from TEXONO Deniz et al. (2010), LSND Auerbach et al. (2001), LAMPF Allen et al. (1993), LZ Aalbers et al. (2023), PandaX Zhang et al. (2022) and XENONnT Aprile et al. (2022) electron recoil data, as described in Ref. Atzori Corona et al. (2025a). By using all these data we obtain a clean low-energy determination of the weak mixing angle, which is independent of the neutron nuclear radius.

By combining all these inputs we find, at the CL, the following values
| (16) |
The value of the nuclear neutron radius emerging from this analysis is exceptionally high with respect to those obtained in the HF+BCS calculations and excludes the NSM prediction Hoferichter et al. (2020) at about . This disagreement is driven by the positive correlation of and in COHERENT data. In addition, we remark that the scattering data slightly prefer higher values than those indicated by the SM, and this selects a region of the parameter space in disagreement with expectations. The adoption of the best-fit values in Eq. (16) improves the fit to COHERENT Ge data by , when compared to the use of the expected SM and NSM and values, respectively. This can be physically explained by the fact that a larger nuclear radius is responsible for an enhanced suppression in the cross section, which makes the prediction more in agreement with the under-fluctuations of events observed in the COHERENT Ge data.
We also evaluated the constraints on the average rms germanium nuclear radius when fixing the weak mixing angle to its SM value, namely Navas (2024), and we obtain
| (17) |
It is worth highlighting that the fact that the COHERENT collaboration removed the energy bins in the range , which corresponds to , is not beneficial for accurate studies of the nuclear structure, as a crucial part of the spectral shape information is lost. In fact, in this energy regime, the nuclear neutron form factor varies from when assuming the nuclear radius from nuclear shell models, as shown in Fig. 1 (b). Moreover, a CENS analysis in the full energy spectrum would not only be relevant to reduce the uncertainty on , but would also be crucial to search for insights beyond the nuclear theory.
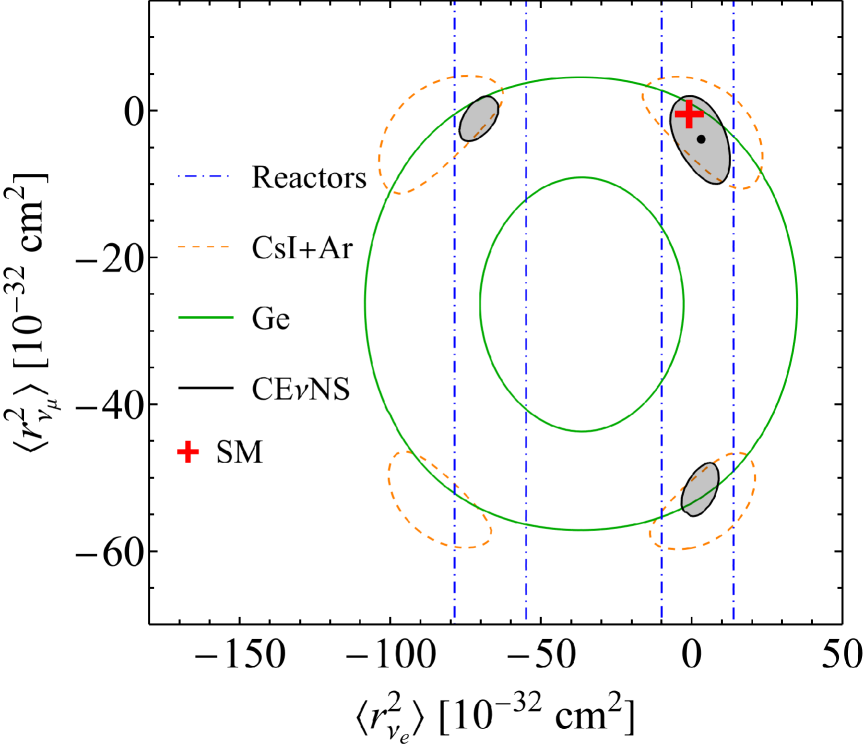
Another fundamental SM parameter which can be constrained by CENS processes is the neutrino charge radius. Here, we also account for the momentum-dependence of the neutrino charge-radius radiative correction, as described in Ref. Atzori Corona et al. (2024a). The results of the fit to all available CENS data are summarised in Fig. 6 by using a and plane. Due to the limited statistics, at 90% CL COHERENT Ge displays a full degeneracy among these two parameters which can be broken thanks to the complementarity with reactor data which are only sensitive to the electronic neutrino flavour. Intriguingly, even if the 2D contours in Fig. 6 present three degenerate regions at the 90% CL, when considering 2 degrees of freedom (), the corresponding marginal 1D distributions select the SM region at the 1 CL for both flavors, namely
| (18) | ||||
| (19) |
V Interpretations and conclusions
We investigate the possible sources of the small discrepancy between theoretical predictions and data of the COHERENT germanium dataset. Nuclear physics does not appear to resolve this issue, as the best-fit value for the neutron rms radius is found to be unphysically large, see Eq. (16). Invoking physics Beyond the Standard Model (BSM) is also challenging in this case, as most BSM scenarios, such as neutrino magnetic moments, millicharges, or light mediator bosons, typically predict an excess of events compared to the SM, whereas the germanium data shows a deficit.
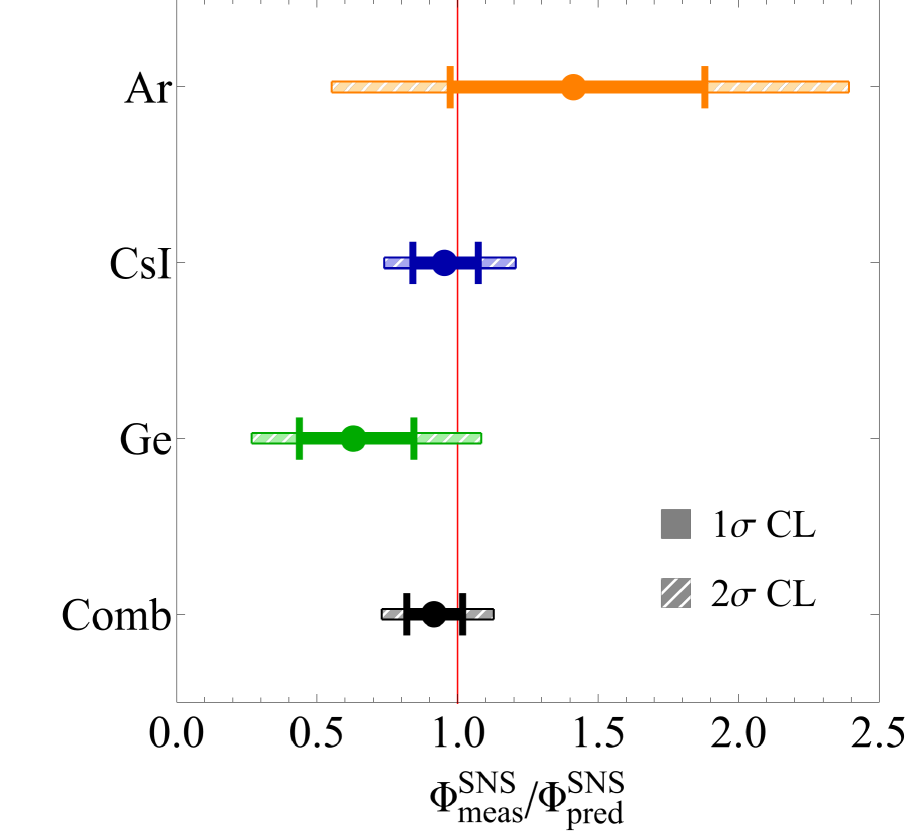
We therefore focus on a possible systematic effect related to the neutrino flux measured at the SNS, , which represents the dominant uncertainty in the CENS signal. To explore this, we show in Fig. 7 the constraints obtained by allowing the normalisation of the SNS neutrino flux to vary freely in the fit. This normalisation is taken relative to the total predicted neutrino flux, , during the data-taking period. We obtain
| (20) | ||||
| (21) | ||||
| (22) | ||||
| (23) |
The combined result in Eq. (23) indicates a possible flux deficit, with a best-fit combined normalisation factor of 0.92. However, this value remains compatible with unity at the 1 level and falls within the 10% systematic uncertainty quoted by the collaboration. This downward fluctuation is primarily driven by the CsI and Ge datasets, while the Ar dataset shows a slight upward fluctuation, albeit with a much larger uncertainty.
Although this analysis does not provide conclusive evidence for a flux-related systematic effect that could explain the event deficit observed in COHERENT Ge, it clearly highlights the importance of reducing the associated uncertainty.
For this purpose, COHERENT is developing a new detector Akimov et al. (2021c) based on heavy water , which aims to reduce the neutrino flux uncertainty to the 2–3% level. The detector will be positioned approximately 20 meters from the SNS target and is expected to achieve better than 5% statistical uncertainty on the neutrino flux within two years of operation. This heavy-water detector will also serve as the first module of a two-module system, ultimately designed to provide high-precision flux measurements.
This will significantly improve the precision on both SM and BSM observables and help clarify whether the tension in the COHERENT Ge dataset is merely a statistical fluctuation or an indication of new physics.
Despite the small underfluctuation observed in the COHERENT germanium data, our combined analysis of all available CENS measurements yields a consistent and robust global picture. This joint fit enables precise determinations of the weak mixing angle and the neutrino charge radii, demonstrating the value of integrating diverse experimental inputs. In particular, the complementarity between accelerator- and reactor-based CENS experiments is essential to break parameter degeneracies and to reduce uncertainties. This unified approach not only maximises the scientific return of current data but also lays solid foundations for future precision CENS studies. As the field advances toward next-generation detectors with improved sensitivity, varied target materials, and broader physics goals, such global strategies will be essential to fully exploit the potential of CENS .
Acknowledgements.
The work of C. Giunti is partially supported by the PRIN 2022 research grant Number 2022F2843L funded by MIUR.References
- Freedman (1974) D. Z. Freedman, Phys. Rev. D 9, 1389 (1974).
- Cadeddu et al. (2023) M. Cadeddu, F. Dordei, and C. Giunti, EPL 143, 34001 (2023), arXiv:2307.08842 [hep-ph] .
- Atzori Corona et al. (2025a) M. Atzori Corona, M. Cadeddu, N. Cargioli, F. Dordei, C. Giunti, and C. A. Ternes, “The Standard Model tested with neutrinos,” (2025a), arXiv:2504.05272 [hep-ph] .
- Akimov et al. (2017) D. Akimov et al. (COHERENT), Science 357, 1123 (2017), arXiv:1708.01294 [nucl-ex] .
- Akimov et al. (2018) D. Akimov et al. (COHERENT), “COHERENT Collaboration data release from the first observation of coherent elastic neutrino-nucleus scattering,” (2018), arXiv:1804.09459 [nucl-ex] .
- Akimov et al. (2022) D. Akimov et al. (COHERENT), Phys. Rev. Lett. 129, 081801 (2022), arXiv:2110.07730 [hep-ex] .
- Akimov et al. (2021a) D. Akimov et al. (COHERENT), Phys. Rev. Lett. 126, 012002 (2021a), arXiv:2003.10630 [nucl-ex] .
- De Romeri et al. (2024a) V. De Romeri, D. K. Papoulias, G. Sanchez Garcia, C. A. Ternes, and M. Tórtola, “Neutrino electromagnetic properties and sterile dipole portal in light of the first solar CENS data,” (2024a), arXiv:2412.14991 [hep-ph] .
- Akimov et al. (2024) D. Y. Akimov et al., “First constraints on the coherent elastic scattering of reactor antineutrinos off xenon nuclei,” (2024), arXiv:2411.18641 [hep-ex] .
- De Romeri et al. (2024b) V. De Romeri, D. K. Papoulias, and C. A. Ternes, “Bounds on new neutrino interactions from the first CENS data at direct detection experiments,” (2024b), arXiv:2411.11749 [hep-ph] .
- Majumdar et al. (2024) A. Majumdar, D. K. Papoulias, H. Prajapati, and R. Srivastava, “Constraining low scale Dark Hypercharge symmetry at spallation, reactor and Dark Matter direct detection experiments,” (2024), arXiv:2411.04197 [hep-ph] .
- Pandey (2024) V. Pandey, Prog. Part. Nucl. Phys. 134, 104078 (2024), arXiv:2309.07840 [hep-ph] .
- Coloma et al. (2023) P. Coloma, M. C. Gonzalez-Garcia, M. Maltoni, J. a. P. Pinheiro, and S. Urrea, JHEP 08, 032 (2023), arXiv:2305.07698 [hep-ph] .
- Aristizabal Sierra et al. (2024) D. Aristizabal Sierra, N. Mishra, and L. Strigari, “Implications of first neutrino-induced nuclear recoil measurements in direct detection experiments,” (2024), arXiv:2409.02003 [hep-ph] .
- Cadeddu et al. (2018a) M. Cadeddu, C. Giunti, Y. F. Li, and Y. Y. Zhang, Phys. Rev. Lett. 120, 072501 (2018a), arXiv:1710.02730 [hep-ph] .
- Cadeddu et al. (2018b) M. Cadeddu, C. Giunti, K. A. Kouzakov, Y.-F. Li, Y.-Y. Zhang, and A. I. Studenikin, Phys. Rev. D 98, 113010 (2018b), [Erratum: Phys.Rev.D 101, 059902 (2020)], arXiv:1810.05606 [hep-ph] .
- Cadeddu et al. (2020a) M. Cadeddu, F. Dordei, C. Giunti, Y. F. Li, and Y. Y. Zhang, Phys. Rev. D 101, 033004 (2020a), arXiv:1908.06045 [hep-ph] .
- Cadeddu et al. (2020b) M. Cadeddu, F. Dordei, C. Giunti, Y. F. Li, E. Picciau, and Y. Y. Zhang, Phys. Rev. D 102, 015030 (2020b), arXiv:2005.01645 [hep-ph] .
- Cadeddu and Dordei (2019) M. Cadeddu and F. Dordei, Phys. Rev. D 99, 033010 (2019), arXiv:1808.10202 [hep-ph] .
- Cadeddu et al. (2021a) M. Cadeddu, N. Cargioli, F. Dordei, C. Giunti, Y. F. Li, E. Picciau, and Y. Y. Zhang, JHEP 01, 116 (2021a), arXiv:2008.05022 [hep-ph] .
- Cadeddu et al. (2021b) M. Cadeddu, N. Cargioli, F. Dordei, C. Giunti, Y. F. Li, E. Picciau, C. A. Ternes, and Y. Y. Zhang, Phys. Rev. C 104, 065502 (2021b), arXiv:2102.06153 [hep-ph] .
- Atzori Corona et al. (2022a) M. Atzori Corona, M. Cadeddu, N. Cargioli, F. Dordei, C. Giunti, Y. F. Li, E. Picciau, C. A. Ternes, and Y. Y. Zhang, JHEP 05, 109 (2022a), arXiv:2202.11002 [hep-ph] .
- Atzori Corona et al. (2022b) M. Atzori Corona, M. Cadeddu, N. Cargioli, F. Dordei, C. Giunti, Y. F. Li, C. A. Ternes, and Y. Y. Zhang, JHEP 09, 164 (2022b), arXiv:2205.09484 [hep-ph] .
- Atzori Corona et al. (2023) M. Atzori Corona, M. Cadeddu, N. Cargioli, F. Dordei, C. Giunti, and G. Masia, Eur. Phys. J. C 83, 683 (2023), arXiv:2303.09360 [nucl-ex] .
- Atzori Corona et al. (2024a) M. Atzori Corona, M. Cadeddu, N. Cargioli, F. Dordei, and C. Giunti, JHEP 05, 271 (2024a), arXiv:2402.16709 [hep-ph] .
- Coloma et al. (2017) P. Coloma, M. C. Gonzalez-Garcia, M. Maltoni, and T. Schwetz, Phys. Rev. D 96, 115007 (2017), arXiv:1708.02899 [hep-ph] .
- Liao and Marfatia (2017) J. Liao and D. Marfatia, Phys. Lett. B 775, 54 (2017), arXiv:1708.04255 [hep-ph] .
- Lindner et al. (2017) M. Lindner, W. Rodejohann, and X.-J. Xu, JHEP 03, 097 (2017), arXiv:1612.04150 [hep-ph] .
- Giunti (2020) C. Giunti, Phys. Rev. D 101, 035039 (2020), arXiv:1909.00466 [hep-ph] .
- Denton et al. (2018) P. B. Denton, Y. Farzan, and I. M. Shoemaker, JHEP 07, 037 (2018), arXiv:1804.03660 [hep-ph] .
- Aristizabal Sierra et al. (2018) D. Aristizabal Sierra, V. De Romeri, and N. Rojas, Phys. Rev. D 98, 075018 (2018), arXiv:1806.07424 [hep-ph] .
- Miranda et al. (2020) O. G. Miranda, D. K. Papoulias, G. Sanchez Garcia, O. Sanders, M. Tórtola, and J. W. F. Valle, JHEP 05, 130 (2020), [Erratum: JHEP 01, 067 (2021)], arXiv:2003.12050 [hep-ph] .
- Banerjee et al. (2021) H. Banerjee, B. Dutta, and S. Roy, Phys. Rev. D 104, 015015 (2021), arXiv:2103.10196 [hep-ph] .
- Papoulias et al. (2020) D. K. Papoulias, T. S. Kosmas, R. Sahu, V. K. B. Kota, and M. Hota, Phys. Lett. B 800, 135133 (2020), arXiv:1903.03722 [hep-ph] .
- Papoulias and Kosmas (2018) D. K. Papoulias and T. S. Kosmas, Phys. Rev. D 97, 033003 (2018), arXiv:1711.09773 [hep-ph] .
- Dutta et al. (2020) B. Dutta, D. Kim, S. Liao, J.-C. Park, S. Shin, and L. E. Strigari, Phys. Rev. Lett. 124, 121802 (2020), arXiv:1906.10745 [hep-ph] .
- Abdullah et al. (2018) M. Abdullah, J. B. Dent, B. Dutta, G. L. Kane, S. Liao, and L. E. Strigari, Phys. Rev. D 98, 015005 (2018), arXiv:1803.01224 [hep-ph] .
- Ge and Shoemaker (2018) S.-F. Ge and I. M. Shoemaker, JHEP 11, 066 (2018), arXiv:1710.10889 [hep-ph] .
- Miranda et al. (2021) O. G. Miranda, D. K. Papoulias, O. Sanders, M. Tórtola, and J. W. F. Valle, JHEP 12, 191 (2021), arXiv:2109.09545 [hep-ph] .
- Flores et al. (2020) L. J. Flores, N. Nath, and E. Peinado, JHEP 06, 045 (2020), arXiv:2002.12342 [hep-ph] .
- Farzan et al. (2018) Y. Farzan, M. Lindner, W. Rodejohann, and X.-J. Xu, JHEP 05, 066 (2018), arXiv:1802.05171 [hep-ph] .
- Brdar et al. (2018) V. Brdar, W. Rodejohann, and X.-J. Xu, JHEP 12, 024 (2018), arXiv:1810.03626 [hep-ph] .
- Adamski et al. (2025) S. Adamski et al. (COHERENT), Phys. Rev. Lett. 134, 231801 (2025).
- Ackermann et al. (2025) N. Ackermann et al., “First observation of reactor antineutrinos by coherent scattering,” (2025), arXiv:2501.05206 [hep-ex] .
- Karmakar et al. (2025) S. Karmakar et al. (TEXONO), Phys. Rev. Lett. 134, 121802 (2025), arXiv:2411.18812 [nucl-ex] .
- Belov et al. (2025) V. Belov et al. (nuGeN), (2025), 10.1088/1674-1137/adb9c8, arXiv:2502.18502 [hep-ex] .
- Berglund and Wieser (2011) M. Berglund and M. E. Wieser, Pure and Applied Chemistry 83, 397 (2011).
- Erler and Su (2013) J. Erler and S. Su, Prog. Part. Nucl. Phys. 71, 119 (2013), arXiv:1303.5522 [hep-ph] .
- Navas (2024) S. e. a. Navas (Particle Data Group Collaboration), Phys. Rev. D 110, 030001 (2024).
- Giunti et al. (2024) C. Giunti, K. Kouzakov, Y.-F. Li, and A. Studenikin, “Neutrino Electromagnetic Properties,” (2024), arXiv:2411.03122 [hep-ph] .
- Bernabeu et al. (2000) J. Bernabeu, L. G. Cabral-Rosetti, J. Papavassiliou, and J. Vidal, Phys. Rev. D 62, 113012 (2000), arXiv:hep-ph/0008114 .
- Bernabeu et al. (2002) J. Bernabeu, J. Papavassiliou, and J. Vidal, Phys. Rev. Lett. 89, 101802 (2002), [Erratum: Phys.Rev.Lett. 89, 229902 (2002)], arXiv:hep-ph/0206015 .
- Helm (1956) R. H. Helm, Phys. Rev. 104, 1466 (1956).
- Piekarewicz et al. (2016) J. Piekarewicz, A. R. Linero, P. Giuliani, and E. Chicken, Phys. Rev. C 94, 034316 (2016), arXiv:1604.07799 [nucl-th] .
- Klein and Nystrand (1999) S. Klein and J. Nystrand, Phys. Rev. C 60, 014903 (1999), arXiv:hep-ph/9902259 .
- Fricke et al. (1995) G. Fricke, C. Bernhardt, K. Heilig, L. A. Schaller, L. Schellenberg, E. B. Shera, and C. W. de Jager, Atom. Data Nucl. Data Tabl. 60, 177 (1995).
- Fricke and Heilig (2004) G. Fricke and K. Heilig, “Nuclear charge radii 32ge germanium: Datasheet from landolt-bornstein - group i elementary particles, nuclei and atoms, volume 20,” (2004), copyright 2004 Springer-Verlag Berlin Heidelberg.
- Angeli and Marinova (2013) I. Angeli and K. P. Marinova, Atom. Data Nucl. Data Tabl. 99, 69 (2013).
- Berger et al. (1991) J. F. Berger, M. Girod, and D. Gogny, Comput. Phys. Commun. 63, 365 (1991).
- Chabanat et al. (1998) E. Chabanat, P. Bonche, P. Haensel, J. Meyer, and R. Schaeffer, Nucl. Phys. A 635, 231 (1998), [Erratum: Nucl.Phys.A 643, 441–441 (1998)].
- Hoferichter et al. (2020) M. Hoferichter, J. Menéndez, and A. Schwenk, Phys. Rev. D 102, 074018 (2020), arXiv:2007.08529 [hep-ph] .
- Khaleq et al. (2025) R. A. Khaleq, J. L. Newstead, C. Simenel, and A. E. Stuchbery, Phys. Rev. D 111, 033003 (2025).
- Co’ et al. (2020) G. Co’, M. Anguiano, and A. M. Lallena, JCAP 04, 044 (2020), arXiv:2001.04684 [nucl-th] .
- Co et al. (2021) G. Co, M. Anguiano, and A. M. Lallena, Phys. Rev. C 104, 014313 (2021), arXiv:2107.09938 [nucl-th] .
- Atzori Corona et al. (2025b) M. Atzori Corona, M. Cadeddu, N. Cargioli, F. Dordei, and C. Giunti, (2025b), arXiv:2501.18550 [hep-ph] .
- Perissé et al. (2023) L. Perissé, A. Onillon, X. Mougeot, M. Vivier, T. Lasserre, A. Letourneau, D. Lhuillier, and G. Mention, Phys. Rev. C 108, 055501 (2023), arXiv:2304.14992 [nucl-ex] .
- Akimov et al. (2021b) D. Akimov et al., “Measurement of the Coherent Elastic Neutrino-Nucleus Scattering Cross Section on CsI by COHERENT,” (2021b), arXiv:2110.07730 [hep-ex] .
- Akimov et al. (2020) D. Akimov et al. (COHERENT), “COHERENT Collaboration data release from the first detection of coherent elastic neutrino-nucleus scattering on argon,” (2020), arXiv:2006.12659 [nucl-ex] .
- Lindhard et al. (1963) J. Lindhard, V. Nielsen, M. Scharff, and P. V. Thomsen, Kgl. Danske Videnskab., Selskab. Mat. Fys. Medd. 33, 10 (1963).
- Bonhomme et al. (2022) A. Bonhomme et al., Eur. Phys. J. C 82, 815 (2022), arXiv:2202.03754 [physics.ins-det] .
- Bouabid (2024) R. Bouabid (COHERENT), “First Measurement of CEvNS on Germanium by COHERENT,” (2024), presentation at the Magnificent CENNS Workshop.
- Atzori Corona et al. (2024b) M. Atzori Corona, M. Cadeddu, N. Cargioli, F. Dordei, and C. Giunti, Phys. Rev. D 110, 033005 (2024b), arXiv:2405.09416 [hep-ph] .
- Cadeddu et al. (2024) M. Cadeddu, N. Cargioli, J. Erler, M. Gorchtein, J. Piekarewicz, X. Roca-Maza, and H. Spiesberger, Phys. Rev. C 110, 035501 (2024), arXiv:2407.09743 [hep-ph] .
- Deniz et al. (2010) M. Deniz et al. (TEXONO), Phys. Rev. D 81, 072001 (2010), arXiv:0911.1597 [hep-ex] .
- Auerbach et al. (2001) L. B. Auerbach et al. (LSND), Phys. Rev. D 63, 112001 (2001), arXiv:hep-ex/0101039 .
- Allen et al. (1993) R. C. Allen, H. H. Chen, P. J. Doe, R. Hausammann, W. P. Lee, X. Q. Lu, H. J. Mahler, M. E. Potter, K. C. Wang, T. J. Bowles, R. L. Burman, R. D. Carlini, D. R. F. Cochran, J. S. Frank, E. Piasetzky, V. D. Sandberg, D. A. Krakauer, and R. L. Talaga, Phys. Rev. D 47, 11 (1993).
- Aalbers et al. (2023) J. Aalbers et al. (LZ), Phys. Rev. Lett. 131, 041002 (2023), arXiv:2207.03764 [hep-ex] .
- Zhang et al. (2022) D. Zhang et al. (PandaX), Phys. Rev. Lett. 129, 161804 (2022), arXiv:2206.02339 [hep-ex] .
- Aprile et al. (2022) E. Aprile et al. (XENON), Phys. Rev. Lett. 129, 161805 (2022), arXiv:2207.11330 [hep-ex] .
- Akimov et al. (2021c) D. Akimov et al. (COHERENT), JINST 16, P08048 (2021c), arXiv:2104.09605 [physics.ins-det] .