On the ambient conditions crystal structure of AgSbTe2
Abstract
We present a combined X-ray and neutron diffraction, Raman spectroscopy, and 121Sb NMR studies of AgSbTe2, supported by first-principles calculations aiming to elucidate its crystal structure. While diffraction methods cannot unambiguously resolve the structure, Raman and NMR data, together with electric field gradient calculations, strongly support the rhombohedral phase. Moreover, the agreement between experimental and calculated Raman spectra further corroborates this result, resolving the 60-year sold debate about the exact crystal structure of the AgSbTe2 compound.
The global growing demands for energy consumption and the accompanying environmental issues have forced the scientific community to find solutions to overcome the energy crisis and the development of sustainable and environmentally friendly energy resources has become critical [1]. In this context, the application of thermoelectric (TE) materials that can directly convert energy from heat to electricity and vice versa, is a very promising way to overcome present challenges. AgSbTe2, a ternary chalcogenide TE material, appears promising mainly due to its very low thermal conductivity 0.5–0.7 Wm-1K-1 [2, 3, 4] and its very narrow band gap of 7.6 meV [5]. Recently, it has gained significant attention for achieving a high figure of merit (ZT) of approximately 2.6 at 573 K through cadmium doping [6].
However, its crystal structure at room temperature (RT), which is of fundamental importance for understanding and tuning its corresponding TE properties, has been the subject of a long debate. Initially, it was considered to have a cubic disordered NaCl-type partial solid solution structure[7]. In this crystal structure, Ag and Sb occupy the 4a Wyckoff positions (Na-site) with 50% occupancy. This solid solution arrangement was challenged by Quarez [8] and three ordered structures, with space groups , and (-NaFeO2-type), have been proposed as the ones that can best index the corresponding single-crystal X-ray diffraction (XRD) results.
Subsequent first-principles calculations [4] suggested that the ordered (D4) crystal structure has lower energy compared to the structures identified by Quarez However, in the same study, rhombohedral (L) was found to have practically degenerate energy with the D4 structure. Indeed, the negligible energy difference between the D4 and L structures was confirmed by later first-principles calculations [9, 10, 11]. Further first-principles studies of the temperature-dependent Helmholz free energies of the cubic, tetragonal, and rhombohedral polymorphs indicate slight differences between these three values around RT, so that evident identification of the stable structure remains unequivocal [12, 13, 14]. Therefore, the exact crystal structure of AgSbTe2 remains an open question. Accurate determination of its crystal structure is of critical importance for relevant theoretical calculations aiming to elucidate and tune its thermal and electrical transport properties followed by its high TE performance.
In this study, our goal is to accurately determine the crystal structure of AgSbTe2 based on the previously proposed crystal structures , , , and . We used concomitant XRD, neutron diffraction (ND), Raman spectroscopy and solid-state nuclear magnetic resonance (NMR) experimental probes combined with first-principle density functional theory (DFT) calculations of the corresponding Raman spectra. Both diffraction techniques are unable to provide a definitive structural determination. On the other hand, Raman as well as NMR spectroscopy results provide a definitive identification of the rhombohedral L crystal structure.
AgSbTe2 specimens were synthesized from high-purity raw materials, including silver (Ag, 99.999%, Alfa Aesar) granules, antimony (Sb, 99.999%, Alfa Aesar) granules and tellurium (Te, 99.99%, Strem Chemicals) broken ingots. These raw materials were mixed in the appropriate molar ratios to yield the desired composition resulting in a total ingot mass of 20 g. The mixture was loaded into quartz ampules, which were evacuated to 5 × 10⁻⁵ torr residual pressure and sealed. The sealed ampules were annealed to 1000 oC in a programmable vertical tube furnace, where their molten content was mixed three times during a 32-h soaking period. Afterwards, the ampules were cooled by quenching in ice-water to obtain AgSbTe2 ingots, which were further ground into fine powders sieved with a 56 m mesh.
The microstructure and compositional characterization of the samples was carried out using a Zeiss® Ultra Plus high-resolution scanning electron microscope (HR-SEM), equipped with a Schottky field-emission electron gun, as well as the FEI Quanta 200 SEM equipped with a 10 mm2 active area Oxford® INCA X-sight EDS detector with an energy resolution of 133 eV. The elemental composition was further examined using energy dispersive X-ray spectroscopy (EDX) measurements with a 8 kV electron beam and the results (23.4±0.5 at% of Ag, 26.8±0.3 at% of Sb and 49.8±0.6 at% of Te) confirmed the synthesis of AgSbTe2.
Powder XRD measurements were performed with the Cu K1 (=1.5406Å) X-ray line (Rigaku MiniFlex). Powder ND was performed using the general purpose powder diffractometer (GPPD) located at the China Spallation Neutron Source (CSNS). The GPPD is a time-of-flight (TOF) diffractometer with a neutron bandwidth of 4.8 Å, providing a maximum resolution of d/d=0.15%. The neutron pattern data in this study were acquired from three different banks of GPPD: 1500, 900, and 300, corresponding to the central solid angles of the detector. The d-space ranges were between 0.05-2.7Å, 0.06-4.3Å, and 0.12–28.11Å, respectively [15, 16]. The sample under investigation was loaded into 9 mm diameter TiZr can and all measurements were performed at RT.
Raman studies were performed using a custom-made confocal micro-Raman system with the 660 nm line of a solid-state laser for excitation in back scattering geometry. The laser probing spot dimension was 4 m. Raman spectra were recorded with a spectral resolution of 2 cm-1 using a single-stage grating spectrograph equipped with a charge-coupled device (CCD) array detector. The laser power on specimens was kept below 0.2 mW, to avoid any laser-induced decomposition. Ultra-low-frequency solid-state notch filters allowed us to measure Raman spectra down to 10 cm-1 [17].
NMR spectroscopy was conducted at 5.87 T (1H frequency 250 MHz) using homebuilt probes. 121Sb NMR powder spectra were recorded over ±2 MHz around 59.83 MHz using frequency-stepped Hahn echoes[18] with Gaussian amplitude modulation. The transmitter frequency was incremented in 25 kHz steps, employing 70 s pulses (40 kHz excitation bandwidth) at 0.4 W pulse power. With a 100 ms repetition time, the average pulse power was under 0.4 mW to minimize sample decomposition. Due to rapid spin coherence decay (s), echo pulse separations were kept below 6 µs. The full spectrum was reconstructed from individual echo intensities versus carrier frequency.
Electric field gradient calculations followed standard definitions of quadrupolar parameters[19, 20]. Atomic positions near Sb nuclei were iterated for and structures with a 50 Å cutoff. On-the-fly checks ensured convergence of Cq and η. Spectral simulations of full quadrupolar powder patterns employed the contour analysis method of Hughes and Harris [21], accounting for first- and second-order quadrupolar interactions. The line shape was convoluted with a Voigt profile (40 kHz Lorentzian and Gaussian components) to model natural linewidth effects.
Raman frequencies and intensities were calculated from first principles using the linear response pseudopotential plane-wave approach within the framework of density functional perturbation theory [22]. Local density approximation [23] was applied, and Troullier-Martins norm-conserving pseudopotentials [24] were employed, using valence states of 4d105s1, 5s25p3, 5s25p4 for Ag, Sb, and Te, respectively. Integration over the first Brillouin zone was performed using a 16×16×16 Monkhorst-Pack mesh [25]. All calculations were carried out with the QUANTUM-ESPRESSO package [26, 27]. The basic concept is solving the change of charge polarizations due to the perturbations introduced by the vibration (zone-center phonon). The background theory and computational techniques have been described elsewhere [22].
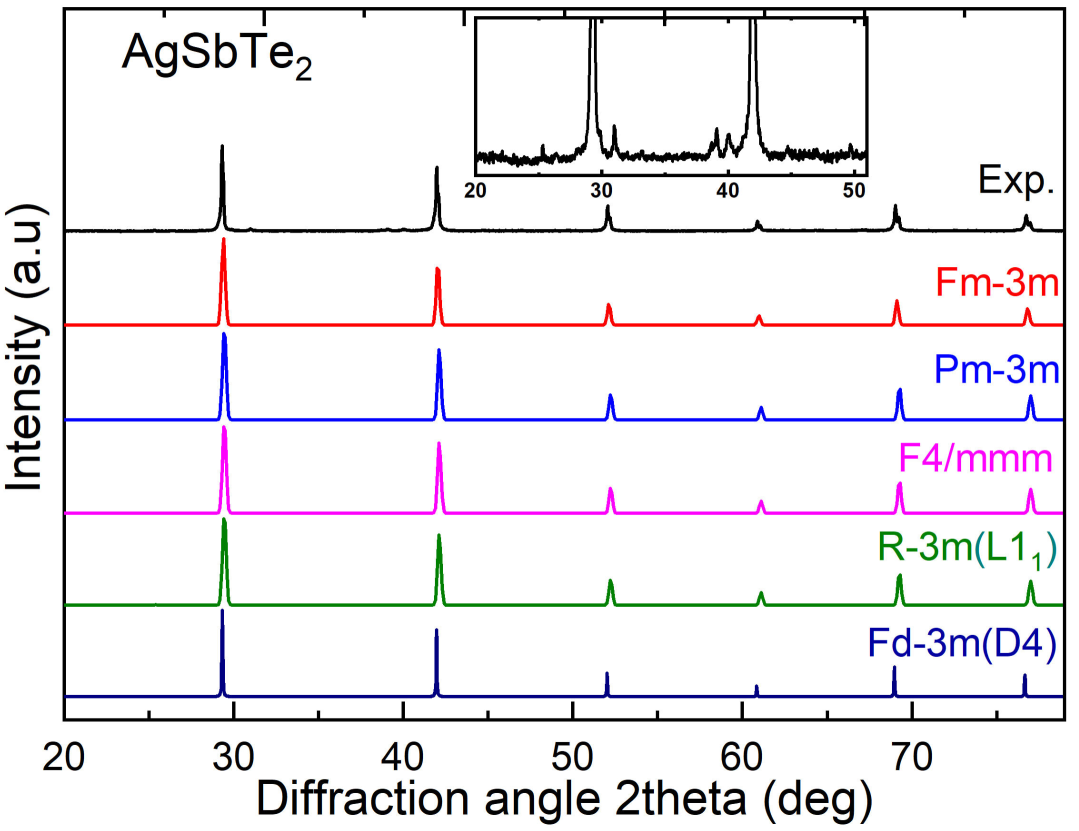
The experimental XRD pattern compared with the calculated patterns, using the POWDER CELL program [28] for the corresponding previously suggested crystal structures, is shown in Fig. 1. It is clear that powder XRD results cannot provide a conclusive answer to the exact crystal structure, in agreement with previous studies, since it can be fitted with any of the suggested crystal structures. The additional observed Bragg peaks, besides those associated to AgSbTe2, in the experimental XRD pattern can be assigned to the -Ag2Te phase, see inset of Fig. 1. The precipitation of -Ag2Te was also observed in previous studies [29, 30].
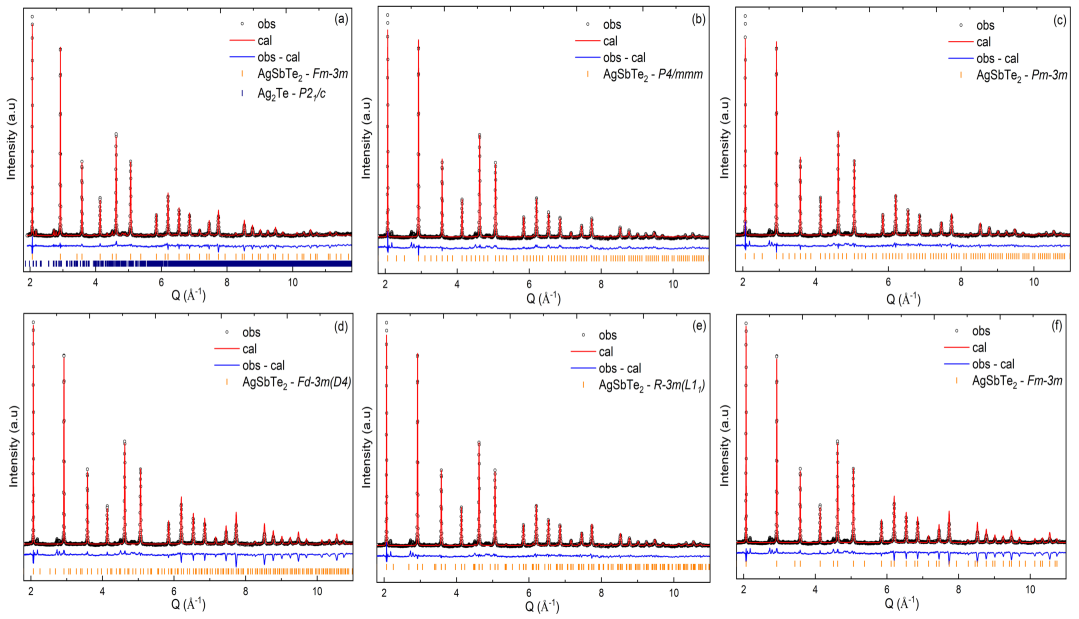
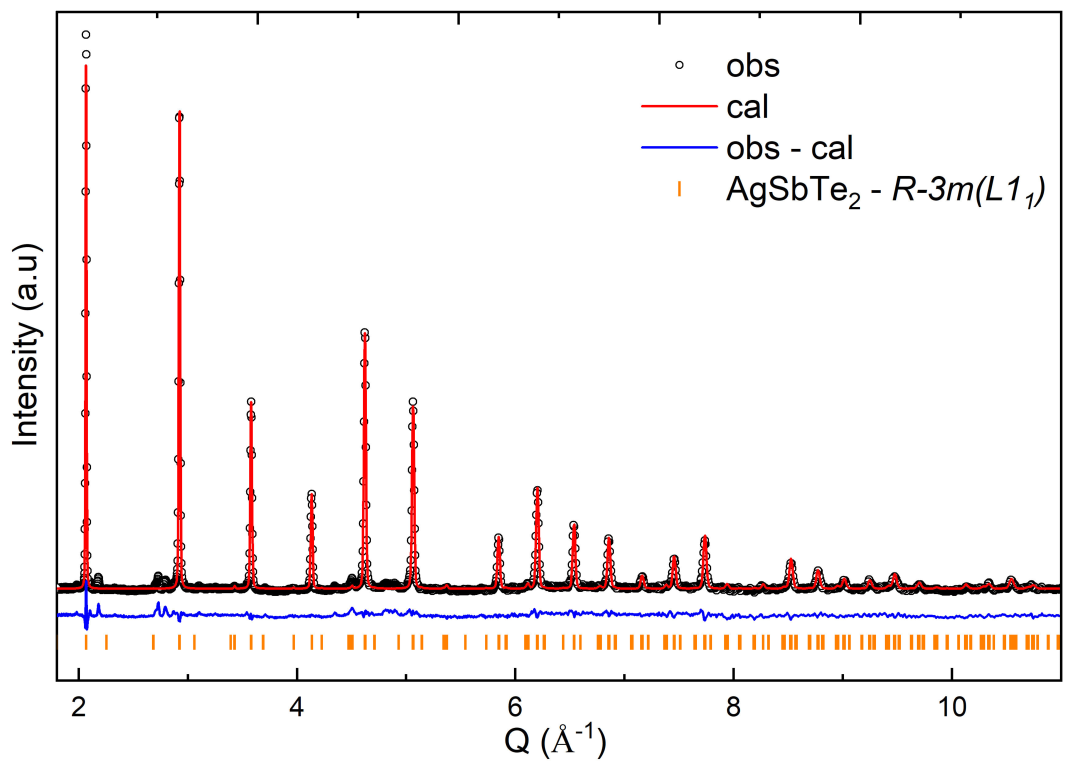
Rietveld refinements, using the software [31], were performed on the ND pattern, using the previously proposed crystal structures. The structure was used in order to determine the volume fraction of the -Ag2Te, as shown in Fig. S1(a) [32]. The volume fractions of the AgSbTe2 and the -Ag2Te phases were determined to be 95.81% and 4.191%, respectively. Subsequently, the Goodness of Fit (GOF), the reduced and Rw parameters for the various examined crystal structures were determined, see Figs. 2 and S1. These parameters were used as the criteria for assessing which structure provides the better fit. The corresponding results for the , (D4), (L11), and crystal structures are summarized in Table I. As in the case of powder XRD, powder ND results cannot provide a definitive identification of the crystal structure of AgSbTe2. In fact, Rietveld refinement calculations for different preselected structures indicate similar results; see Table I. The shortcoming of ND is most probably associated with the similar coherent neutron scattering cross sections of Ag (4.407 b), Sb (3.9 b) and Te (4.23 b) [33].
| Space Group | a [Å] | c [Å] | Ag | Sb | Te | GOF | R- | Rw |
|---|---|---|---|---|---|---|---|---|
| Fm-3m+-Ag2Te | 6.077 | - | 4a | 4a | 4b | 2.13 | 4.54 | 3.07% |
| Fm-3m | 6.077 | - | 4a | 4a | 4b | 3.42 | 11.72 | 5.08% |
| Fd-3m (D4) | 12.154 | - | 16c | 16d | 32e | 3.06 | 9.38 | 4.52% |
| R-3m (L11) | 4.295 | 21.073 | 3b | 3a | 6c | 3.00 | 8.97 | 4.42% |
| Pm-3m | 6.077 | - | 3c | 1b, 3c | 1a, 3d | 3.10 | 9.64 | 4.59% |
| P4/mmm | 4.297 | 6.077 | 1c | 1b | 1a, 1d | 3.11 | 9.68 | 4.61% |
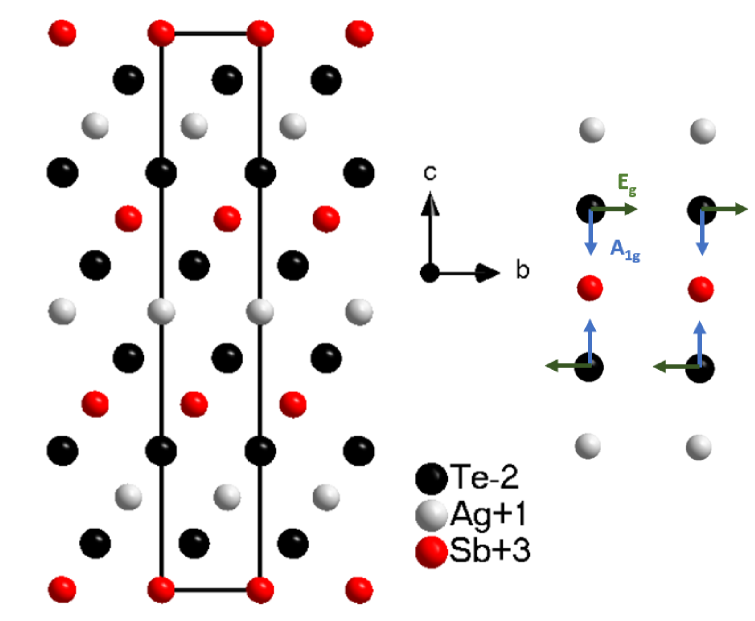
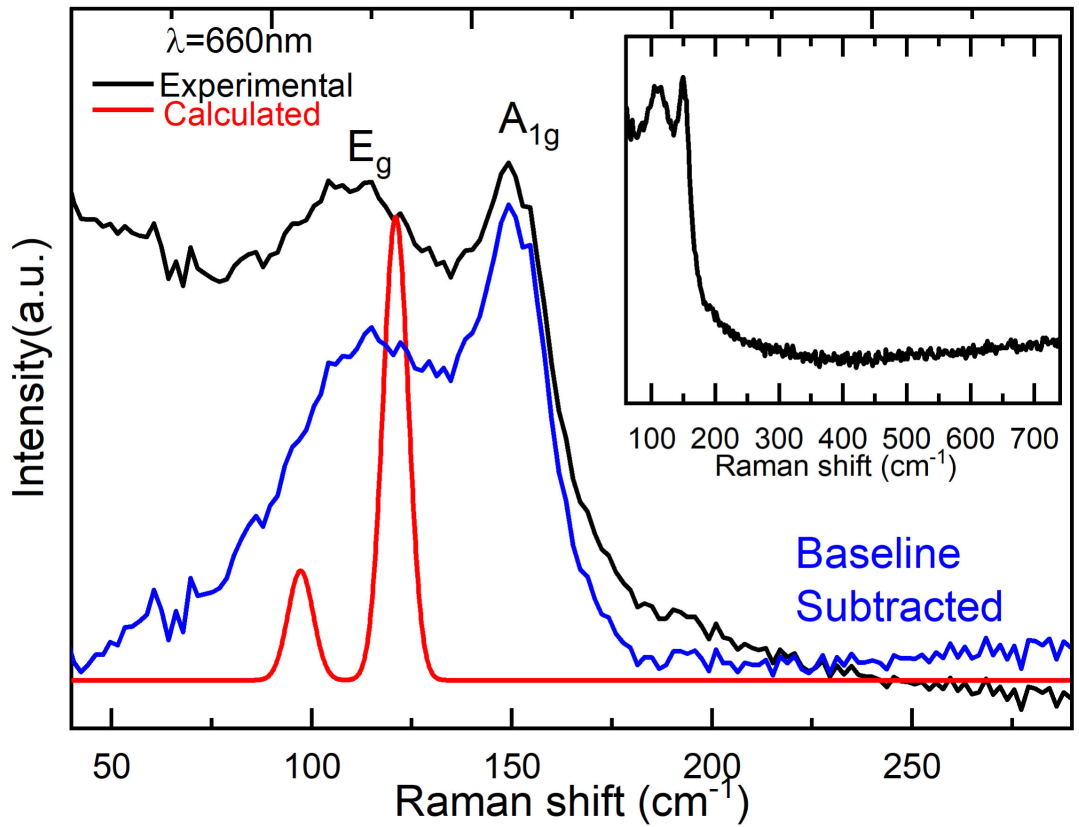
According to group theory, the Raman active zone center modes for the L11 crystal structure are = [34]. Both modes are associated with the Te (6c) atoms vibrations. This crystal structure is characterized by alternating Ag-Te-Sb-Te layers, perpendicular to the c-axis. For the mode, two adjacent Te layers vibrate rigidly against each other and parallel to the c-axis, while for the mode, two adjacent Te layers vibrate against each other and perpendicular to the c-axis [35, 36], see Fig. S2. In contrast, all the other previously suggested/proposed crystal structures are Raman inactive.
Although the overall Raman intensity is low and the relevant Raman peaks are close to the Rayleigh line, the Raman spectrum of this study, see Fig. 3, clearly indicates the existence of two Raman active modes at 114.7 and 149.1 cm-1. Furthermore, the relative intensities and frequencies are in fair agreement with those calculated for the L11 crystal structure of AgSbTe2. The agreement becomes even better after the subtraction of a simple baseline, reflecting the proximity to the Rayleigh line, see blue spectrum in Fig. 3. We attribute the apparent high-intensity of the Rayleigh to the, effectively, metallic character of AgSbTe2. Indeed, previous studies document that AgSbTe2 is either a semimetal [37] or a very narrow band gap ( 7.6 meV, below the thermal energy at ambient conditions) semiconductor with a high number of thermally excited and high-mobility electrons [5]. In addition to the agreement between the experimental and calculated spectra, further evidence support the assignment of the observed Raman modes originating from the structure. Indeed, the overall Raman spectrum “shape” and mode frequencies fits well with those of other -NaFeO2-type structure compounds, such as LiNiO2 and NaCrS2[38, 35], considering the higher mass of Te compared to Oxygen and Sulfur.
The ability to probe short- and medium-range local atomic arrangements makes nuclear magnetic resonance (NMR) spectroscopy a promising tool for elucidating the structural candidates of AgSbTe2. In particular, the quadrupole moment of nuclei with spin quantum number interacts with the surrounding charge distribution via the local electric field gradient (EFG)[39]. This quadrupolar interaction provides valuable information about the local symmetry and can be used to differentiate between competing structural models[19]. To this end, EFG tensors in their principal axis system were calculated for both the rocksalt-like and the rhombohedral structural candidates of AgSbTe2.
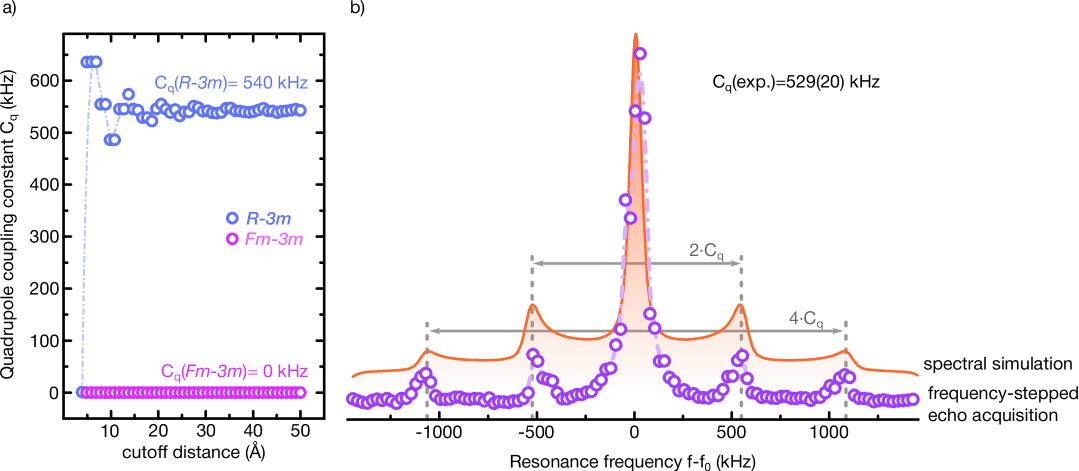
Figure 4(a) a shows the calculated values of the quadrupolar coupling constant (in kHz) as a function of the cutoff distance from the antimony atoms for both the and structural models. As shown, remains zero for the rocksalt-like structure, indicating complete quenching of the quadrupolar interaction, whereas the rhombohedral structure yields coupling constants around 540 kHz, consistent with an NMR spectrum governed by first-order quadrupolar interaction[40]. The experimental 121Sb-NMR spectrum measured at a magnetic field strength of 5.87 T, i shown in Fig. 4(b) . The positions of the spectral singularities associated with the multiple-quantum satellite transitions, i.e., and , indicate a quadrupolar coupling constant of kHz, in good agreement with the computed quadrupole coupling constant of the rhombohedral structural candidate.
The XRD results indicate that all of the previously suggested structures can fit the experimental pattern adequately. The Rietveld refinements performed for the various structures also showed that there are negligible differences between structures [8, 41]. However, to our knowledge, no ND results have been reported for AgSbTe2. Only one study reported ND measurements for AgSbSe2, from which it was also not possible to determine cation ordering [42]. Our ND Rietveld refinements showed that the L11 structure exhibits a slightly better fit, for all refinement criteria used in this study; see Table I. However, although these results point toward the L11 structure, the relative marginal differences preclude a definitive crystal structure determination. The relatively large GOF, R- and Rw for all refinements were due to the -Ag2Te second phase. If this phase is considered in the refinements, as shown in Table 1 for the case of the -AgSbTe2 + -Ag2Te mixture, then these values would be significantly lower, without changing the relative order of the fit quality.
According to the ND results, there is an 4% volume fraction of -Ag2Te as a second phase in the sample. In order to rule out the possibility that the observed Raman modes originate from this phase, albeit its very low amount, the experimental Raman spectrum was also compared to the Raman spectra of -Ag2Te from previous studies. The Raman spectrum of bulk polycrystalline -Ag2Te consists of two low intensity broad bands at 111 and 134 cm-1 and a broader feature at about 80 cm-1[43]. Also, the Raman spectrum of nano -Ag2Te thin film exhibits a sharp peak at 152 cm-1 and a broad peak in the 220 cm-1 - 315 cm-1 frequency range [44]. Another study found that the Raman spectrum of 3 nm thick -Ag2Te consists of Raman bands at 94.3, 121.8, and 141.9 cm-1 [45].
In our study, only two bands were observed at frequencies clearly distinct from all previously reported ones for various forms of -Ag2Te. Moreover, according to previous Raman studies on AgSbTe2, it was established that a high-intensity of the laser excitation can result in the decomposition of AgSbTe2 and the formation of TeO2, with characteristic strong peaks at 360-400 cm-1 and 660 cm-1 [43]. Such peaks are entirely absent in our experimental spectrum; see inset of Fig. 3. From the above discussion, together with the very low quantity of the -Ag2Te impurity, it can be accurately concluded that the observed Raman modes originate from the pure AgSbTe2.
The study of the local charge symmetry surrounding the antimony atoms, probed by the presented NMR experiments, demonstrated that a structurally isotropic rocksalt-like structure would result in a complete quenching of quadrupolar interaction and the observation of a single sharp resonance line, in clear contradiction to experimental observation. Indeed, recorded -NMR spectra show that the antimony spin system in AgSbTe2 is subject to first order quadrupole interaction, strongly favoring the rhombohedral structure, in good accordance with electric field gradient calculations.
Considering the combination of four experimental methods; X-ray and neutron diffraction, Raman and NMR spectroscopy together with ab-initio DFT calculations, we were able to collect conclusive evidence indicating the rhombohedral crystal structure as the most likely structural candidate of the ternary thermoelectric chalcogenide AgSbTe2. Although neutron diffraction refinements are compatible with the proposed model, conclusive structural identification arises from the excellent agreement between experimental and calculated Raman spectra. This assignment is further corroborated by NMR spectroscopy, which independently favors the rhombohedral structure. Our study resolves a 60-years old debate about the crystal symmetry of AgSbT and will further facilitate relevant studies exploring and tuning its thermoelectric properties.
The financial support from Guangdong Technion-Israel Institute of Technology (Grant No. ST2100002), MATEC (Grant No. 2022B1212010007, Guangdong Department of Science and Technology), and the Natural Sciences and Engineering Research Council of Canada (NSERC) is acknowledged. Y.A. would like to acknowledge generous support from the Pazy Research Foundation, Grant No. 2032063. The authors acknowledge the beamtime at the GPPD granted by the China Spallation Neutron Source (Proposal ID:P1823122900035). This work was also supported by the National Key Research and Development Program of China (2022YFA1402301) and the National Science Foundation of China (42150101). T. Meier acknowledges financial support from Shanghai Key Laboratory Novel Extreme Condition Materials, China (no. 22dz2260800), Shanghai Science and Technology Committee, China (no. 22JC1410300).
The authors have no conflicts to disclose.
DATA AVAILABILITY
The data that support the findings of this study are available from the corresponding author upon reasonable request.
References
- Shi et al. [2020] X.-L. Shi, J. Zou, and Z.-G. Chen, Advanced thermoelectric design: from materials and structures to devices, Chem. Rev. 120, 7399 (2020).
- Morelli et al. [2008] D. Morelli, V. Jovovic, and J. Heremans, Intrinsically minimal thermal conductivity in cubic I-V-VI2 semiconductors, Phys. Rev. Lett. 101, 035901 (2008).
- Carlton et al. [2014] C. E. Carlton, R. De Armas, J. Ma, A. F. May, O. Delaire, and Y. Shao-Horn, Natural nanostructure and superlattice nanodomains in AgSbTe2, J. Appl. Phys. 115 (2014).
- Hoang et al. [2007] K. Hoang, S. D. Mahanti, J. R. Salvador, and M. G. Kanatzidis, Atomic ordering and gap formation in Ag-Sb-Based ternary chalcogenides, Phys. Rev. Lett. 99, 156403 (2007).
- Jovovic and Heremans [2008] V. Jovovic and J. P. Heremans, Measurements of the energy band gap and valence band structure of AgSbTe2, Phys. Rev. B 77, 245204 (2008).
- Roychowdhury et al. [2021] S. Roychowdhury, T. Ghosh, R. Arora, M. Samanta, L. Xie, N. K. Singh, A. Soni, J. He, U. V. Waghmare, and K. Biswas, Enhanced atomic ordering leads to high thermoelectric performance in AgSbTe2, Science 371, 722 (2021).
- Geller and Wernick [1959] S. Geller and J. H. Wernick, Ternary semiconducting compounds with sodium chloride-like structure: AgSbSe2, AgSbTe2, AgBiS2, AgBiSe2, Acta Cryst. Sect. A 12, 46 (1959).
- Quarez et al. [2005] E. Quarez, K.-F. Hsu, R. Pcionek, N. Frangis, E. K. Polychroniadis, and M. G. Kanatzidis, Nanostructuring, compositional fluctuations, and atomic ordering in the thermoelectric materials AgPbmSbTe2+m. the myth of solid solutions, J. Am. Chem. Soc. 127, 9177 (2005).
- Barabash et al. [2008] S. Barabash, V. Ozolins, and C. Wolverton, First-principles theory of competing order types, phase separation, and phonon spectra in thermoelectric AgPbm SbTem+2 alloys, Phys. Rev. Lett. 101, 155704 (2008).
- Rezaei et al. [2014] N. Rezaei, S. J. Hashemifar, and H. Akbarzadeh, Thermoelectric properties of AgSbTe2 from first-principles calculations, J. Appl. Phys. 116, 103705 (2014).
- Szczypka and Koleżyński [2018] W. Szczypka and A. Koleżyński, Theoretical studies of cation sublattice ordering in AgSbTe2 and AgSbSe2 – electron density topology and bonding properties, J. Alloys Compd. 732, 293 (2018).
- Amouyal [2013] Y. Amouyal, On the role of lanthanum substitution defects in reducing lattice thermal conductivity of the AgSbTe2 (P4/mmm) thermoelectric compound for energy conversion applications, Comput. Mater. Sci. 78, 98 (2013).
- Amouyal [2014] Y. Amouyal, Reducing lattice thermal conductivity of the thermoelectric compound AgSbTe2 (P4/mmm) by lanthanum substitution: Computational and experimental approaches, J. Electron. Mater. 43, 3772 (2014).
- Amouyal [2016] Y. Amouyal, Silver-antimony-telluride: From first-principles calculations to thermoelectric applications, in Thermoelectrics for Power Generation, edited by S. Skipidarov and M. Nikitin (IntechOpen, Rijeka, 2016) Chap. 7.
- He et al. [2023] L. He, S. Deng, F. Shen, J. Chen, H. Lu, Z. Tan, H. Zheng, J. Hao, D. Zhao, and Q. Ma, The performance of general purpose powder diffractometer at CSNS, Nucl. Instrum. Methods Phys. Res. Sect. A 1054, 168414 (2023).
- Hao et al. [2023] J. Hao, Z. Tan, H. Lu, S. Deng, F. Shen, D. Zhao, H. Zheng, Q. Ma, J. Chen, and L. He, Residual stress measurement system of the general purpose powder diffractometer at CSNS, Nucl. Instrum. Methods Phys. Res. Sect. A 1055, 168532 (2023).
- Hinton et al. [2019] J. K. Hinton, S. M. Clarke, B. A. Steele, I.-F. W. Kuo, E. Greenberg, V. B. Prakapenka, M. Kunz, M. P. Kroonblawd, and E. Stavrou, Effects of pressure on the structure and lattice dynamics of -glycine: a combined experimental and theoretical study, CrystEngComm 21, 4457 (2019).
- Hahn [1950] E. L. Hahn, Spin echoes, Phys. Rev. 80, 580 (1950).
- Man [2006] P. P. Man, Quadrupole couplings in nuclear magnetic resonance, general (John Wiley & Sons, Ltd, 2006).
- Haase [1995] J. Haase, Magnetische Kernresonanz bei Quadrupolwechselwirkung in Festkoerpern, Ph.D. thesis, Leipzig University (1995).
- Hughes and Harris [2016] C. E. Hughes and K. D. M. Harris, Calculation of solid-state nmr lineshapes using contour analysis., olid State Nucl. Magn. Reson. 80, 7 (2016).
- Baroni et al. [2001] S. Baroni, S. De Gironcoli, A. Dal Corso, and P. Giannozzi, Phonons and related crystal properties from density-functional perturbation theory, Rev. Modern Phys. 73, 515 (2001).
- Perdew and Wang [1992] J. P. Perdew and Y. Wang, Accurate and simple analytic representation of the electron-gas correlation energy, Phys. Rev. B 45, 13244 (1992).
- Troullier and Martins [1991] N. Troullier and J. L. Martins, Efficient pseudopotentials for plane-wave calculations, Phys. Rev. B 43, 1993 (1991).
- Monkhorst and Pack [1976] H. J. Monkhorst and J. D. Pack, Special points for Brillouin-zone integrations, Phys. Rev. B 13, 5188 (1976).
- Giannozzi et al. [2009] P. Giannozzi, S. Baroni, N. Bonini, M. Calandra, R. Car, C. Cavazzoni, D. Ceresoli, G. L. Chiarotti, M. Cococcioni, I. Dabo, et al., Quantum espresso: a modular and open-source software project for quantumsimulations of materials, J. Phys. Condens. Matter. 21, 395502 (2009).
- Giannozzi et al. [2017] P. Giannozzi, O. Andreussi, T. Brumme, O. Bunau, M. B. Nardelli, M. Calandra, R. Car, C. Cavazzoni, D. Ceresoli, M. Cococcioni, et al., Advanced capabilities for materials modelling with quantum espresso, J. Phys. Condens. Matter. 29, 465901 (2017).
- Kraus and Nolze [1996] W. Kraus and G. Nolze, POWDER CELL–a program for the representation and manipulation of crystal structures and calculation of the resulting X-ray powder patterns, J. Appl. Crystallogr. 29, 301 (1996).
- Hu et al. [2025] Z. Hu, M. Yuan, W. Li, S. Wang, J. Li, J. Jiang, J. Shuai, and Y. Hou, Enhanced thermoelectric performance in pristine AgSbTe2 compound via rational design of Ag2Te formation, Acta Materialia , 120985 (2025).
- Kim et al. [2024] J. H. Kim, J. H. Yun, S. Cha, S. Byeon, J. Park, H. Jin, S. Kim, S.-J. Kim, J. Park, J. Jang, et al., Enhancement of phase stability and thermoelectric performance of meta-stable AgSbTe2 by thermal cycling process, Adv. Funct. Mater. 34, 2404886 (2024).
- Toby and Von Dreele [2013] B. H. Toby and R. B. Von Dreele, GSAS-II: the genesis of a modern open-source all purpose crystallography software package, J. Appl. Crystallogr. 46, 544 (2013).
- [32] See Supplemental Material at , which includes supplemental figures 1-2.
- Sears [1992] V. F. Sears, Neutron scattering lengths and cross sections, Neutron News 3, 26 (1992).
- Kroumova et al. [2003] E. Kroumova, M. Aroyo, J. Perez-Mato, A. Kirov, C. Capillas, S. Ivantchev, and H. W. and, Bilbao crystallographic server : Useful databases and tools for phase-transition studies, Ph. Transit. 76, 155 (2003).
- Brüesch and Schüler [1971] P. Brüesch and C. Schüler, Raman and infrared spectra of crystals with α-NaFeO2 structure, J. Phys. Chem. Solids 32, 1025 (1971).
- Yelisseyev et al. [2015] A. Yelisseyev, P. Krinitsin, L. Isaenko, and S. Grazhdannikov, Spectroscopic properties of nonlinear optical LiGaTe2 crystal, Opt. Mater. 42, 276 (2015).
- Hoang and Mahanti [2016] K. Hoang and S. D. Mahanti, Atomic and electronic structures of I-V-VI2 ternary chalcogenides, J. Sci. Adv. Mater. Devices 1, 51 (2016).
- Julien [2003] C. Julien, Lithium intercalated compounds: Charge transfer and related properties, Materials Science and Engineering: R: Reports 40, 47 (2003).
- Morris [2009] G. A. Morris, Spin dynamics: Basics of nuclear magnetic resonance, second edition. malcolm h. levitt. wiley chichester. 2008. pp xxv + 714. isbn 978-0-470-51118-3(hbk) 978-0-470-51117-6 (pbk), NMR in Biomedicine 22, 240 (2009).
- Freude and Haase [1993] D. Freude and J. Haase, Quadrupole effects in solid-state nuclear magnetic resonance (Springer, 1993) pp. 1–90.
- Ko et al. [2014] Y.-H. Ko, M.-W. Oh, J. K. Lee, S.-D. Park, K.-J. Kim, and Y.-S. Choi, Structural studies of AgSbTe2 under pressure: Experimental and theoretical analyses, Curr. Appl. Phys. 14, 1538 (2014).
- Wojciechowski et al. [2010] K. Wojciechowski, M. Schmidt, J. Tobola, M. Koza, A. Olech, and R. Zybała, Influence of doping on structural and thermoelectric properties of AgSbSe2, J. Electron. Mater. 39, 2053 (2010).
- Milenov et al. [2014] T. Milenov, T. Tenev, I. Miloushev, G. Avdeev, C.-W. Luo, and W.-C. Chou, Preliminary studies of the raman spectra of Ag2Te and Ag5Te3, Opt. Quant. Electron. 46, 573 (2014).
- Pandiaraman et al. [2011] M. Pandiaraman, N. Soundararajan, and R. Ganesan, Optical studies of physically deposited nano-Ag2Te thin films, in Defect and Diffusion Forum, Vol. 319 (Trans Tech Publ, 2011) pp. 185–192.
- Sun et al. [2023] F. Sun, W. Hong, X. He, C. Jian, Q. Ju, Q. Cai, and W. Liu, Synthesis of ultrathin topological insulator -Ag2Te and Ag2Te/WSe2-based high-performance photodetector, Small 19, 2205353 (2023).
Supplemental Material for “On the ambient conditions crystal structure of AgSbTe2 ”