Beyond Traditional Diagnostics: Identifying Active Galactic Nuclei with Spectral Energy Distribution Fitting in DESI Data
Abstract
Aims. Active galactic nuclei (AGN) are typically identified through their distinctive X-ray or radio emissions, mid-infrared (MIR) colors, or emission lines. However, each method captures different subsets of AGN due to signal-to-noise (SNR) limitations, redshift coverage, and extinction effects, underscoring the necessity for a multi-wavelength approach for comprehensive AGN samples. This study explores the effectiveness of spectral energy distribution (SED) fitting as a robust method for AGN identification.
Methods. Using CIGALE optical-MIR SED fits on DESI Early Data Release galaxies, we compare SED-based AGN selection (AGNFRAC ) with traditional methods including BPT diagrams, WISE colors, X-ray, and radio diagnostics.
Results. SED fitting identifies of narrow/broad-line AGN and 87% of WISE-selected AGN. Incorporating high SNR WISE photometry reduces star-forming galaxy contamination from 62% to 15%. Initially, of SED-AGN candidates are undetected by standard methods, but additional diagnostics classify of these sources, revealing LINERs and retired galaxies potentially representing evolved systems with weak AGN activity. Further spectroscopic and multi-wavelength analysis will be essential to determine the true AGN nature of these sources.
Conclusions. SED fitting provides complementary AGN identification, unifying multi-wavelength AGN selections. This approach enables more complete – albeit with some contamination – AGN samples essential for upcoming large-scale surveys where spectroscopic diagnostics may be limited.
Key Words.:
Catalogs – galaxies: active – galaxies: nuclei – galaxies: Seyfert – galaxies: evolution – galaxies: general1 Introduction
Supermassive black holes with masses of more than a million times that of the Sun (e.g. Kormendy & Ho, 2013), are believed to inhabit the centers of galaxies, including the Milky Way (e.g., Ghez et al., 2008; Genzel et al., 2010). Despite the key role supermassive black holes are thought to play in galaxy formation and evolution, their origin and impact on host galaxies are still a major challenge of modern astrophysics. When supermassive black holes are actively accreting as active galactic nuclei (AGN), they are brighter and easier to detect and thus serve as a proxy to study supermassive black hole properties. Thus, identifying AGN is crucial for understanding galaxy evolution, black hole growth, and cosmic feedback processes (see Harrison & Ramos Almeida 2024 for a review).
Despite their important role, a uniform method to identify AGN is challenging as different selection techniques lead to different samples that may not even overlap with each other. AGN are usually identified based on: i) their optical emission lines (e.g., Baldwin et al. 1981; Kewley et al. 2001; Kauffmann et al. 2003), and variability (e.g., Pai et al. 2024) ii) X-ray emission (e.g., Brandt & Alexander 2015, iii) mid-infrared (MIR) emission (e.g., Lacy et al. 2004; Stern et al. 2005; Jarrett et al. 2011; Stern et al. 2012; Assef et al. 2013; Lacy et al. 2015; Hviding et al. 2022), and variability (e.g., Bernal et al. 2025), and iv) radio emission (e.g., Heckman & Best 2014; Padovani 2016; Tadhunter 2016). Optical spectroscopic selection identifies AGN by detecting broad (BL-AGN, i.e, type 1 AGN) or narrow (NL-AGN, i.e., type 2 AGN) emission lines, indicative of high-energy processes near the black hole (e.g., Baldwin et al., 1981). However, star formation elevated by a diffuse ionized gas, photoionization by hot stars, metallicity (as indicated by strong forbidden lines such as [N II]6583, [S II]6716, 6731, and [O III]5007), or shocks can be misclassified as AGN (e.g., Wylezalek et al., 2018). X-ray selection is highly effective because AGN typically exhibit strong X-ray emission that is less likely to be contaminated by star formation processes. However, X-ray surveys are often limited by sensitivity and coverage and may miss obscured AGN (e.g., Gilli et al., 2007; Burlon et al., 2011; Mazzolari et al., 2024). MIR selection uses color criteria to distinguish AGN from star-forming galaxies due to the characteristic dust emission heated by the AGN (Stern et al., 2005; Assef et al., 2013). The high-energy radiation emitted from the accretion disk heats up the surrounding dust, causing it to emit infrared radiation, particularly in the MIR regime (). The MIR emission has already proven its usefulness in AGN selection, though it is biased towards the selection of AGN that dominate over the emission from the host galaxies. Radio selection relies on the strong synchrotron emission from relativistic jets, but this method is biased towards radio-loud AGN, which are a minority of the AGN population. Moreover, radio selection can pick up star-forming regions with strong radio emission (Padovani, 2016). Summarizing, accurate AGN identification is often challenging, as each of these common methods captures different subsets of the AGN population and is subject to its own limitations and biases.
The aforementioned limitations of traditional selection methods highlight the need for a multi-wavelength approach to reliably and comprehensively identify AGN. The advent of large multi-wavelength surveys triggered using SED fitting to constrain AGN and their host galaxy properties for statistical samples. Recently, the SED fitting approach revealed the potential not only to derive reliable properties of AGN and host properties (e.g., Marshall et al. 2022; Mountrichas et al. 2021a; Burke et al. 2022; Best et al. 2023) but also to identify AGN based on their multi-wavelength information (e.g., Thorne et al. 2022; Best et al. 2023; Yang et al. 2023; Prathap et al. 2024). AGN SED modeling techniques are also used as the base for the target selection of forthcoming wide-field spectroscopic surveys such as 4MOST (Merloni et al. 2019) and VLT-MOONS (Maiolino et al. 2020).
In this paper, we identify AGN in the DESI survey using the CIGALE SED fitting code, modeling optical to MIR photometry for millions of sources across diverse types and redshifts. In particular, DESI has already revealed unprecedented samples of dust-reddened QSO (Fawcett et al., 2023) or changing-look AGN (Guo et al., 2024a, b, 2025). DESI value-added catalog (VAC) of AGN selected based on their multi-wavelength information (Juneau et al. in prep.) provides so far the largest AGN spectroscopic sample111https://data.desi.lbl.gov/doc/releases/dr1/vac/agnqso/. This will allow for a more detailed study of the role of AGN in galaxy evolution.
Our study explores the potential of SED-based AGN identification and assesses the necessity of MIR data in minimizing the misclassification of star-forming galaxies as AGN. By integrating multi-wavelength data, we aim to contribute to a more accurate and complete catalog of AGN in the DESI survey. The structure of the paper is as follows. In Sect. 2.1, we provide an overview of the DESI data. In Sect. 3, we describe the AGN selection using different standard techniques. Results with discussion are presented in Sect. 4. Finally, Sect. 5 summarizes the efficiency of SED-based AGN identification.
2 DESI data
2.1 Overview of DESI
DESI is a robotic, 5000-fiber multiobject spectroscopic surveyor operating on the Mayall 4-meter telescope at Kitt Peak National Observatory (DESI Collaboration et al., 2022). DESI is capable of obtaining simultaneous spectra covering a range of Å with a resolution of of almost 5 000 objects over a field (DESI Collaboration et al., 2016a, b; Miller et al., 2023; Poppett et al., 2024). DESI is currently conducting a five-year survey to observe approximately 36 million galaxies (Hahn et al., 2023; Raichoor et al., 2023; Zhou et al., 2023) and 3 million quasars (Chaussidon et al., 2023) over 14 000 (DESI Collaboration et al., 2024a, 2025). This campaign will provide ten times more spectra than the SDSS (York et al., 2000; Almeida et al., 2023) sample of extragalactic targets and substantially deeper than prior large-area surveys (DESI Collaboration et al., 2024a). With the aim of determining the nature of dark energy, DESI will provide the most precise measurement of the expansion history of the universe ever obtained (Levi et al., 2013).
DESI started to operate in December 2020, with a 5-month Survey Validation (SV; DESI Collaboration et al., 2024b) before the start of the Main Survey. The entire SV data, internally known as Fuji, is publicly released as the DESI Early Data Release (EDR; DESI Collaboration et al., 2024a) while the First Data Release (DR1; DESI Collaboration et al., 2025) was released in March 2025. This work relies on the EDR data as the complementary studies of the VAC presented in Siudek et al. (2024). The expansion to DR1 is left for future work. The DR1 already showcases the DESI potential by the cosmological results from the full-shape analysis (DESI Collaboration et al., 2024c).
The scale of DESI observations is supported by software pipelines and products, which include imaging from the DESI Legacy Imaging Surveys (Zou et al., 2017; Dey et al., 2019), a fully automatic spectroscopic reduction pipeline (Guy et al., 2023; Schlafly et al., 2023), followed by a template-fitting pipeline to derive classifications and redshifts for each targeted source (Redrock222https://github.com/desihub/redrock; Anand et al. 2024; Bailey et al. in prep.), and for the special case of QSOs (Brodzeller et al., 2023). Redrock provides the redshift (Z), redshift uncertainty (ZERR), a redshift warning bitmask (ZWARN), and a spectral type (SPECTYPE) to every target based on the best fit. The photometry in , , and bands is estimated from the Legacy survey (DR9) images with the Tractor 333https://github.com/dstndstn/tractor inference modeling code (Lang et al., 2016). Mid-infrared photometry is derived via forced photometry of the unWISE co-adds based on this optical model (Meisner et al., 2021).
2.2 DESI EDR VAC of physical properties
The DESI EDR redshift catalog consists of 2 847 435 sources (DESI Collaboration et al., 2024a). For a sample of 1 337 250 galaxies and quasars (with SPECTYPE = GALAXY | QSO) characterized by reliable redshift (ZWARN = 0 or 4 and that do not have any fiber issues (COADD_FIBERSTATUS = 0) we created a VAC of physical properties, including stellar masses and star formation rates (SFRs) as well as AGN features (Siudek et al., 2024). Here, we present a short summary of the VAC and refer the reader to Siudek et al. (2024) for the full description.
Physical properties of DESI galaxies are derived by performing SED fitting using Code Investigating GALaxy Emission (CIGALE v2022.1; Boquien et al., 2019) relying on the optical-MIR photometry and spectroscopic redshifts. CIGALE already proved its efficiency in deriving physical properties of galaxies hosting AGN (e.g., Salim et al. 2016; Małek et al. 2018; Osborne & Salim 2024; Csizi et al. 2024), as well as high-z AGN (e.g., Conselice et al. 2023; Yang et al. 2023; Burke et al. 2024; Mezcua et al. 2023, 2024). CIGALE uses a library of models to fit the SED of galaxies, where the best fit is found based on the reduced minimization among all the possible combinations of the SED models. The library of models is created under the assumption of a delayed SFH with an optional exponential burst (Ciesla et al., 2015) and the Bruzual & Charlot (2003) SSP models adopting a Chabrier (2003) initial mass function. We assume solar metallicity and use Fritz et al. (2006) models to account for possible AGN contribution. The grid of input parameters used to generate the model library follows the configuration adopted in the DESI EDR VAC (Siudek et al., 2024), and is summarized in Table 5 in Appendix A. The generated models cover a wide range of objects, including galaxies without AGN contribution, as well as BL-, and NL-AGN. This provides flexibility and allows us to build the catalog of physical properties for both AGN and non-AGN host galaxies.
The SEDs of observed galaxies are created from the ground-based optical and near-infrared (NIR) photometry (i.e., grz photometry, which we shortly refer to as optical) complemented by observations from MIR bands at and 22 m provided by the Wide-field Infrared Survey Explorer (WISE; Wright et al. 2010), a mission extension NEOWISE-Reactivation forced-photometry (Mainzer et al., 2014).
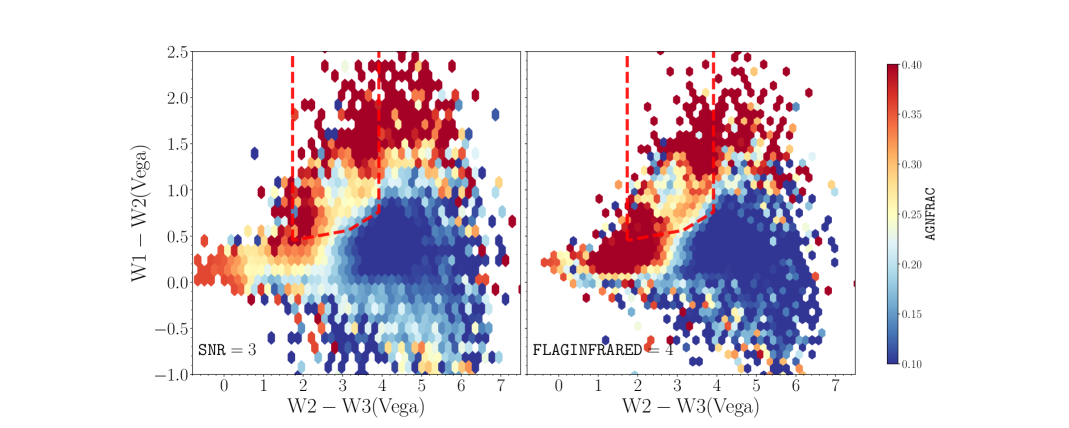
We note that the precise AGN classification of individual sources – especially those with low AGN fractions – as well as the stellar masses and SFRs may depend on the model assumptions, and the incorporation of the WISE photometry (see Siudek et al. 2024 for a discussion). Based on the representative sample of galaxies including passive, star-forming, and AGN galaxies, Siudek et al. (2024) find that without WISE photometry the AGN fraction is overestimated (AGNFRAC ) for 68% of star-forming galaxies selected based on the [NII]-BPT emission line diagnostic diagram (see details in Sect. 3.1). The requirement of a high SNR in the WISE observations (forced by FLAGINFRARED = 4) reduces it to 19%. This suggests that the MIR information is crucial to properly identify AGN via SED fitting. Siudek et al. (2024) also show that the overestimation of the AGNFRAC for the star-forming galaxies without WISE information has a negligible effect on their stellar mass or SFR estimates. We further discuss the dependence of the AGN identification on the model choice in Appendix C.
3 Sample selection based on the AGN diagnostics
In this paper, we rely on the sample of 510 938 DESI EDR galaxies at from the VAC of physical properties444https://data.desi.lbl.gov/doc/releases/edr/vac/cigale/. We remove sources with poor photometric quality, defined as those with LOGM , and sources with poor SED fits, defined as those with CHI2 (see Siudek et al. 2024). These criteria, along with the redshift limit (Z ), define our parent sample. No additional cuts are applied at this stage; further selection criteria (e.g., SNR for emission-line quality or WISE-based selections) are introduced in the relevant sections.
To validate the performance of the SED-based AGN identification in recovering true AGN populations, we use a set of classical AGN diagnostics as reference. These include emission-line diagnostics (BPT-AGN), MIR colors (WISE-AGN), and high-energy diagnostics such as X-ray and radio emission. These methods are applied to galaxies at , where line measurements and MIR photometry are most reliable. While the MIR color-based AGN selection draws from a subset of the photometric data available to full SED fitting, it remains a valuable cross-check. Its inclusion in this analysis serves primarily as a benchmark, given its common use and well-calibrated thresholds (e.g., Stern et al. 2012; Assef et al. 2013). We do not position it on equal footing with spectroscopy-based diagnostics or full SED fitting, as the latter incorporate broader wavelength coverage and physical modeling. Nonetheless, MIR color selection remains relevant for assessing completeness and consistency in AGN selection across surveys. To construct the BPT diagrams and BL-AGN sample, we use the emission line measurements from the DESI EDR FastSpecFit Spectral Synthesis and Emission-Line Catalog (FastSpecFit version 3.2 Fuji production555https://data.desi.lbl.gov/doc/releases/edr/vac/fastspecfit/; Moustakas et al. 2023; Moustakas et al. in prep.). FastSpecFit is a stellar continuum and emission-line fitting code optimized to model jointly DESI optical spectra and broadband photometry using physically motivated stellar continuum and emission-line templates666https://fastspecfit.readthedocs.io/en/latest/fuji.html. The selection of the AGN sample is summarized in Sect. 3.5.
3.1 BPT diagram
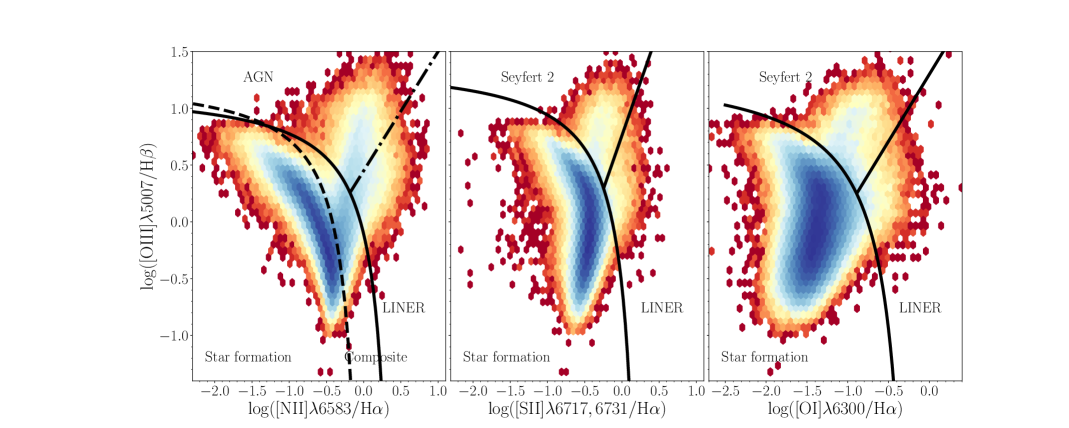
The BPT diagrams (Baldwin et al., 1981) are widely used diagnostics relying on the strength of Balmer lines to forbidden nebular transitions to differentiate between star-forming galaxies and AGN. In this work, we use three diagrams based on the ratios of vs. ([NII]-BPT), vs. ([SII]-BPT), and vs. ([OI]-BPT) similarly as Mezcua & Dom´ınguez Sánchez (2024). The [NII]-BPT diagram is sensitive to metallicity, making AGN identification in metal-poor galaxies difficult (e.g., Groves et al., 2006; Cann et al., 2019). The [SII]-BPT offers better separation at intermediate metallicities but struggles with composite galaxies. The [OI]-BPT is more robust across metallicities but relies on a weak line that’s often hard to detect in faint or low-metallicity galaxies (Polimera et al., 2022). Recently, Ji & Yan 2020 proposed a simple reprojection of the [NII]-, [SII]- and [OI]-BPTs that shows the potential to remove the ambiguity for the true composite objects. We leave the examination of this approach for future work.
The [NII]-, [SII]-, and [OI]-BPTs for the DESI galaxies are shown in Fig. 1. We use the narrow components of the Balmer lines and apply a flux SNR in each of the emission lines used for the respective [NII]-, [SII]-, and [OI]-BPT diagrams, except for , for which we use a flux SNR . The line is weaker, and imposing a higher SNR threshold could exclude valid candidates (Cid Fernandes et al., 2010). The SNR cuts are applied separately for each diagram, meaning that the galaxies included in each BPT diagram may differ.
We also use the WHAN diagram introduced by Cid Fernandes et al. (2010) that considers equivalent width (EW) of () vs. line ratios. The WHAN diagram differentiates AGN (with and ) from galaxies with hot old (post-AGB) stars that can mimic LINERs. To ensure reliable measurements, we require a flux SNR for all relevant lines ( and ), as well as for . Consequently, the WHAN sample is not necessarily the same as the one used for the BPT diagrams, as the SNR cuts are applied independently.
3.2 BL-AGN selection
We identify BL-AGN at based on the presence of a broad H component. Following the criteria outlined in Pucha et al. (2025), we require SNR for the total H flux (), the broad H component (), and the amplitude-over-noise (AoN) of the broad component ().
3.3 WISE selection
To select MIR-AGN we rely on the WISE color-color diagram vs. proposed by (Hviding et al., 2022). We restrict the sample to galaxies with in all WISE bands used in the diagram and to . We note, that the forced WISE photometry can suffer from confusion and other systematic errors, which can impact the quality of the fitting and the resulting inference as well as the WISE SNR cuts. In addition, Legacy Surveys WISE photometry is quite shallow, especially in , and and especially for emission line galaxies and other higher-redshift galaxies, which impacts the ability to identify AGN from the broadband SED modeling. The selection criteria proposed by Hviding et al. (2022) are more sensitive to low luminosity and heavily obscured AGN than the traditional cuts given by Jarrett et al. (2011) or Stern et al. (2012). However, WISE-AGN samples may be contaminated by star-forming galaxies diluting the WISE color-selected AGN (Hainline et al., 2016).
3.4 X-ray and radio counterparts
We search for X-ray counterparts within 5 arcsec of the optical position of each source as given by the DESI Legacy Imaging Surveys making use of the Chandra Source Catalog (CSC DR2; Evans et al., 2010, 2024), the XMM-Newton Serendipitous Source Catalogue (4XMM-DR13; Webb et al., 2020), and the all-sky survey catalog from the extended ROentgen Survey with an Imaging Telescope Array (eROSITA) on the Spectrum-Roentgen-Gamma (SRG) mission (eRASS1; Merloni et al., 2024). For identification of the radio counterparts within 5 arcsec from the sources we rely on the second data release of the LOFAR Two-metre Sky Survey (LoTSS DR2; Shimwell et al., 2022), the Faint Images of the Radio Sky at Twenty-cm (FIRST) Survey Final Catalog (Helfand et al., 2015) and the 1.4 GHz National Radio Astronomy Observatory (NRAO) Very Large Array (VLA) Sky Survey (NVSS; Condon et al., 1998).
3.5 AGN sample
We apply the optical and MIR selection criteria described above to classify 510 939 DESI EDR galaxies into four types. These four classes are used as a reference to estimate the best threshold on AGNFRAC for identifying AGN based on the SED fitting:
-
1.
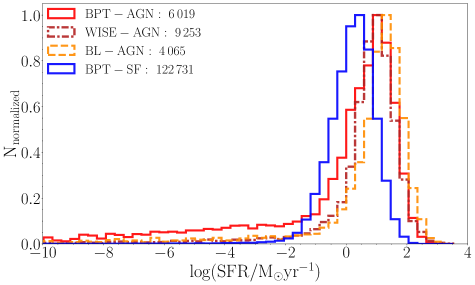
BPT-AGN: defined as AGN or composite in the [NII]-BPT, AGN on the WHAN diagram, and AGN in the [SII]- or [OI]-BPT. Selected number of sources: 6 019.
-
2.
BPT-SF: defined as star-forming in the [NII]-, [SII]- and [OI]-BPTs. Selected number of sources: 122 731.
-
3.
BL-AGN: defined as sources with a broad emission line. Selected number of sources: 4 065.
-
4.
WISE-AGN: defined as AGN based on the WISE color diagram. Selected number of sources: 9 253.
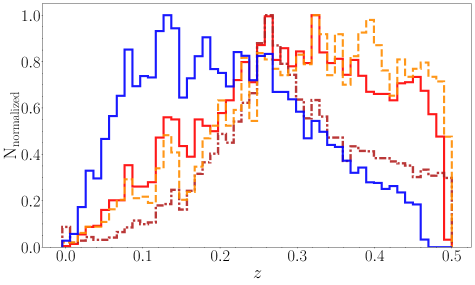
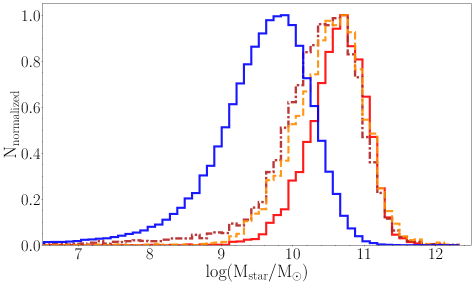
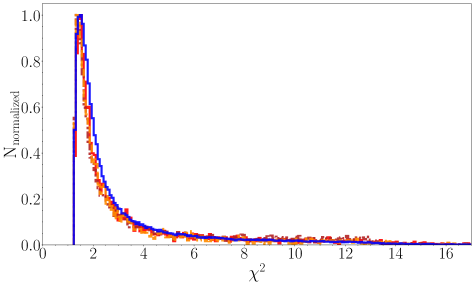
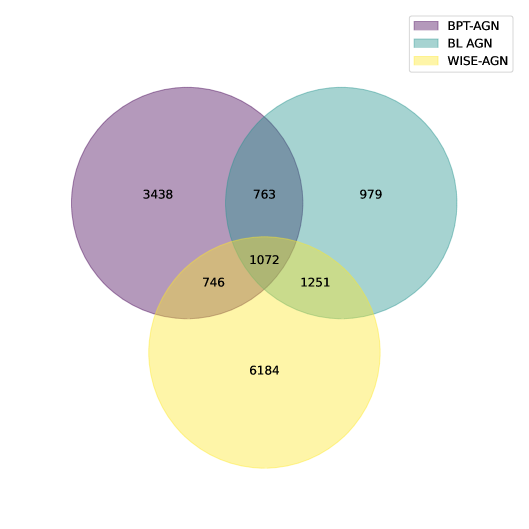
Each class includes galaxies at spanning a wide range of stellar masses. As shown in Fig. 2, the BPT-SF population predominantly consists of lower-mass, lower star-formation galaxies at lower redshifts. Additionally, since SFRs are derived from CIGALE using AGN-inclusive templates, even BPT-SF galaxies may show slightly suppressed SFRs if the fit assigns any AGN contribution – this is especially relevant in ambiguous or composite systems. We explore also whether the distribution varies across different AGN and star-forming galaxy classifications (bottom right panel in Fig. 2). Contrary to some earlier works (e.g., Berta et al., 2013) where elevated values – especially in stellar or star-forming-only fits – could signal the presence of a hidden AGN (e.g., visible in the NIR excess), we find that the distributions of reduced are remarkably similar for BPT-AGN, WISE-AGN, BL-AGN, and BPT-SF galaxies. This is likely due to the inclusion of AGN templates in the CIGALE fits, which improves the overall model match even in AGN-dominated sources. This suggests that is not a discriminant for AGN identification in our case, provided that proper AGN templates are used during the fitting process. Figure 3 and Table 1 highlight the diversity and overlap between AGN identified through different selection techniques: BPT-AGN, BL-AGN, and WISE-AGN. The significant areas of non-overlap (e.g., 66.8% of WISE-AGN are identified only by WISE colors) underscore that each method may be sensitive to different types of AGN and highlight the need for a multi-wavelength approach to identify the complete AGN sample as already investigated by e.g., Cann et al. (2019) and Hviding et al. (2022).
| Classification | |||||||||
|---|---|---|---|---|---|---|---|---|---|
| BPT-AGN | 6 019 | 3 438 | 57.1 | – | – | 1 835 | 30.5 | 0 | 0.0 |
| BL-AGN | 4 065 | 979 | 24.1 | 1 835 | 45.1 | – | – | 103 | 2.5 |
| WISE-AGN | 9 253 | 6 184 | 66.8 | 1 818 | 19.6 | 2 323 | 25.1 | 1 907 | 20.6 |
4 Results and Discussion
In this Section, we validate the AGN fraction (AGNFRAC) estimated via SED fitting of optical (grz) and MIR (W14) observations as a proxy to identify AGN in comparison to standard techniques. As a large fraction of AGN is not detected in optical surveys due to either distance or dust obscuration (e.g., Truebenbach & Darling 2017), we validate how crucial it is to include the MIR photometry in SED fits to recreate the AGN contribution in galaxies. We also identify AGN candidates selected by the SED method that do not appear on traditional AGN diagrams.
4.1 SED fitting: AGN fraction
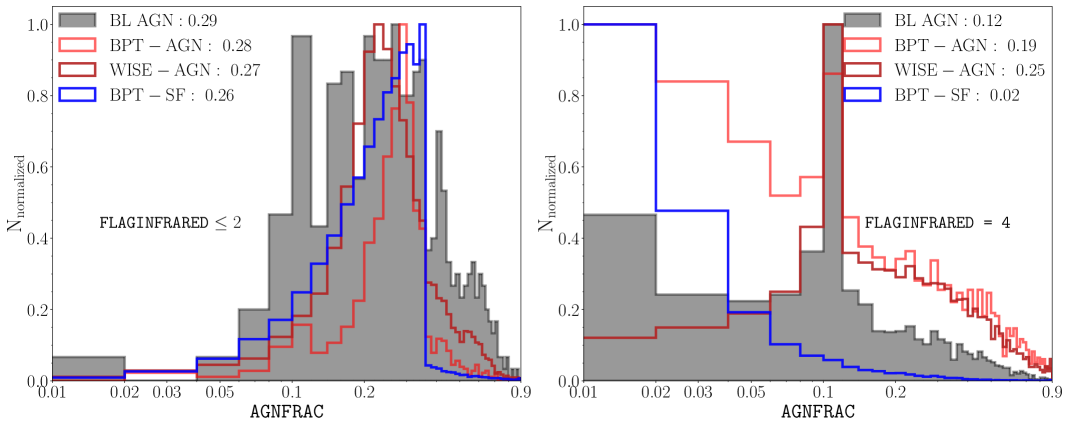
Usually, SED-based AGN selection is based on a fixed threshold on the AGN fraction derived from SED fitting (Thorne et al., 2022; Best et al., 2023; Bichang’a et al., 2024; Das et al., 2024). The AGN fraction is defined here as the fraction of the IR emission coming from the AGN to the total IR emission. We rely on the AGN and star-forming galaxy sample selected based on the traditional techniques (see Sect. 3.5) to find the best threshold for the AGN selection. Figure 4 shows the distribution of AGNFRAC for galaxies with different infrared coverage. We split the sample based on the FLAGINFRARED value, which indicates the number of WISE bands with high SNR (): a value of 4 means detections in all four bands, while lower values correspond to fewer reliable measurements. Although AGNFRAC uncertainties are computed by CIGALE, they are not included in the DESI EDR VAC and in this analysis because, in cases with faint AGN emission or limited infrared data, the error estimates can become poorly constrained and unreliable for robust statistical use. This limitation is inherent to SED fitting in such regimes and does not affect the broader AGN selection performance (see also Ciesla et al. 2015, Yang et al. 2020, and Mountrichas et al. 2021b). In the left panel (galaxies observed at most in two WISE bands with , i.e., with FLAGINFRARED ), AGN and star-forming galaxies show nearly indistinguishable AGNFRAC distributions (typical values around 0.3), indicating unreliable AGN fraction estimates when only one or two WISE bands are available. In contrast, the right panel (galaxies observed in all four WISE bands with , i.e., with FLAGINFRARED = 4) reveals clear separation: star-forming galaxies show low AGNFRAC values (median = 0.02), while AGN classes (BPT-AGN, BL-AGN, WISE-AGN) have broader distributions with higher medians (0.19, 0.12, and 0.25, respectively). Notably, BPT-AGN exhibit a bimodal distribution peaking at 0 and 0.1.
To further evaluate the discriminative power of AGNFRAC, we perform a classification analysis using Receiver Operating Characteristic (ROC; Bradley, 1997) curves across our samples. The performance metrics and threshold analysis (see Appendix D) suggest that AGNFRAC is an effective AGN indicator only when applied to sources with reliable infrared measurements.
Taking into account the strong correlation between AGNFRAC and the availability of WISE photometry with (see also Sect. 4.2), we recommend applying a selection criterion of AGNFRAC combined with FLAGINFRARED to define AGN based on SED fitting (SED-AGN). This threshold is motivated both by the observed peak in AGNFRAC distributions for spectroscopically confirmed AGN classes (see Fig. 4) and by its optimal diagnostic performance in the ROC analysis (see Appendix D). For more inclusive samples, the infrared quality condition can be relaxed to FLAGINFRARED , which preserves the general distribution shape and yields similar median AGNFRAC values.
4.2 Importance of the MIR photometry
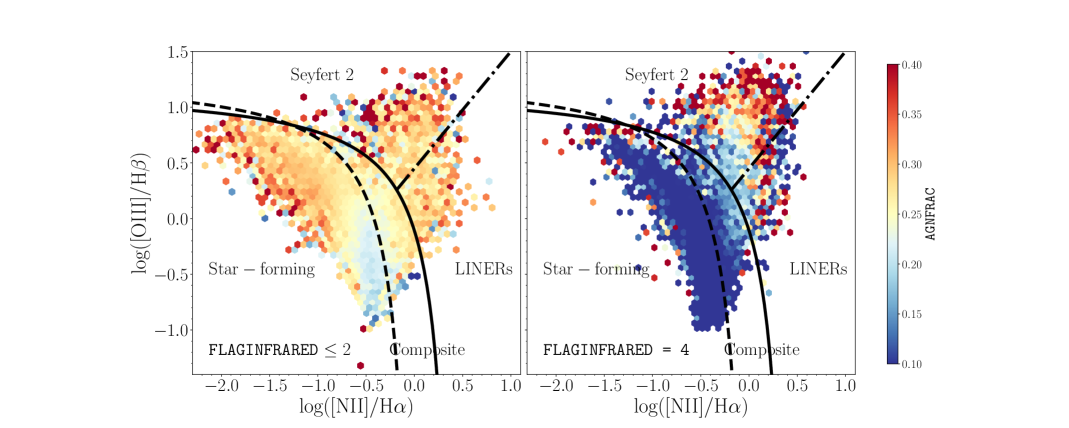
As shown in the previous Section, the distribution of AGNFRAC is sensitive to the availability of WISE photometry. We further verify the dependence of the BPT classification on the availability of the WISE photometry. Figure 5 shows the [NII]-BPT diagram for galaxies observed in all four WISE bands with (i.e, FLAGINFRARED = 4; right panel) and galaxies with at most two WISE observations with (i.e, FLAGINFRARED ; left panel). The distribution of AGNFRAC is almost uniform on the BPT diagram for galaxies without high SNR WISE photometry. Contrarily, for galaxies with FLAGINFRARED = 4, the AGNFRAC is gradually changing from in the star-forming galaxies locus to in the region attributed to AGN.
Using the AGN fraction derived with CIGALE as the criterion to select AGN (AGNFRAC ), we recover 74% of BPT-selected AGN (69% if limiting to sample with FLAGINFRARED = 4). However, at the same time, 62% star-forming galaxies also are identified as AGN (i.e., fulfilling the criterion AGNFRAC ). The percentage of misclassified star-forming galaxies drops to 15% for a sample with FLAGINFRARED = 4. We note that Siudek et al. (2024) show that the overestimation of the AGN fraction for misclassified star-forming galaxies (with AGNFRAC ) does not affect the estimates of the stellar masses and SFRs (see Sect. 2.2).
Figure 6 shows the WISE diagram as a function of the AGNFRAC depending on the availability of the WISE photometry. There is no visual difference in the dependence on the AGNFRAC whether the sample is limited to in W1-3; i.e., FLAGINFRARED = 3 or all WISE bands (W1-4; i.e., FLAGINFRARED = 4), but the sample size differs significantly. The sample selected with FLAGINFRARED includes 9 253 sources, while restricting to FLAGINFRARED = 4 results in 4 974 galaxies. Without any restriction on the FLAGINFRARED, the WISE-AGN are recovered well with SED selection (79% of WISE-AGN are identified as SED-AGN). At the same time, 40% of non-AGN are identified as SED-AGN. Only when applying a more strict cut on WISE photometry (FLAGINFRARED = 4) leads to the identification of 86% of WISE-AGN and reduces the misclassified AGN to 33%.
We find a similar correlation of the AGNFRAC with WISE colors as found for the BPT selection: the region attributed to AGN is characterized by a high AGN fraction (with a median AGNFRAC = 0.25). Outside the AGN selection region, the AGN fraction is low (AGNFRAC ). However, there are two regions attributed to higher AGN fraction (AGNFRAC ) on the right-low end and left-upper of the AGN envelope. While the upper-left region is sparsely populated and can be neglected, the tail in W2-W3 () across color gathers 2 017 galaxies (i.e., half of the WISE-AGN sample; SED-MIR-AGN candidates hereafter).
SED-MIR-AGN candidates are in the majority (91%) characterized by high AGN fraction (AGNFRAC )777We consider the sample restricted to FLAGNFRARED =4.. They are massive passive galaxies (with median and median ). SED-MIR-AGN candidates show tentative888As is weak and noisy we do not restrict the sample based on their SNR. signatures of emission (with median full width at half maximum similar to the one found for AGN, i.e., FWHM km , while for non-AGN FWHM is km ). The [NeIII]3869 emission together with emission line and g-z rest-framed color forms another AGN diagnostic diagram (TBT diagram; Trouille et al. 2011). Trouille et al. (2011) showed that the TBT diagram is efficient in recreating [NII]-BPT selection (98.7% of BPT-AGN are identified as TBT-AGN and 97% of the BPT-SF as TBT-SF) at the same time outperforming the BPT in identifying X-ray selected AGN (TBT identifies 97% of the X-ray AGN as TBT-AGN, while BPT only 80%). Almost all SED-MIR-AGN candidates (94%) are identified as AGN according to the TBT diagram, however, we cannot be confident of their AGN nature, as only 65 have detected with . The weak and noisy may bias the conclusion.
4.3 SED-AGN sample
Table 2 shows that the SED-AGN sample, defined by galaxies with AGNFRAC and FLAGINFRARED at , identifies a significant number of AGN () selected using traditional methods. This overlap suggests that the SED-fitting approach is capable of capturing a broad range of AGN types. As detailed in Table 2, the SED-based classification successfully identifies around 70% of BL-AGN and BPT-AGN and over 85% of WISE-AGN. This high level of correspondence demonstrates the robustness of the SED method in capturing classical AGN types. However, about 15% of star-forming galaxies (BPT-SF) are also classified as AGN by the SED method, indicating some level of contamination from non-AGN sources.
A particularly notable result is that over half of the SED-AGN sample () is not identified by any of the main AGN selection methods (BL-AGN, BPT-AGN, WISE-AGN, or BPT-SF). This raises an important question: is the SED-based method producing a high rate of false positives, or is it effectively uncovering a population of AGN that are missed by traditional diagnostics? To better understand the nature of the SED-AGN sample, we expanded our analysis beyond the standard AGN selection techniques. Specifically, we incorporate additional AGN classifications derived from all three BPTs, X-ray, and radio AGN diagnostics. This broader approach allows for a more comprehensive assessment of the AGN content within the SED-selected population.
When incorporating these additional AGN identification methods, the fraction of galaxies classified solely by the SED criteria (SED-AGN Only) decreases significantly – from 51.78% to 16.14% (see Table 3), highlighting both the complementary value and the limitations of the SED-based method. The SED-based approach appears to at least partially recover AGN populations that are overlooked by traditional diagnostics, emphasizing the value of SED fitting in building a more complete and inclusive AGN census. However, at the same time, a non-negligible fraction of the SED-AGN sample () overlaps with star-forming galaxies (BPT-SF), suggesting some level of contamination. Moreover, the AGN nature of sources classified solely as SED-AGN remains unconfirmed (see discussion below), challenging the use of SED fitting for constructing clean and pure AGN samples.
However, we note that the nature of LINERs remains debated, with alternative ionization sources such as post-asymptotic giant branch (post-AGB) stars or shocks being proposed in the literature (e.g. Stasińska et al. 2008; Singh et al. 2013; Belfiore et al. 2016).
The SED-based technique identifies roughly 50% of LINERs as selected by the BPT diagrams. The interpretation of LINERs remains actively debated in the literature, with studies supporting both AGN (e.g., Heckman, 1980; Kewley et al., 2006) and stellar photoionization scenarios (e.g., Stasińska et al., 2006; Sarzi et al., 2010). The overlap with LINERs suggests that the SED-AGN method is sensitive to a diverse AGN population, including those in different evolutionary stages or in obscured environments. The SED-based method maintains a relatively low level of contamination except in the WHAN diagram. The SED-AGN identifies 40% of WHAN-AGN but also 67% of retired galaxies. Interestingly, the majority (96%) of these retired SED-AGN are actually ”liny” (i.e., showing the presence of the emission lines; ) galaxies. The WHAN diagram is known to struggle with distinguishing low-luminosity AGN from ”liny” retired galaxies, where line emission could originate from past AGN activity or low-level star formation (Cid Fernandes et al., 2010, 2011; Herpich et al., 2018). This raises the possibility that the SED-AGN method may be identifying galaxies transitioning from AGN activity to a more passive state, thus appearing as retired on the WHAN diagram. Supporting this interpretation, Herpich et al. (2018) suggested that ”liny” retired galaxies might have undergone recent star formation, and their emission line gas could originate from the AGN activity. Similarly, Agostino et al. (2023) show that nearly one-third of X-ray AGN fall in the WHAN ”retired” locus. In our sample, out of 2 386 SED-AGN classified as retired in WHAN, 515 (22%) are independently confirmed as AGN via other diagnostics, further questioning their classification as fully passive systems.
The X-ray data (see Sect. 3.4) reveals 882 sources with X-ray emission. Using the star formation rates derived from CIGALE SED fitting and the relation from Lehmer et al. (2010), we estimate the expected 2–10 keV luminosity from star formation and find that 793 galaxies exceed this by more than , confirming AGN-like X-ray emission (see also Mezcua et al., 2018). The SED-based method identifies of these X-ray AGN, even though X-ray data are not used in the fitting, demonstrating good sensitivity to AGN across different regimes. To understand why the other 50% are missed, we examine their classification using other methods. Most are also missed by traditional BPT, and WISE diagnostics, with nearly 40% falling into the WHAN-AGN region. This suggests that the missed X-ray AGN are generally low-luminosity or obscured, escaping both SED and classical diagnostics, and reinforces the known difficulty of identifying such AGN without deep X-ray data. This is consistent with previous studies such as Trouille et al. (2011) and Juneau et al. (2011, 2013), which showed that only – of X-ray AGN fall in the AGN region of the BPT diagram, with many appearing as star-forming or composite systems instead. These studies concluded that emission-line diagnostics become increasingly incomplete for identifying obscured or radiatively inefficient AGN. Our results are in agreement with these findings, and show that SED fitting adds significant value by recovering of X-ray AGN, highlighting its effectiveness in such regimes.
| Category | N | SED-AGN | SED-AGN |
|---|---|---|---|
| Matches % | Only % | ||
| BL-AGN | 2 253 | 70.13 | |
| BPT-AGN | 2 703 | 69.29 | |
| WISE-AGN | 4 953 | 86.45 | |
| BPT-SF | 20 717 | 15.25 | |
| SED-AGN | 25 123 | - | 51.78 |
Of 13 450 galaxies with radio detections (see Sect. 3.4), 5 326 exhibit radio luminosities either above or more than 3 above what is expected from star formation (e.g., Mezcua et al. 2019), classifying them as radio AGN. The SED fitting recovers 40% of these sources. Similar to the X-ray case, the radio AGN missed by SED tend to be weakly active or obscured, with most showing no overlap with BPT, or WISE diagnostics, and falling within the WHAN-AGN region. This again highlights the complementary but incomplete nature of the SED-based classification and reinforces the need for multi-wavelength data to uncover the full AGN population. Moreover, the SED fitting depends on model assumptions, which affect the AGN classification (see Table 6 in Appendix C for details).
| Category | N | SED-AGN | SED-AGN |
|---|---|---|---|
| Matches % | Only % | ||
| NII-AGN | 3 791 | 67.95 | |
| NII-SF | 23 175 | 17.48 | |
| NII-LINER | 1 064 | 54.42 | |
| NII-COMPOSITE | 7 939 | 33.54 | |
| SII-AGN | 2 583 | 68.45 | |
| SII-SF | 31 458 | 21.13 | |
| SII-LINER | 630 | 53.65 | |
| OI-AGN | 3 510 | 69.66 | |
| OI-SF | 30 420 | 22.72 | |
| OI-LINER | 832 | 62.26 | |
| WHAN-AGN | 32 283 | 38.61 | |
| WHAN-SF | 25 534 | 20.36 | |
| WHAN-RG | 3 559 | 67.04 | |
| X-RAY-AGN | 793 | 45.27 | |
| RADIO-AGN | 5 326 | 38.64 | |
| SED-AGN | 4 054 | - | 16.14 |
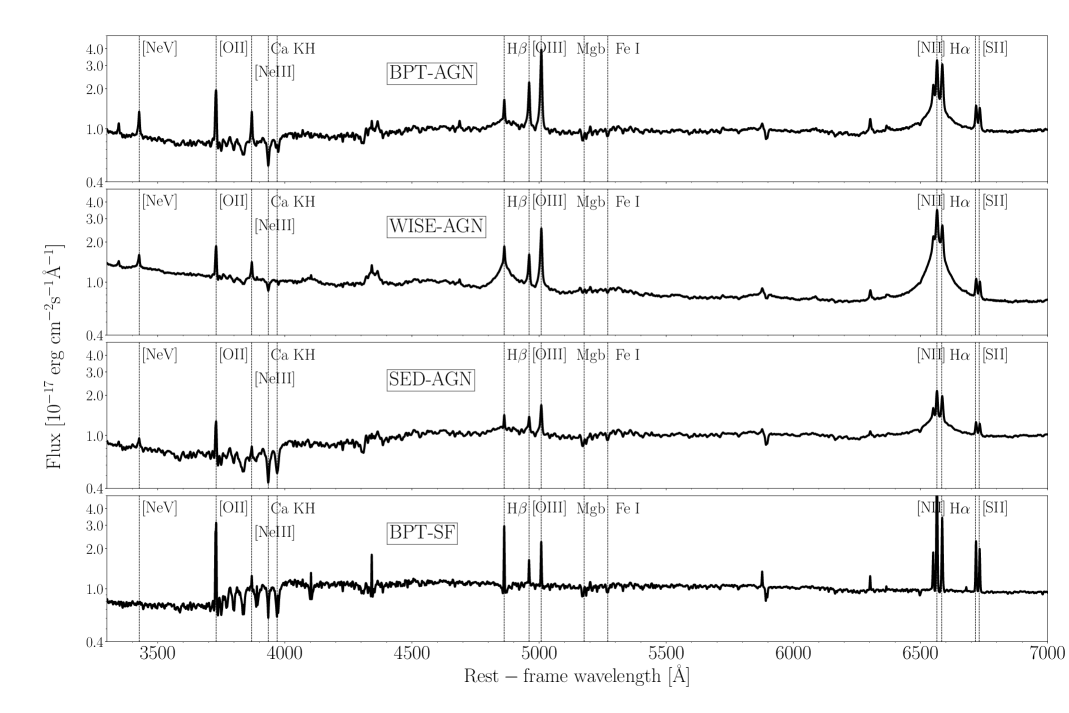
Figure 7 shows the stacked spectra of BPT-AGN, WISE-AGN, SED-AGN, and BPT-SF galaxies. The spectra were stacked using mean normalization, preserving the relative fluxes of the emission lines, which is essential for a reliable comparison of spectral features across different samples. The SED-AGN stack shows similarity to the BPT-AGN and WISE-AGN stacks, particularly evident in the characteristic AGN emission line ratios, such as . Unlike the BPT-SF sample, where the emission is absent, the presence and relative strength of in SED-AGN align more closely with the AGN-dominated spectra. High-ionization lines, such as , require energies well above the limit of stellar emission (55 eV; e.g., Leitherer et al., 1999; Izotov et al., 2004) and can be an efficient tracer of the AGN (e.g Gilli et al., 2010; Negus et al., 2023; Barchiesi et al., 2024).
4.4 SED-AGN Only: properties of the host galaxies
Despite the effectiveness of the SED-based technique, 4 054 out of 25 123 SED-AGN galaxies (16.14%, see Table 3) are classified as SED-AGN Only, meaning they are not confirmed by any other AGN selection method. To further explore the nature of these SED-AGN Only galaxies, we analyze their properties in comparison to properties of the BPT-AGN, WISE-AGN, SED-AGN, and BPT-SF galaxies999We do not include BL-AGN in the comparison as the SED-AGN Only do not show the presence of broad emission lines. as summarized in Table 4. These SED-AGN Only galaxies tend to be more massive, with median stellar masses comparable to those of BPT-AGN and WISE-AGN hosts (). However, they exhibit significantly lower star formation rates () than BPT-AGN and WISE-AGN, suggesting that they are generally passive galaxies.
To confirm the passive nature of SED-AGN Only hosts, we also check the 4000 Å break (D4000), an indicator of the age of the stellar population: a high D4000 value (D4000 ¿ 1.5) indicates older stars and high metallicity, while a lower value (D4000 1.5) suggests younger, star-forming populations (e.g., Kauffmann et al., 2003; Siudek et al., 2017, 2018b). The high D4000 values of the SED-AGN Only (D4000 = 1.76) indicate that old stars dominate the light from these galaxies. Moreover, we find that the majority (78%) of the AGN-SED Only show red colors on to the U-V vs. V-J diagram (Whitaker et al., 2012; Siudek et al., 2024), consistent with their passive nature. This contrasts sharply with other classes, where the fraction of red galaxies is much lower, ranging from 0% in star-forming galaxies to 13% in BPT-AGN. Also, the optical part of the SEDs of SED-AGN Only galaxies is dominated by old stellar populations, while AGN contribution is seen in the MIR (see Appendix B). This analysis suggests that SED-AGN Only galaxies may represent a population of galaxies transitioning away from active star formation, possibly hosting weak or fading AGN activity that other methods fail to detect.
| Unit | BPT-SF | BPT-AGN | WISE-AGN | SED-AGN | SED-AGN | |
|---|---|---|---|---|---|---|
| Only | ||||||
| N | 20 717 | 2 703 | 4 953 | 25 123 | 4 054 | |
| Z | ||||||
| LOGM | ||||||
| LOGSFR | ||||||
| D4000 |
We also verify whether there are signatures of non-AGN nature among SED-AGN Only. Only 15 of SED-AGN Only () are characterized by line ratios characteristic of shock excitation, such as or , which are traditionally associated with supernova remnants or other shock-heated regions rather than photoionization by an AGN (e.g., Dodorico et al., 1978; Rich et al., 2010; Comerford et al., 2022). This suggests that contamination from non-AGN processes in the SED-AGN Only sample is minimal.
5 Summary
We identify AGN based on the AGN fraction (AGNFRAC ) derived from SED fitting with CIGALE applied to DESI EDR galaxies at . As discussed in Sect. 1, traditional AGN identification diagnostics, such as the BPT diagram, are limited by luminosity biases, often leading to incomplete samples. In contrast, the SED-based approach, leveraging a multi-wavelength strategy, promises a more comprehensive identification of AGN. Our key findings are summarized as follows:
-
•
Importance of WISE photometry:
MIR photometry is essential for robust AGN identification via AGNFRAC. When high SNR () WISE photometry is limited (i.e., FLAGINFRARED ), 62% of BPT-selected star-forming galaxies are incorrectly classified as AGN. Including all four WISE bands with (FLAGINFRARED = 4) reduces this contamination to 15%. Meanwhile, 70% of BPT-AGN are consistently recovered, irrespective of the WISE photometry’s SNR (see Sect. 4.2). -
•
MIR-AGN candidates beyond WISE diagram::
The SED fitting method identifies a distinct subset of strong AGN candidates (SED-MIR-AGN) that fall outside the canonical AGN region on the WISE diagram. These sources are confirmed as AGN in 98% of cases via the TBT diagram, although weak and noisy emission limits definitive confirmation (see Sect. 4.2). -
•
Comparison with standard AGN selection methods:
Our SED-based AGN classification shows substantial agreement with traditional techniques, recovering approximately 70% of both BL-AGN and BPT-AGN, and over 85% of WISE-selected AGN. However, the method does have a 15% contamination rate from star-forming galaxies. -
•
SED fitting as a unifying AGN diagnostic:
The SED approach uncovers a population of AGN (SED-AGN Only) missed by standard diagnostics. Relying solely on BPT-AGN, WISE-AGN, and BPT-SF selections fails to identify 52% of SED-AGN (see Tab. 2). Incorporating multiple selection methods reduces this fraction to 16% (see Table 3). While promising, the SED-AGN Only population includes uncertain cases (e.g., LINERs, “liny” retired galaxies), and may still be affected by a 15% contamination from star-forming galaxies. -
•
Dependence on model assumptions:
The efficiency and purity of SED-based AGN selection are moderately sensitive to modeling choices (see Table 6 and Fig. 9). Changes to dust attenuation laws and AGN templates can alter the balance between completeness and contamination, while variations in IMF, SFH, and SSP models have smaller effects. We note that allowing metallicity to vary as a free parameter achieves similar or even slightly better performance, further reducing contamination from star-forming galaxies and marginally improving AGN selection efficiency. The use of mid-infrared data is crucial—removing WISE W3 and W4 bands leads to severe contamination by star-forming galaxies.
This work demonstrates the importance of multi-wavelength data fusion for robust AGN identification, with direct implications for upcoming large-scale surveys. The Euclid mission will provide deep near-infrared photometry across 14 000 (Euclid Collaboration et al., 2025a), LSST will deliver unprecedented optical depth and time-domain coverage (Ivezić et al., 2019), and the Spectro-Photometer for the History of the Universe, Epoch of Reionization, and ices Explorer (SPHEReX) will perform an all-sky spectroscopic survey with near-immediate public data release (Doré et al., 2014; Crill et al., 2020). However, mismatched depths and sky coverage among these facilities present challenges for optimal data fusion (e.g., Melchior et al., 2021; Huertas-Company & Lanusse, 2023).
Our 70-80% recovery rate using DESI Legacy Surveys and WISE photometry demonstrates that systematic multi-wavelength approaches can effectively overcome individual survey limitations. To further enhance AGN selection, machine-learning techniques are proving to be increasingly powerful. Semi-supervised clustering applied to medium-resolution spectroscopy can automatically separate narrow-line and broad-line AGN with high accuracy (Siudek et al., 2018b, a, 2022; Dubois et al., 2024). Autoencoder architectures successfully recover AGN candidates missed by traditional BPT diagnostics due to low-SNR line measurements (Alcolea et al., in prep.), while diffusion-based models identify AGN from single-band morphological analysis of Euclid optical images (Euclid Collaboration et al., 2025c). Foundation models may further unify multi-wavelength AGN detection, though their full potential remains to be explored (Euclid Collaboration et al., 2025b). The multi-wavelength approach, such as the systematic incorporation of SPHEReX spectroscopic data into LSST AGN selection pipelines, analogous to the DESI Legacy Surveys and WISE approach presented here, could reduce the 15% star-forming galaxy contamination observed in optical-only classifications. More broadly, a multi-modal approach that combines morphological, spectral, and photometric data may be key to robust AGN identification in the era of next-generation surveys.
Acknowledgements.
The authors thank the anonymous referee for insightful comments. This work has been supported by the Polish National Agency for Academic Exchange (Bekker grant BPN/BEK/2021/1/00298/DEC/1) and the State Research Agency of the Spanish Ministry of Science and Innovation (grant PGC2018-100852-A-I00 and PID2021-126838NB-I00). M.M. acknowledges support from the Spanish Ministry of Science and Innovation through the project PID2021-124243NB-C22, and the program Unidad de Excelencia María de Maeztu CEX2020-001058-M. H.Z. acknowledges the support from the National Natural Science Foundation of China (NSFC; grant Nos. 12120101003 and 12373010) and National Key R&D Program of China (grant Nos. 2023YFA1607800, 2022YFA1602902) and Strategic Priority Research Program of the Chinese Academy of Science (Grant Nos. XDB0550100). This material is based upon work supported by the U.S. Department of Energy (DOE), Office of Science, Office of High-Energy Physics, under Contract No. DE–AC02–05CH11231, and by the National Energy Research Scientific Computing Center, a DOE Office of Science User Facility under the same contract. Additional support for DESI was provided by the U.S. National Science Foundation (NSF), Division of Astronomical Sciences under Contract No. AST-0950945 to the NSF’s National Optical-Infrared Astronomy Research Laboratory; the Science and Technology Facilities Council of the United Kingdom; the Gordon and Betty Moore Foundation; the Heising-Simons Foundation; the French Alternative Energies and Atomic Energy Commission (CEA); the National Council of Humanities, Science and Technology of Mexico (CONAHCYT); the Ministry of Science, Innovation and Universities of Spain (MICIU/AEI/10.13039/501100011033), and by the DESI Member Institutions: https://www.desi.lbl.gov/collaborating-institutions. Any opinions, findings, and conclusions or recommendations expressed in this material are those of the author(s) and do not necessarily reflect the views of the U. S. National Science Foundation, the U. S. Department of Energy, or any of the listed funding agencies. The authors are honored to be permitted to conduct scientific research on Iolkam Du’ag (Kitt Peak), a mountain with particular significance to the Tohono O’odham Nation. The DESI Legacy Imaging Surveys consist of three individual and complementary projects: the Dark Energy Camera Legacy Survey (DECaLS), the Beijing-Arizona Sky Survey (BASS), and the Mayall z-band Legacy Survey (MzLS). DECaLS, BASS and MzLS together include data obtained, respectively, at the Blanco telescope, Cerro Tololo Inter-American Observatory, NSF’s NOIRLab; the Bok telescope, Steward Observatory, University of Arizona; and the Mayall telescope, Kitt Peak National Observatory, NOIRLab. NOIRLab is operated by the Association of Universities for Research in Astronomy (AURA) under a cooperative agreement with the National Science Foundation. Pipeline processing and analyses of the data were supported by NOIRLab and the Lawrence Berkeley National Laboratory. Legacy Surveys also uses data products from the Near-Earth Object Wide-field Infrared Survey Explorer (NEOWISE), a project of the Jet Propulsion Laboratory/California Institute of Technology, funded by the National Aeronautics and Space Administration. Legacy Surveys was supported by: the Director, Office of Science, Office of High Energy Physics of the U.S. Department of Energy; the National Energy Research Scientific Computing Center, a DOE Office of Science User Facility; the U.S. National Science Foundation, Division of Astronomical Sciences; the National Astronomical Observatories of China, the Chinese Academy of Sciences and the Chinese National Natural Science Foundation. LBNL is managed by the Regents of the University of California under contract to the U.S. Department of Energy. The complete acknowledgments can be found at https://www.legacysurvey.org/.Data Availability
The VAC of physical properties of DESI EDR galaxies is publicly available at https://data.desi.lbl.gov/doc/releases/edr/vac/cigale/. The presented analysis is conducted on v1.4 based on the redshift coming from the QSO afterburner pipeline relying on the QuasarNet and the broad Mg II finder pipelines. The data behind the figures are available at https://doi.org/10.5281/zenodo.15622223.
References
- Agostino et al. (2023) Agostino, C. J., Salim, S., Boquien, M., et al. 2023, MNRAS, 526, 4455
- Almeida et al. (2023) Almeida, A., Anderson, S. F., Argudo-Fernández, M., et al. 2023, ApJS, 267, 44
- Anand et al. (2024) Anand, A., Guy, J., Bailey, S., et al. 2024, arXiv e-prints, arXiv:2405.19288
- Assef et al. (2013) Assef, R. J., Stern, D., Kochanek, C. S., et al. 2013, ApJ, 772, 26
- Baldwin et al. (1981) Baldwin, J. A., Phillips, M. M., & Terlevich, R. 1981, PASP, 93, 5
- Barchiesi et al. (2024) Barchiesi, L., Vignali, C., Pozzi, F., et al. 2024, A&A, 685, A141
- Bernal et al. (2025) Bernal, S., Sánchez-Sáez, P., Arévalo, P., et al. 2025, A&A, 694, A127
- Berta et al. (2013) Berta, S., Lutz, D., Santini, P., et al. 2013, A&A, 551, A100
- Best et al. (2023) Best, P. N., Kondapally, R., Williams, W. L., et al. 2023, MNRAS, 523, 1729
- Bichang’a et al. (2024) Bichang’a, B., Kaviraj, S., Lazar, I., et al. 2024, MNRAS[arXiv:2406.11962]
- Boquien et al. (2019) Boquien, M., Burgarella, D., Roehlly, Y., et al. 2019, A&A, 622, A103
- Bradley (1997) Bradley, A. P. 1997, Pattern Recognition, 30, 1145
- Brandt & Alexander (2015) Brandt, W. N. & Alexander, D. M. 2015, A&A Rev., 23, 1
- Brodzeller et al. (2023) Brodzeller, A., Dawson, K., Bailey, S., et al. 2023, AJ, 166, 66
- Bruzual & Charlot (2003) Bruzual, G. & Charlot, S. 2003, MNRAS, 344, 1000
- Burke et al. (2022) Burke, C. J., Liu, X., Shen, Y., et al. 2022, MNRAS, 516, 2736
- Burke et al. (2024) Burke, C. J., Liu, Y., Ward, C. A., et al. 2024, arXiv e-prints, arXiv:2402.06882
- Burlon et al. (2011) Burlon, D., Ajello, M., Greiner, J., et al. 2011, ApJ, 728, 58
- Calzetti et al. (2000) Calzetti, D., Armus, L., Bohlin, R. C., et al. 2000, ApJ, 533, 682
- Cann et al. (2019) Cann, J. M., Satyapal, S., Abel, N. P., et al. 2019, ApJ, 870, L2
- Chabrier (2003) Chabrier, G. 2003, PASP, 115, 763
- Charlot & Fall (2000) Charlot, S. & Fall, S. M. 2000, ApJ, 539, 718
- Chaussidon et al. (2023) Chaussidon, E., Yèche, C., Palanque-Delabrouille, N., et al. 2023, ApJ, 944, 107
- Cid Fernandes et al. (2011) Cid Fernandes, R., Stasińska, G., Mateus, A., & Vale Asari, N. 2011, MNRAS, 413, 1687
- Cid Fernandes et al. (2010) Cid Fernandes, R., Stasińska, G., Schlickmann, M. S., et al. 2010, MNRAS, 403, 1036
- Ciesla et al. (2015) Ciesla, L., Charmandaris, V., Georgakakis, A., et al. 2015, A&A, 576, A10
- Ciesla et al. (2023) Ciesla, L., Gómez-Guijarro, C., Buat, V., et al. 2023, A&A, 672, A191
- Comerford et al. (2022) Comerford, J. M., Negus, J., Barrows, R. S., et al. 2022, ApJ, 927, 23
- Condon et al. (1998) Condon, J. J., Cotton, W. D., Greisen, E. W., et al. 1998, AJ, 115, 1693
- Conselice et al. (2023) Conselice, C. J., Singh, M., Adams, N., et al. 2023, MNRAS, 525, 1353
- Crill et al. (2020) Crill, B. P., Werner, M., Akeson, R., et al. 2020, in Society of Photo-Optical Instrumentation Engineers (SPIE) Conference Series, Vol. 11443, Space Telescopes and Instrumentation 2020: Optical, Infrared, and Millimeter Wave, ed. M. Lystrup & M. D. Perrin, 114430I
- Csizi et al. (2024) Csizi, B., Tortorelli, L., Siudek, M., et al. 2024, arXiv e-prints, arXiv:2405.20385
- Dale et al. (2014) Dale, D. A., Helou, G., Magdis, G. E., et al. 2014, ApJ, 784, 83
- Das et al. (2024) Das, S., Smith, D. J. B., Haskell, P., et al. 2024, MNRAS, 531, 977
- DESI Collaboration et al. (2022) DESI Collaboration, Abareshi, B., Aguilar, J., et al. 2022, AJ, 164, 207
- DESI Collaboration et al. (2025) DESI Collaboration, Abdul-Karim, M., Adame, A. G., et al. 2025, arXiv e-prints, arXiv:2503.14745
- DESI Collaboration et al. (2024a) DESI Collaboration, Adame, A. G., Aguilar, J., et al. 2024a, AJ, 168, 58
- DESI Collaboration et al. (2024b) DESI Collaboration, Adame, A. G., Aguilar, J., et al. 2024b, AJ, 167, 62
- DESI Collaboration et al. (2024c) DESI Collaboration, Adame, A. G., Aguilar, J., et al. 2024c, arXiv e-prints, arXiv:2411.12022
- DESI Collaboration et al. (2016a) DESI Collaboration, Aghamousa, A., Aguilar, J., et al. 2016a, arXiv e-prints, arXiv:1611.00036
- DESI Collaboration et al. (2016b) DESI Collaboration, Aghamousa, A., Aguilar, J., et al. 2016b, arXiv e-prints, arXiv:1611.00037
- Dey et al. (2019) Dey, A., Schlegel, D. J., Lang, D., et al. 2019, AJ, 157, 168
- Dodorico et al. (1978) Dodorico, S., Benvenuti, P., & Sabbadin, F. 1978, A&A, 63, 63
- Doré et al. (2014) Doré, O., Bock, J., Ashby, M., et al. 2014, arXiv e-prints, arXiv:1412.4872
- Draine et al. (2014) Draine, B. T., Aniano, G., Krause, O., et al. 2014, ApJ, 780, 172
- Dubois et al. (2024) Dubois, J., Siudek, M., Fraix-Burnet, D., & Moultaka, J. 2024, A&A, 687, A76
- Euclid Collaboration et al. (2025a) Euclid Collaboration, Mellier, Y., Abdurro’uf, et al. 2025a, A&A, 697, A1
- Euclid Collaboration et al. (2025b) Euclid Collaboration, Siudek, M., Huertas-Company, M., et al. 2025b, arXiv e-prints, arXiv:2503.15312
- Euclid Collaboration et al. (2025c) Euclid Collaboration, Stevens, G., Fotopoulou, S., et al. 2025c, arXiv e-prints, arXiv:2503.15321
- Evans et al. (2024) Evans, I. N., Evans, J. D., Martínez-Galarza, J. R., et al. 2024, arXiv e-prints, arXiv:2407.10799
- Evans et al. (2010) Evans, I. N., Primini, F. A., Glotfelty, K. J., et al. 2010, ApJS, 189, 37
- Fawcett et al. (2023) Fawcett, V. A., Alexander, D. M., Brodzeller, A., et al. 2023, MNRAS, 525, 5575
- Fritz et al. (2006) Fritz, J., Franceschini, A., & Hatziminaoglou, E. 2006, MNRAS, 366, 767
- Genzel et al. (2010) Genzel, R., Eisenhauer, F., & Gillessen, S. 2010, Reviews of Modern Physics, 82, 3121
- Ghez et al. (2008) Ghez, A. M., Salim, S., Weinberg, N. N., et al. 2008, ApJ, 689, 1044
- Gilli et al. (2007) Gilli, R., Comastri, A., & Hasinger, G. 2007, A&A, 463, 79
- Gilli et al. (2010) Gilli, R., Vignali, C., Mignoli, M., et al. 2010, A&A, 519, A92
- Groves et al. (2006) Groves, B. A., Heckman, T. M., & Kauffmann, G. 2006, MNRAS, 371, 1559
- Guo et al. (2025) Guo, W.-J., Pan, Z., Siudek, M., et al. 2025, ApJ, 981, L8
- Guo et al. (2024a) Guo, W.-J., Zou, H., Fawcett, V. A., et al. 2024a, ApJS, 270, 26
- Guo et al. (2024b) Guo, W.-J., Zou, H., Greenwell, C. L., et al. 2024b, arXiv e-prints, arXiv:2408.00402
- Guy et al. (2023) Guy, J., Bailey, S., Kremin, A., et al. 2023, AJ, 165, 144
- Hahn et al. (2023) Hahn, C., Wilson, M. J., Ruiz-Macias, O., et al. 2023, AJ, 165, 253
- Hainline et al. (2016) Hainline, K. N., Reines, A. E., Greene, J. E., & Stern, D. 2016, ApJ, 832, 119
- Harrison & Ramos Almeida (2024) Harrison, C. M. & Ramos Almeida, C. 2024, Galaxies, 12, 17
- Heckman (1980) Heckman, T. M. 1980, A&A, 87, 152
- Heckman & Best (2014) Heckman, T. M. & Best, P. N. 2014, ARA&A, 52, 589
- Helfand et al. (2015) Helfand, D. J., White, R. L., & Becker, R. H. 2015, ApJ, 801, 26
- Herpich et al. (2018) Herpich, F., Stasińska, G., Mateus, A., Vale Asari, N., & Cid Fernandes, R. 2018, MNRAS, 481, 1774
- Huertas-Company & Lanusse (2023) Huertas-Company, M. & Lanusse, F. 2023, PASA, 40, e001
- Hviding et al. (2022) Hviding, R. E., Hainline, K. N., Rieke, M., et al. 2022, AJ, 163, 224
- Ivezić et al. (2019) Ivezić, Ž., Kahn, S. M., Tyson, J. A., et al. 2019, ApJ, 873, 111
- Izotov et al. (2004) Izotov, Y. I., Noeske, K. G., Guseva, N. G., et al. 2004, A&A, 415, L27
- Jarrett et al. (2011) Jarrett, T. H., Cohen, M., Masci, F., et al. 2011, ApJ, 735, 112
- Ji & Yan (2020) Ji, X. & Yan, R. 2020, MNRAS, 499, 5749
- Juneau et al. (2011) Juneau, S., Dickinson, M., Alexander, D. M., & Salim, S. 2011, ApJ, 736, 104
- Juneau et al. (2013) Juneau, S., Dickinson, M., Bournaud, F., et al. 2013, ApJ, 764, 176
- Kauffmann et al. (2003) Kauffmann, G., Heckman, T. M., Tremonti, C., et al. 2003, MNRAS, 346, 1055
- Kewley et al. (2006) Kewley, L. J., Groves, B., Kauffmann, G., & Heckman, T. 2006, MNRAS, 372, 961
- Kewley et al. (2001) Kewley, L. J., Heisler, C. A., Dopita, M. A., & Lumsden, S. 2001, ApJS, 132, 37
- Komatsu et al. (2011) Komatsu, E., Smith, K. M., Dunkley, J., et al. 2011, ApJS, 192, 18
- Kormendy & Ho (2013) Kormendy, J. & Ho, L. C. 2013, ARA&A, 51, 511
- Lacy et al. (2015) Lacy, M., Ridgway, S. E., Sajina, A., et al. 2015, ApJ, 802, 102
- Lacy et al. (2004) Lacy, M., Storrie-Lombardi, L. J., Sajina, A., et al. 2004, ApJS, 154, 166
- Lang et al. (2016) Lang, D., Hogg, D. W., & Mykytyn, D. 2016, The Tractor: Probabilistic astronomical source detection and measurement, Astrophysics Source Code Library, record ascl:1604.008
- Lehmer et al. (2010) Lehmer, B. D., Alexander, D. M., Bauer, F. E., et al. 2010, ApJ, 724, 559
- Leitherer et al. (1999) Leitherer, C., Schaerer, D., Goldader, J. D., et al. 1999, ApJS, 123, 3
- Levi et al. (2013) Levi, M., Bebek, C., Beers, T., et al. 2013, arXiv e-prints, arXiv:1308.0847
- Mainzer et al. (2014) Mainzer, A., Bauer, J., Cutri, R. M., et al. 2014, ApJ, 792, 30
- Maiolino et al. (2020) Maiolino, R., Cirasuolo, M., Afonso, J., et al. 2020, The Messenger, 180, 24
- Małek et al. (2018) Małek, K., Buat, V., Roehlly, Y., et al. 2018, A&A, 620, A50
- Maraston (2005) Maraston, C. 2005, MNRAS, 362, 799
- Marshall et al. (2022) Marshall, A., Auger-Williams, M. W., Banerji, M., Maiolino, R., & Bowler, R. 2022, MNRAS, 515, 5617
- Mazzolari et al. (2024) Mazzolari, G., Gilli, R., Brusa, M., et al. 2024, arXiv e-prints, arXiv:2402.00109
- Meisner et al. (2021) Meisner, A. M., Lang, D., Schlafly, E. F., & Schlegel, D. J. 2021, Research Notes of the American Astronomical Society, 5, 168
- Melchior et al. (2021) Melchior, P., Joseph, R., Sanchez, J., MacCrann, N., & Gruen, D. 2021, Nature Reviews Physics, 3, 712
- Merloni et al. (2019) Merloni, A., Alexander, D. A., Banerji, M., et al. 2019, The Messenger, 175, 42
- Merloni et al. (2024) Merloni, A., Lamer, G., Liu, T., et al. 2024, A&A, 682, A34
- Mezcua et al. (2018) Mezcua, M., Civano, F., Marchesi, S., et al. 2018, MNRAS, 478, 2576
- Mezcua & Dom´ınguez Sánchez (2024) Mezcua, M. & Domínguez Sánchez, H. 2024, MNRAS, 528, 5252
- Mezcua et al. (2024) Mezcua, M., Pacucci, F., Suh, H., Siudek, M., & Natarajan, P. 2024, ApJ, 966, L30
- Mezcua et al. (2023) Mezcua, M., Siudek, M., Suh, H., et al. 2023, ApJ, 943, L5
- Mezcua et al. (2019) Mezcua, M., Suh, H., & Civano, F. 2019, MNRAS, 488, 685
- Miller et al. (2023) Miller, T. N., Doel, P., Gutierrez, G., et al. 2023, arXiv e-prints, arXiv:2306.06310
- Mountrichas et al. (2021a) Mountrichas, G., Buat, V., Georgantopoulos, I., et al. 2021a, A&A, 653, A70
- Mountrichas et al. (2021b) Mountrichas, G., Buat, V., Yang, G., et al. 2021b, A&A, 646, A29
- Moustakas et al. (2023) Moustakas, J., Scholte, D., Dey, B., & Khederlarian, A. 2023, FastSpecFit: Fast spectral synthesis and emission-line fitting of DESI spectra, Astrophysics Source Code Library, record ascl:2308.005
- Negus et al. (2023) Negus, J., Comerford, J. M., Sánchez, F. M., et al. 2023, ApJ, 945, 127
- Oke & Gunn (1983) Oke, J. B. & Gunn, J. E. 1983, ApJ, 266, 713
- Osborne & Salim (2024) Osborne, C. & Salim, S. 2024, ApJ, 962, 59
- Padovani (2016) Padovani, P. 2016, A&A Rev., 24, 13
- Pai et al. (2024) Pai, A., Blanton, M. R., & Moustakas, J. 2024, arXiv e-prints, arXiv:2407.05508
- Polimera et al. (2022) Polimera, M. S., Kannappan, S. J., Richardson, C. T., et al. 2022, ApJ, 931, 44
- Poppett et al. (2024) Poppett, C., Tyas, L., Aguilar, J., et al. 2024, AJ, 168, 245
- Prathap et al. (2024) Prathap, J., Hopkins, A. M., Robotham, A. S. G., et al. 2024, arXiv e-prints, arXiv:2402.11817
- Pucha et al. (2025) Pucha, R., Juneau, S., Dey, A., et al. 2025, ApJ, 982, 10
- Raichoor et al. (2023) Raichoor, A., Moustakas, J., Newman, J. A., et al. 2023, AJ, 165, 126
- Rich et al. (2010) Rich, J. A., Dopita, M. A., Kewley, L. J., & Rupke, D. S. N. 2010, ApJ, 721, 505
- Salim et al. (2016) Salim, S., Lee, J. C., Janowiecki, S., et al. 2016, ApJS, 227, 2
- Salpeter (1955) Salpeter, E. E. 1955, ApJ, 121, 161
- Sarzi et al. (2010) Sarzi, M., Shields, J. C., Schawinski, K., et al. 2010, MNRAS, 402, 2187
- Schawinski et al. (2007) Schawinski, K., Thomas, D., Sarzi, M., et al. 2007, MNRAS, 382, 1415
- Schlafly et al. (2023) Schlafly, E. F., Kirkby, D., Schlegel, D. J., et al. 2023, AJ, 166, 259
- Shimwell et al. (2022) Shimwell, T. W., Hardcastle, M. J., Tasse, C., et al. 2022, A&A, 659, A1
- Siudek et al. (2022) Siudek, M., Lisiecki, K., Mezcua, M., et al. 2022, arXiv e-prints, arXiv:2211.11792
- Siudek et al. (2018a) Siudek, M., Małek, K., Pollo, A., et al. 2018a, arXiv e-prints, arXiv:1805.09905
- Siudek et al. (2018b) Siudek, M., Małek, K., Pollo, A., et al. 2018b, A&A, 617, A70
- Siudek et al. (2017) Siudek, M., Małek, K., Scodeggio, M., et al. 2017, A&A, 597, A107
- Siudek et al. (2024) Siudek, M., Pucha, R., Mezcua, M., et al. 2024, A&A, 691, A308
- Stalevski et al. (2012) Stalevski, M., Fritz, J., Baes, M., Nakos, T., & Popović, L. Č. 2012, MNRAS, 420, 2756
- Stalevski et al. (2016) Stalevski, M., Ricci, C., Ueda, Y., et al. 2016, MNRAS, 458, 2288
- Stasińska et al. (2006) Stasińska, G., Cid Fernandes, R., Mateus, A., Sodré, L., & Asari, N. V. 2006, MNRAS, 371, 972
- Stern et al. (2012) Stern, D., Assef, R. J., Benford, D. J., et al. 2012, ApJ, 753, 30
- Stern et al. (2005) Stern, D., Eisenhardt, P., Gorjian, V., et al. 2005, ApJ, 631, 163
- Tadhunter (2016) Tadhunter, C. 2016, A&A Rev., 24, 10
- Thorne et al. (2022) Thorne, J. E., Robotham, A. S. G., Davies, L. J. M., et al. 2022, MNRAS, 509, 4940
- Trouille et al. (2011) Trouille, L., Barger, A. J., & Tremonti, C. 2011, ApJ, 742, 46
- Truebenbach & Darling (2017) Truebenbach, A. E. & Darling, J. 2017, MNRAS, 468, 196
- Webb et al. (2020) Webb, N. A., Coriat, M., Traulsen, I., et al. 2020, A&A, 641, A136
- Whitaker et al. (2012) Whitaker, K. E., van Dokkum, P. G., Brammer, G., & Franx, M. 2012, ApJ, 754, L29
- Wright et al. (2010) Wright, E. L., Eisenhardt, P. R. M., Mainzer, A. K., et al. 2010, AJ, 140, 1868
- Wylezalek et al. (2018) Wylezalek, D., Zakamska, N. L., Greene, J. E., et al. 2018, MNRAS, 474, 1499
- Yang et al. (2020) Yang, G., Boquien, M., Buat, V., et al. 2020, MNRAS, 491, 740
- Yang et al. (2023) Yang, G., Caputi, K. I., Papovich, C., et al. 2023, ApJ, 950, L5
- York et al. (2000) York, D. G., Adelman, J., Anderson, John E., J., et al. 2000, AJ, 120, 1579
- Zhou et al. (2023) Zhou, R., Dey, B., Newman, J. A., et al. 2023, AJ, 165, 58
- Zou et al. (2017) Zou, H., Zhou, X., Fan, X., et al. 2017, PASP, 129, 064101
Appendix A SED Fitting Parameters
To ensure transparency and reproducibility, we provide in Table 5 the full set of input parameters and grid values used in the SED fitting process with CIGALE. These parameters follow the configuration adopted in the DESI EDR VAC (Siudek et al. 2024). As CIGALE-based analyses are sensitive to the choice and priors of model parameters, we use a grid that balances physical coverage with computational feasibility.
| Parameter | Symbol | Values |
| Stellar population models: Bruzual & Charlot (2003) | ||
| Initial mass function | IMF | Chabrier (2003) |
| Metallicity | 0.02 | |
| SFH: Double exponentially decreasing | ||
| of the main stellar population (Gyr) | 0.1, 0.5, 1, 3, 5, 8 | |
| Age of the main stellar population (Gyr) | 0.5, 1, 3, 4.5, 6, 8, 10, 13 | |
| of the burst stellar population (Gyr) | 10 | |
| Age of the burst stellar population (Gyr) | 0.05 | |
| Mass fraction of young stellar population | 0, 0.01, 0.1, 0.2 | |
| Nebular emission | ||
| Ionization parameter | -2 | |
| Gas metallicity | 0.02 | |
| Dust attenuation: Calzetti et al. (2000) | ||
| Color excess of the nebular emission | 0, 0.05, 0.15, 0.3, 0.5, 0.75, 0.9, 1.1, 1.3, 1.6 | |
| Reduction factor to apply on | 0.44 | |
| Dust emission: Draine et al. (2014) | ||
| Mass fraction of PAHs | 0.47, 1.12, 2.5, 3.19 | |
| Minimum radiation field | 15 | |
| Power law slope of the radiation field | 2.0 | |
| Fraction illuminated from to | 0.02 | |
| AGN: Fritz et al. (2006) | ||
| The angle between the equatorial axis and line-of-sight | AGNPSY [deg] | 0.001, 20.100, 40.1, 70.100, 89.990 |
| Contribution of the AGN to the total LIR | AGNFRAC | 0, 0.01, 0.1, 0.3, 0.5, 0.7, 0.9 |
Appendix B The SEDs for representative examples
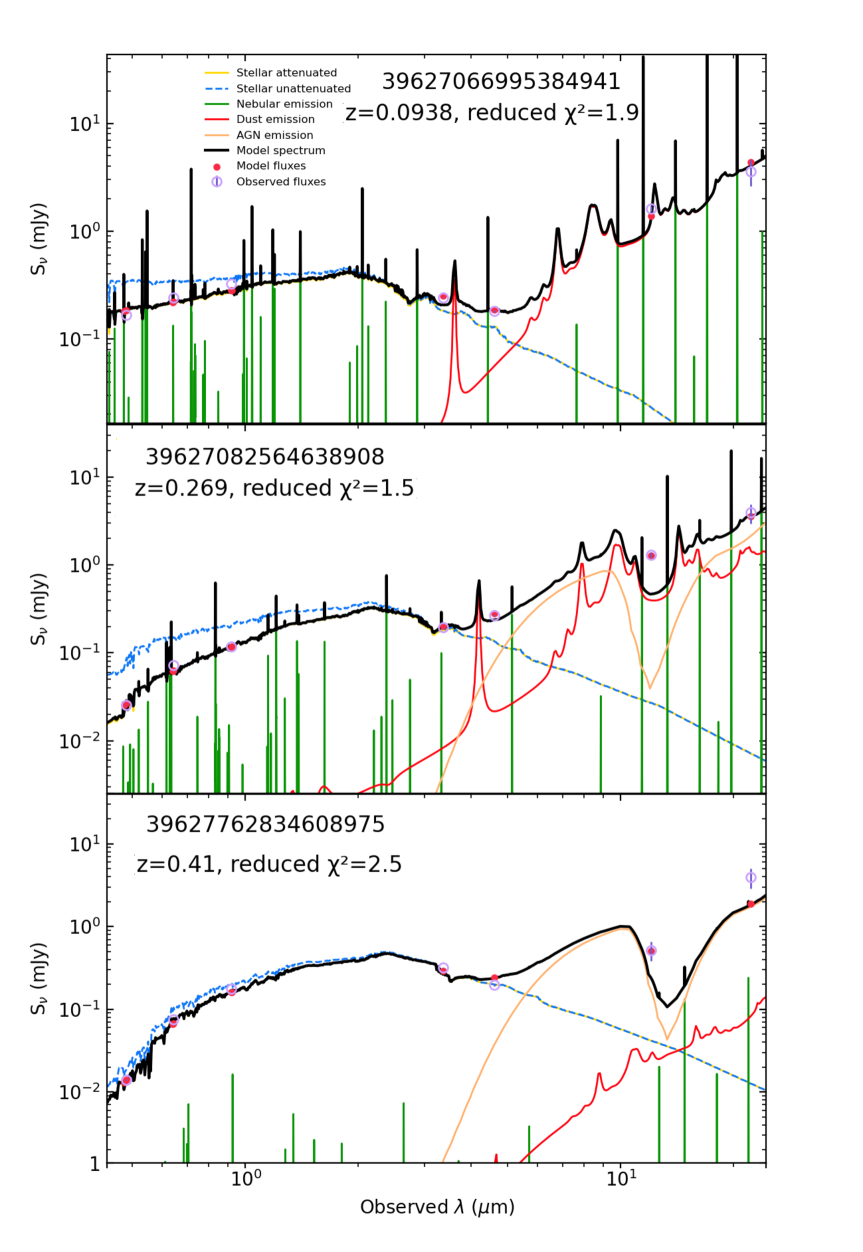
Figure 8 shows the SEDs for representative examples from each category: a typical star-forming galaxy, a WISE/BPT-AGN, and a SED-AGN Only galaxy. The star-forming galaxy exhibits a strong stellar component, with the SED peaking in the optical and NIR regions. The dust emission, indicated by the infrared excess, reflects ongoing star formation. The AGN contribution is negligible, consistent with the expected characteristics of a purely star-forming galaxy. The WISE/BPT-AGN, in contrast, shows significant AGN activity, particularly in the MIR range. The SED reveals a combination of strong stellar emission and enhanced IR output due to AGN-heated dust. This suggests that while the galaxy is actively forming stars, the AGN is also contributing significantly to the overall energy output. The SED-AGN Only galaxy presents a distinct profile, with a relatively weaker stellar component and a dominant AGN contribution in the MIR. The optical part of the SED suggests a lower star formation rate or an older stellar population. The strong MIR excess is primarily driven by the AGN, indicating that these galaxies are likely passive, where AGN activity dominates. These SED comparisons highlight the unique nature of SED-AGN Only galaxies, possibly representing a population of passive galaxies where the AGN is the dominant source of energy.
Appendix C Dependence on model assumptions
When constructing the model grid for the SED fitting (see Sect. 2.2), several assumptions are made regarding the SFH, metallicity, and dust attenuation laws. Here, we test the robustness of AGN identification against changes in these model assumptions using a representative sample of approximately 50 000 galaxies from DESI EDR, covering a broad range of galaxy types (see Appendix D1 in Siudek et al. (2024) for a description of the representative sample).
Table 6 summarizes the efficiency of AGN identification under different model choices relative to the default configuration. We always change only one parameter at a time, keeping all others fixed (e.g., when applying a non-parametric SFH of Ciesla et al. (2023), we retain the IMF from Chabrier (2003) and SSP models from Bruzual & Charlot (2003)). For a full description of our model components, see Sec. 6 in Siudek et al. (2024). We find the following:
- •
-
•
Adopting the Charlot & Fall (2000) dust attenuation model reduces contamination by star-forming galaxies, but also decreases completeness for BPT-AGN and WISE-AGN.
- •
-
•
Allowing metallicity to vary as a free parameter improves both the completeness of AGN selection and reduces contamination.
- •
The choice of model ultimately depends on the scientific goals. Increased contamination from star-forming galaxies is generally undesirable in AGN-focused studies, as it reduces sample purity and can bias physical interpretations. However, any model-driven enhancement or suppression of certain populations should be interpreted cautiously, as it may not reflect the true galaxy demographics. Thus, model selection should reflect the intended use—whether to maximize AGN completeness (e.g., for demographic studies) or to ensure purity (e.g., for SED-based analyses). In the next Section, we further quantify the performance of the AGN identification depending on the model assumptions.
| Category | N | Default | IMF | Dust | Dust | SFH | Z | SSP | AGN |
|---|---|---|---|---|---|---|---|---|---|
| atten. | emission | model | model | ||||||
| % | % | % | % | % | % | % | % | ||
| BL AGN | 1 033 | 78 | 79 | 75 | 75 | 80 | 83 | 81 | 92 |
| BPT-AGN | 1 479 | 65 | 66 | 55 | 65 | 70 | 67 | 75 | 80 |
| BPT-SF | 1 901 | 21 | 22 | 15 | 27 | 24 | 16 | 30 | 27 |
| WISE-AGN | 2 244 | 85 | 86 | 75 | 81 | 89 | 89 | 87 | 97 |
| NII-AGN | 2 215 | 64 | 66 | 53 | 65 | 70 | 66 | 75 | 78 |
| NII-SF | 2 118 | 26 | 26 | 19 | 30 | 29 | 20 | 34 | 32 |
| NII-LINER | 655 | 47 | 47 | 43 | 52 | 48 | 50 | 62 | 56 |
| NII-COMPOSITE | 3 543 | 29 | 30 | 20 | 36 | 33 | 26 | 43 | 40 |
| SII-AGN | 1 473 | 64 | 65 | 55 | 66 | 69 | 67 | 75 | 79 |
| SII-SF | 6 336 | 30 | 31 | 21 | 36 | 34 | 27 | 42 | 40 |
| SII-LINER | 360 | 44 | 44 | 48 | 46 | 45 | 52 | 62 | 54 |
| OI-AGN | 1 700 | 65 | 66 | 56 | 65 | 70 | 68 | 75 | 80 |
| OI-SF | 6 311 | 31 | 31 | 21 | 37 | 34 | 27 | 42 | 40 |
| OI-LINER | 333 | 48 | 48 | 50 | 46 | 48 | 52 | 63 | 57 |
| WHAN-AGN | 6 301 | 40 | 40 | 29 | 45 | 44 | 38 | 52 | 51 |
| WHAN-SF | 2 069 | 34 | 34 | 28 | 35 | 36 | 30 | 41 | 42 |
| WHAN-RG | 876 | 51 | 51 | 50 | 49 | 50 | 53 | 63 | 59 |
| X-RAY-AGN | 440 | 25 | 25 | 19 | 22 | 28 | 23 | 31 | 32 |
| RADIO-AGN | 1 141 | 24 | 25 | 19 | 24 | 27 | 24 | 31 | 32 |
| SED-AGN Only | 4 291 | 8 | 7 | 8 | 6 | 7 | 7 | 6 | 7 |
We additionally note that when WISE W3 and W4 bands are excluded from the SED fitting, the contamination from star-forming galaxies rises significantly, with recovery rates dropping for BPT-AGN, WISE-AGN, and broad-line AGN. In extreme cases where no MIR information is used, virtually all galaxies are classified as AGN (AGNFRAC), illustrating the critical importance of MIR data in controlling contamination.
Appendix D AGN selection using AGNFRAC
We assess the performance of the AGNFRAC parameter, derived from SED fitting, as a tool for AGN classification by performing a ROC analysis for: i) sources with high-quality mid-IR photometry (FLAGINFRARED ), and ii) those with poor or missing WISE coverage (FLAGINFRARED ). A ROC curve is a representation of the true positive rate (TPR) versus the false positive rate (FPR) for different classification thresholds. The TPR and FPR are defined as:
| (1) |
where TP, FP, FN, and TN are the counts of true positives (AGN that is classified as AGN), false positives (non-AGN that is classified as AGN), false negatives (AGN that is not classified as AGN), and true negatives (non-AGN that is not classified as AGN), respectively. A robust classification is achieved when AGN are classified as AGN () rather than AGN as non-AGN ().
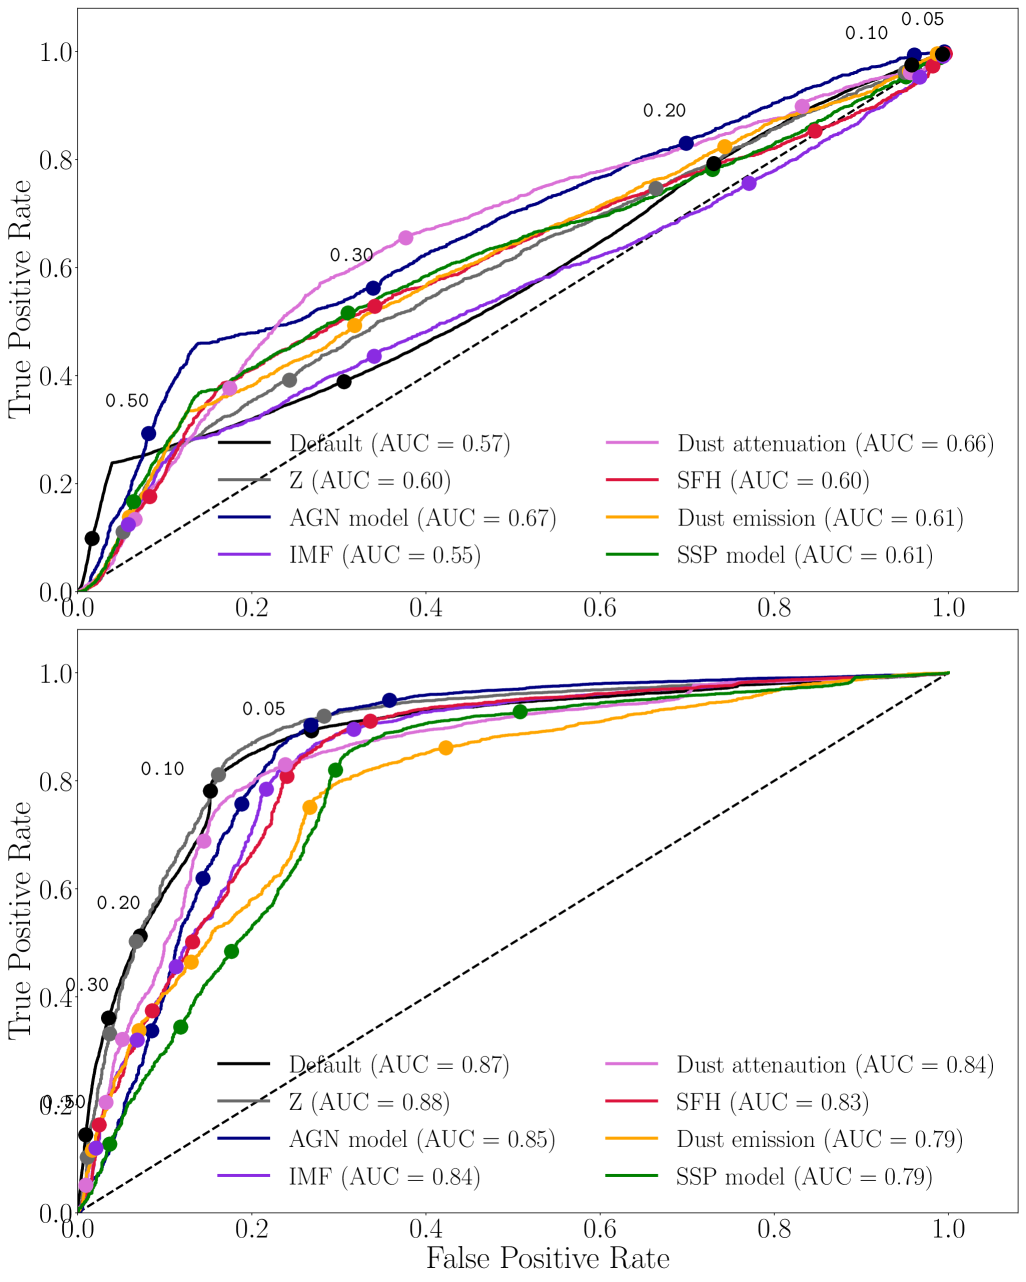
As shown in Fig. 9, the ROC curve for the FLAGINFRARED subset yields a significantly higher area under the curve (101010AUC score represents the probability that the classifier ranks a randomly chosen positive instance higher than a randomly chosen negative one. An AUC of 0.87, for example, indicates an 87% chance of correctly distinguishing between AGN and non-AGN galaxies.), indicating strong separability between AGN and star-forming galaxies using AGNFRAC. In contrast, the ROC for the lower-quality subset (FLAGINFRARED ) results in a much flatter curve with , close to random classification. Annotated thresholds on the ROC curves demonstrate that for FLAGINFRARED , completeness increases sharply with minimal contamination, especially around AGNFRAC values of . In the lower-quality sample, no such threshold yields both high true positive and low false positive rates.