11email: prajwel.pj@gmail.com
Redshift 2.7 is not special
Galikyan et al. (2025) reported a statistically significant change in galaxy spectral properties at redshift 2.7 based on a Kolmogorov analysis of JWST spectroscopic data of galaxies. In this comment, we demonstrate that their result is critically driven by a single outlier in the dataset. This outlier arises from the use of a questionable redshift estimate for one spectrum. When the outlier is removed or the redshift is corrected, the claimed transition at 2.7 disappears entirely. By independently reproducing their analysis, we demonstrate that the claimed feature is not a robust statistical signal, but an artefact of this anomalous data point.
Key Words.:
galaxies: high-redshift1 Introduction
Galikyan et al. (2025) analysed JWST spectroscopic data of galaxies published by Price et al. (2025) to check for changes in the spectral properties of the sample galaxies with redshift. They selected galaxy spectra with redshift () quality flags marked as either “secure” or “solid” in the dataset derived from the Ultradeep NIRSpec and NIRCam ObserVations before the Epoch of Reionization (UNCOVER) Cycle 1 Treasury survey (Bezanson et al., 2024). They imposed an additional selection criterion that the spectral peak be close to 656 nm in the rest frame. From this subset, the authors identified the observed-frame wavelengths () corresponding to the spectral peaks and converted them to the rest frame () using the redshift values estimated by Price et al. (2025). They then grouped the data into small redshift bins and computed the Kolmogorov Stochasticity Parameter (KSP) for the set of rest-frame peak wavelengths within each bin. By examining how the KSP values varied with redshift, Galikyan et al. (2025) reported a statistically significant change in spectral properties at 2.7, claiming a confidence level exceeding 99%.
A sudden transition in galaxy spectral properties at 2.7 is of significant astrophysical interest. Motivated by this claim, we revisited the JWST spectroscopic dataset to investigate the origin of the reported feature. As part of this effort, we reproduced the analysis carried out by Galikyan et al. (2025). In doing so, we found that the reported change in spectral properties at 2.7 arises entirely from the inclusion of a single outlier in their dataset. We detail our findings in the following section.
2 Discussion

Galikyan et al. (2025) do not elaborate on how an analysis based solely on wavelength values captures the overall randomness in galaxy spectra. Even accepting this approach for the sake of argument, we find that their results are significantly influenced by the presence of a single outlier in the dataset.
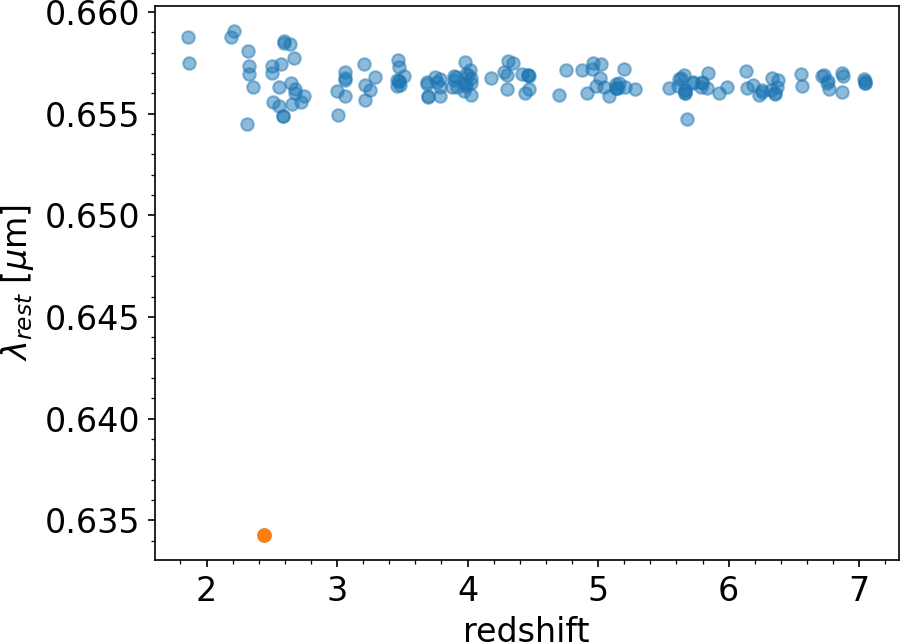
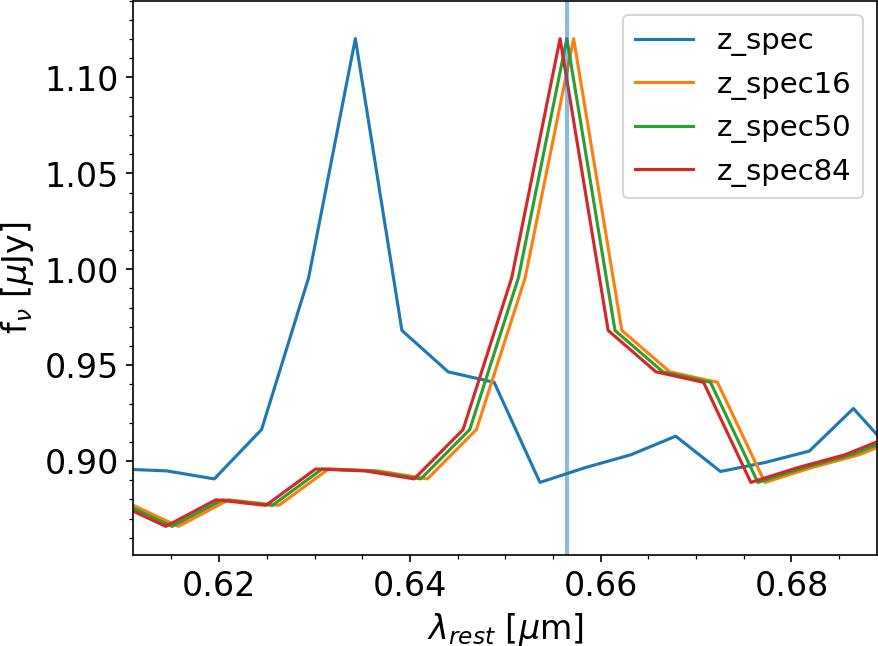
This outlier is visible in Figure 1 of Galikyan et al. (2025) near 0.634 m. We reproduce their figure following their described methodology (see Fig. 1), highlighting the outlier in orange111The Python scripts used in this work can be accessed at https://github.com/prajwel/no_special_redshift.. Upon examining the corresponding data point ( = 2.184 m) in the publicly available dataset from Price et al. (2025), we found that the relevant spectrum has four different redshift estimates: 2.444 (z_spec), 2.324 (z_spec16), 2.328 (z_spec50), and 2.331 (z_spec84). We note that the outlier arises only when using the z_spec value to convert . If any of the alternative redshift estimates are used, the corresponding rest-frame wavelength falls well within the general distribution of the other data points in Fig. 1. This suggests that the z_spec value is likely a misestimate for the corresponding spectrum, and that one of the alternative values—remarkably consistent with one another—should be preferred. Moreover, visual inspection of the spectrum confirms that the observed H emission line lies close to the expected rest-frame wavelength when using any of the alternative redshift estimates (see Fig. 3).
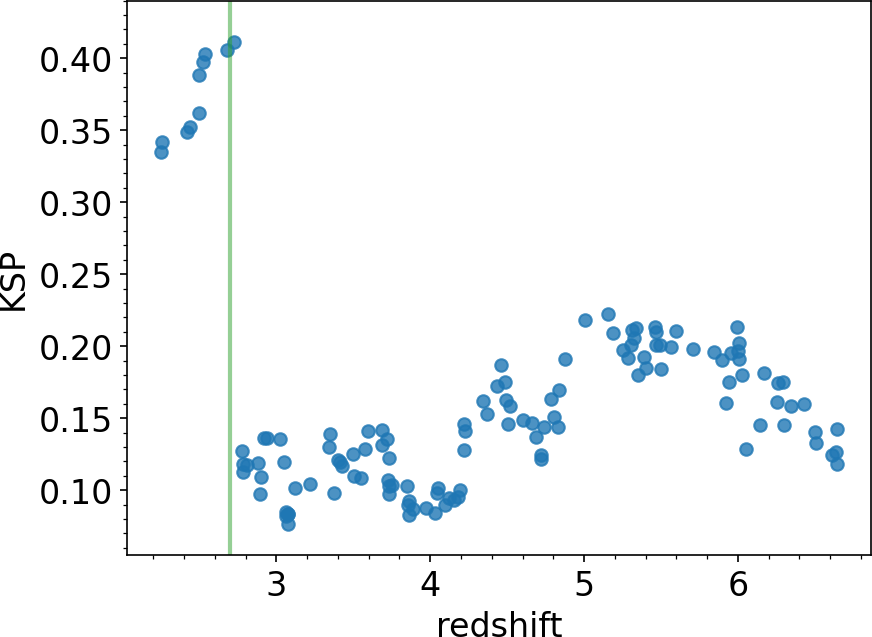
To demonstrate the influence of the outlier on the analysis by Galikyan et al. (2025), we used a sliding window (bin), each containing 20 values sorted by redshift, and computed the KSP for the values in each bin. We adopted the standard normal distribution as the reference theoretical distribution. The resulting plot of KSP versus redshift, based on the same data used by Galikyan et al. (2025), is shown in Fig. 2(a).
The Fig. 2(a) differs from Figure 2 of Galikyan et al. (2025) in two main respects: the number of data points and the spread of KSP values. The difference in the number of points arises because Galikyan et al. (2025) used 1000 randomly generated, overlapping redshift bins of varying sizes, while we used a uniform sliding bin of size 20. The difference in the spread of KSP values stems from their use of a generalised normal distribution with a free sharpness parameter fitted independently in each redshift bin. In contrast, we used a fixed standard normal distribution across all bins. Despite these methodological differences, our Fig. 2(a) successfully reproduces the sharp change in KSP around 2.7 in Figure 2 of Galikyan et al. (2025), along with other observed trends.
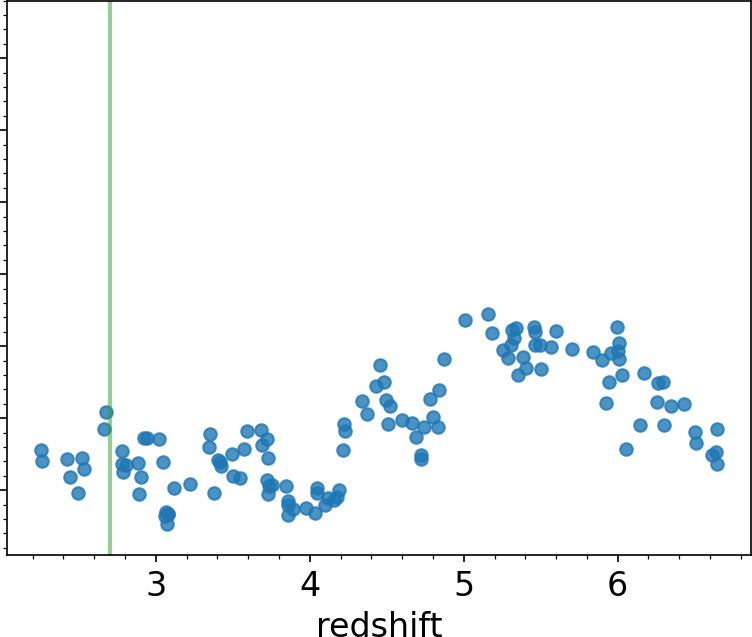
However, when the outlier is excluded from the analysis, this significant jump in KSP disappears entirely (see Fig. 2(b)). The same result holds when the outlier’s redshift is replaced with any of the alternative estimates discussed earlier (see Fig. 2(c)). This demonstrates that the claimed change in KSP is entirely driven by a single inconsistent data point.
3 Summary
Galikyan et al. (2025) analysed JWST spectra from Price et al. (2025), selecting spectra with high-confidence redshift estimates and those with peaks near 656 nm in the rest frame. They examined how the degree of randomness in the rest-frame peak wavelengths varied with redshift, and reported a statistically significant change in spectral properties at 2.7.
We show that their result is critically dependent on a single outlier in their dataset. This outlier, visible in their own Figure 1, arises from the choice of one specific redshift estimate out of several available for a given spectrum. When any of the alternative redshift estimates are used, the corresponding rest-frame wavelength no longer deviates from the overall distribution.
We independently reproduced the KSP versus redshift trend and confirmed that the reported feature at 2.7 can be replicated—but only when the outlier is included. Once excluded or corrected, the jump in KSP disappears. This demonstrates that the claimed transition is not a robust statistical feature, but an artefact of a single inconsistent data point.
Acknowledgements.
This work is based on a talk presented at a journal club meeting at the Indian Institute of Astrophysics. The author is grateful to Koshy George and C. S. Stalin for insightful discussions. Thanks are also due to Norayr Galikyan for responding to queries related to their work. Astropy, IPython, Matplotlib, NumPy, and Scipy were used for data analysis, viewing, and plotting (Astropy Collaboration et al., 2013, 2018, 2022; Hunter, 2007; Harris et al., 2020; Pérez & Granger, 2007; Virtanen et al., 2020).References
- Astropy Collaboration et al. (2022) Astropy Collaboration, Price-Whelan, A. M., Lim, P. L., et al. 2022, ApJ, 935, 167
- Astropy Collaboration et al. (2018) Astropy Collaboration, Price-Whelan, A. M., Sipőcz, B. M., et al. 2018, AJ, 156, 123
- Astropy Collaboration et al. (2013) Astropy Collaboration, Robitaille, T. P., Tollerud, E. J., et al. 2013, A&A, 558, A33
- Bezanson et al. (2024) Bezanson, R., Labbe, I., Whitaker, K. E., et al. 2024, The Astrophysical Journal, 974, 92
- Galikyan et al. (2025) Galikyan, N., Kocharyan, A., & Gurzadyan, V. 2025, Astronomy & Astrophysics, 696, L21
- Harris et al. (2020) Harris, C. R., Millman, K. J., van der Walt, S. J., et al. 2020, Nature, 585, 357
- Hunter (2007) Hunter, J. D. 2007, Computing in Science & Engineering, 9, 90
- Pérez & Granger (2007) Pérez, F. & Granger, B. E. 2007, Computing in Science and Engineering, 9, 21
- Price et al. (2025) Price, S. H., Bezanson, R., Labbe, I., et al. 2025, The Astrophysical Journal, 982, 51
- Virtanen et al. (2020) Virtanen, P., Gommers, R., Oliphant, T. E., et al. 2020, Nature Methods, 17, 261