Identifying hyperons in neutron star matter from the slope of the mass-radius diagram
Abstract
The slope of the neutron star mass radius curve determined from two large sets of relativistic mean field equations of state for nucleonic and hyperonic neutron star matter is discussed. It is shown that if the mass-radius curve always has a negative slope the probability that the star has hyperons is very small. A very small probability of the presence of hyperons can already be identified by a negative slope for low-mass stars. A positive slope at could indicate the possible presence of hyperons. Nucleonic EoS are found to be more probable than hyperonic ones, given the GW170817 and NICER observation constraints for PSR J0030+0451 and PSR J0740+6620, and the highest probability is associated with nucleonic stars that originate a mass radius curve with positive slope. Mass-radius curves with a positive slope greater than 1.8 are not expected to occur. The nuclear matter property that most distinguishes the different scenarios is the curvature of the symmetry energy, with nucleonic EoS with positive slope predicting the highest values that can go above 100 MeV.
I Introduction
Neutron stars (NSs) are among the densest known objects in the Universe, yet their internal composition remains uncertain. A key challenge in nuclear astrophysics is determining the equation of state (EoS) of neutron star dense and isospin asymmetric nuclear matter that governs NS properties like mass, radius, and tidal deformability. It is still unclear whether exotic particles such as hyperons or deconfined quarks appear at supranuclear densities. These additional degrees of freedom could significantly alter the EoS, making their presence or absence a central focus of current research.
Observations of massive NSs have imposed stringent constraints on the EoS, especially at intermediate to high baryonic densities: for PSR J1614-2230 [1, 2, 3], for PSR J0348-0432 [4], for PSR J0740+6620 [5], and for PSR J1810+1714 [6]. The rise of multi-messenger astrophysics, combining gravitational waves (GWs), electromagnetic signals, and neutrino emissions, has significantly enhanced our understanding of NSs. The detection of GW170817 [7] and GW190425 [8] by LIGO/Virgo have provided additional constraints on the high-density EoS. Recent observational advances, particularly from the NICER (Neutron Star Interior Composition Explorer) mission, have led to precise mass and radius inferences, such as for PSR J0030+0451 [9, 10] and PSR J0740+6620 [11, 12, 13]. These efforts are expected to continue with upcoming missions, such as eXTP [14, 15], STROBE-X [16], and the Square Kilometre Array (SKA) [17].
The composition of the neutron star core remains uncertain, especially concerning the potential presence of exotic matter such as deconfined quarks, meson condensates, or strange baryons (hyperons) [18]. Hyperons are theoretically expected to emerge at high baryon densities, driven by the rapid increase in nucleon chemical potential. However, their presence typically softens the EoS, which in turn lowers the maximum mass that neutron stars can attain — often falling below the observational threshold of . This discrepancy with the observed masses of heavy neutron stars has become known as the hyperon puzzle [19, 20, 21, 22, 23, 24]; for a comprehensive review, see [25].
The mass-radius relation of neutron stars encodes the properties of the underlying EoS of neutron star matter. Its slope, , reflects the EoS stiffness: steeper slopes correspond to stiffer EoS. Microscopic and phenomenological models predict distinct behaviors [26], and transitions on this slope may signal the emergence of new degrees of freedom, such as hyperons or deconfined quarks, marking changes in the internal composition of the star. In addition, the onset of a new degree of freedom together with the neutron star two solar mass constraint may cause a stiffening of the EoS below 2-3 times saturation density, even if the new degree of freedom is still not present, to compensate the softening at higher densities. This indicates that the analysis of low-mass stars may give information on the composition of the high mass neutron stars. In other studies, the physical meaning of the slope of the mass-radius curve has also been discussed, see [27, 28, 29].
In this work, we explore the quantity as a diagnostic observable to distinguish between hadronic and hyperonic EoS. Using a family of relativistic mean-field (RMF) models constrained by empirical data and capable of producing NSs with , we study the behavior of across the mass-radius space. Our analysis emphasizes how the emergence of hyperons or changes in the stiffness of the EoS may influence this slope. By systematically comparing the hadronic and hyperonic model sets, we aim to quantify differences in and assess their observational signatures.
The paper is structured as follows: In Section II, we present the nucleonic and hyperonic datasets analyzed in the present work. In Section III we discuss how the value of determined from the solution of the TOV equations affects the thermodynamical properties, astrophysics predictions, and nuclear matter properties for the nucleonic and hyperonic scenario. We access the likelihood of each composition scenario given the present observational data in Section IV Finally, conclusions are drawn in Section V.
II Nucleonic and Hyperonic Neutron Star Matter
We analyze two datasets introduced in [30], both constructed using a relativistic mean field (RMF) model with nonlinear meson interactions. The first dataset describes nuclear matter composed exclusively of nucleons, while the second includes additional degrees of freedom in the form of hyperons—specifically, the neutral hyperon and the negatively charged hyperon.
These datasets consist of posterior samples obtained through a Bayesian inference framework that incorporates empirical constraints from nuclear matter saturation properties, low-density pure neutron matter, and . The nucleonic dataset contains 17,828 EoS, while the hyperonic dataset comprises 18,756 EoS.
We imposed the following astrophysical constraints, all given at the 95% confidence level:
i) For the pulsar PSR J0740+6620, we adopted the radius intervals
from [31] and
from [32].
ii) For PSR J0030+0451, we used
from [33] and
from [34].
To incorporate the PSR J0740+6620 constraints into our analysis, we required that
.
This condition is less restrictive than , and accounts for the uncertainty in the mass measurement of PSR J0740+6620.
Additionally, we imposed a tidal deformability constraint of , following the results from [7]. After applying these constraints, the number of EoS was reduced to 17,537 for the nucleonic set and
16,146 for the for the hyperonic one.
For each EoS, we calculated the slope along the Tolman–Oppenheimer–Volkoff (TOV) sequence in the mass range from up to the maximum supported mass . This slope reflects how small variations in the radius of a neutron star affect its mass.
Based on this criterion, we found that out of 17,537 nucleonic EoS, 11,495 exhibit , while the remaining 6,042 do not (i.e., ).
In the hyperonic case, among 16,146 EoS, only 77 satisfy , whereas 16,069 fail to meet this condition (i.e., ). The nucleonic and hyperonic EoS display distinct behavior in terms of the mass dependence of : the majority of nucleonic EoS fulfill the condition, in contrast to the hyperonic EoS, where only a small fraction satisfies it.
In the following, we compare both nucleonic/hyperonic sets and analyze the impact of or on the stars’ properties and thermodynamics of neutron star matter.
III Results
In the present section we discuss the properties of the sets of nucleonic and hyperonic NS characterized by a negative or positive slope along the whole curve or at given NS masses.
III.1 General behavior of
The relation for the nucleons and hyperons datasets, filtered by the condition and , is shown in Fig. 1.
From the general structure, the main difference is the set predicting larger radii for stars and the prediction of larger maximum masses well above . There are no differences on the low radius side with both sets giving similar predictions.
We now compare the and cases. We find that the hyperonic case has a much smaller range of possible radii, corresponding to one third and one half, respectively, of the nucleonic case and almost coinciding at the largest limit, a smaller maximum mass of about 0.3 and , respectively, and a slightly larger radius for stars.
Table 1 presents some of the neutron star (NS) properties of the two sets at the 95% credible interval (CI), reflecting the information obtained from Fig. 1. By comparing the radius predicted by the hyperon and nucleon sets for 1.4 stars, we see that the hyperonic EoS do not predict radii below km, and that all radii for are within a boundary interval of m. The set with a positive slope predicts a radius 150–300 m smaller. For nucleonic stars, this radius varies between 12 and 13 km; larger radii occur for curves with a positive slope. The hyperonic maximum mass is about with a radius between 11.6 and 12 km. The two scenarios, positive and negative slope, give similar results. For the nucleonic set with , maximum masses of up to (at 95% CI) are possible, with radii ranging from 10.6 km to below 12 km. stars have radii of km. A positive slope allows for maximum nucleonic star masses larger at 95% CI and radii up to 500 m larger.
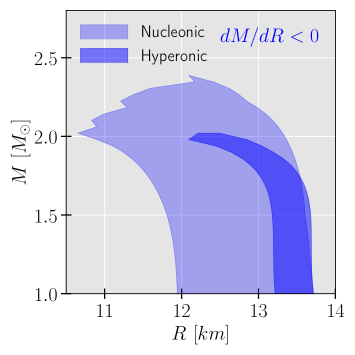
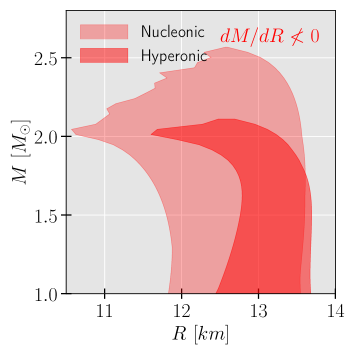
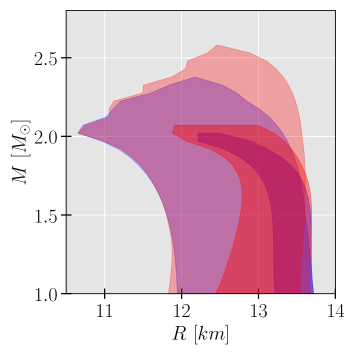
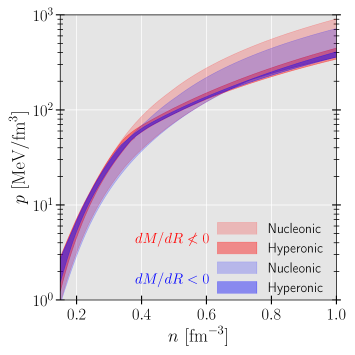
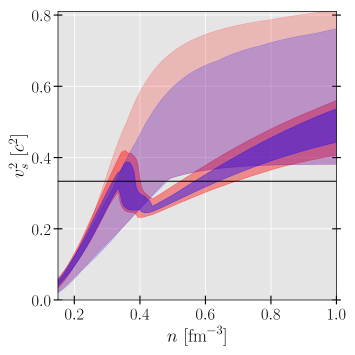
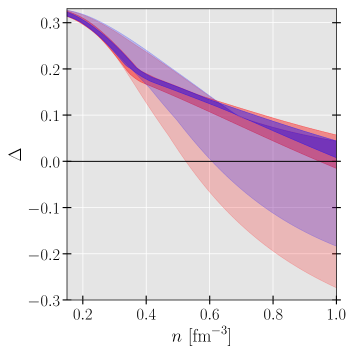
Figure 2 displays the pressure , the squared sound speed and the renormalized trace anomaly , where is the energy density. The trace anomaly is a key measure for studying conformality restoration in neutron star matter [35]. For nucleonic EoS, the lower limit of is the same for both sets ( and ), since this defines the condition of a maximum mass of at least two solar masses. This also sets the lower limit for and the highest positive values of , this last quantity remaining positive throughout the entire density range. When comparing hyperonic and nucleonic EoS, the hyperonic EoS tracks the upper boundary of the nucleonic EoS at densities below 2 and the lower boundary above 4. The hyperonic set lies within the set . Below 2, the aligns with the upper limit of the nucleonic set, a condition necessary to compensate for the softening occurring above 2. At 2, decreases due to the appearance of hyperons, then increases, approaching the nucleonic lower limit at a density of 1 fm-3. At this density, the trace anomaly remains positive for the hyperonic set .
| Nucleonic | Hyperonic | ||||||||||||||
| 5% | 50% | 95% | 5% | 50% | 95% | 5% | 50% | 95% | 5% | 50% | 95% | ||||
| [] | 2.01 | 2.05 | 2.17 | 2.01 | 2.11 | 2.35 | 2.00 | 2.01 | 2.04 | 2.00 | 2.02 | 2.07 | |||
| [km] | 10.52 | 10.84 | 11.39 | 10.62 | 11.16 | 11.92 | 11.59 | 11.8 | 12.0 | 11.54 | 11.79 | 12.04 | |||
| 6.05 | 6.67 | 7.05 | 5.39 | 6.25 | 6.88 | 5.66 | 5.89 | 6.07 | 5.53 | 5.80 | 6.06 | ||||
| [] | 0.46 | 0.58 | 0.68 | 0.43 | 0.56 | 0.69 | 0.44 | 0.47 | 0.52 | 0.42 | 0.47 | 0.51 | |||
| [MeV/fm3] | 414.79 | 529.26 | 606.02 | 367.49 | 484.84 | 578.08 | 306.13 | 337.57 | 372.42 | 290.44 | 329.06 | 364.11 | |||
| -0.100 | -0.056 | 0.000 | -0.115 | -0.050 | 0.017 | 0.022 | 0.040 | 0.057 | 0.024 | 0.041 | 0.063 | ||||
| [km] | 12.09 | 12.40 | 12.87 | 12.10 | 12.56 | 13.15 | 13.26 | 13.39 | 13.55 | 12.96 | 13.19 | 13.43 | |||
| 344 | 406 | 513 | 376 | 476 | 632 | 592 | 640 | 683 | 593 | 650 | 709 | ||||
| [km] | 10.86 | 11.45 | 12.27 | 11.08 | 11.97 | 12.96 | 11.83 | 12.15 | 12.66 | 11.84 | 12.33 | 12.85 | |||
III.2 Behavior of at specific masses
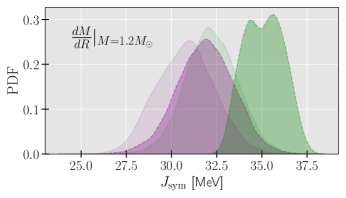
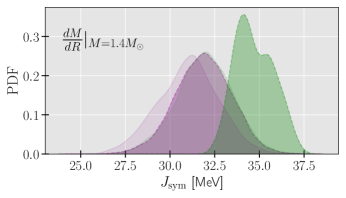
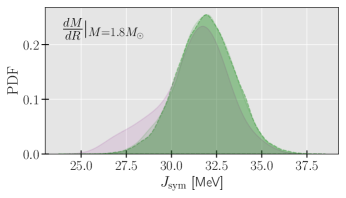
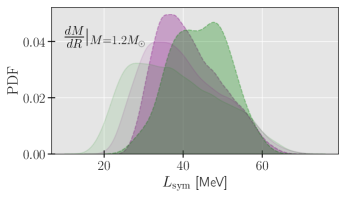
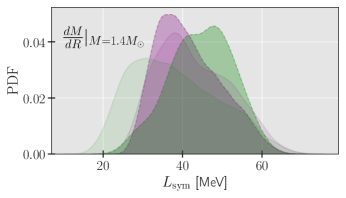
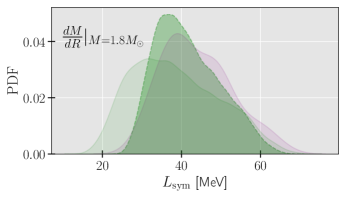
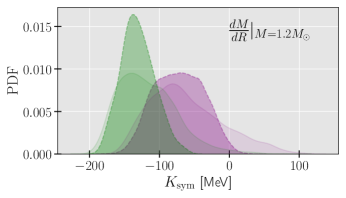
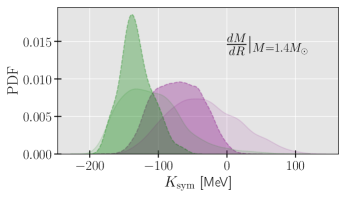
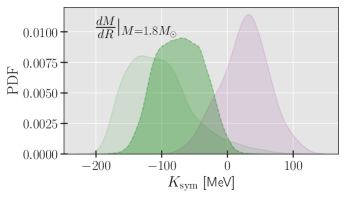
We are interested in understanding whether an observational estimate of the derivative at specific neutron star (NS) masses could be used to constrain nuclear matter properties, with particular emphasis on isovector properties. We consider both nucleonic and hyperonic matter scenarios. Given that accurately measuring the value of is observationally challenging, we focus primarily on determining its sign (whether it is positive or negative). The probability density functions (PDFs) of at and for the three isovector properties, , , and , are shown in Fig. 3. We indicate the number of EoS in each set in Table 2. Note that the number of hyperonic EoS with negative slope is very small for and zero for . This allows us to conclude that if a negative slope is measured for a low mass star there is a high probability that it is a nucleonic star. On the other hand, about one fourth of the nucleonic stars with may have a positive slope. This fraction decreases to less than 0.1 for nucleonic stars with . A positive slope at is not conclusive but at could indicate the possible presence of hyperons.
| 1.2 | 1.4 | 1.8 | ||||
|---|---|---|---|---|---|---|
| - | + | - | + | - | + | |
| hyperonic | 95 | 16,501 | 193 | 15,953 | 16,146 | 0 |
| nucleonic | 13,025 | 4,511 | 16,023 | 1,514 | 17,537 | 47 |
A negative value of (green) at low and moderate NS masses constrains the symmetry energy (), with the hyperonic set (dashed line) showing larger values of about 3-4 MeV than the nucleonic set (solid line). For (purple), the distribution remains quite similar throughout the mass range, the hyperonic case showing higher values, but with differences below 1 MeV, for the two smaller masses. Regarding the slope of the symmetry energy () for (green), the distributions differ between scenarios: the nucleonic case peaks at significantly lower values ( MeV), while the hyperonic case peaks at higher values ( MeV). Note, however, that the hyperonic sets with negative slope have a very small number of EoS.
Finally, the curvature of the symmetry energy () at shows a clear separation depending on the sign of . Although it remains difficult to distinguish between nucleonic and hyperonic scenarios, a negative (green) would suggest much lower values compared to a positive (purple). The nucleonic cases allow for a wider distribution for , in particular for the largest mass considered and , this property peaks at positive values, unlike all other cases, and allows values above 100 MeV, however, this is a set with only 47 EoS. We may conclude that small values of , in particular, below MeV are associated with a higher probability with stars.
IV Scenarios Likelihood
To quantitatively assess the agreement between each EoS and observational data, we compute likelihoods based on pulsar and gravitational wave measurements. We evaluate the likelihood of each equation of state (EoS) using observational data from NICER and LIGO–Virgo, assessing the consistency of each EoS with the available measurements. Specifically, we consider pulsar observations of PSR J0030+0451 and PSR J0740+6620, as well as the gravitational wave event GW170817. Herein, we are interested in determining the likelihood of each scenario and will not apply astrophysical cut-off constraints as we did in last sections, i.e., the radii inequality conditions for PSR J0740+6620, PSR J0030+0451, and from GW170817 event. Instead, we are going to use the full dataset of [30], i.e. 17,828 nucleonic EoS and 18,756 hyperonic EoS, which is only limited by the properties of nuclear matter and . The nucleonic set is composed of 11,707 EoS that satisfy and 6,121 obeying , while the hyperonic set consists of 79 EoS with and 18,677 EoS which .
For a neutron star binary with component masses and and corresponding tidal deformabilities and , the likelihood of a gravitational wave (GW) event given an EoS is
| (1) |
where denotes the probability of the GW data given the masses and tidal deformabilities, and represents the prior on the component masses. We adopt a uniform prior,
| (2) |
where and , the maximum mass supported by the EoS.
The NICER X-ray data for each pulsar is provided as posterior samples in the mass–radius plane. The likelihood associated with the NICER observations is
| (3) | ||||
where denotes the probability of the observed data given the mass and radius .
We compute using kernel density estimation methods applied to the mass–radius posterior distributions of PSR J0030+0451 and PSR J0740+6620. Assuming the NICER and GW datasets are independent, the total likelihood is given by the product
| (4) |
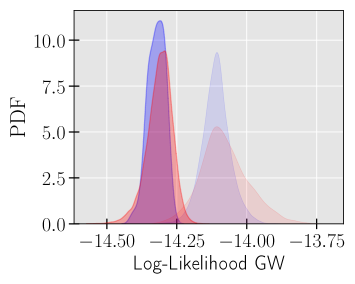
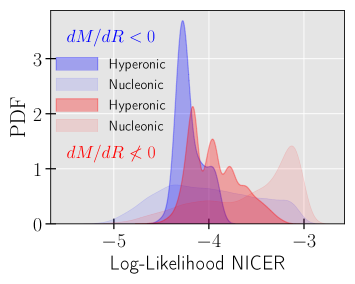
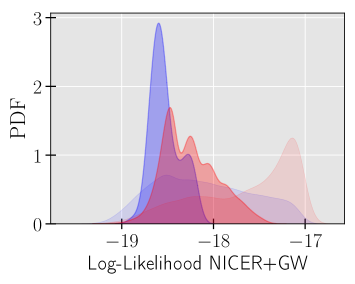
The individual and total log-likelihoods are shown in Fig. 4.
We find that the GW170817 event is better explained within the nucleonic scenario (left panel), the corresponding EoS is more consistent with the observed data as indicated by the higher likelihood. Additionally, we observe that the nucleonic distribution becomes slightly broader in the case of a non-zero derivative of the mass-radius relation (red), corresponding to the presence of back-bending in the relation. We expect a lower value of for the hyperonic scenario, since it predicts systematically larger value of compared to the nucleonic case. This leads to a lower agreement with the GW170817 constraints. The individual log-likelihoods for the NICER observations show a much wider spread of PDFs for the nucleonic EoS. This is also to be expected given that the spread of the mass-radius distributions shown in Fig. 1 are much wider for the nucleonic EoS and contain the hyperonic ones.
The information in Fig. 4 is supplemented by the Bayes factors presented in Table 3 for each composition (nucleonic or hyperonic) and hypothesis regarding the slope behavior . The Bayes factor is the ratio of evidences for hypotheses and , where represents the posterior predictive probability of additional observational data (comprising and ) given the posterior samples from [30], which were constrained by the data (nuclear matter properties, pure neutron matter, EFT calculations, and constraint – see [30] for details). quantifies how well each hypothesis, informed by the posterior distribution from , predicts the GW and NICER observations. It is defined as:
| (5) |
where is the likelihood of the additional data given parameters under , and is the posterior distribution from the initial data . To compute this, we use a Monte Carlo approximation, averaging the likelihoods over posterior samples :
| (6) |
where combines the likelihoods of GW and NICER data, assuming their independence given . A Bayes factor indicates that is more compatible with than , while favors . These Bayes factors are critical for model comparison, providing a quantitative measure to assess which hypothesis best explains the observed GW and X-ray data, thus guiding conclusions about competing astrophysical models, such as neutron star EoS. In summary, the Bayes factors suggest that the astrophysical constraints favor: i) nucleonic matter with over (); ii) nucleonic matter, regardless of the slope, over hyperonic matter (, for and ).
| Nucleonic | Nucleonic | Hyperonic | Hyperonic | |
|---|---|---|---|---|
| 1 | 0.643 | 1.722 | 1.270 | |
| - | 1 | 2.680 | 1.976 | |
| - | - | 1 | 0.737 | |
| - | - | - | 1 |
V Conclusions
In the present study we have analyzed the possible information that the derivative of the mass radius curve may give concerning the composition of the neutron star and its EoS properties. We have considered two sets of about 17k-18k EoS obtained within a Bayesian inference calculation to determine the couplings of a relativistic mean field description of nucleonic and hyperonic matter [36]. The RMF model considered has been discussed in [37, 38, 39], and includes nonlinear mesonic terms, both self-interacting and mixed terms. The nuclear matter properties of the two sets are summarized in Table 4.
The two sets were divided into two subsets each, defined by the slope of the complete mass-radius curve, from the 1 mass to the maximum mass, filtered by conditions and . Whereas in the nucleonic set about one third satisfied , this property was satisfied by less than 100 hyperonic EoS.
The main conclusions are summarized as follows: i) a negative slope along the entire mass-radius curve indicates a large probability of the absence of hyperons. This conclusion can already be drawn if the slope is negative for low mass stars, with a mass below 1.2 or even 1.4. While a positive slope for low-mass stars does not necessarily indicate the presence of hyperons, it is not expected that the mass-radius curve will still have a positive slope at 1.8; ii) larger maximum masses are obtained for nucleonic models with , the maximum mass obtained being larger at 95%CI; iii) in the average nucleonic EoS with predict slightly larger radius for 1.4 stars, about 150 m, although differences of 300 m are possible. Similarly, the tidal deformability appears to be larger for these stars; iv) the mass-radius curves of nucleonic stars with correspond to EoS with lower maximum values of pressure, sound speed, and trace anomaly.
We have also studied the nuclear matter properties of stars with a positive or negative slope at masses 1.2, 1.4, and 1.8. The few hyperonic EoS with for 1.2 and 1.4 stars must have a rather high symmetry energy at saturation, about 3-4 MeV higher than all other scenarios, nucleonic with or or hyperonic with . For 1.2 and 1.4 stars with a positive slope in their mass-radius curves, there is little difference between the nuclear matter parameters of nucleonic and hyperonic stars. The property that most distinguishes the nucleonic scenarios with positive slope is the curvature of the symmetry energy, which can take positive values above 100 MeV. For the few 1.8 nucleonic stars with a positive slope of the mass-radius curve, the median of the curvature of the symmetry energy takes positive values around 50 MeV.
The likelihood distributions and respective Bayes factors suggest that nucleonic EoS are more probable than the hyperonic ones, given the GW170817 and NICER observation constraints for PSR J0030+0451 and PSR J0740+6620. From the two nucleonic sets of EoS, the one with has the highest probability. These conclusions are in line with the ones drawn in [40], where using a neural network classification model for detecting the presence of hyperonic degrees of freedom, the authors have found from a set of observational data that the presence of hyperons inside NSs was not favored. In [41] the authors also analyse whether measurements of properties neutron star mass and radius could identify the presence of hyperons inside neutrons stars. While current observations do not distinguish between the two scenarios, it was shown using simulated data that it would be possible to identify the presence of hyperons.
the hyperonic model over the nucleonic model The present study has demonstrated the potential power of analysing the slope of mass-radius curves. We expect that, with tighter constraints, more conclusive compositional information can be obtained in the future. The onset of other non-nucleonic degrees of freedom, such as delta-baryons or kaon condensates, could have effects similar to those of the onset of hyperons. Information on the mass-radius slope may also help the interpretation of results obtained using agnostic descriptions. Interestingly, of the six ’golden’ agnostic EoS chosen from the 68% CI in [42] three of them have a positive slope at 1.8, which seems to indicate matter with properties different from the present study. However, the choice in [42] also reflects the lower probability that a mass radius curve has negative slope in its full range as obtained in our study.
ACKNOWLEDGMENTS
We thank Tuhin Malik for kindly providing the codes used to calculate the likelihood values. This work was partially supported by national funds from FCT (Fundação para a Ciência e a Tecnologia, I.P, Portugal) under the projects 2022.06460.PTDC with the DOI identifier 10.54499/2022.06460.PTDC, and UIDB/04564/2020 and UIDP/04564/2020, with DOI identifiers 10.54499/UIDB/04564/2020 and 10.54499/UIDP/04564/2020, respectively.
Appendix A Datasets statistical summary
Table 1 shows some statistics regarding the nuclear matter parameters of each composition scenario (nucleonic/hyperonic) and behavior ( or ).
| Nucleonic | Hyperonic | ||||||||||||||
| 5% | 50% | 95% | 5% | 50% | 95% | 5% | 50% | 95% | 5% | 50% | 95% | ||||
| -16.41 | -16.09 | -15.76 | -16.46 | -16.11 | -15.77 | -16.32 | -16.01 | -15.63 | -16.41 | -16.09 | -15.77 | ||||
| 217 | 252 | 289 | 205 | 260 | 307 | 262 | 289 | 335 | 269 | 293 | 337 | ||||
| -523 | -452 | -349 | -502 | -399 | -123 | -281 | -168 | -43 | -251 | -132 | 44 | ||||
| 490 | 1925 | 4056 | -104 | 2015 | 6858 | -991 | 1869 | 2861 | -313 | 2133 | 3023 | ||||
| 30.3 | 32.4 | 34.6 | 28.3 | 30.8 | 33.3 | 33.4 | 35.1 | 36.7 | 29.3 | 31.9 | 34.4 | ||||
| 21.9 | 37.0 | 57.7 | 25.3 | 37.9 | 58.1 | 35.3 | 45.4 | 56.2 | 30.4 | 40.5 | 56.5 | ||||
| -175 | -124 | -43 | -141 | -79 | 28 | -170 | -134 | -96 | -127 | -72 | -16 | ||||
| 685 | 1450 | 1738 | 507 | 1262 | 1524 | 1146 | 1570 | 1848 | 934 | 1332 | 1614 | ||||
| -19477 | -12181 | -197 | -17989 | -13138 | -1339 | -19113 | -11414 | -4020 | -19062 | -13797 | -3871 | ||||
References
- Demorest et al. [2010] P. Demorest, T. Pennucci, S. Ransom, M. Roberts, and J. Hessels, Nature 467, 1081 (2010).
- Fonseca et al. [2016] E. Fonseca et al., Astrophys. J. 832, 167 (2016), arXiv:1603.00545 [astro-ph.HE] .
- Arzoumanian et al. [2018] Z. Arzoumanian et al. (NANOGrav), Astrophys. J. Suppl. 235, 37 (2018), arXiv:1801.01837 [astro-ph.HE] .
- Antoniadis et al. [2013] J. Antoniadis, P. C. C. Freire, N. Wex, T. M. Tauris, R. S. Lynch, M. H. van Kerkwijk, M. Kramer, C. Bassa, V. S. Dhillon, T. Driebe, J. W. T. Hessels, V. M. Kaspi, V. I. Kondratiev, N. Langer, T. R. Marsh, M. A. McLaughlin, T. T. Pennucci, S. M. Ransom, I. H. Stairs, J. van Leeuwen, J. P. W. Verbiest, and D. G. Whelan, Science 340, 448 (2013).
- Fonseca et al. [2021] E. Fonseca et al., Astrophys. J. Lett. 915, L12 (2021), arXiv:2104.00880 [astro-ph.HE] .
- Romani et al. [2021] R. W. Romani, D. Kandel, A. V. Filippenko, T. G. Brink, and W. Zheng, Astrophys. J. Lett. 908, L46 (2021), arXiv:2101.09822 [astro-ph.HE] .
- Abbott et al. [2019] B. P. Abbott et al. (LIGO Scientific, Virgo), Phys. Rev. X9, 011001 (2019), arXiv:1805.11579 [gr-qc] .
- Abbott et al. [2020] R. Abbott et al. (LIGO Scientific, Virgo), Astrophys. J. Lett. 896, L44 (2020), arXiv:2006.12611 [astro-ph.HE] .
- Riley et al. [2019a] T. E. Riley, A. L. Watts, S. Bogdanov, P. S. Ray, R. M. Ludlam, S. Guillot, Z. Arzoumanian, C. L. Baker, A. V. Bilous, D. Chakrabarty, K. C. Gendreau, A. K. Harding, W. C. G. Ho, J. M. Lattimer, S. M. Morsink, and T. E. Strohmayer, The Astrophysical Journal 887, L21 (2019a).
- Miller et al. [2019a] M. C. Miller, F. K. Lamb, A. J. Dittmann, S. Bogdanov, Z. Arzoumanian, K. C. Gendreau, S. Guillot, A. K. Harding, W. C. G. Ho, J. M. Lattimer, R. M. Ludlam, S. Mahmoodifar, S. M. Morsink, P. S. Ray, T. E. Strohmayer, K. S. Wood, T. Enoto, R. Foster, T. Okajima, G. Prigozhin, and Y. Soong, The Astrophysical Journal 887, L24 (2019a).
- Riley et al. [2021a] T. E. Riley, A. L. Watts, P. S. Ray, S. Bogdanov, S. Guillot, S. M. Morsink, A. V. Bilous, Z. Arzoumanian, D. Choudhury, J. S. Deneva, et al., The Astrophysical Journal Letters 918, L27 (2021a).
- Miller et al. [2021a] M. C. Miller, F. Lamb, A. Dittmann, S. Bogdanov, Z. Arzoumanian, K. Gendreau, S. Guillot, W. Ho, J. Lattimer, M. Loewenstein, et al., The Astrophysical Journal Letters 918, L28 (2021a).
- Raaijmakers et al. [2021] G. Raaijmakers, S. Greif, K. Hebeler, T. Hinderer, a. Nissanke, A. Schwenk, T. Riley, A. Watts, J. Lattimer, and W. Ho, The Astrophysical Journal Letters 918, L29 (2021).
- Watts et al. [2019] A. L. Watts, W. Yu, J. Poutanen, S. Zhang, S. Bhattacharyya, S. Bogdanov, L. Ji, A. Patruno, T. E. Riley, P. Bakala, A. Baykal, F. Bernardini, I. Bombaci, E. Brown, Y. Cavecchi, D. Chakrabarty, J. Chenevez, N. Degenaar, M. Del Santo, T. Di Salvo, V. Doroshenko, M. Falanga, R. D. Ferdman, M. Feroci, A. F. Gambino, M. Ge, S. K. Greif, S. Guillot, C. Gungor, D. H. Hartmann, K. Hebeler, A. Heger, J. Homan, R. Iaria, J. i. Zand, O. Kargaltsev, A. Kurkela, X. Lai, A. Li, X. Li, Z. Li, M. Linares, F. Lu, S. Mahmoodifar, M. Méndez, M. Coleman Miller, S. Morsink, J. Nättilä, A. Possenti, C. Prescod-Weinstein, J. Qu, A. Riggio, T. Salmi, A. Sanna, A. Santangelo, H. Schatz, A. Schwenk, L. Song, E. Šrámková, B. Stappers, H. Stiele, T. Strohmayer, I. Tews, L. Tolos, G. Török, D. Tsang, M. Urbanec, A. Vacchi, R. Xu, Y. Xu, S. Zane, G. Zhang, S. Zhang, W. Zhang, S. Zheng, and X. Zhou, Science China Physics, Mechanics, and Astronomy 62, 29503 (2019), arXiv:1812.04021 [astro-ph.HE] .
- Zhang et al. [2019] S.-N. Zhang et al. (eXTP), Sci. China Phys. Mech. Astron. 62, 29502 (2019), arXiv:1812.04020 [astro-ph.IM] .
- Ray et al. [2019] P. S. Ray et al. (STROBE-X Science Working Group), arXiv e-prints (2019), arXiv:1903.03035 [astro-ph.IM] .
- Watts et al. [2015] A. Watts et al., Proceedings, Advancing Astrophysics with the Square Kilometre Array (AASKA14): Giardini Naxos, Italy, June 9-13, 2014, PoS AASKA14, 043 (2015), arXiv:1501.00042 [astro-ph.SR] .
- Glendenning [2012] N. Glendenning, Compact Stars: Nuclear Physics, Particle Physics and General Relativity, Astronomy and Astrophysics Library (Springer New York, 2012).
- Baldo et al. [2000] M. Baldo, G. F. Burgio, and H. J. Schulze, Phys. Rev. C 61, 055801 (2000), arXiv:nucl-th/9912066 .
- Vidana et al. [2011] I. Vidana, D. Logoteta, C. Providencia, A. Polls, and I. Bombaci, EPL 94, 11002 (2011), arXiv:1006.5660 [nucl-th] .
- Bednarek et al. [2012] I. Bednarek, P. Haensel, J. L. Zdunik, M. Bejger, and R. Manka, Astron. Astrophys. 543, A157 (2012), arXiv:1111.6942 [astro-ph.SR] .
- Weissenborn et al. [2012] S. Weissenborn, D. Chatterjee, and J. Schaffner-Bielich, Phys. Rev. C 85, 065802 (2012), [Erratum: Phys.Rev.C 90, 019904 (2014)], arXiv:1112.0234 [astro-ph.HE] .
- Providencia and Rabhi [2013] C. Providencia and A. Rabhi, Phys. Rev. C 87, 055801 (2013), arXiv:1212.5911 [nucl-th] .
- Lopes and Menezes [2014] L. L. Lopes and D. P. Menezes, Phys. Rev. C 89, 025805 (2014), arXiv:1309.4173 [nucl-th] .
- Chatterjee and Vidaña [2016] D. Chatterjee and I. Vidaña, Eur. Phys. J. A 52, 29 (2016), arXiv:1510.06306 [nucl-th] .
- Ferreira and Providência [2024] M. Ferreira and C. Providência, Phys. Rev. D 110, 063018 (2024), arXiv:2406.12582 [nucl-th] .
- Li et al. [2024] B.-A. Li, X. Grundler, W.-J. Xie, and N.-B. Zhang, Phys. Rev. D 110, 103040 (2024), arXiv:2407.07823 [astro-ph.HE] .
- Ayriyan et al. [2025] A. Ayriyan, D. Blaschke, J. P. Carlomagno, G. A. Contrera, and A. G. Grunfeld, Universe 11, 141 (2025), arXiv:2501.00115 [nucl-th] .
- Cai and Li [2025] B.-J. Cai and B.-A. Li, Eur. Phys. J. A 61, 55 (2025), arXiv:2501.18676 [astro-ph.HE] .
- Malik et al. [2023] T. Malik, M. Ferreira, M. B. Albino, and C. Providência, Phys. Rev. D 107, 103018 (2023), arXiv:2301.08169 [nucl-th] .
- Riley et al. [2021b] T. E. Riley et al., Astrophys. J. Lett. 918, L27 (2021b), arXiv:2105.06980 [astro-ph.HE] .
- Miller et al. [2021b] M. C. Miller et al., Astrophys. J. Lett. 918, L28 (2021b), arXiv:2105.06979 [astro-ph.HE] .
- Miller et al. [2019b] M. C. Miller et al., Astrophys. J. Lett. 887, L24 (2019b), arXiv:1912.05705 [astro-ph.HE] .
- Riley et al. [2019b] T. E. Riley et al., Astrophys. J. Lett. 887, L21 (2019b), arXiv:1912.05702 [astro-ph.HE] .
- Fujimoto et al. [2022] Y. Fujimoto, K. Fukushima, L. D. McLerran, and M. Praszalowicz, Phys. Rev. Lett. 129, 252702 (2022), arXiv:2207.06753 [nucl-th] .
- Malik et al. [2022] T. Malik, M. Ferreira, B. K. Agrawal, and C. Providência, Astrophys. J. 930, 17 (2022), arXiv:2201.12552 [nucl-th] .
- Mueller and Serot [1996] H. Mueller and B. D. Serot, Nucl. Phys. A 606, 508 (1996), arXiv:nucl-th/9603037 .
- Horowitz and Piekarewicz [2001] C. J. Horowitz and J. Piekarewicz, Phys. Rev. Lett. 86, 5647 (2001), arXiv:astro-ph/0010227 .
- Todd-Rutel and Piekarewicz [2005] B. G. Todd-Rutel and J. Piekarewicz, Phys. Rev. Lett. 95, 122501 (2005), arXiv:nucl-th/0504034 .
- Carvalho et al. [2024] V. Carvalho, M. Ferreira, and C. Providência, Phys. Rev. D 110, 123016 (2024), arXiv:2409.12684 [nucl-th] .
- Huang et al. [2025] C. Huang, L. Tolos, C. Providência, and A. Watts, Mon. Not. Roy. Astron. Soc. 536, 3262 (2025), arXiv:2410.14572 [astro-ph.HE] .
- Ecker et al. [2025] C. Ecker, T. Gorda, A. Kurkela, and L. Rezzolla, Nature Commun. 16, 1320 (2025), arXiv:2403.03246 [astro-ph.HE] .