Kai Böse
kai.boese@mpi-hd.mpg.de
\correspondance
Operation of a dual-phase xenon detector with wavelength sensitivity from ultraviolet to infrared
Abstract
1
Xenon, in both its gaseous and liquid phase, offers excellent scintillation and ionization properties, making it an ideal target medium for rare event searches. We report on measurements performed with a dual-phase xenon time projection chamber sensitive to wavelengths from 170 nm to 1700 nm. In addition to the well-established ultraviolet (UV) scintillation, we observe coincident signals in a photomultiplier tube sensitive to infrared (IR) light, associated with both prompt scintillation in the liquid and electroluminescence in the gas. We study the time response of the IR signals and their dependence on the applied amplification field in the gas. Our findings support the observation of IR emission from electroluminescence and reveal a time response distinct from that previously reported for -particles in gas. The results suggest that IR scintillation could provide enhanced signal identification and background rejection in future xenon-based detectors.
2 Keywords:
liquid xenon, scintillation, infrared radiation, dark matter, noble gas detectors, time projection chamber
3 Introduction
Xenon is widely used as a detector medium in various rare event searches, including dark matter direct detection and neutrinoless double beta decay. Its application spans both liquid xenon (Aprile et al. (2025); Aalbers et al. (2025)) and high-pressure gaseous xenon (Adams et al. (2025); Bouet et al. (2024); Chen et al. (2017)). The success of xenon in these fields is largely attributed to its high stopping power and strong vacuum ultraviolet (VUV) scintillation, which enables excellent energy resolution.
In addition to the well-studied VUV scintillation, xenon is also known to emit radiation in the infrared (IR) region. However, this IR emission remains relatively unexplored, particularly with regard to its potential implications for detector performance and background discrimination.
Around the year 2000, the first studies of xenon’s IR continuum emission identified a broad scintillation peak centered around 1.3 m (Borghesani et al. (2001)). Initial measurements were conducted in gaseous xenon (Carugno (1998)), where the IR light yield was found to be comparable in magnitude to that of the UV scintillation (Belogurov et al. (2000)). A blue shift of the emission peak with increasing pressure was also observed and later modeled (Borghesani et al. (2007a, b, 2025)). Above an electric field of about 500 V/cm in the gas, the IR signal was found to increase roughly in proportion to the ionization charge, consistent with a signal from electroluminescence (Belogurov et al. (2000)). IR scintillation has additionally been detected in liquid xenon (Bressi et al. (2000)), though with a light yield estimated to be two orders of magnitude lower than in gas. Furthermore, there are indications that the emission spectrum in the liquid is significantly shifted toward shorter wavelengths (Bressi et al. (2001)).
To better understand xenon’s IR scintillation properties, we initiated a dedicated R&D program. As a first step, we operated a room-temperature setup using gaseous xenon near atmospheric pressure. Using this setup, we studied the time response and light yield of IR scintillation following -particle irradiation, under varying pressure and gas purity. We observed that at approximately 1 bar, the light yield is about one-third of that in the UV. We found that the time response is well described by a sum of two exponential decays: a fast decay with a time constant of , contributing less than 1 % of the total yield, and a slower decay with a time constant of (Piotter et al. (2023); Hammann et al. (2024)). We observed a linear increase in light yield with pressure between 500 and 1100 mbar, along with a decrease in yield as purity decreased. These measurements were performed using a PMT sensitive to wavelengths between about 950 and 1700 nm.
In this paper, we report on the operation of a dual-phase xenon time projection chamber (TPC) instrumented with a UV- and an IR-sensitive PMT, enabling simultaneous measurement of both scintillation components. To our knowledge, this is the first measurement in a TPC with wavelength sensitivities from 170 nm to 1700 nm.
4 Experimental setup
The measurements presented here were carried out using a small-scale liquid xenon TPC called HeXe (short for Heidelberg Xenon, operated at the Max-Planck-Institut für Kernphysik). The detector consists of a g liquid xenon target with a thin layer of gaseous xenon above it serving as an amplification region, and is instrumented with two PMTs. Energy depositions in a liquid xenon target induce both excitation and ionization of the medium. The excited states undergo relaxation processes that lead to the emission of scintillation light. We refer to the UV component of this prompt emission as . Electrons liberated through ionization are drifted upward by an electric drift field to the liquid-gas interface. A stronger electric field is employed to extract the electrons from the liquid into the gas phase. There, the high field accelerates the electrons, enabling them to excite xenon atoms and produce secondary scintillation light through electroluminescence (Lansiart et al. (1976)). We denote the resulting UV emission as .
4.1 The HeXe TPC
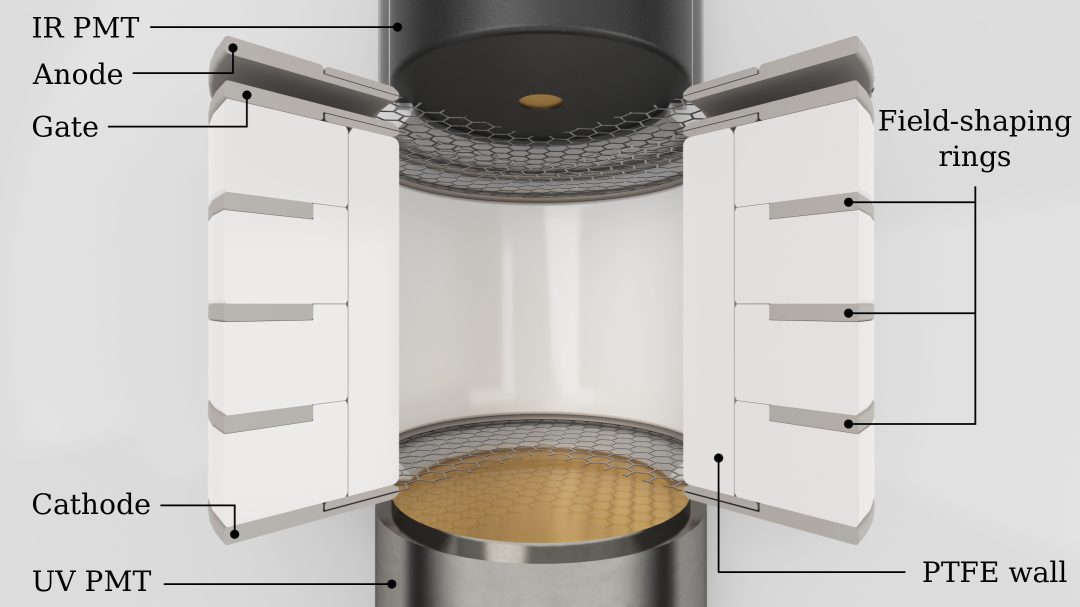
The HeXe TPC and the auxiliary systems for its operation are detailed in (Jörg et al. (2022)). Figure 1 illustrates the TPC configuration used in this work, where the upper PMT has been replaced with an IR-sensitive one, which is described in section 4.2. The TPC’s electric fields are established by three grid electrodes: the cathode at the bottom, the gate just below the liquid surface, and the anode positioned right above the liquid. Field-shaping rings ensure a homogeneous electric field across the sensitive volume. Polytetrafluoroethylene (PTFE) is used both as a reflector and as a filler material between the cryostat and the target.
The drift field is kept constant for all measurements at about 400 V/cm by setting the cathode to V and the gate to V, spaced 5 cm apart. This results in a maximum drift time of about 30 s. The distance between gate and anode is 5 mm. While the liquid level is typically set to 2.5 mm above the gate, midway between gate and anode, it was () mm in this run. The anode was set to V, resulting in an amplification field of about 12 kV/cm in the gas. During operation, the temperature was held constant at about ∘C and the pressure in the gas phase was maintained at bar.
4.2 The infrared-sensitive PMT
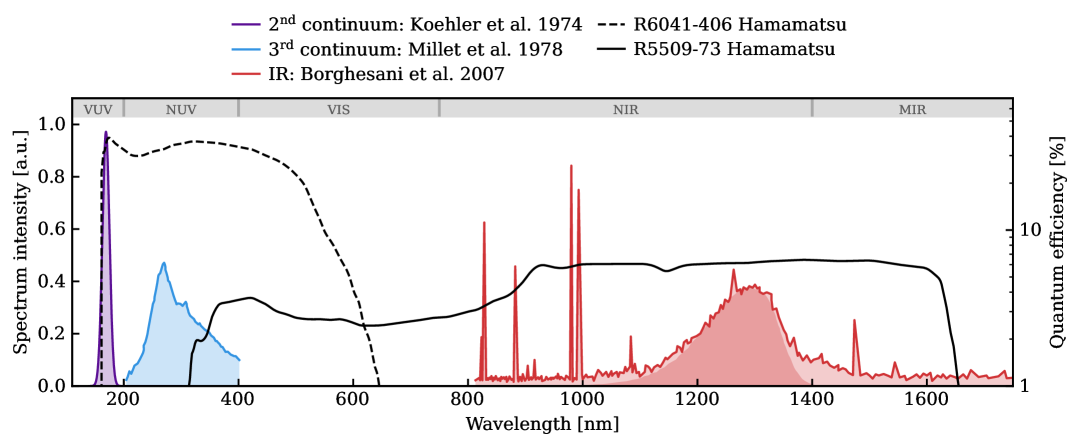
To record the IR scintillation light, we employ a 2-inch Hamamatsu R5509-73 PMT. It features a borosilicate entrance window with an opening of 8 mm diameter (see top PMT in fig. 1). Its reflexion-type photocathode, measuring and made out of InP/InGaAs, is located 2 cm behind the window. The PMT is sensitive to wavelengths between 300 nm and 1.65 m (see fig. 2), with a nominal quantum efficiency (QE) of about 6% at the expected xenon IR scintillation wavelength of 1.3 m (for gaseous xenon at 1 bar). The PMT was operated at V for all measurements, corresponding to a gain of , as stated by the manufacturer.
To achieve optimal QE and dark count rate, the photocathode of the specific PMT used in this work must be biased at V to lower the conduction band barrier (Hamamatsu Photonics K.K. (2017)). This was implemented by stepping down the supply voltage using a Zener diode in series with a potentiometer, allowing the voltage to be adjusted. The potentiometer was placed outside the cold region. During operation in the TPC, however, the bias voltage of the PMT occasionally exhibited discrete jumps to other constant values and was generally lower than designed (at V). The cause is still under investigation, but we suspect that it is due to the Zener diode, which was likely not designed for low-temperature applications. In periods with low bias voltage, the PMT’s QE is expected to be reduced to an unknown value. To mitigate this in future runs, we plan to relocate the Zener diode to a room-temperature environment.
4.3 The HeXe gas handling system
A dedicated gas handling system, connected to the TPC, allows xenon storage, the introduction of gaseous calibration sources, and gas purification. During TPC operation, the xenon is continuously purified by circulating it through a hot getter. This is achieved by evaporating xenon from the liquid phase, circulating it as a gas, and then recondensing it on the cold head, from where it drips back into the TPC. Detailed information on the system is provided in (Jörg et al. (2022)).
The xenon purity is assessed by measuring the “electron lifetime”, a parameter that quantifies the loss of drifting electrons in the liquid due to attachment to electronegative impurities. During this measurement campaign, the electron lifetime varied from about 40 to 50 s, notably shorter than in previous runs (a few hundred to a few thousand s). This reduction was likely caused by outgassing from the IR PMT materials and the PTFE structure of the TPC.
5 Calibration source, DAQ, and data analysis
The measurements were carried out using an internal 222Rn -particle calibration source. This source was produced by depositing a 4.2 g liquid sample with 29 kBq of 226Ra onto a glass substrate. The dried substrate was placed in a xenon-filled emanation chamber, where 222Rn accumulated over a period of one to three days. Subsequently, the radon-enriched xenon gas was expanded into a transfer chamber and introduced into the HeXe gas system. The resulting -particle rate in the TPC ranged from 20 to 30 Hz, originating from the decays of 222Rn, 218Po, and 214Po, with energies of 5.5, 6.0, and 7.7 MeV, respectively.
Signals were triggered on the UV channel and recorded using a CAEN V1724 digitizer, which has a sampling rate of 100 MS/s and 14-bit resolution. Due to the nanosecond-scale rise and fall times of the IR signals, a timing filter amplifier was employed to shape the IR pulses, in order to maintain detection efficiency. The digitized waveforms were processed to identify peaks, from which key characteristics – such as arrival time, pulse area converted to the number of photoelectrons (PE), and width – were extracted (Cichon (2021)). Peaks in the UV channel were subsequently classified into S1 and S2 signals.
In addition to the nominal fields stated in section 4.1, the TPC was also operated at different electric field strengths in the gas phase. Electric field values, including the drift and amplification fields above the gate, were determined and verified through COMSOL multiphysics simulations (COMSOL Inc. (2024)). These simulations also provide estimates of the associated uncertainties for all field configurations.
For IR pulses, only a peak height threshold is applied to suppress noise. A set of selection criteria is applied to the UV signals to select well-reconstructed -particle events. Events within the liquid xenon target are selected based on their drift time. Single scatter interactions are selected by requiring exactly one and rejecting events with a secondary physical following the primary. To reject muon events and signals with distorted pulse shapes, we apply a cut on the width and shape. Finally, -particle events are selected in the - parameter space, as shown in fig. 3.
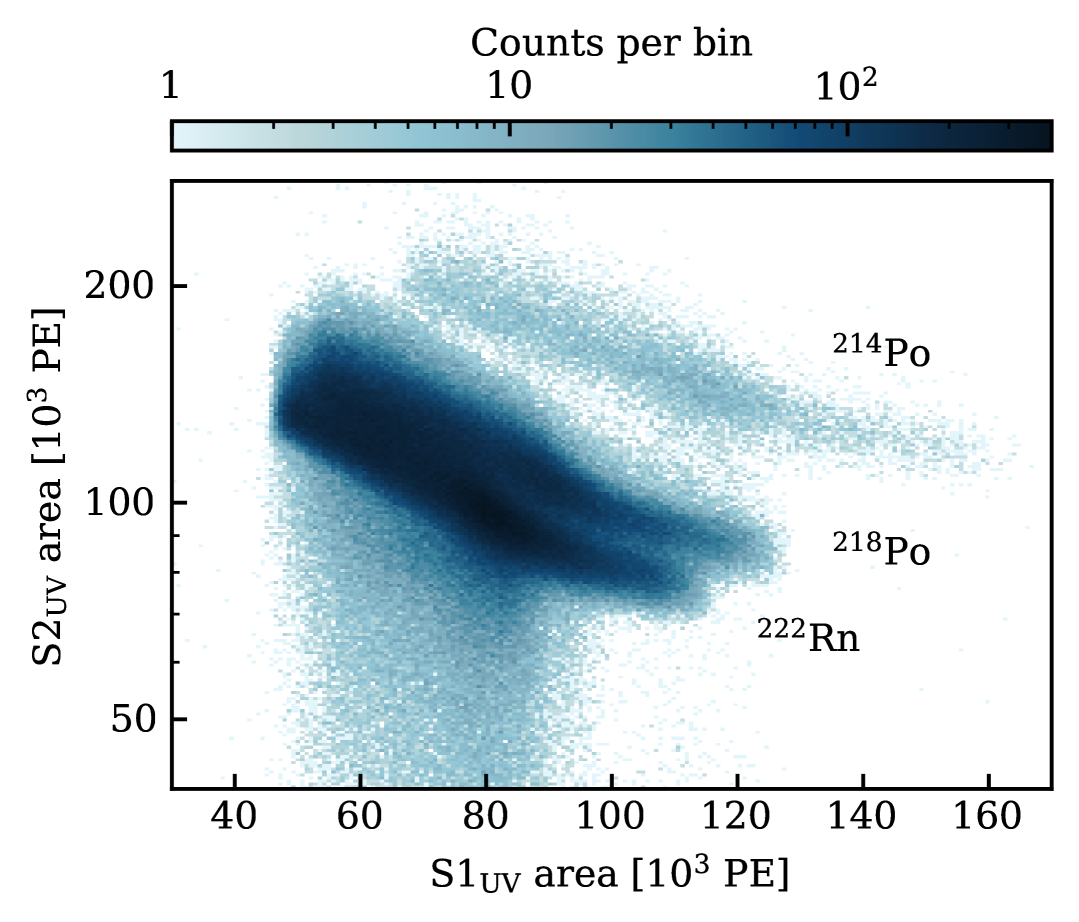
The populations with approx. PE in and PE in correspond to the three -decays of 222Rn. They have an extended distribution in light and charge signal due to position-dependent variations in light collection efficiency across the detector.
6 Results
Owing to the IR PMT’s small entrance window and a nominal quantum efficiency roughly five times lower than that of the UV PMT, its light collection efficiency is orders of magnitude lower. Consequently, S1 and S2 signals of -particle events are recorded as thousands of photons in the UV PMT, but as individual photons in the IR PMT.
For each identified IR peak in a waveform, the time differences relative to the and signals of the event are calculated. The pulse times for and the IR channel are defined as the first sample preceding 10% of the peak’s height. For signals, the time of maximum pulse height is taken. Figure 4 shows the drift time of the event (time between and signals) as a function of the time difference between IR pulses and the corresponding .
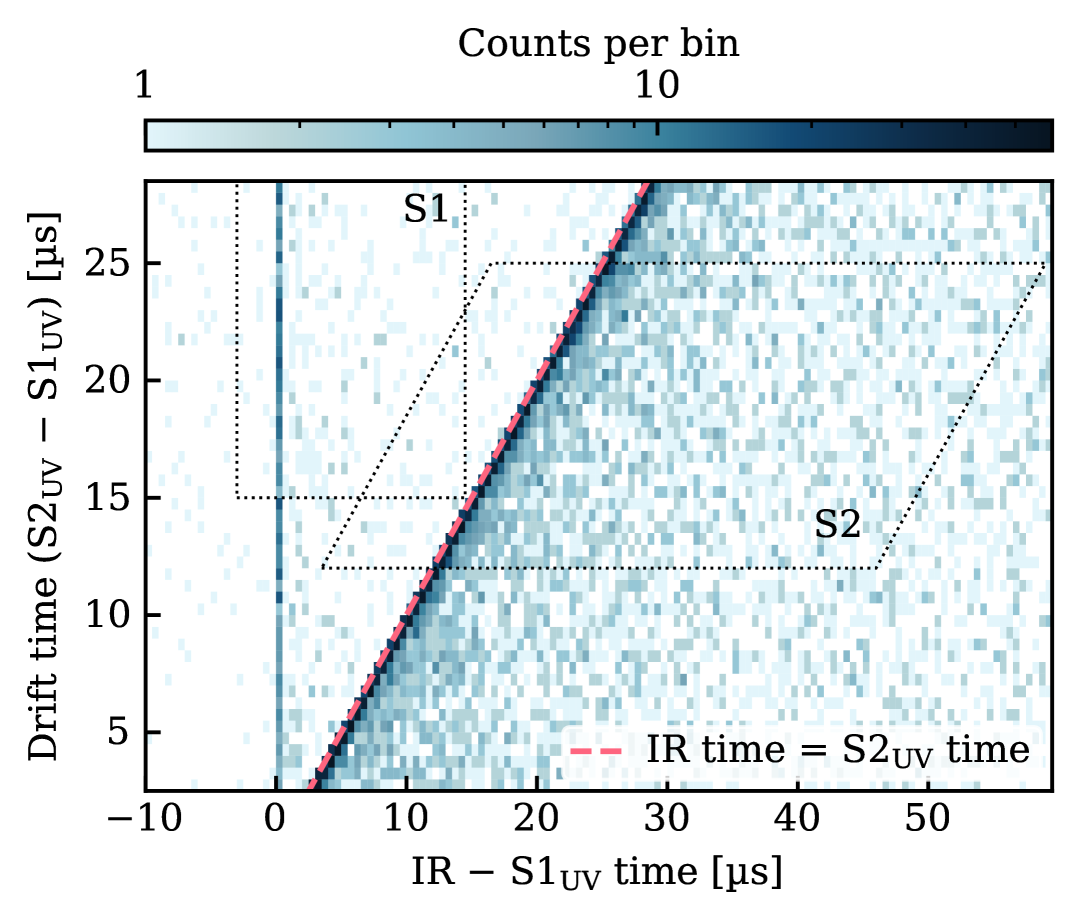
Events at the top of the TPC have a short distance between and and are located at the bottom of fig. 4.
A small population of IR pulses are very close in time to the across all drift times, which we interpret as IR S1 signals. A larger population of IR pulses is found at or after the time (to the right of the red dashed line). Already from this observation, we can conclude that we see IR emission associated with both and signals.
6.1 Signal time structure
We investigated the IR time response after and signals. To study the time behavior following , we selected signals before the with drift times larger than (dotted box labeled ‘S1’ in fig. 4), enabling the study of the distribution tail. Figure 5 shows the arrival time distribution relative to the up to 15s (main panel), with a magnification of the fast component in the inset up to 300 ns.
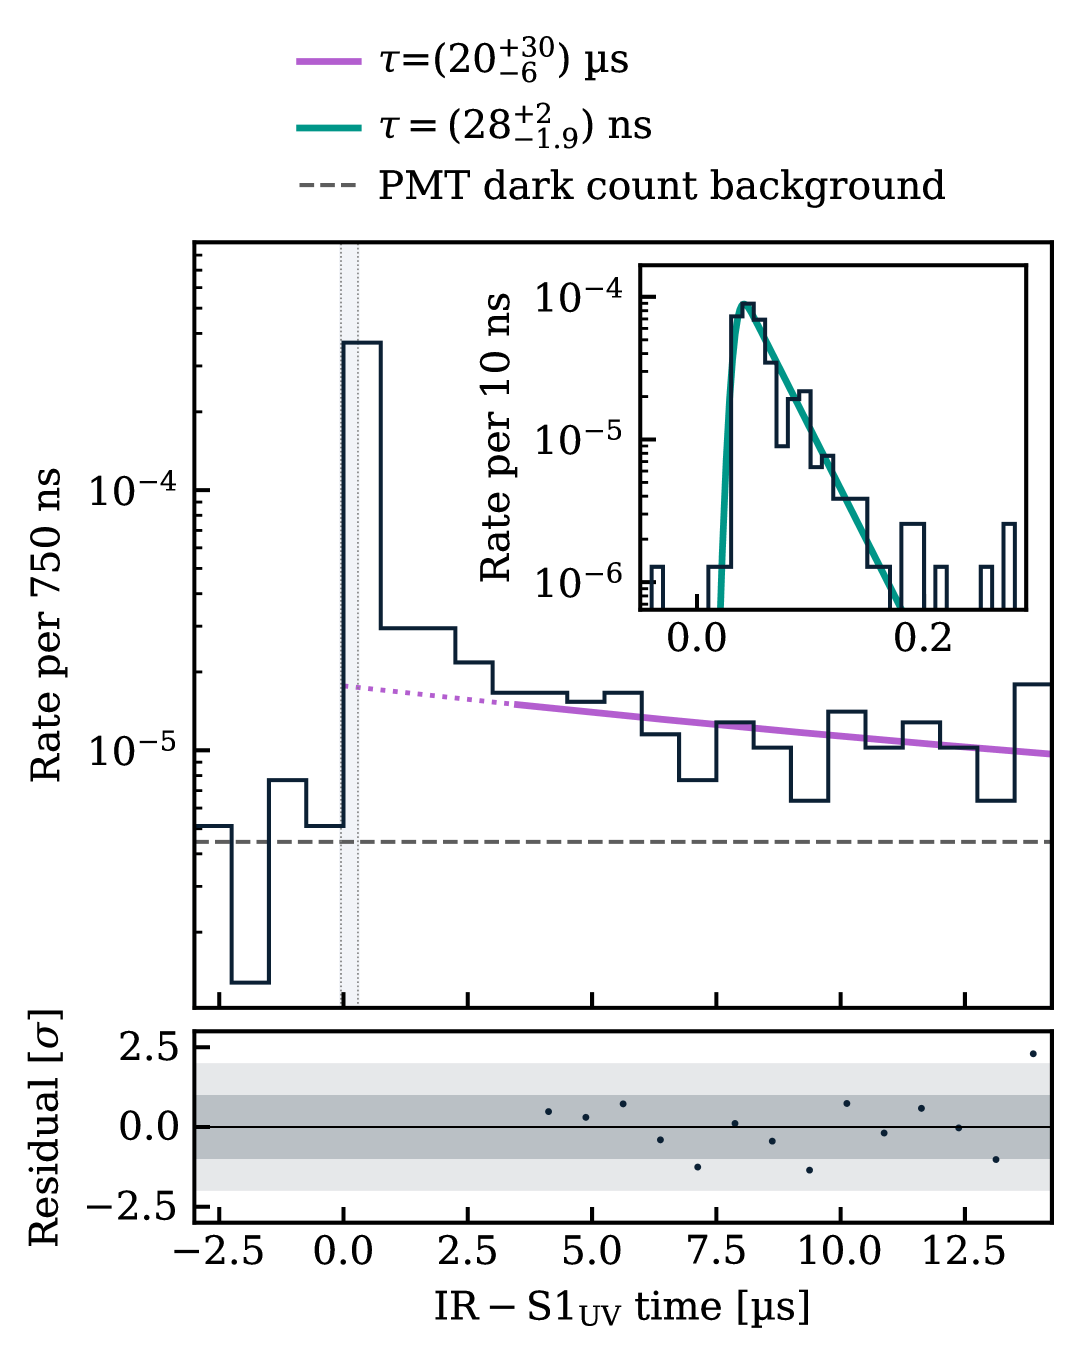
The long IR tail following the signal is well described by an exponential decay with a time constant of approximately s. The fast component, which accounts for roughly half of the total signal following the , is modeled by an exponential with a time constant of 30 ns, convolved with a Gaussian to account for the digitizer’s timing resolution. Although a precise determination of the fast time response is limited by the resolution and available statistics, we note that the observed scale is similar to previously reported values for . For instance, Cichon et al. (2022) reports that approximately 65% of the signal has a time constant of 26 ns.
To examine the IR emission associated with the electroluminescence process, we analyzed the arrival times of IR pulses occurring after the (dotted box labeled ‘S2’ in fig. 4). In fig. 6, we show the time between each IR pulse and the signal.
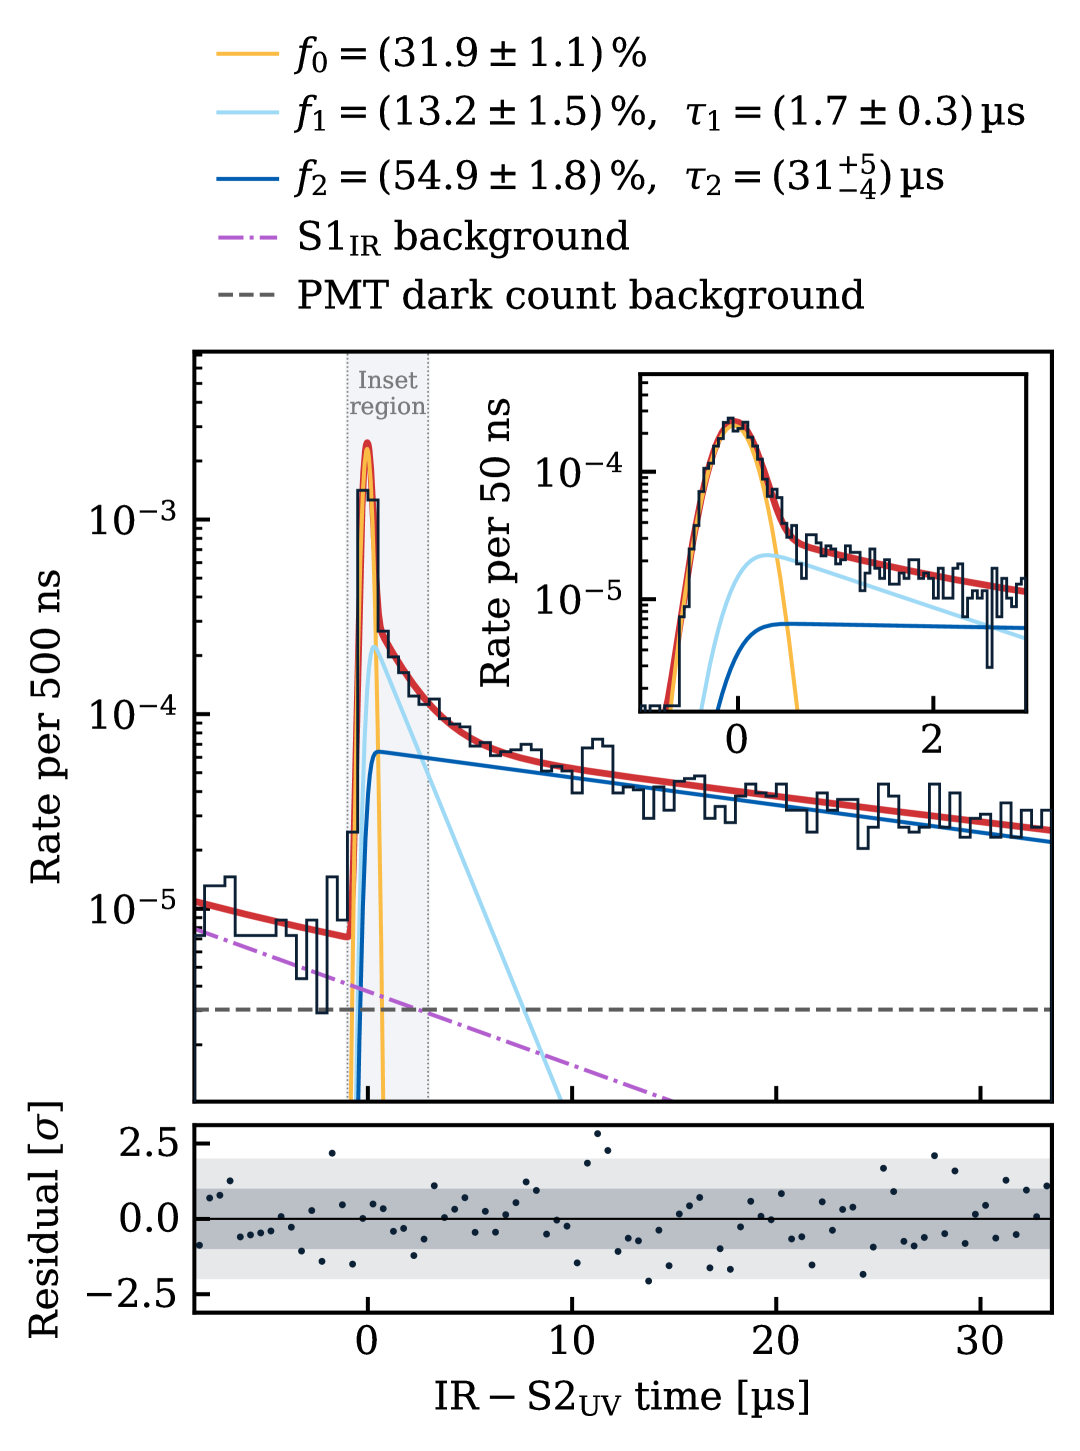
We model the distribution as the sum of three exponential decay components convolved with a Gaussian of s width to account for the temporal dispersion of electron arrival times. An unbinned maximum likelihood fit is performed using this model. We include a flat background component to account for PMT dark count, as well as an exponential component originating from the IR signals following the (see fig. 5).
The fastest decay component is not well resolved due to the time smearing and is therefore simply modeled by a Gaussian. Its timescale may be comparable to the few-ns component previously observed in gaseous xenon at room temperature (Piotter et al. (2023); Hammann et al. (2024)). The second fastest decay time of approx. s is also similar to the decay time found in previous measurements. The third component of s decay time has not been reported before. This slowest component contributes more than 50% of the total signal integral, making it the dominant contribution. Interestingly, this component is very similar to the slow component found after the (purple line in fig. 5), pointing to a common origin. The fastest component accounts for approximately one-third of the total signal.
Figure 7 compares the IR time response to the electroluminescence signal observed in the UV. The average waveform of 500 signals (black curve) is overlaid with the background-subtracted best-fit result from fig. 6.
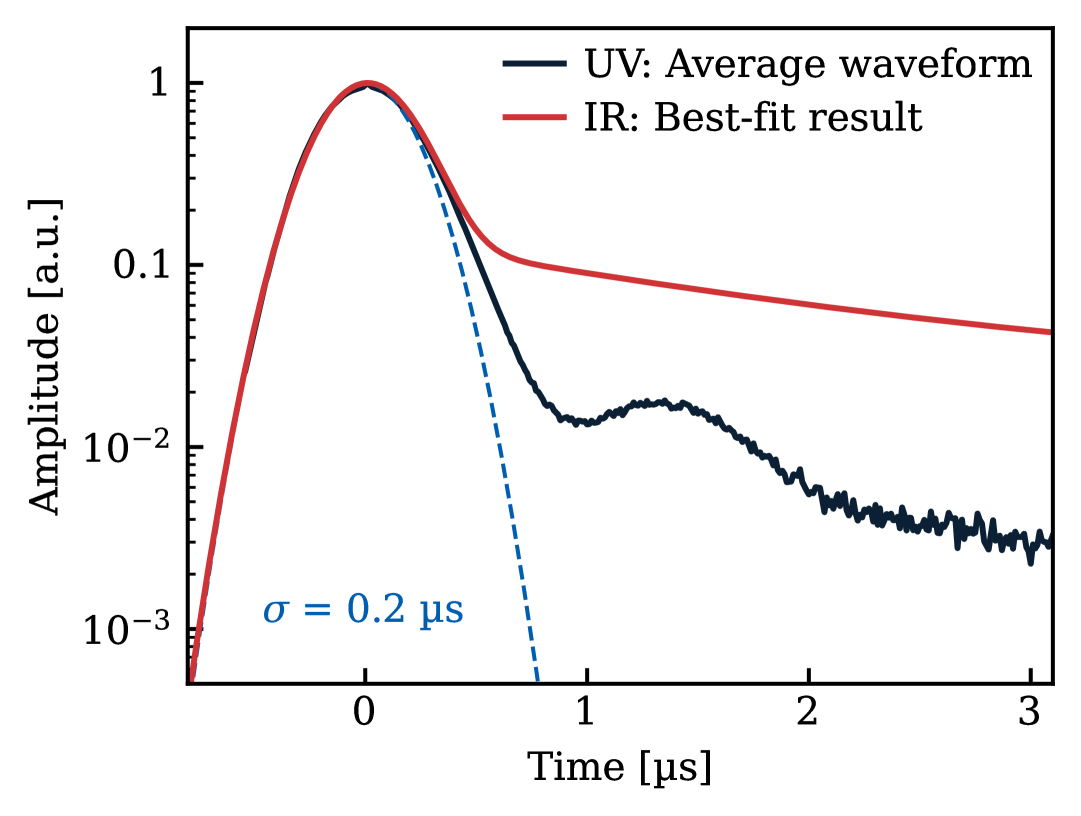
We find that the main peak is well described by a Gaussian with a width of s. The distribution has an asymmetric tail towards late times, which may result from PMT afterpulses and delayed electrons originating either from incomplete extraction or from photoionization of impurities in the liquid. A small peak around 1.5 s after the main signal is attributed to photoemission from the gate following the , supported by its dependence on the amplification field and the observation of a similar delayed peak after large signals. While the main peaks of the UV and IR signals exhibit a similar shape, the IR signal features a significantly more pronounced tail – approximately an order of magnitude larger in relative amplitude. Moreover, the photoemission peak present in the UV signal is not observed in the IR, although it may be obscured by the extended tail. The differences suggest that the origins of the respective tails are not the same.
6.2 Electric field dependence
To study the IR emission following for different electron energies, we varied the amplification field in the xenon gas region from about 9 kV/cm to 15 kV/cm by varying the anode potential, while keeping the drift field constant. The IR PMT bias voltage was constant across all measurements.
In order to estimate the liquid level in the TPC, signals from the photoemission of the gate electrode for different amplification fields are employed. The liquid level is then matched using the gate-surface times difference and the field-dependent drift velocity in the liquid (from Gushchin et al. (1982)). Averaging over all anode voltages and two analysis methods yields a liquid level of mm above the gate. The uncertainty is propagated to the electric fields in the liquid, which directly affect the extraction efficiency. Table 1 summarizes the applied voltage differences, along with the calculated electric fields in the liquid and gas phases, based on the derived liquid level.
| V [V] | [kV/cm] | [kV/cm] |
|---|---|---|
| 2 745 | ||
| 3 745 | ||
| 4 745 |
To count IR photons associated with the electroluminescence signal, we select those occurring within a time window from to s relative to the , thereby minimizing contamination from signals related to the . Some of the selection criteria described in section 5 may depend on the radial position of the event, which affects the light collection efficiency of the IR PMT and thus the observed IR photon rate. To reduce possible bias, only minimal cuts are applied for this estimate, and the variation introduced by additional cuts is used to estimate a systematic uncertainty. The observed IR photon rate is corrected for the field-dependent electron extraction efficiency (Aprile et al. (2014); Xu et al. (2019)). Potential systematic uncertainties on the extraction are taken into account.
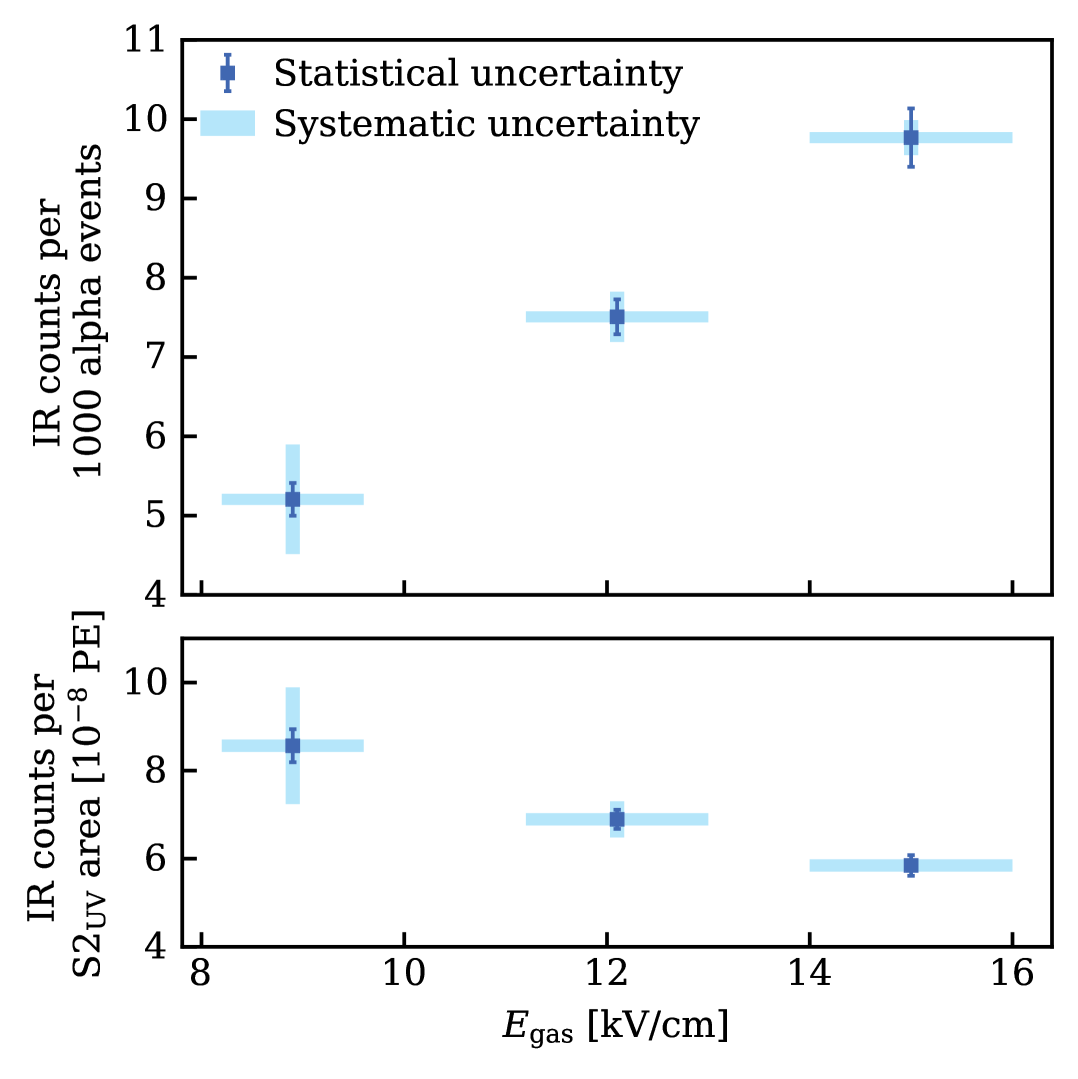
The amplification fields studied here cover a region where the dependence of the UV signal strength on the field strength transitions from a linear to an exponential dependence (Aprile et al. (2014)). We observe a monotonic increase with the field strength in the IR photon rate, as shown in fig. 8 (top panel). A similar trend was also observed in Belogurov et al. (2000) for lower fields.
While absolute yields cannot be determined, we compare the observed IR rate to the size of the associated signal, as shown in the lower panel of fig. 8. The resulting ratio appears to deviate from a constant, suggesting that the two signals might not scale identically with the amplification field. It is important to note that IR peaks with arrival times beyond 34 s are not included in the rate estimates. At the nominal amplification field of 12 kV/cm, approximately 15% of IR pulses fall outside the selected time window. This fraction may vary with field strength due to changes in the slowest time constant, but limited statistics prevent a reliable estimate of this dependence.
7 Discussion and outlook
We investigated the scintillation response in a dual-phase xenon TPC in the wavelength range from 170 nm to 1700 nm. Infrared photons were observed in coincidence with UV scintillation from both the liquid and gas phases, and their time profiles were studied. As expected, increasing the electric field in the gas phase led to an increased number of IR photons associated to the electroluminescence signal.
The origin of the IR scintillation constant in gas, observed here and also in our previous publication (Hammann et al. (2024)), remains unclear. Since the UV scintillation decay constants are faster than the slow IR component, it is unlikely that this decay originates from a precursor state of the lower lying Xe leading to the intense UV scintillation. One possible explanation is a de-excitation pathway that bypasses the lowest-lying excimer state, thereby preventing the emission of UV light.
The IR-sensitive PMT used for the measurements presented here is also sensitive to shorter wavelengths as shown in fig. 2, adding some uncertainty to the interpretation of the results. In particular, it is sensitive to the tail of the third continuum emission (see fig. 2), which has a decay constant of approximately 8 ns (Millet et al. (1978)). This component has so far been measured as part of the primary scintillation light in gaseous xenon for -particles at pressures up to 10 bar, as well as for electrons at 10 bar (Leardini et al. (2022)). In electroluminescence, it was shown that the third continuum contributes at most at the sub-percent level to . Given the PMT’s roughly threefold lower QE at this wavelength and partial spectral overlap, its contribution is considered subdominant. An additional contribution spanning a broad wavelength range arises from neutral bremsstrahlung (Henriques et al. (2022); Leardini et al. (2022)). To the best of our knowledge, neither of these processes has been systematically studied in the liquid phase.
In the IR time response following both and signals, we observed a time constant of approximately 30 s, which accounts for roughly half of the respective total signals. This similarity may point to a common origin of the slow component. Delayed electron tails have been observed in several liquid xenon TPCs (see for example Aprile et al. (2014)). A fraction of liberated electrons are not immediately extracted into the gas phase. Instead, they are reflected off the liquid surface and eventually extracted at later times. In addition, – in particular when the xenon purity is not particularly high – UV scintillation light may photoionize residual impurities in the liquid, generating delayed electrons. However, any signal from delayed electrons would also be visible in the UV channel, and thus can only account for the tail observed in the signal. Another possible contribution may arise from material fluorescence. The TPC wall is made of PTFE, which has been suggested as a source of fluorescent light (Shaw et al. (2007))), although it is debated (Araujo et al. (2019)) or attributed instead to fluorescence of residues in the PTFE (Pollmann (2025)). Fluorescence from quartz – the material used for the UV PMT window – has also been reported to produce a long signal tail in the UV-sensitive detectors (Sorensen and Gibbons (2025)), but could also contribute to the slow component observed in the IR channel. We also cannot rule out a contribution from a PMT-related effect, possibly induced by the suboptimal bias voltage applied to the photocathode, which may lead to delayed photoelectron extraction from the InP/InGaAs photocathode.
Although our data is not sensitive to the time constant of the fast IR scintillation component in the gas, it is sensitive to the amplitude of this component. Our past measurements at room temperature showed that, for -particles, the ns component contributes less than 1% to the total signal (Hammann et al. (2024)). The current measurements with electrons in the gas show that the fast component makes up about one-third of the signal. This difference could potentially allow particles to be discriminated in the gas by means of their pulse shape.
The measurements presented here cannot be used to quantify the IR light yield, primarily because the PMT’s quantum efficiency at the applied low bias voltage is unknown. While it remains unclear whether IR scintillation in liquid xenon is sufficiently strong for practical applications, our data support the presence of IR emission from the electroluminescence process in xenon gas, consistent with previous observations. Since previous measurements in gaseous xenon indicate a scintillation yield in the IR comparable to the UV, its application in particle detectors appears promising. One potential application in future dual-phase liquid xenon detectors is the improved discrimination of single-electron S2 signals from S1 signals. Therefore, the ratio of IR and UV signals could eventually improve the rejection of accidental coincidences. Beyond liquid detectors, IR scintillation in xenon gas could also offer advantages for high-pressure gaseous TPCs being developed to search for neutrinoless double beta decay. In such experiments, the additional IR signal could contribute to improved energy resolution – crucial for the experiment’s sensitivity – and may even enable further background suppression via the IR pulse shape, as mentioned above.
Future measurements will help to improve our understanding of the IR emission and enable us to evaluate its feasibility for future low-background experiments. However, new photosensor solutions will be necessary. The current R5509-73 IR PMT is not suitable for low-background applications, as its intrinsic radioactivity ( mBq) in U and Th) is too high for such rare event searches.
This first study shows signals in the IR-sensitive channel associated with both and , although important questions remain regarding their underlying mechanisms. In the future, we plan to repeat the measurements using improved PMT electronics that support the correct bias voltage. This is expected to eliminate potential distortions in the time response and enable reliable quantification of the light yield. Moreover, we plan to operate the detector with higher xenon purity to investigate potential delayed signals caused by impurities, as well as possible distortions in the time response due to quenching effects. We also aim to study the two signals independently: the fast component following will be investigated using a faster digitizer, while the electroluminescence signal can be studied in a gas-only detector and extended to longer time scales to compare with known delayed electron signals. To further disentangle different contributions, we plan to introduce a wavelength filter in front of the IR PMT, isolating emission above 1 m.
Conflict of Interest Statement
The authors declare that the research was conducted in the absence of any commercial or financial relationships that could be construed as a potential conflict of interest.
Author Contributions
RH: investigation, data curation, formal analysis, methodology, writing–original draft, visualization, writing–review and editing; KB: investigation, formal analysis and writing–review; SF: investigation, writing–review; LH: investigation, writing–review; TMU: conceptualization, project administration, supervision, writing–original draft, writing–review and editing.
Funding
RH and KB acknowledge the financial support of the International Max Planck Research School for Precision Tests of Fundamental Symmetries (IMPRS-PTFS). The project is supported by the Max Planck Society.
Acknowledgments
We gratefully acknowledge the technical services of the Max-Planck-Institut für Kernphysik and thank Yannick Steinhauser for producing the rendered illustration of HeXe. We also thank Edgar Sanchez for valuable discussions.
References
- Aalbers et al. (2025) Aalbers, J. et al. (2025). Dark matter search results from 4.2 tonne-years of exposure of the LUX-ZEPLIN (LZ) experiment. Phys. Rev. Lett. , –10.1103/4dyc-z8zf
- Adams et al. (2025) Adams, C. et al. (2025). The NEXT-100 Detector. arXiv:2505.17848
- Aprile et al. (2014) Aprile, E. et al. (2014). Observation and applications of single-electron charge signals in the XENON100 experiment. J. Phys. G 41, 035201. 10.1088/0954-3899/41/3/035201
- Aprile et al. (2025) Aprile, E. et al. (2025). WIMP Dark Matter Search using a 3.1 tonne year Exposure of the XENONnT Experiment. arXiv:2502.18005
- Araujo et al. (2019) Araujo, G. R., Pollmann, T., and Ulrich, A. (2019). Photoluminescence response of acrylic (pmma) and polytetrafluoroethylene (ptfe) to ultraviolet light: Limits on low-intensity photoluminescence in support materials of rare-event search experiments. The European Physical Journal C 79. 10.1140/epjc/s10052-019-7152-2
- Belogurov et al. (2000) Belogurov, S., Bressi, G., Carugno, G., Conti, E., Iannuzzi, D., and Meneguzzo, A. (2000). Measurement of the light yield of infrared scintillation in xenon gas. Nucl. Instrum. Meth. A 452, 167. https://doi.org/10.1016/S0168-9002(00)00358-2
- Borghesani et al. (2001) Borghesani, A. F., Bressi, G., Carugno, G., Conti, E., and Iannuzzi, D. (2001). Infrared fluorescence of Xe2 molecules in electron/proton beam excited pure Xe gas and in an Ar/Xe gas mixture. J. Chem. Phys. 115, 6042. 10.1063/1.1398307
- Borghesani et al. (2025) Borghesani, A. F., Carugno, G., and Chiossi, F. (2025). Near-infrared cathodoluminescence of xe2 excimers in dense gaseous mixtures. Frontiers in Detector Science and Technology Volume 3 - 2025. 10.3389/fdest.2025.1580297
- Borghesani et al. (2007a) Borghesani, A. F., Carugno, G., and Mogentale, I. (2007a). Infrared emission spectrum and potentials of 0 and 0 states of Xe2 excimers produced by electron impact. J. Phys. B 40, 4551. 10.1088/0953-4075/40/24/001
- Borghesani et al. (2007b) Borghesani, A. F., Carugno, G., and Mogentale, I. (2007b). Low- and high-density features of ir luminescence of xe2 excimers produced by electron impact. Physica Scripta 76, C84. 10.1088/0031-8949/76/3/N13
- Bouet et al. (2024) Bouet, R. et al. (2024). Simulation of a radial TPC for the detection of neutrinoless double beta decay. arXiv:2411.03722
- Bressi et al. (2000) Bressi, G., Carugno, G., Conti, E., Iannuzzi, D., and Meneguzzo, A. (2000). Infrared scintillation in liquid Ar and Xe. Nucl. Instrum. Meth. A440, 254. 10.1016/S0168-9002(99)01021-9
- Bressi et al. (2001) Bressi, G., Carugno, G., Conti, E., Noce, C., and Iannuzzi, D. (2001). Infrared scintillation: a comparison between gaseous and liquid xenon. Nucl. Instrum. Meth. A 461, 378. https://doi.org/10.1016/S0168-9002(00)01249-3. 8th Pisa Meeting on Advanced Detectors
- Carugno (1998) Carugno, G. (1998). Infrared emission in gaseous media induced by ionizing particles and by drifting electrons. Nucl. Instrum. Meth. 419, 617. 10.1016/S0168-9002(98)00840-7
- Chen et al. (2017) Chen, X. et al. (2017). PandaX-III: Searching for neutrinoless double beta decay with high pressure 136Xe gas time projection chambers. Science China Physics, Mechanics & Astronomy 60. 10.1007/s11433-017-9028-0
- Cichon (2021) Cichon, D. (2021). Liquid xenon detector physics with XENON1T and HeXe: electric noise stability, background discrimination studies and measurements of the scintillation pulse shape. Ph.D. thesis, Ruprecht-Karls-Universität Heidelberg
- Cichon et al. (2022) Cichon, D., Eurin, G., Jörg, F., Marrodán Undagoitia, T., and Rupp, N. (2022). Scintillation decay-time constants for alpha particles and electrons in liquid xenon. Rev. Sci. Instrum. 93, 113302. 10.1063/5.0087216
- COMSOL Inc. (2024) [Dataset] COMSOL Inc. (2024). Comsol multiphysics®user guide
- Gushchin et al. (1982) Gushchin, E., Kruglov, A., and Obodovskii, I. (1982). Electron dynamics in condensed argon and xenon. Sov. Phys. JETP 55, 650
- Hamamatsu Photonics K.K. (2017) [Dataset] Hamamatsu Photonics K.K. (2017). Photomultiplier Tubes - Basics and Applications - Fourth Edition
- Hammann et al. (2024) Hammann, R., Böse, K., Hötzsch, L., Jörg, F., and Marrodán Undagoitia, T. (2024). Investigating the slow component of the infrared scintillation time response in gaseous xenon. JINST 19, C02080. 10.1088/1748-0221/19/02/C02080
- Henriques et al. (2022) Henriques, C., Amedo, P., Teixeira, J., González-Díaz, D., Azevedo, C., Para, A., et al. (2022). Neutral Bremsstrahlung Emission in Xenon Unveiled. Phys. Rev. X 12, 021005
- Jörg et al. (2022) Jörg, F., Cichon, D., Eurin, G., Hötzsch, L., Marrodán Undagoitia, T., and Rupp, N. (2022). Characterization of alpha and beta interactions in liquid xenon. Eur. Phys. J. C 82, 361. 10.1140/epjc/s10052-022-10259-3
- Koehler et al. (1974) Koehler, H. A., Ferderber, L. J., Redhead, D. L., and Ebert, P. J. (1974). Vacuum-ultraviolet emission from high-pressure xenon and argon excited by high-current relativistic electron beams. Phys. Rev. A 9, 768–781. 10.1103/PhysRevA.9.768
- Lansiart et al. (1976) Lansiart, A., Seigneur, A., Moretti, J.-L., and Morucci, J.-P. (1976). Development research on a highly luminous condensed xenon scintillator. Nucl. Instrum. Meth. 135, 47. 10.1016/0029-554X(76)90824-7
- Leardini et al. (2022) Leardini, S. et al. (2022). Time and band-resolved scintillation in time projection chambers based on gaseous xenon. Eur. Phys. J. C 82, 425. 10.1140/epjc/s10052-022-10385-y
- Millet et al. (1978) Millet, P. et al. (1978). Time resolved study of the uv and near uv continuums of xenon. J. Chem. Phys. 69, 92. https://doi.org/10.1063/1.436349
- Piotter et al. (2023) Piotter, M., Cichon, D., Hammann, R., Jörg, F., Hötzsch, L., and Marrodán Undagoitia, T. (2023). First time-resolved measurement of infrared scintillation light in gaseous xenon. Eur. Phys. J. C 83, 482. 10.1140/epjc/s10052-023-11618-4
- Pollmann (2025) [Dataset] Pollmann, T. (2025). private communication
- Shaw et al. (2007) Shaw, P.-S., Li, Z., Arp, U., and Lykke, K. R. (2007). Ultraviolet characterization of integrating spheres. Appl. Opt. 46, 5119–5128. 10.1364/AO.46.005119
- Sorensen and Gibbons (2025) Sorensen, P. and Gibbons, R. (2025). Quartz fluorescence backgrounds in rare-event searches. arXiv:2505.08067
- Xu et al. (2019) Xu, J., Pereverzev, S., Lenardo, B., Kingston, J., Naim, D., Bernstein, A., et al. (2019). Electron extraction efficiency study for dual-phase xenon dark matter experiments. Phys. Rev. D 99, 103024. 10.1103/PhysRevD.99.103024