Softness and Hydrodynamic Interactions Regulate Lipoprotein Transport in Crowded Yolk Environments
Abstract
Low-density lipoproteins (LDLs) serve as nutrient reservoirs in egg yolk for embryonic development and as promising drug carriers. Both roles critically depend on their mobility in densely crowded biological environments. Under these crowded conditions, diffusion is hindered by transient confinement within dynamic cages formed by neighboring particles, driven by solvent-mediated hydrodynamic interactions and memory effects—phenomena that have remained challenging to characterize computationally and experimentally. Here, we employ megahertz X-ray photon correlation spectroscopy to directly probe the cage dynamics of LDLs in yolk-plasma across various concentrations. We find that LDLs undergo anomalous diffusion, experiencing 100-fold reduction in self-diffusion at high concentrations compared to dilute solutions. This drastic slowing-down is attributed to a combination of hydrodynamic interactions, direct particle-particle interactions, and the inherent softness of LDL particles. Despite reduced dynamics, yolk-plasma remains as a liquid, yet sluggish, balancing dense packing, structural stability, and fluidity essential for controlled lipid release during embryogenesis.
Low-density lipoproteins (LDLs) are biological core-shell nanoparticles present in humans, animals, and eggs (?, ?). In humans and animals, LDLs play a crucial role in lipid distribution, whereas in egg yolk, they serve as essential lipid reservoirs supporting embryonic development (?). Egg yolk constitutes a naturally crowded medium characterized by high LDL concentrations with volume fractions exceeding 40. Understanding factors influencing LDL mobility and viscoelasticity in such settings is vital for elucidating yolk stability and effective nutrient delivery to embryos. In human health, hindered LDL diffusion or increased blood viscosity contributes significantly to the formation of atherosclerotic plaques in arterial walls (?, ?). Furthermore, LDLs have attracted substantial attention as promising drug carriers, exhibiting notable advantages over synthetic delivery systems in navigating complex biological media, which is critical for therapeutic efficiency (?, ?, ?, ?). Therefore, detailed insights into the mechanisms controlling LDL diffusion under crowded conditions have substantial relevance for biology and medical applications.
Macromolecular diffusion in densely crowded environments, including the cytoplasm, extracellular matrix, food products, and pharmaceutical formulations, is significantly affected by intermolecular interactions (?, ?, ?, ?, ?, ?). Such interactions modulate molecular mobility, creating transient confinement that alter transport properties and molecular function (?, ?, ?, ?). Crowded conditions typically elevate effective viscosity due to specific electrostatic and non-specific interactions as well as depletion effects (?, ?, ?). Moreover, heterogeneous dynamics at elevated concentrations (?, ?) often result in deviations from the classical Stokes-Einstein relation, indicating also a possible decoupling of mass and momentum transport (?, ?).
Relevant particle interactions become especially significant at nanometer length and microsecond time scales, where they critically influence diffusion processes and reactions. The characteristic interaction time scale is given by the duration required for a particle, with diffusion constant , to traverse a distance comparable to its own size, expressed as . For LDL particles in egg yolk-plasma this time is approximately µs, assuming 15.5 nm and = 15.8 nm2/µs. In concentrated solutions, mutual interactions at these time scales lead to memory effects and dynamic caging (?, ?, ?, ?, ?), significantly influencing particle movement and viscoelasticity. Hydrodynamic interactions further complicate dynamics in dense macromolecular systems (?, ?, ?, ?). These interactions, extending over short and long ranges, yield localized effects at short time scales and correlated collective motion at longer scales (?). Despite their importance, the many-body, flow-mediated nature of these hydrodynamic interactions presents ongoing challenges for theoretical modeling and computational simulations due to extensive computational time demands (?).
Colloidal theories (?, ?, ?, ?) have been widely employed to interpret diffusion in dense systems, predicting behaviors across a wide range of concentrations from dilute to highly concentrated colloidal suspensions, including protein solutions. For instance, spherical proteins such as -crystallin (?, ?) and ferritin (?) often follow hard-sphere diffusion predictions, though appropriate scaling might be necessary (?). However, these simplified models show limitations when applied to macromolecules with complex properties (?, ?). Factors such as anisotropy, shape, particle softness, and surface heterogeneity alter interaction potentials and thus may substantially alter diffusion rates (?, ?, ?, ?).
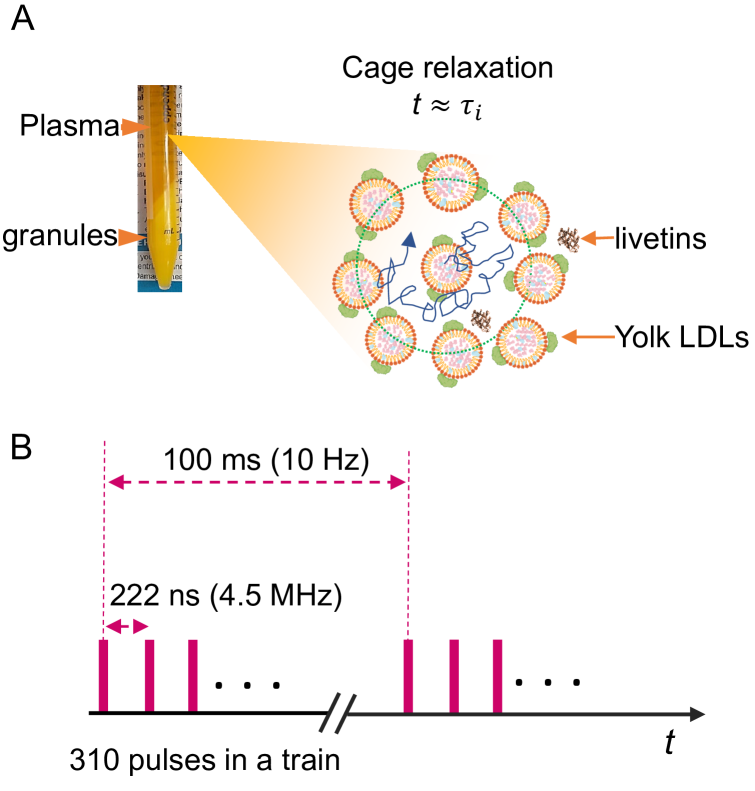
Given these limitations, the study of LDL diffusion within its native, densely concentrated egg yolk-plasma environment gains particular importance. LDLs, with their distinct core-shell structure (Fig. 1A) and intricate lipid-protein surface chemistry, exemplify complex biological nanoparticles expected to significantly deviate from idealized hard-sphere predictions. Thus, understanding the factors influencing LDL diffusion is essential both for gaining insights into biological processes involving nutrient release during embryogenesis and enhancing the efficacy of LDL-based drug delivery systems.
Here, we investigate the effects of hydrodynamic interactions and particle softness on LDL diffusion in highly concentrated egg yolk-plasma using megahertz X-ray photon correlation spectroscopy (MHz-XPCS) at the European X-ray Free Electron Laser Facility (EuXFEL) (?). Our results reveal that LDL diffusion in egg yolk-plasma is strongly influenced by solvent-mediated hydrodynamic interactions, resulting in non-Brownian diffusion (?). Memory effects stemming from both direct interparticle forces and long-range hydrodynamic interactions at cage-relaxation times lead to a stretched exponential decay in correlation functions. We demonstrate that the -dependence of collective diffusion at interaction time scales is effectively captured by a hydrodynamic function with a scaling prefactor. At short-time scales, this dependence is dominated by direct correlations from the structure factor and hydrodynamic function, while a mean-field prefactor captures the slowing-down effects. The long-time self-diffusion of LDLs in pure yolk-plasma is approximately 100 times slower than in dilute solutions, emphasizing the pronounced influence of crowding. Furthermore, the measured self-diffusion is 3–7 times slower than predictions for hard-spheres, with larger deviations at higher concentrations due to particle softness and hydrodynamic interactions. Pronounced caging effects are observed in the dynamics explaining the microscopic origin of the viscoelasticity of LDL solutions.
At the highest physiological concentration, the short- and long-time diffusion coefficients differ by a factor of 9, a remarkably large difference, indicative of dynamics approaching a glass-like state. Yet, yolk-plasma remains a viscous liquid. This pronounced separation reflects competing physical requirements: the need for dense, almost glass-like packing to maximize lipid storage, and sufficient elasticity to ensure structural stability. At the same time, molecular mobility must be maintained to prevent LDL coalescence and to enable efficient lipid release during embryogenesis.
RESULTS
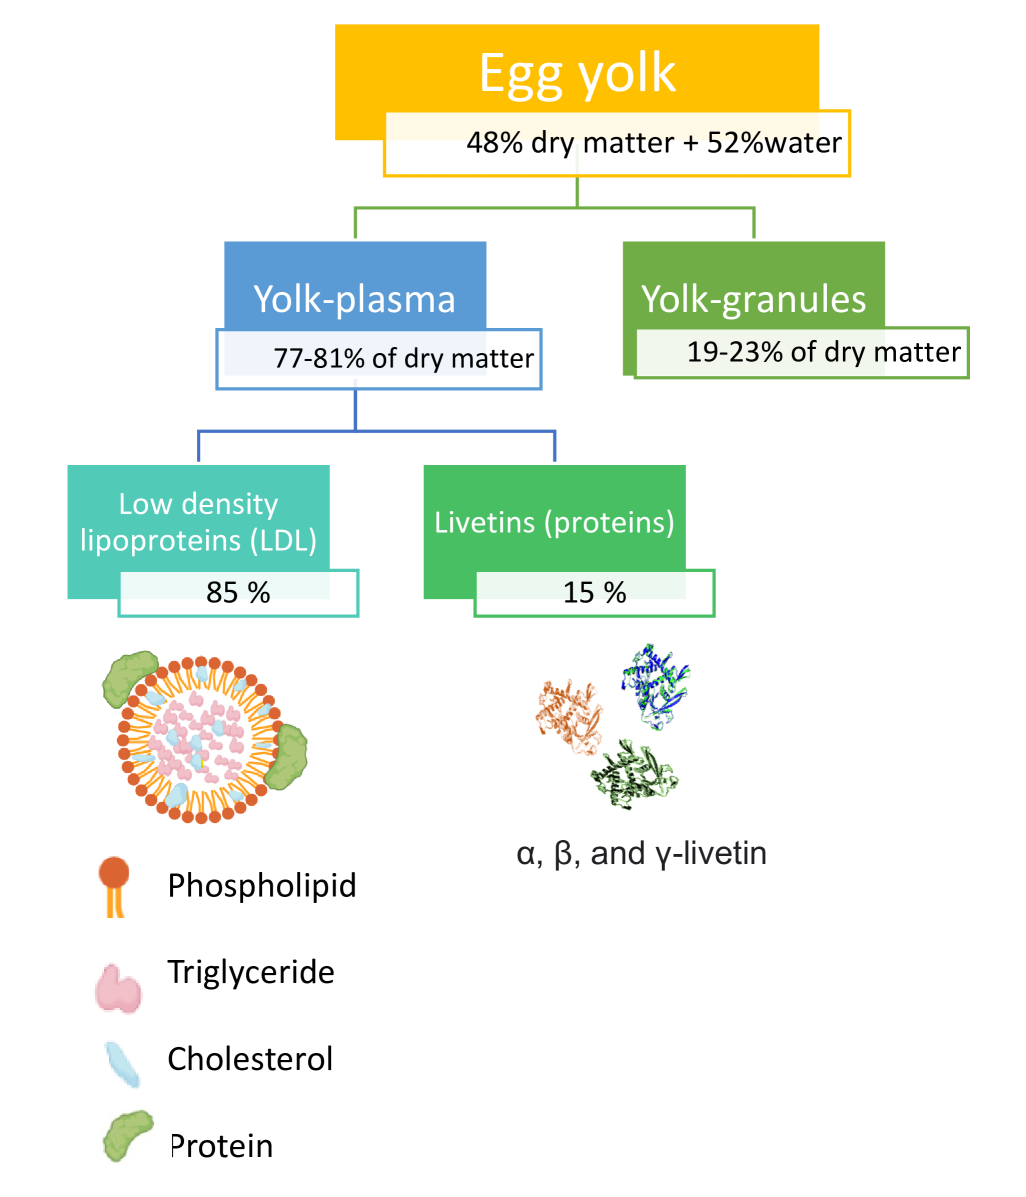
To investigate LDL diffusion under crowded conditions, we use yolk-LDLs in their native suspension form of yolk-plasma, which was extracted from egg yolk via centrifugation (see Materials and Methods for details). Figure 1A (left side) illustrates the two distinct fractions obtained after centrifugation: the translucent yolk-plasma fraction floating atop the opaque yolk-granule fraction. The yolk-plasma dry matter comprises approximately 85 wt yolk-LDL particles and 15 wt livetin proteins (?). The LDL particles exhibit a core-shell structure (Fig. 1A) with an average radius of 15.5 nm (see Fig. S3A). The original LDL concentration in yolk-plasma was 814 mg/ml and was further diluted to two lower concentrations of 668 mg/ml and 547 mg/ml (see Materials and Methods). Corresponding volume fractions were calculated from these weight fractions using the LDL density of 0.98 g/cm3 (?), with resulting values summarized in Table 1.
Samples were loaded into quartz-glass capillaries, sealed with epoxy glue, and probed using MHz-XPCS at the Materials Imaging and Dynamics (MID) instrument (?) at the European X-ray Free Electron Laser facility. The experimental X-ray pulse pattern is illustrated in Fig. 1B. X-ray pulse trains containing 310 pulses with a spacing of 222 ns interacted with the samples, and pulse-resolved scattering patterns were recorded by the Adaptive Gain Integrating Pixel Detector (AGIPD), positioned 7.68 m from the sample. This configuration provided access to wavevectors in the range = 0.05–1.1 nm-1 and enabled measurements on time scales from 0.22 to 69 µs, covering the interaction time scale ( = 2.5 µs) relevant to LDL particle dynamics. To prevent radiation damage, the X-ray intensity on the samples was carefully attenuated, and each sample spot was exposed only once to a single pulse train, maintaining the X-ray dose and dose rate below threshold levels. Further details on dose estimation and beam damage thresholds are provided in the Materials and Methods section and the supplementary information (SI). Statistically reliable data were ensured by averaging scattering patterns and correlation functions collected from thousands of different positions along each capillary. In addition to XPCS measurements, small-angle X-ray scattering (SAXS) measurements were performed at the ID02 beamline at the European Synchrotron Radiation Facility (ESRF), France. The XPCS measurements provided insights into both structural and dynamical characteristics of LDL suspensions, which we present starting with the structural analysis, followed by dynamic properties.
Structural information
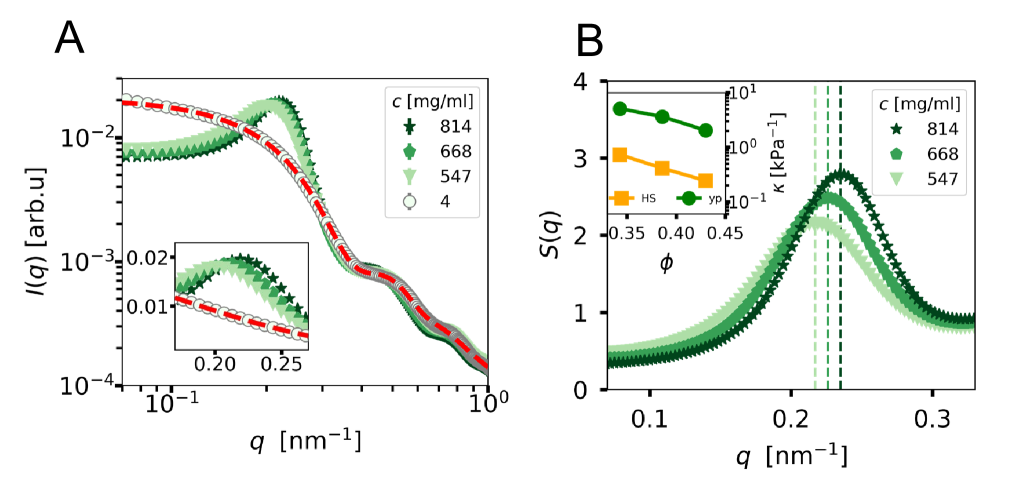
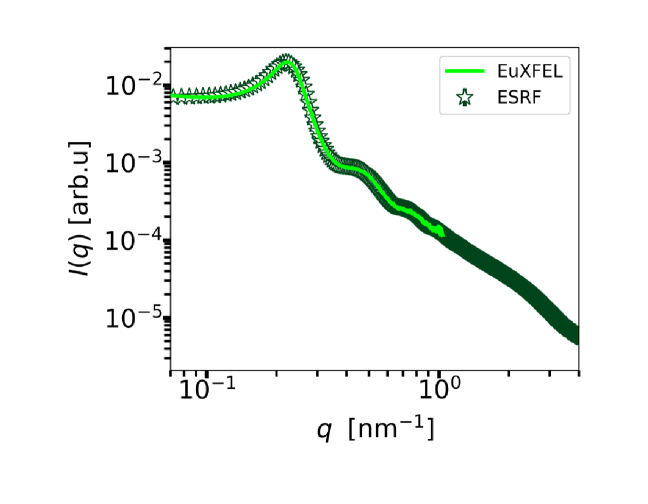
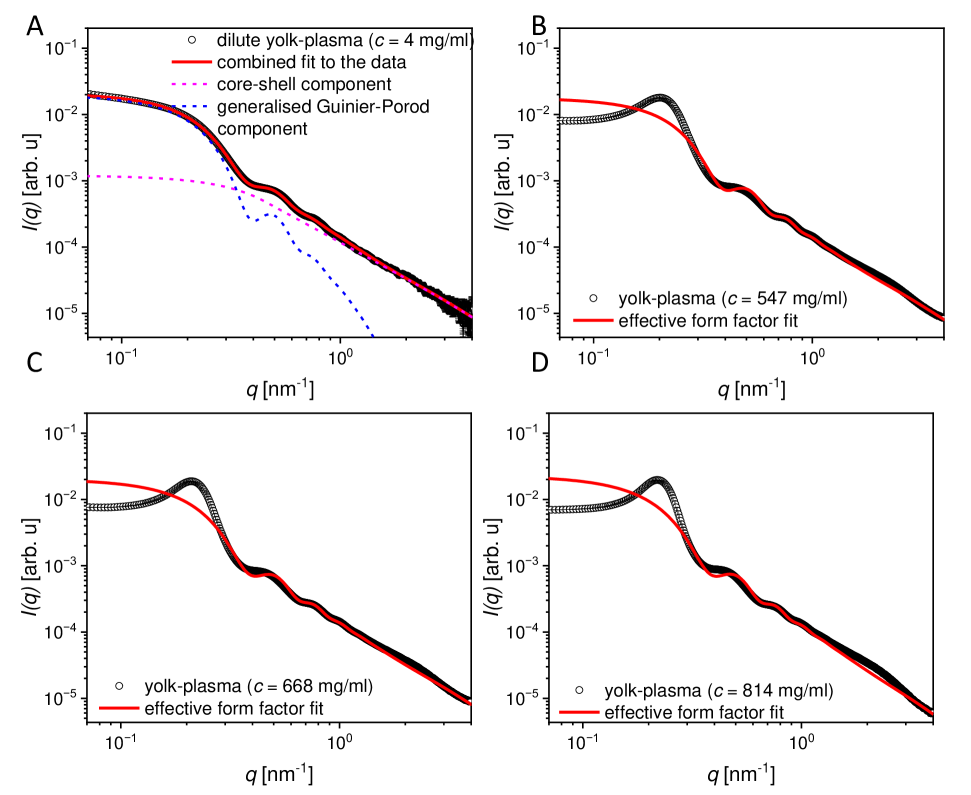
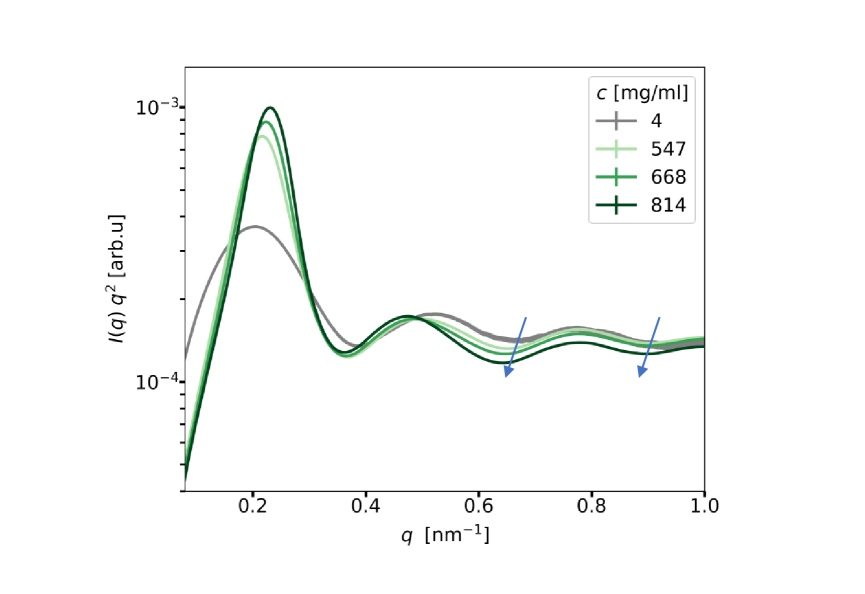
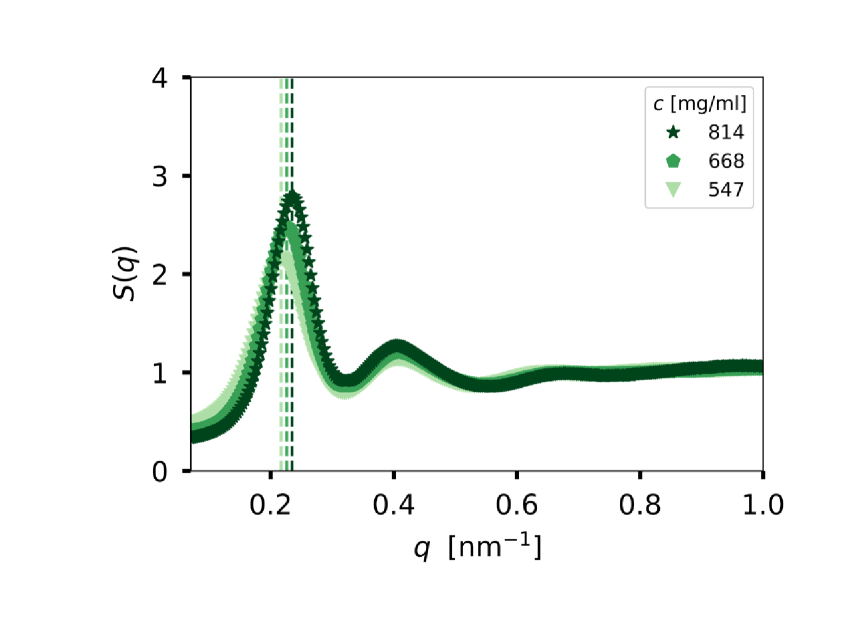
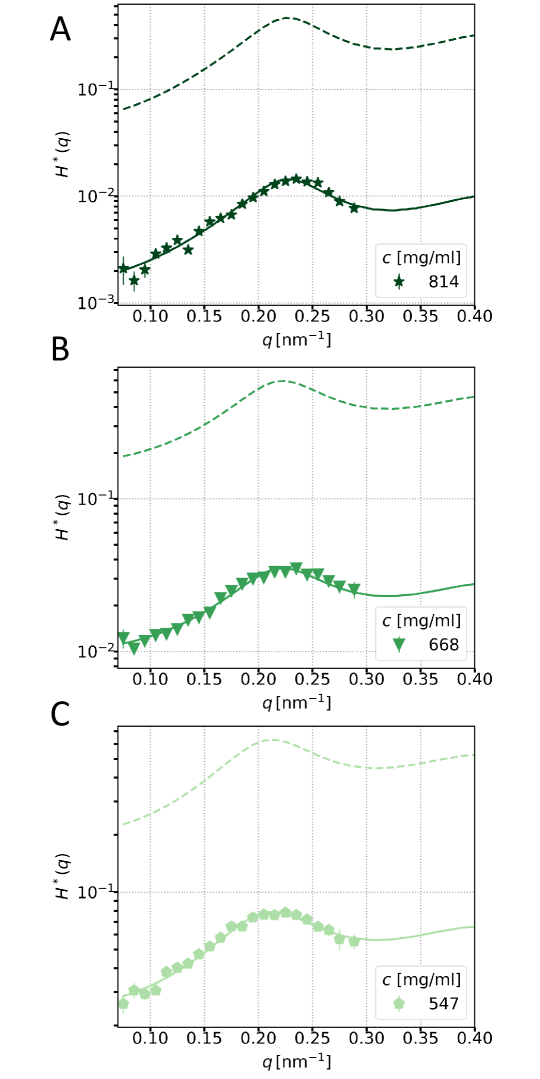
The normalized scattering intensity, , for four concentrations of egg yolk-plasma is shown in Fig. 2A. A pronounced peak at nm-1 is observed in the native yolk-plasma ( 814 mg/ml), reflecting strong interparticle correlations due to the high concentration of LDLs, which account for 85 wt of the plasma’s dry matter. The scattering profile of the most diluted sample ( 4 mg/ml) is modeled using a spherical core-shell particle with a core radius of 12 nm and a shell thickness of 3.5 nm, including a generalized Guinier-Porod contribution to capture the scattering contribution of apolipoproteins in the corona. The fit was performed using the SASfit software (?), with full details provided in the SI. As the concentration increases, a change in the size of LDL particles is expected due to their soft, deformable nature and the limited space available, consistent with prior observations of lipid vesicles (?) and micelles (?). As shown in Fig. S4, a subtle shift in the second and third minima of is observed, indicative of structural changes at high concentrations. To estimate the effective form factor at high concentrations, scattering data for nm-1 were modeled as described in the SI. Note that the scattering intensity measured at ESRF and EuXFEL exhibits good agreement, as shown in Fig. S2. For form factor modeling, the obtained from ESRF was used due to the extended -range, which provides improved resolution of structural features. Form factor modeling reveals a modest reduction in LDL size at the highest concentration ( = 814 mg/ml) relative to the dilute case ( = 4 mg/ml).
The structure factor, , is estimated from the experimental and respective form factor models given in Fig. S3B-D using Eq. 9. The estimated profiles of all concentrations are presented in Fig. 2B. The full profiles across the entire -range are given in Fig. S5, where at high values illustrates the expected convergence to unity.
| LDL | relative amount | relative amount | volume | ||||
| concen- | of yolk-plasma | of salt-buffer∗ | fraction, | ||||
| tration | in the solution | added | |||||
| [mg/ml] | [wt] | [wt] | [nm-1] | [kPa-1] | nm | ||
| 814 | 100 | 0 | 0.43 | 0.235 | 2.79 | 2 | 4.40.2 |
| 668 | 90 | 10 | 0.39 | 0.226 | 2.48 | 3.6 | 60.2 |
| 547 | 80 | 20 | 0.34 | 0.217 | 2.16 | 5.1 | 8.20.3 |
| ∗ 170 mM NaCl solution. | |||||||
The structure factor peak position, , shifts to lower -values with decreasing LDL concentration, indicating an increase in the interparticle correlation distance . As expected, the peak height of the structure factor, , increases with increasing LDL concentration (see Table 1). A detailed analysis of at low -values reveals a relatively high asymptotic limit, , for all LDL solutions with (Table 1). This contrasts with typical hard-sphere suspensions, which exhibit at similar volume fractions. The larger observed for LDL suspensions indicates increased isothermal compressibility (), as is directly proportional to (see Eq. 10). To confirm this finding, we estimated the compressibility of LDL solutions from experimental values and compared these results to theoretical predictions for hard-spheres at equivalent volume fractions (see inset of Fig. 2B). Remarkably, LDL suspensions exhibit approximately nine-fold higher compressibility than hard-sphere suspensions at comparable volume fractions, underscoring the inherent softness of LDL particles.
Wave-vector dependent dynamics
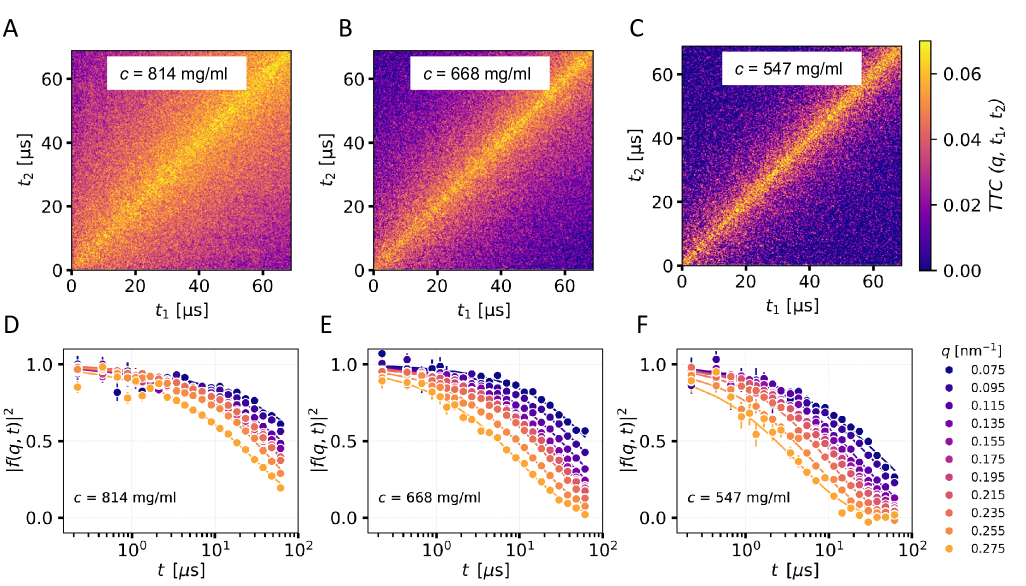
To estimate the relaxation times of the LDL particles, we calculated the two-time correlation function (?) defined as
| (1) |
where denotes the scattering intensity at pixel , and the angular brackets represent an average over pixels with the same value. The variables and are different experimental time points. Examples of the extracted maps at are shown in Fig. 3A-C for all three LDL concentrations studied. The width of the bright diagonal (yellow) region in the maps is inversely related to the relaxation rate of the particle dynamics. The narrowest diagonal for the least crowded sample (Fig. 3C) indicates rapid particle motion, while broader diagonals observed for higher concentrations (Fig. 3A-B) clearly demonstrate a substantial slowing of particle dynamics with increased crowding.
From the maps, we obtained intensity autocorrelation functions by horizontal averaging (?). These were modeled using:
| (2) |
where is the intermediate scattering function, is the -dependent relaxation rate, is the speckle contrast, and is the Kohlrausch-Williams-Watts (KWW) exponent (?), describing the shape of the correlation function.
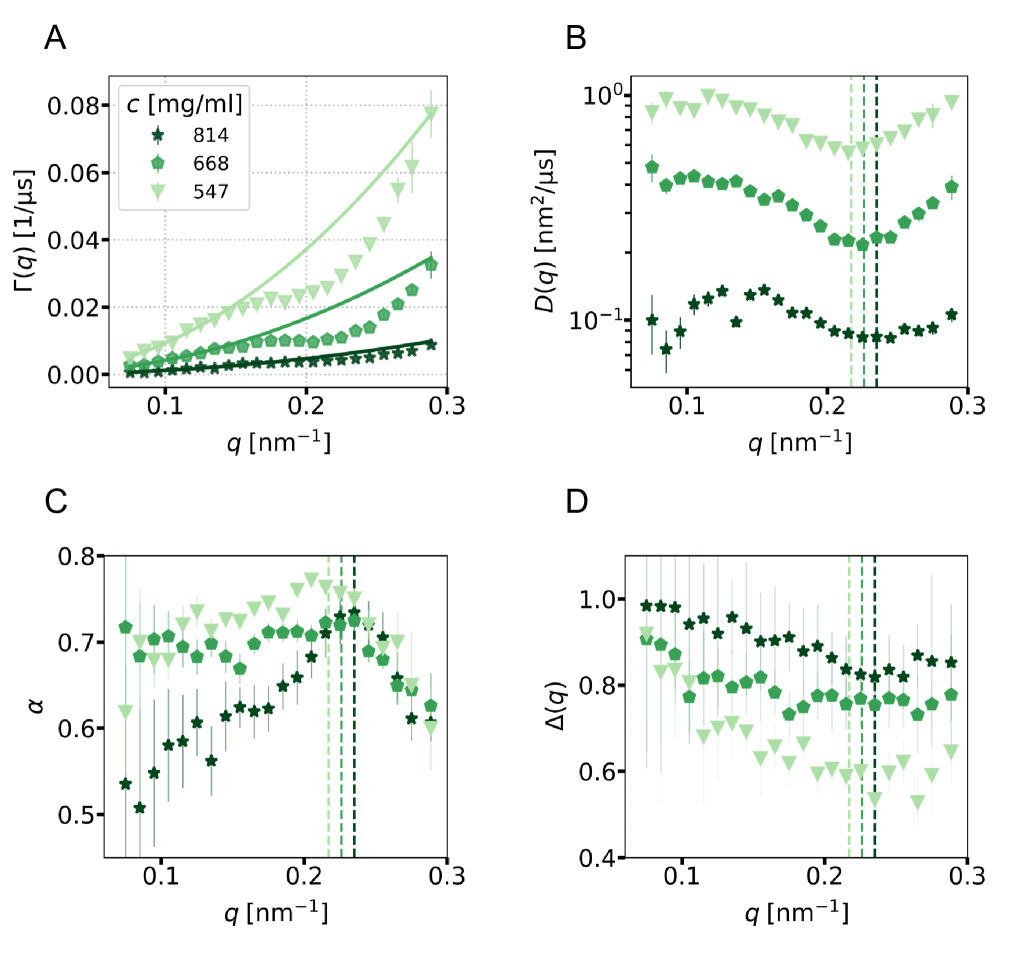
Representative intermediate scattering functions and corresponding fits are shown in Fig. 3D-F. We observe a pronounced stretching of the correlation functions with KWW exponents varying from 0.5 to 0.8 (Fig. 4C), indicating greater stretching (lower ) at higher concentrations. From the stretched correlation functions we extract mean relaxation rates via , where denotes the Gamma function (?, ?). The resulting values are depicted in Fig. 4A, and we observe a decrease of with increasing concentration, indicating a slowdown in the particle dynamics as expected. In all samples, we find a (solid lines in Fig. 4A) behavior at low values, which is typical of Brownian dynamics. However, significantly deviates from the Brownian behavior at values near the structure factor peak at . Such modulations in around the are typical signatures of collective relaxation phenomena (de Gennes narrowing: ) observed in dense fluids, protein solutions, colloids, and glasses (?, ?, ?, ?, ?).
Next, we extracted the -dependent collective diffusion coefficient using the relation (Fig. 4B). The resulting exhibits a minimum at , indicating that density fluctuations with wavelengths corresponding to the typical cage structures are slowed down relative to other modes. This behavior suggests a coupling to the local structure of the suspension. Given that the interaction time of LDLs ( µs) falls within the experimental time window (0.22–69 µs), we are indeed probing the cage relaxation dynamics of LDLs (Fig. 1A). At the peak of the static structure factor, these modes correspond to nearest-neighbor distances, thus providing access to fluctuations of the dynamic cages formed by neighboring particles.
We also examine the wavevector-dependence of the KWW-exponent as shown in Fig. 4C. For , shows a weak decreasing trend with increasing concentration. Interestingly, the values exhibit an -like modulation near the structure factor peak (), with the effect becoming more pronounced at the highest LDL concentration. Similar behavior has been observed in metallic glasses near the peak (?, ?, ?). We attribute this modulation to pronounced memory effects in the LDL dynamics on time scales (?, ?, ?), leading to a stretched exponential decay of the intermediate scattering function and consequently to .
This interpretation can be understood by considering Eq. S4, which relates to the collective memory function. In the short-time regime (), the memory term (i.e., the integral involving ) is negligible, resulting in an exponential decay of (?). However, at longer times, the memory term becomes significant, capturing the influence of past particle configurations on current dynamics, a hallmark of caging. The degree of stretching in , and thus the deviation of from unity, reflects the strength of these memory effects. A quantitative measure of this behavior is given by the reduced memory function (or non-exponentiality function) (?, ?, ?)
| (3) |
where denotes the relaxation rate in the short-time limit during which decays exponentially (?). To estimate , Eq. 2 was fitted to the data with = 1 for (see SI for details on the extraction procedure). Weak and strong memory effects are characterized by and , respectively. Fig. 4D shows the experimentally extracted reduced memory function for LDLs. Overall, increases with LDL concentration, indicating enhanced memory effects in denser suspensions. Additionally, in all samples, decreases with increasing , and at the highest concentration, exhibits a local minimum near the peak position. This feature is consistent with previous experimental observations and theoretical predictions based on mode-coupling approximations for moderately polydisperse colloidal suspensions (?, ?, ?).
DISCUSSION
In the absence of hydrodynamic interactions, the wave-vector dependence of would entirely result from the structural correlations, following the relation (?). However, comparison of and in Fig. S8 reveals significant discrepancies in their -dependence, indicating the presence of strong hydrodynamic interactions.
Given the lack of theoretical expressions for valid on the interaction time scale, we introduce an effective hydrodynamic function to interpret our results. This function mirrors the familiar form for short-time dynamics (?, ?):
| (4) |
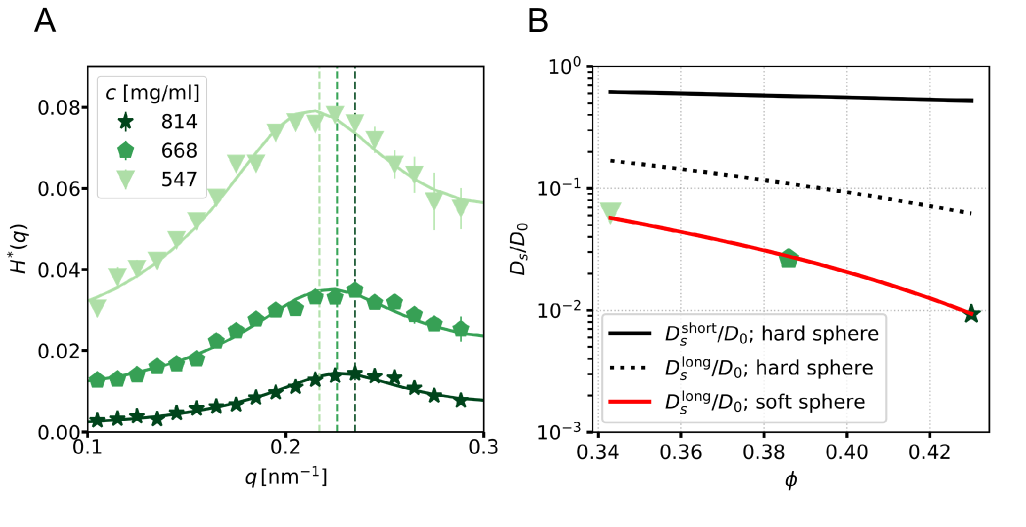
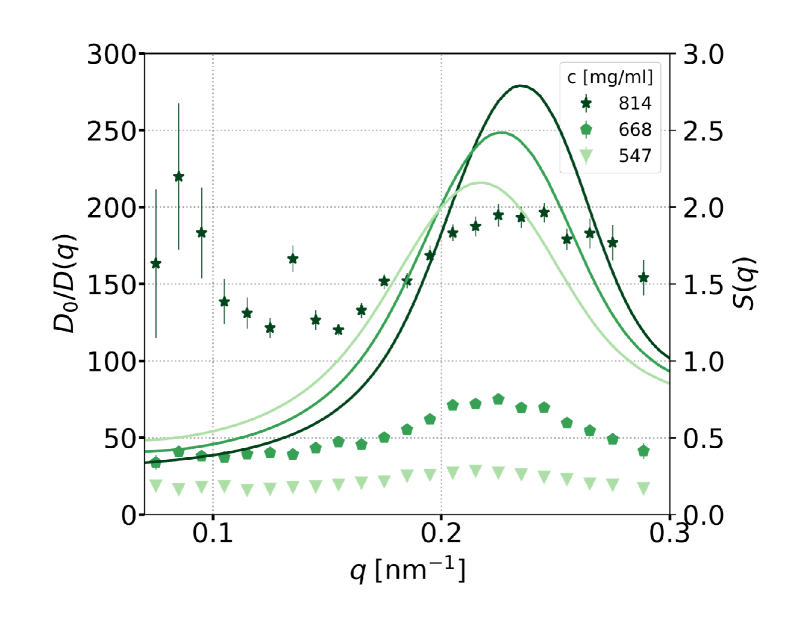
where captures hydrodynamic interactions on the intermediate time scales relevant to our experiment. It is related to the short-time hydrodynamic function by , where and are the long- and short-time self-diffusion coefficients, respectively. Rescaled hydrodynamic functions of this kind have previously been employed to model data from hemoglobin solutions (?) and colloidal suspensions (?, ?). This approach enables us to extract from experimental data using Eq. 4 (Fig. 5A). We find that the peak positions of closely align with those of , as indicated by the vertical dashed lines in Fig. 5A. Moreover, the -dependence of is well captured by the -formalism of Beenakker and Mazur (?, ?) (see Materials and Methods and Fig. S9). Interestingly, this implies that the -dependence of the collective diffusion coefficient on intermediate time scales—where interparticle interactions dominate—is similar to that observed at short times, where hydrodynamic interactions are dominant. Comparable scaling behavior has been reported for colloids within restricted -intervals (?), and more recently by us in dense ferritin solutions (?).
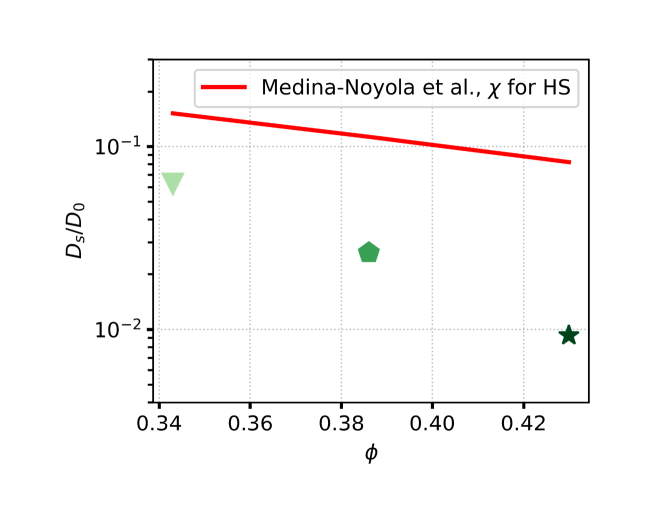
The long wave-vector limit of the short-time hydrodynamic function , yields the normalized self-diffusion coefficient (?). Similarly, for the effective hydrodynamic function ,
the long- limit gives . We extract this quantity from our experimental data and plot as a function of volume fraction in Fig. 5B.
In our recent study on ferritin (?), the long-time self-diffusion followed the predictions of the hard-sphere-based model by Medina-Noyola (?) and van Blaaderen et al. (?), in which direct and hydrodynamic interactions are decoupled. In this framework, hydrodynamic interactions influence only the short-time self-diffusion, while direct interactions are described through the contact value of the pair correlation function.
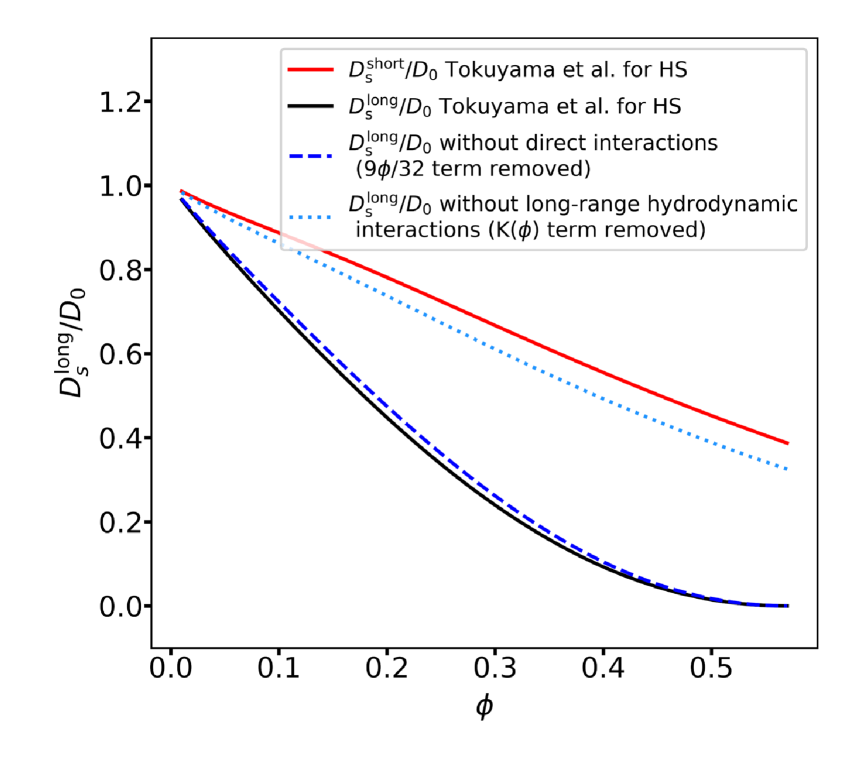
However, this model fails to account for the significantly reduced values of observed for LDL particles (see Fig. S10). This discrepancy arises from neglecting particle softness and long-range hydrodynamic interactions. These effects are incorporated in the theoretical treatment by Tokuyama et al. (?, ?), which provides an expression for the volume-fraction dependence of that includes both short- and long-range hydrodynamic interactions:
| (5) |
where is the interparticle interaction potential. For a hard-sphere potential, , while for a soft repulsive interaction, such as an inverse power-law potential , , with denoting the effective particle diameter. The expression for is provided in the Materials and Methods section. The parameter represents a singular volume fraction which is determined by the many-body long-range hydrodynamic interactions between particles. The numerator term, , arises from the coupling between direct interactions and short-range hydrodynamic interactions. The function , which scales strongly with volume fraction, encapsulates many-body correlation effects due to long-range hydrodynamic interactions and is the primary contributor to the significant reduction in (see Fig. S14) (?).
The prediction of for this model, assuming hard-sphere interactions only (dotted line in Fig. 5B), overestimates the diffusion constants also by a factor of 3–7. In contrast, for soft-spheres aligns with the data (red line in Fig. 5B), highlighting the critical role of particle softness in limiting the self-diffusion coefficients of LDL particles in egg yolk-plasma. Furthermore, the critical volume fraction obtained from the fit is , which is considerably lower than the predictions for hard-spheres () (?). Interestingly, similarly low critical volume fractions have been reported for other biomolecules, such as bovine serum albumin (BSA) () (?) and lysozyme () (?). Notably, the diffusion coefficients of BSA were also found to match predictions for soft spheres (?), further illustrating the impact of particle softness on both diffusion coefficients and critical volume fractions. We note that this observation is in good agreement with the finding that the isothermal compressibility of the LDL particle solutions is 9 times higher than that of hard-spheres (inset of Fig. 2B), indicating the increased particle softness and hence supports the findings here.
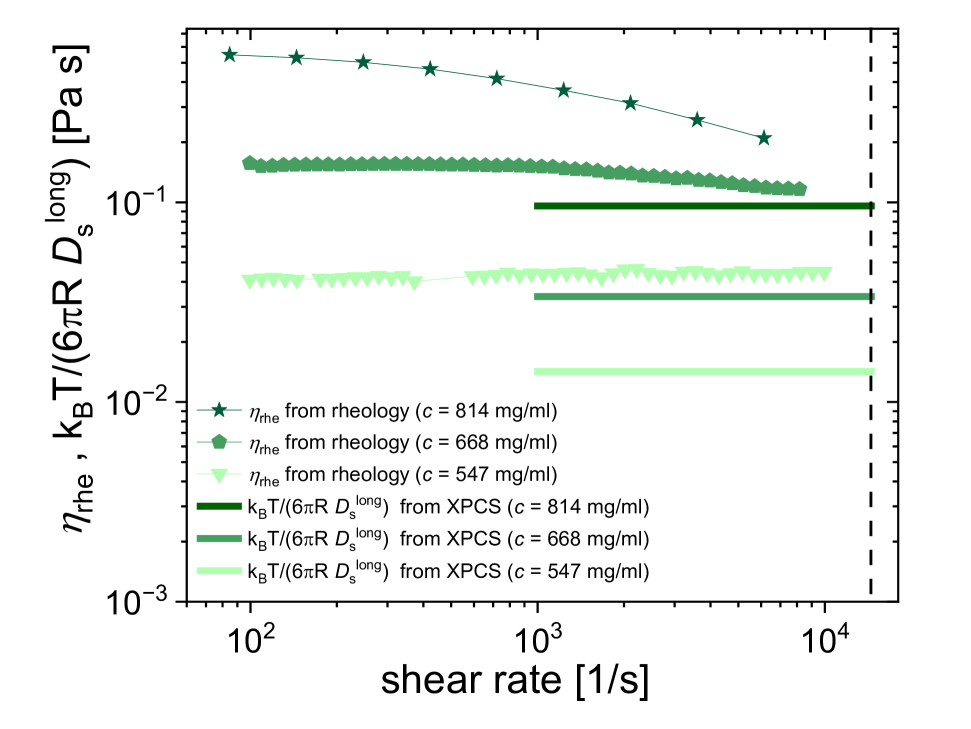
We examine the validity of the Stokes–Einstein relation by comparing the effective viscosity () estimated from XPCS with viscosity values obtained from rheology measurements in Fig. S13. The shear-dependent viscosity is consistently slightly higher than that estimated from XPCS utilizing values. This behavior has previously also been observed in colloidal systems (?) and small organic compounds (?) at high concentrations near the glass transition. This decoupling of momentum and mass transport, and hence deviations from the Stokes-Einstein relation, is a hallmark of dynamics approaching the glass transition (?).
Additional insight into the nature of the stretched correlation function can be obtained by evaluating the mean-square displacement (MSD) from the intermediate scattering function. For this, we first extract the collective width function, , from using the expression (?, ?),
| (6) |
The incoherent MSD can then be estimated from for using the relation (?, ?, ?)
| (7) |
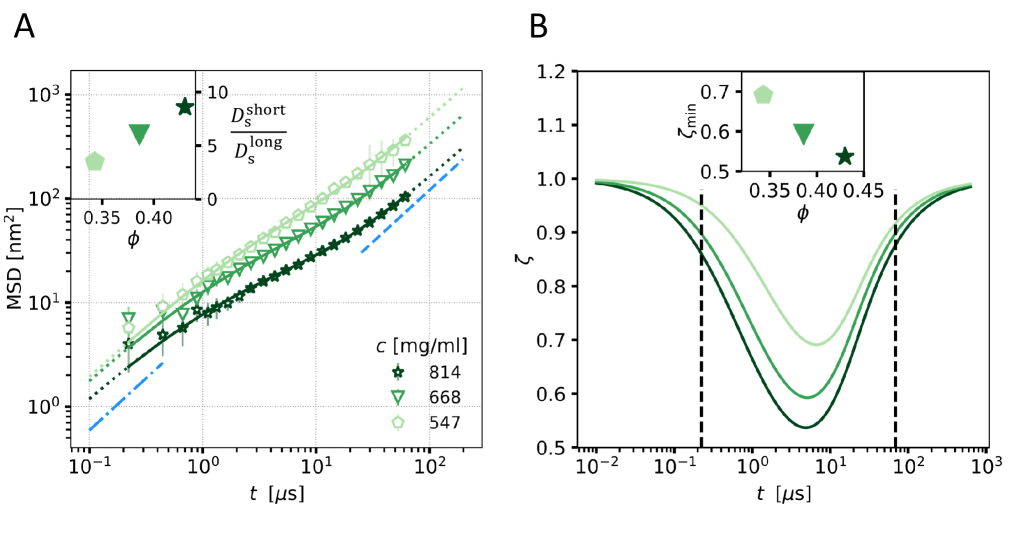
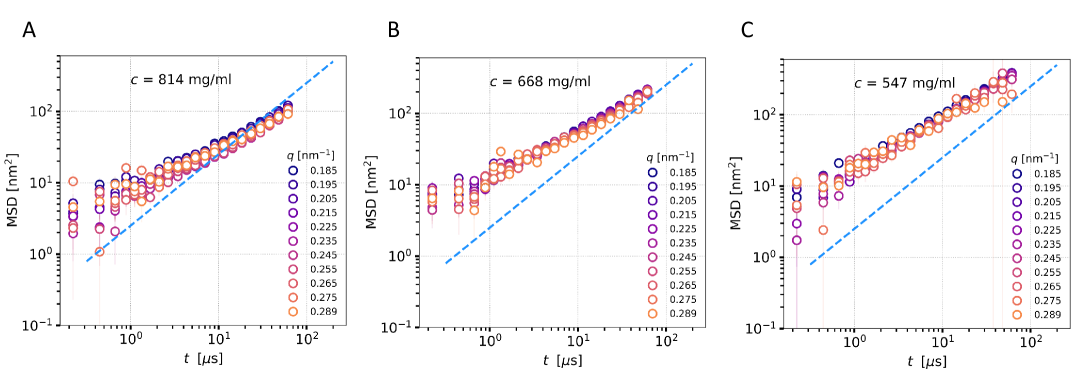
which is an empirical expression from experiments on colloidal hard-sphere suspensions (?, ?). The validity of this expression for yolk-plasma solutions is confirmed by the collapse of all MSD curves for as shown in Fig. S11. Thus, averaging all MSD values displayed in Fig. S11 yields a single representative MSD curve for each sample, as shown in Fig. 6A.
In the short- and long-time regimes, a diffusive behavior (MSD ) is expected, denoted by the blue dash-dotted and dashed lines (Fig. 6A). However, at time scales of , the MSD displays a sub-diffusive regime with MSD (). In other words, we observe a transition from short-time to long-time diffusive behavior on the experimentally investigated time scales. This non-linear behavior of the MSD is in good agreement with the pronounced stretching of the correlation functions observed (Fig. 4).
As the concentration increases, the MSD decreases, indicating the expected slowdown associated with crowding. Furthermore, the distinction between short- and long-time regimes becomes increasingly pronounced at higher concentrations. To quantify this effect, the MSD curves are modeled using Eq. 15, and the corresponding values are extracted (inset of Fig. 6B). Evidently, increases significantly with rising volume fraction, mirroring the trend observed in hard-sphere colloidal systems (?), though with comparatively smaller values.
At the highest concentration, the diffusion coefficient differs by a factor of . This value is similar to that seen in monodisperse colloids near freezing (?, ?), which suggests the LDLs are packed very densely. This dense packing serves two primary biological functions: it maximizes the storage of vital lipids for the developing embryo and helps maintain the structural integrity of the yolk. Despite the marked reduction in diffusion rates, the yolk remains in a liquid state (Fig. S12B), indicating a sluggish liquid phase. This condition is potentially optimal for biological purposes—stable enough to preserve lipid storage while remaining fluid enough for nutrient access by the embryo when required.
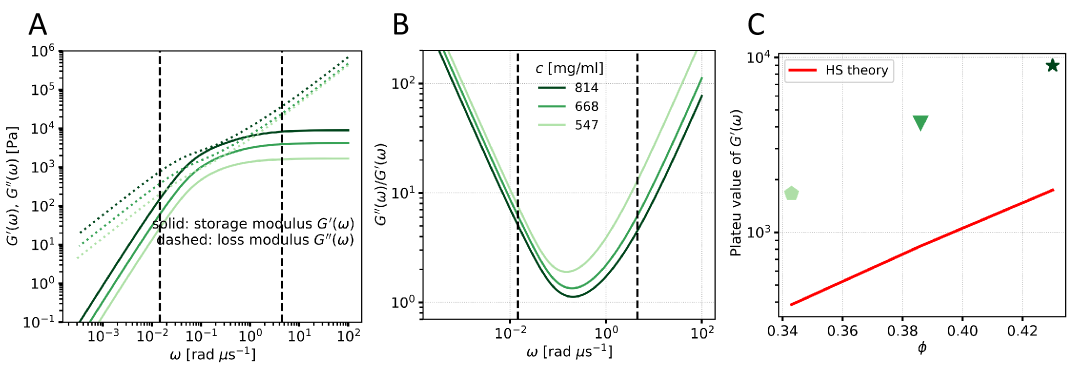
Further, we estimate the viscoelastic properties of yolk-plasma samples from the time-dependent MSD fit, following the formalism presented in ref. (?). The resulting estimates for the storage and loss moduli are shown in Fig. S12. The loss modulus exceeds the storage modulus, confirming the liquid-like nature of the samples. A comparison of the theoretical prediction for the storage modulus for hard-spheres (Eq. S5) with the plateau value of the storage modulus of LDL particles shown in Fig. S12C reveals a clear discrepancy with the hard-sphere model significantly underestimating the measured storage modulus. This is likely attributed to the enhanced elasticity of the cages formed by the strongly localized LDL particles at higher concentrations, indicating stronger interparticle interactions than expected for hard-sphere suspensions. The elevated storage modulus also suggests a pronounced resistance to deformation of the local cage structure, contributing to the overall stability of egg yolk-plasma.
More information on the anomalous nature of diffusion in the intermediate time scales can be obtained by extracting the anomalous exponent using
| (8) |
The -values estimated from the MSD fit for all samples are displayed in Fig. 6B. Within the experimentally accessible time scales (denoted by the vertical dashed lines), remains consistently below 1, confirming the sub-diffusive nature of the particle dynamics during caging. As the volume fraction increases, decreases, indicating a stronger degree of anomalous behavior due to crowding and interactions.
The strength of this caging effect is quantified by the minimum value observed within the measurement time window, as shown in the inset of Fig. 6B. As expected, the caging strength increases with volume fraction, highlighting the impact of crowding on the motion of soft LDL particles. The cage size, defined as , is estimated from the MSD at the cage rearrangement time —the point where the MSD starts to rise from its plateau (?). This plateau corresponds to the minimum values, making it a good reference for determining (see Table 1). As the volume fraction increases, follows a trend similar to that observed in hard-sphere colloids but with notably smaller values (?). This suggests that LDL particles achieve comparable ratios to hard-spheres, albeit at significantly lower volume fractions.
SUMMARY
In summary, we investigated the diffusion of yolk LDLs in concentrated solutions at molecular length and interaction time scales, employing MHz-XPCS at EuXFEL. Our findings reveal that LDLs exhibit non-Brownian dynamics in the crowded environment of egg yolk-plasma. The stretched exponential decay observed in the autocorrelation functions suggests the presence of memory effects, originating from both direct particle interactions and long-range hydrodynamic interactions. The long-time self-diffusion coefficients of LDLs, estimated from the hydrodynamic function at three different concentrations, were found to be 3–7 times lower than the predictions for hard-sphere suspensions. This highlights the limitations of the hard-sphere colloidal model for describing the dynamics of soft biomolecules. Instead, the self-diffusion of LDLs in crowded conditions aligns well with the theoretical expectations for soft spheres, where long-range hydrodynamic interactions play a significant role. Additionally, in pure yolk-plasma, we observe a pronounced diffusion ratio () alongside a high storage modulus, indicative of dense LDL packing and structural stability. We anticipate that this dense arrangement optimizes lipid storage while maintaining a sluggish liquid state that supports controlled nutrient release to the developing avian embryo. Overall, our results demonstrate that seemingly common biological systems, such as LDL in egg yolk, exhibit complex diffusive dynamics driven by the interplay of hydrodynamic interactions and soft interparticle potentials.
MATERIALS AND METHODS
Sample preparation
The egg yolk used in this study was obtained from a hen egg purchased at a supermarket. The yolk-plasma samples used for the experiments are prepared in five steps. Step 1: The yolk was separated from the egg white using a steel strainer and then washed in Milli-Q water to eliminate any excess albumen on the yolk. Step 2: The cleaned yolk was placed on a filter paper to remove any excess water or albumen on the surface. Rolling the yolk on the filter paper many times resulted in an almost complete elimination of water and albumen. Step 3: A plastic pipette tip was used to puncture the vitelline membrane, and the yolk was collected in a 15 ml Falcon tube. Step 4: The yolk was centrifuged (?) at 7197 for 4 days to separate the yolk-plasma from the yolk-granules. During centrifugation, the heavier entities in the yolk (called yolk-granules) settled, leaving behind a yellow-translucent liquid known as egg yolk-plasma (see Fig. 1A). Step 5: The total dry mass content of the yolk-plasma was determined by complete water removal (dried under fume hood) and subsequent weighing of the residue, yielding a value of 49 wt. Based on prior compositional analyses, LDLs account for approximately 85 wt of the dry matter (?), indicating that undiluted yolk-plasma contains 814 mg/ml of LDLs.
To prepare samples of lower LDL concentration, the yolk-plasma was diluted to 90 wt and 80 wt using NaCl buffer (170 mM), resulting in final LDL concentrations of 668 mg/ml and 547 mg/ml, respectively. The exact amounts of buffer added for each dilution are listed in Table 1.
All samples were stored at 5 oC until use. For XPCS measurements, the yolk-plasma solutions were loaded into 1.5 mm-diameter quartz-silica capillaries and vacuum-sealed with epoxy glue. All XPCS experiments were conducted at a temperature of 25 oC.
Estimation of and isothermal compressibility
The scattering intensity provided in this paper, , where and are the scattering intensities of sample and water, respectively, were obtained by azimuthal integration of the scattering pattern from the 2D detector. In yolk-plasma, the LDLs are dispersed in water, hence, the water background is subtracted to get the scattering contribution of LDLs. Normalization of is performed such that the high- scattering intensities of higher concentrations are made to coincide with those of the = 4 mg/ml sample. The effective structure factor of the sample is estimated using,
| (9) |
where is the effective form factor (see Fig. S3B-D).
The isothermal compressibility of LDL particles is estimated by,
| (10) |
where , , and are the number density, Boltzmann constant, and sample temperature, respectively. The experimental is estimated by a linear extrapolation of in a -range of 0.06–0.08 nm-1 to . The number density is estimated by dividing the volume fraction by the volume of a particle with being the radius obtained from the form factor fits given in Fig. S3B-D.
Estimation of and
The diffusion coefficient of LDL particles in the dilute limit is estimated by the Stokes-Einstein relation,
| (11) |
where = 298 K, and = 15.5 nm are the temperature of the system, viscosity of water, and radius of the LDL particles in dilute solution, respectively. However, is the effective diffusion coefficient of LDL particles in dilute solution estimated using the Stokes-Einstein relation, considering the effective radius of LDL particles at different concentrations (Fig. S3B-D).
X-ray experimental parameters
XPCS measurements were conducted at the MID instrument (?) of the EuXFEL in a SAXS configuration. The experiments utilized the full self-amplified spontaneous emission (SASE) with a mean photon energy of 10 keV and a focused beam size of µm. The EuXFEL delivers X-ray pulse trains at a repetition rate of 10 Hz. Each train in the experiment contained 310 individual pulses with an intra-train repetition rate of 4.5 MHz, corresponding to a pulse spacing of 222 ns. This configuration allows for a maximum accessible delay time of approximately 69 µs per train, enabling access to fast dynamics in the measured correlation functions.
Scattered X-rays were recorded using the Adaptive Gain Integrating Pixel Detector (AGIPD), featuring a pixel size of 200 µm and positioned 7.68 m downstream from the sample. The primary dataset was acquired during experiment number 5397, while additional supporting data were collected during experiment 6996, which employed slightly different beam parameters. Full details of both experimental configurations are provided in the SI.
To minimize beam-induced effects, the X-ray intensity was carefully controlled using silicon single crystals and chemically vapor-deposited (CVD) diamond attenuators of varying thicknesses. Additionally, to avoid cumulative sample damage, the sample was continuously translated perpendicular to the beam at a speed of 0.4 mm/s. This ensured that each XPCS measurement was performed on a fresh volume of the sample, with negligible motion during the duration of a single pulse train.
The SAXS experimental parameters at ESRF (beamline ID02) are provided in Table. S1.
Hydrodynamic function
The short-time hydrodynamic function can be decomposed into a self-part and a -dependent part using,
| (12) |
where is the self-diffusion coefficient and the -dependent part of hydrodynamic function is given by (?),
| (13) |
where is the cosine of the angle between the wave vectors and and is a known function independent of particle correlation and is given in ref. (?). For , goes to zero and becomes the normalized short-time translational self-diffusion coefficient . The -dependent part was estimated using the Jscatter (?) Python library, where the experimental effective structure factor of the samples was given as input.
Theoretical predictions of
The theoretical prediction of by M. Tokuyama and I. Oppenheim (?), incorporating both short-range and long-range hydrodynamic interactions and their coupling, is given by,
| (14) |
The first, second, and third terms in correspond to contributions from the long-range hydrodynamic interaction, short-range hydrodynamic interaction, and their coupling, respectively (?).
Modeling of MSD
An expression to mean-squared displacement for concentrated, equilibrium suspensions of hard-spheres is given by Tokuyama et al. (?, ?),
| (15) |
where is a free parameter to be determined and is related to the static properties in the equilibrium suspension (?).
Assessment of X-ray beam-induced effects
In XPCS measurements, X-ray beam-induced damage is characterized by the changes in the native structure and equilibrium dynamics (?). To determine the critical dose and dose rate for yolk-plasma, we performed XPCS measurements at various incident X-ray intensities such that the dose rate on the sample is different for the same exposure time. The results of beam-induced changes in the structure and dynamical parameters of yolk-plasma are given in the SI. The yolk-plasma was found to be stable until a critical dose of 20 kGy, and hence all measurements shown in this manuscript are performed below the critical threshold of 20 kGy using a dose rate of 0.23 kGy/µs. During the measurement, X-ray-induced heating led to an approximate temperature increase of 2 K in the sample (see SI for further details).
References and Notes
- 1. J. W. Gofman, et al., The role of lipids and lipoproteins in atherosclerosis. Science 111 (2877), 166–186 (1950).
- 2. A. Saari, W. Powrie, O. Fennema, Isolation and characterization of low-density lipoproteins in native egg yolk plasma. J. Food Sci. 29 (3), 307–315 (1964).
- 3. T. Li, Y. Jin, J. Wu, Z. Ren, Beyond energy provider: multifunction of lipid droplets in embryonic development. Biol. Res. 56 (1), 38 (2023).
- 4. B. A. Ference, E. Braunwald, A. L. Catapano, The LDL cumulative exposure hypothesis: evidence and practical applications. Nat. Rev. Cardiol. 21 (10), 701–716 (2024).
- 5. H. J. Carpenter, M. H. Ghayesh, A. C. Zander, P. J. Psaltis, Effect of Nonlinear Blood Viscosity on LDL Transport and Fluid-Structure Interaction Biomechanics of a Multi-stenosis Left Circumflex Coronary Artery, in Advances in Nonlinear Dynamics: Proceedings of the Second International Nonlinear Dynamics Conference (NODYCON 2021), Volume 1 (Springer) (2022), pp. 39–48.
- 6. C. Zhu, Y. Xia, Biomimetics: reconstitution of low-density lipoprotein for targeted drug delivery and related theranostic applications. Chem. Soc. Rev. 46 (24), 7668–7682 (2017).
- 7. C. Wang, et al., Transporting mitochondrion-targeting photosensitizers into cancer cells by low-density lipoproteins for fluorescence-feedback photodynamic therapy. Nanoscale 13 (2), 1195–1205 (2021).
- 8. A. Jutkova, D. Chorvat, P. Miskovsky, D. Jancura, S. Datta, Encapsulation of anticancer drug curcumin and co-loading with photosensitizer hypericin into lipoproteins investigated by fluorescence resonance energy transfer. Int. J. Pharm. 564, 369–378 (2019).
- 9. L. Dai, et al., Low-density lipoprotein: a versatile nanoscale platform for targeted delivery. Nanoscale Adv. 5 (4), 1011–1022 (2023).
- 10. Y.-L. Sun, B.-Q. Ge, M.-Z. Li, L. Wang, Z.-X. Chen, The effect of macromolecular crowding degree on the self-assembly of fatty acid and lipid hydrolysis. npj Sci. Food. 7 (1), 39 (2023).
- 11. G. Nettesheim, et al., Macromolecular crowding acts as a physical regulator of intracellular transport. Nat. Phys. 16 (11), 1144–1151 (2020).
- 12. B. Alric, C. Formosa-Dague, E. Dague, L. J. Holt, M. Delarue, Macromolecular crowding limits growth under pressure. Nat. Phys. 18 (4), 411–416 (2022).
- 13. M. Grimaldo, F. Roosen-Runge, F. Zhang, F. Schreiber, T. Seydel, Dynamics of proteins in solution. Q. Rev. Biophys. 52, e7 (2019).
- 14. A. Girelli, et al., Microscopic dynamics of liquid-liquid phase separation and domain coarsening in a protein solution revealed by X-ray photon correlation spectroscopy. Phys. Rev. Lett. 126 (13), 138004 (2021).
- 15. N. D. Anthuparambil, et al., Salt induced slowdown of kinetics and dynamics during thermal gelation of egg-yolk. J. Chem. Phys. 161 (5) (2024).
- 16. R. Ramalingam, G. Jiang, H. Larjava, L. Häkkinen, Macromolecular crowding regulates matrix composition and gene expression in human gingival fibroblast cultures. Sci. Rep. 13 (1), 2047 (2023).
- 17. S. Bucciarelli, et al., Dramatic influence of patchy attractions on short-time protein diffusion under crowded conditions. Sci. Adv. 2 (12), e1601432 (2016).
- 18. G. Nawrocki, P.-h. Wang, I. Yu, Y. Sugita, M. Feig, Slow-down in diffusion in crowded protein solutions correlates with transient cluster formation. J. Phys. Chem. B 121 (49), 11072–11084 (2017).
- 19. M. K. Braun, et al., Crowding-controlled cluster size in concentrated aqueous protein solutions: structure, self-and collective diffusion. J. Phys. Chem. Lett. 8 (12), 2590–2596 (2017).
- 20. D. Lavalette, C. Tétreau, M. Tourbez, Y. Blouquit, Microscopic viscosity and rotational diffusion of proteins in a macromolecular environment. Biophys. J. 76 (5), 2744–2751 (1999).
- 21. F. Zosel, A. Soranno, K. J. Buholzer, D. Nettels, B. Schuler, Depletion interactions modulate the binding between disordered proteins in crowded environments. Proc. Natl. Acad. Sci. U.S.A. 117 (24), 13480–13489 (2020).
- 22. M. Heinen, et al., Viscosity and diffusion: crowding and salt effects in protein solutions. Soft Matter 8 (5), 1404–1419 (2012).
- 23. M. Grimaldo, et al., Protein short-time diffusion in a naturally crowded environment. J. Phys. Chem. Lett. 10 (8), 1709–1715 (2019).
- 24. C. Beck, et al., Short-time transport properties of bidisperse suspensions of immunoglobulins and serum albumins consistent with a colloid physics picture. J. Phys. Chem. B. 126 (38), 7400–7408 (2022).
- 25. D. Bonn, W. K. Kegel, Stokes–Einstein relations and the fluctuation-dissipation theorem in a supercooled colloidal fluid. J. Chem. Phys. 118 (4), 2005–2009 (2003).
- 26. S. F. Swallen, M. Ediger, Self-diffusion of the amorphous pharmaceutical indomethacin near T g. Soft Matter 7 (21), 10339–10344 (2011).
- 27. R. Klein, W. Hess, Mass-diffusion and self-diffusion properties in systems of strongly charged spherical particles. Faraday Discuss. Chem. Soc. 76, 137–150 (1983).
- 28. G. Nägele, P. Baur, R. Klein, Non-exponential relaxation of density fluctuations in strongly interacting colloidal suspensions. Physica A: Stat. Mech. Appl. 231 (1), 49–61 (1996), colloid and Interface Science: Trends and Applications.
- 29. P. Baur, G. Nägele, R. Klein, Nonexponential relaxation of density fluctuations in charge-stabilized colloids. Phys. Rev. E 53, 6224–6237 (1996).
- 30. E. R. Weeks, D. A. Weitz, Subdiffusion and the cage effect studied near the colloidal glass transition. Chem. Phys. 284 (1-2), 361–367 (2002).
- 31. E. R. Weeks, D. Weitz, Properties of cage rearrangements observed near the colloidal glass transition. Phys. Rev. Lett. 89 (9), 095704 (2002).
- 32. G. Nägele, On the dynamics and structure of charge-stabilized suspensions. Phys. Rep. 272 (5-6), 215–372 (1996).
- 33. W. Doster, S. Longeville, Microscopic diffusion and hydrodynamic interactions of hemoglobin in red blood cells. Biophys. J. 93 (4), 1360–1368 (2007).
- 34. F. Roosen-Runge, et al., Protein self-diffusion in crowded solutions. Proc. Natl. Acad. Sci. U.S.A. 108 (29), 11815–11820 (2011).
- 35. A. Girelli, et al., Coherent X-rays reveal anomalous molecular diffusion and cage effects in crowded protein solutions. arXiv:2410.08873 [cond-mat.soft] (2024).
- 36. T. Ando, E. Chow, J. Skolnick, Dynamic simulation of concentrated macromolecular solutions with screened long-range hydrodynamic interactions: Algorithm and limitations. J. Chem. Phys. 139 (12) (2013).
- 37. J. F. Brady, G. Bossis, et al., Stokesian dynamics. Annu. Rev. Fluid Mech. 20 (1), 111–157 (1988).
- 38. P. Holmqvist, G. Nägele, Long-time dynamics of concentrated charge-stabilized colloids. Phys. Rev. Lett. 104 (5), 058301 (2010).
- 39. M. Tokuyama, I. Oppenheim, Dynamics of hard-sphere suspensions. Phys. Rev. E 50, R16–R19 (1994).
- 40. M. Tokuyama, I. Oppenheim, On the theory of concentrated hard-sphere suspensions. Physica A: Stat. Mech. Appl. 216 (1-2), 85–119 (1995).
- 41. G. Foffi, et al., Hard sphere-like glass transition in eye lens -crystallin solutions. Proc. Natl. Acad. Sci. U.S.A. 111 (47), 16748–16753 (2014).
- 42. P. Vodnala, et al., Hard-sphere-like dynamics in highly concentrated alpha-crystallin suspensions. Phys. Rev. E 97 (2), 020601 (2018).
- 43. A. Stradner, P. Schurtenberger, Potential and limits of a colloid approach to protein solutions. Soft Matter 16 (2), 307–323 (2020).
- 44. J. Balbo, P. Mereghetti, D.-P. Herten, R. C. Wade, The shape of protein crowders is a major determinant of protein diffusion. Biophys. J. 104 (7), 1576–1584 (2013).
- 45. M. Tokuyama, T. Moriki, Y. Kimura, Self-diffusion of biomolecules in solution. Phys. Rev. E 83 (5), 051402 (2011).
- 46. A. Madsen, et al., Materials Imaging and Dynamics (MID) instrument at the European X-ray Free-Electron Laser Facility. J. Synchrotron Rad. 28 (2), 637–649 (2021).
- 47. H. Srinivasan, V. K. Sharma, S. Mitra, Breaking the Brownian barrier: models and manifestations of molecular diffusion in complex fluids. Phys. Chem. Chem. Phys. 26 (47), 29227–29250 (2024).
- 48. M. Anton, Egg yolk: structures, functionalities and processes. J. Sci. Food Agric. 93 (12), 2871–2880 (2013).
- 49. H. Kuang, F. Yang, Y. Zhang, T. Wang, G. Chen, The impact of egg nutrient composition and its consumption on cholesterol homeostasis. Cholesterol 2018 (1), 6303810 (2018).
- 50. I. Breßler, J. Kohlbrecher, A. F. Thünemann, SASfit: a tool for small-angle scattering data analysis using a library of analytical expressions. J. Appl. Cryst. 48 (5), 1587–1598 (2015).
- 51. S. D. Quinn, et al., Crowding-induced morphological changes in synthetic lipid vesicles determined using smFRET. Front. Bioeng. Biotechnol. 10, 958026 (2022).
- 52. K. OGINO, T. KUBOTA, H. UCHIYAMA, M. ABE, Micelle formation and micellar size by a light scattering technique. J. oleo sci. 37 (8), 588–591 (1988).
- 53. F. Perakis, C. Gutt, Towards molecular movies with X-ray photon correlation spectroscopy. Phys. Chem. Chem. Phys. 22 (35), 19443–19453 (2020).
- 54. N. D. Anthuparambil, et al., Exploring non-equilibrium processes and spatio-temporal scaling laws in heated egg yolk using coherent X-rays. Nat. Commun. 14 (1), 5580 (2023).
- 55. G. Williams, D. C. Watts, Non-symmetrical dielectric relaxation behaviour arising from a simple empirical decay function. Trans. Faraday Soc. 66, 80–85 (1970).
- 56. A. Arbe, J. Colmenero, Characterization of the “simple-liquid” state in a polymeric system: Coherent and incoherent scattering functions. Phys. Rev. E 80 (4), 041805 (2009).
- 57. B. Ruta, et al., Wave-vector dependence of the dynamics in supercooled metallic liquids. Phys. Rev. Lett. 125 (5), 055701 (2020).
- 58. L. Hong, N. Smolin, J. C. Smith, de Gennes narrowing describes the relative motion of protein domains. Phys. Rev. Lett. 112 (15), 158102 (2014).
- 59. K. Nygård, et al., Anisotropic de Gennes narrowing in confined fluids. Phys. Rev. Lett. 116 (16), 167801 (2016).
- 60. C. Caronna, Y. Chushkin, A. Madsen, A. Cupane, Dynamics of nanoparticles in a supercooled liquid. Phys. Rev. Lett. 100 (5), 055702 (2008).
- 61. N. Neuber, et al., Disentangling structural and kinetic components of the -relaxation in supercooled metallic liquids. Commun. Phys. 5 (1), 316 (2022).
- 62. P. Luo, et al., Q-dependent collective relaxation dynamics of glass-forming liquid Ca0. 4K0. 6 (NO3) 1.4 investigated by wide-angle neutron spin-echo. Nat. Commun. 13 (1), 2092 (2022).
- 63. T. W. Taylor, B. J. Ackerson, Memory function for a colloidal liquid. J. Chem. Phys. 83 (5), 2441–2446 (1985).
- 64. W. Härtl, H. Versmold, U. Wittig, P. Linse, Structure and dynamics of polymer colloid suspensions from dynamic light scattering and Brownian dynamics simulation. J. Chem. Phys. 97 (10), 7797–7804 (1992).
- 65. W. Hess, R. Klein, Generalized hydrodynamics of systems of Brownian particles. Adv. Phys. 32 (2), 173–283 (1983).
- 66. F. Dallari, et al., Microsecond hydrodynamic interactions in dense colloidal dispersions probed at the European XFEL. IUCrJ 8 (5), 775–783 (2021).
- 67. J. D. Maier, J. Wagner, Structure and short-time diffusion of concentrated suspensions consisting of silicone-stabilised PMMA particles: a quantitative analysis taking polydispersity effects into account. Soft Matter 20 (6), 1309–1319 (2024).
- 68. G. C. Abade, B. Cichocki, M. L. Ekiel-Jeżewska, G. Nägele, E. Wajnryb, Short-time dynamics of permeable particles in concentrated suspensions. J. Chem. Phys. 132 (1) (2010).
- 69. C. Beenakker, P. Mazur, Diffusion of spheres in a concentrated suspension: Resummation of many-body hydrodynamic interactions. Phys. Lett. A 98 (1-2), 22–24 (1983).
- 70. C. Beenakker, P. Mazur, Diffusion of spheres in a concentrated suspension II. Physica A: Stat. Mech. Appl. 126 (3), 349–370 (1984).
- 71. M. Medina-Noyola, Long-time self-diffusion in concentrated colloidal dispersions. Phys. Rev. Lett. 60 (26), 2705 (1988).
- 72. A. Van Blaaderen, J. Peetermans, G. Maret, J. Dhont, Long-time self-diffusion of spherical colloidal particles measured with fluorescence recovery after photobleaching. J. Chem. Phys. 96 (6), 4591–4603 (1992).
- 73. N. Begam, et al., Packing and dynamics of a protein solution approaching the jammed state. Soft Matter 16 (33), 7751–7759 (2020).
- 74. M. J. Bergman, T. Garting, P. Schurtenberger, A. Stradner, Experimental evidence for a cluster glass transition in concentrated lysozyme solutions. J. Phys. Chem. B 123 (10), 2432–2438 (2019).
- 75. A. J. Banchio, M. Heinen, P. Holmqvist, G. Nägele, Short-and long-time diffusion and dynamic scaling in suspensions of charged colloidal particles. J. Chem. Phys. 148 (13) (2018).
- 76. V. Martinez, J. Thijssen, F. Zontone, W. Van Megen, G. Bryant, Dynamics of hard sphere suspensions using dynamic light scattering and X-ray photon correlation spectroscopy: Dynamics and scaling of the intermediate scattering function. J. Chem. Phys. 134 (5) (2011).
- 77. P. Segre, P. Pusey, Scaling of the dynamic scattering function of concentrated colloidal suspensions. Phys. Rev. Lett. 77 (4), 771 (1996).
- 78. P. Segre, P. N. Pusey, Dynamics and scaling in hard-sphere colloidal suspensions. Physica A: Stat. Mech. Appl. 235 (1-2), 9–18 (1997).
- 79. H. Löwen, T. Palberg, R. Simon, Dynamical criterion for freezing of colloidal liquids. Phys. Rev. Lett. 70 (10), 1557 (1993).
- 80. T. G. Mason, Estimating the viscoelastic moduli of complex fluids using the generalized Stokes–Einstein equation. Rheol. Acta. 39, 371–378 (2000).
- 81. U. Genz, R. Klein, Collective diffusion of charged spheres in the presence of hydrodynamic interaction. Physica A: Stat. Mech. Appl. 171 (1), 26–42 (1991).
- 82. R. Biehl, Jscatter, a program for evaluation and analysis of experimental data. PLoS One 14 (6), e0218789 (2019).
- 83. M. Tokuyama, Slow dynamics of equilibrium density fluctuations in a supercooled colloidal liquid. Physica A: Stat. Mech. Appl. 289 (1-2), 57–85 (2001).
- 84. M. Tokuyama, H. Yamazaki, Y. Terada, Test of mean-field equations for two types of hard-sphere systems by a Brownian-dynamics simulation and a molecular-dynamics simulation. Phys. Rev. E 67 (6), 062403 (2003).
- 85. M. Reiser, et al., Resolving molecular diffusion and aggregation of antibody proteins with megahertz X-ray free-electron laser pulses. Nat. Commun. 13, 2041–1723 (2022).
- 86. K. Mann, M. Mann, The chicken egg yolk plasma and granule proteomes. Proteomics 8 (1), 178–191 (2008).
- 87. C. Cao, et al., The protein corona leads to deformation of spherical micelles. Angew. Chem. Int. Ed. 133 (18), 10430–10437 (2021).
- 88. S. Hruszkewycz, et al., High contrast x-ray speckle from atomic-scale order in liquids and glasses. Phys. Rev. Lett. 109 (18), 185502 (2012).
- 89. G. Nägele, P. Baur, Long-time dynamics of charged colloidal suspensions: hydrodynamic interaction effects. Physica A: Stat. Mech. Appl. 245 (3), 297–336 (1997).
- 90. B. Ruta, et al., Hard X-rays as pump and probe of atomic motion in oxide glasses. Sci. Rep. 7 (1), 1–8 (2017).
- 91. G. Pintori, G. Baldi, B. Ruta, G. Monaco, Relaxation dynamics induced in glasses by absorption of hard X-ray photons. Phys. Rev. B 99 (22), 224206 (2019).
- 92. J. Möller, M. Sprung, A. Madsen, C. Gutt, X-ray photon correlation spectroscopy of protein dynamics at nearly diffraction-limited storage rings. IUCrJ 6 (5), 794–803 (2019).
- 93. F. Dallari, et al., Real-time swelling-collapse kinetics of nanogels driven by XFEL pulses. Sci. Adv. 10 (16), eadm7876 (2024).
- 94. B. Abbasnezhad, N. Hamdami, J.-Y. Monteau, H. Vatankhah, Numerical modeling of heat transfer and pasteurizing value during thermal processing of intact egg. Food Sci. Nutr. 4 (1), 42–49 (2016).
- 95. S. S. Rita de Cássia, et al., Effect of pH and salt concentration on the solubility and density of egg yolk and plasma egg yolk. LWT – Food Sci. Technol. 40 (7), 1253–1258 (2007).
Acknowledgments
We acknowledge European XFEL in Schenefeld, Germany, for the provision of X-ray free-electron laser beamtime at the Scientific Instrument MID (Materials Imaging and Dynamics) and would like to thank the staff for their assistance. The data presented here were taken as part of the beamtimes with experiment numbers 5397 and 6996. We acknowledge the participation of Marvin Kowalski, Mohammad Sayed Akhundzadeh, Jenny Schrage, Pia Kwiasowski, Maximilian Senft, Lara Reichart, and Chang Hee Woo during the EuXFEL beamtime. We thank the European Synchrotron Radiation Facility (ESRF) for the provision of synchrotron radiation facilities at TRUSAXS instrument (Time Resolved Ultra Small Angle X-ray Scattering), ID02 (SC-5435), with additional support from Theyencheri Narayanan. We acknowledge the participation of Randeer Gautam, Moritz Puritscher, Fabian Prandl, Lovisa Jansson, Milla Åhlfeldt, and Sampad Bag during the ESRF beamtime. We acknowledge financial support by the consortium DAPHNE4NFDI in association with the German National Research Data Infrastructure (NFDI) e.V. - project number 4602487. This work was supported through the Maxwell computational resources operated at Deutsches Elektronen-Synchrotron DESY, Hamburg, Germany. We acknowledge Dr. D.C.F. Wieland for providing access to the Bolin Gemini rotational HR nano-rheometer for rheology measurements. M.P. thanks the DELTA machine group for providing synchrotron radiation for sample characterization.
Funding:
We acknowledge BMBF (05K19PS1, 05K20PSA and 05K22PS1)(to C.G.); 05K19VTB, (to F.S. and F.Z.), DFG-ANR (SCHR700/28-1, SCHR700/42-1, ANR-16-CE92-0009) (to F.S. and F.Z.). C.G. acknowledges funding from NFDI 40/1 (DAPHNE4NFDI). F.P., I.A.A., and A.G. acknowledge funding from the European Union’s Horizon Europe research and innovation programme under the Marie Skłodowska-Curie grant agreement No. 101081419 (PRISMAS) (F.P. and I.A.A.) and 101149230 (CRYSTAL-X) (F.P. and A.G.). F.P. acknowledges financial support by the Swedish National Research Council (Vetenskapsrådet) under Grant No. 2019-05542, 2023-05339 and within the Röntgen-Ångström Cluster Grant No. 2019-06075, and the kind financial support from Knut och Alice Wallenberg foundation (WAF, Grant. No. 2023.0052). This research is supported by the Center of Molecular Water Science (CMWS) of DESY in an Early Science Project, the MaxWater initiative of the Max-Planck-Gesellschaft (Project No. CTS21:1589), Carl Tryggers and the Wenner-Gren Foundations (Project No. UPD2021-0144).
Author contributions:
N.D.A, M.D., and C.G. designed the experiment, along with discussions with F.S., F.P., F.Z, M.P., and F.L.. N.D.A. and M.D. prepared the yolk-plasma samples. N.D.A. planned the measurements at EuXFEL. N.D.A., M.D., S.T., A.G., S.R., A.M.R., A.L., F.U., M.B., P.P.R., I.A., F.L., M.P., and C.G. conducted the experiment. J.M., W.J., J.H., A.R., J.P., F.B., U.B., M.Y., R.S., R.R., and A.M. operated the MID instrument at EuXFEL. J.W., A.L., F.B., and J.M. provided the MID data analysis pipeline. N.D.A. performed the data processing and analysis. N.D.A., M.D., C.G., F.Z., and F.S. discussed the XPCS data analysis with input from A.G., F.P., J.M., F.L., and M.P.. W.C. operated the ID02 beamline at ESRF. The manuscript was written by N.D.A., and C.G. with input from all authors.
Competing interests:
There are no competing interests to declare.
Data and materials availability:
The processed data (scattering intensity profiles, intermediate scattering functions) of yolk-plasma samples have been deposited in Zenodo (xxxx). Any other data used in this study are available from the authors upon request. Custom Python scripts developed for the study are available at Zenodo (xxxx).
Data recorded for the experiment at the European XFEL are available at [doi:10.22003/XFEL.EU-DATA-005397-00]. Data recorded at ESRF are available at [doi:10.15151/ESRF-ES-2009918726].
Supplementary materials
Supplementary Text
Figs. S1 to S16
Tables S1 to S3
Supplementary Materials for
Softness and Hydrodynamic Interactions Regulate Lipoprotein Transport in Crowded Yolk Environments
Nimmi Das Anthuparambil∗, Michelle Dargasz, Sonja Timmermann, Anita Girelli, Sebastian Retzbach, Johannes Möller, Wonhyuk Jo, Agha Mohammad Raza, Aliaksandr Leonau, James Wrigley, Frederik Unger, Maddalena Bin, Prince Prabhu Rajaiah, Iason Andronis, William Chèvremont, Jörg Hallmann, Angel Rodriguez-Fernandez, Jan-Etienne Pudell, Felix Brausse, Ulrike Boesenberg, Mohamed Youssef, Roman Shayduk, Rustam Rysov, Anders Madsen, Felix Lehmkühler, Michael Paulus, Fajun Zhang, Fivos Perakis, Frank Schreiber, Christian Gutt † ∗Corresponding author. Email: nimmi.das.anthuparambil@desy.de†Corresponding author. Email: christian.gutt@uni-siegen.de
This PDF file includes:
Supplementary Text
Figures S1 to S16
Tables S1 to S3
1 Sample details
Egg yolk is a complex assembly of proteins, phospholipids, and cholesterol in water. The egg yolk constituents are described in Fig. S1. Yolk consists of approximately 50 water, 33 lipid, and 17 protein (?). This complex natural assembly is stabilized via interactions between its constituents. Egg yolk can be separated into two fractions (plasma and granules) by moderate centrifugation (?). The egg yolk-plasma is a translucent liquid which represents of yolk dry matter. The major constituent of egg yolk-plasma is low-density lipoproteins (LDLs) ( of yolk-plasma), which are spherical core-shell nanoparticles (?). The core is made of triglycerides and cholesterol esters in a liquid state, and the shell is made of a monolayer of phospholipids onto which apolipoproteins are attached, as shown in Fig. S1. The LDLs are water-soluble entities, and the density of LDL is 0.982 g/cm3. The hydrophobic interactions between the phospholipid tail and core lipids and hydrophilic interactions between the phospholipid head and water molecules stabilize this complex nano-assembly. LDLs contain 11-17 proteins and 83-89 lipids (neutral lipids and phospholipids) (?).
2 SAXS data
The SAXS data collected from EuXFEL and ESRF are in good agreement, as shown in Fig. S2.
2.1 Form factor modeling of yolk-plasma
For modeling the form factor of yolk-plasma, the SASfit software (?) was used. The fit is comprised of a core-shell component plus a generalized Guinier-Porod component. The core-shell component is realized by using ”ExpShell” model in SASfit software, where the shell has an exponentially varying contrast profile. A generalized Guinier-Porod component is implemented to account for the presence of apolipoprotein on the LDL corona (?). The SAXS data obtained from ESRF is used for formfactor modeling due to the extended range and lower noise levels at higher values (Fig. S2). First, experimental data of 4 mg/ml was fitted using the combined model as depicted in Fig. S3A. The Schulz-Zimm distribution of radius with a core radius of 12 nm and a shell thickness of 3.5 nm is used for the core-shell model. The dispersity (standard deviation/mean radius) was estimated as 0.126. As the concentration increases, a change in the size of LDL particles is expected due to their soft, deformable nature and the limited space available, consistent with prior observations of lipid vesicles (?) and micelles (?). As depicted in Fig. S4, a small shift in the second and third minima with increasing concentration indicates the change in the size of LDLs. Hence, we estimate the effective form factor at high concentrations by modeling at nm-1. For this, the model fit given in Fig. S3A is used as an initial guess for other samples (Fig. S3B-D). The resulting form factor fits for all sample cases are given in Fig. S3. The estimated decrease in particle size in the highest concentrated sample ( mg/ml) is compared to the dilute case ( mg/ml). The effective radius of LDL particles determined from form factor modeling is subsequently utilized for the estimation of other parameters, such as (see Methods and Materials section), of hard-spheres (given in the inset of Fig. 2B), given in Fig. S13 and storage modulus estimate of hard-spheres given in Fig. S12C. Note that experimental estimation of the hydrodynamic radius at high concentrations was difficult using a dynamic light scattering technique due to multiple scattering issues, and hence, for the estimation of , the radius obtained from SAXS is used.
2.2 Effective
The effective structure factor of yolk-plasma at different concentrations is estimated using Eq. 9, experimental , and form factor fits given in Fig. S3B-D. The extracted for all samples is given in Fig. S5.
3 Modeling of correlation functions from XPCS
The intensity autocorrelation functions provided in the main manuscript extracted from XPCS measurements are modeled using Eq. 2. The speckle contrast was estimated using the relationship provided in ref. (?),
| (S1) |
where is the effective speckle contrast due to the transverse coherence. was found for European XFEL (?). describes the loss of coherence due to energy bandwidth, experiment geometry, and speckle shape and is given by with,
| (S2) |
where , µm, mm, = 200 µm, , and are the effective energy bandwidth, beam size, thickness of capillary, pixel size, wavelength of X-rays, sample to detector distance, and scattering angle, respectively. The effective energy bandwidth is estimated by modeling of ludox power samples using Eq. 2. The values of other parameters can be found in Table S2. The blue shaded region in Fig. S6 indicates the confidence interval for contrast values (beamtime id: p005397). The fitted contrast of all samples lies within this confidence interval.
4 Estimation of
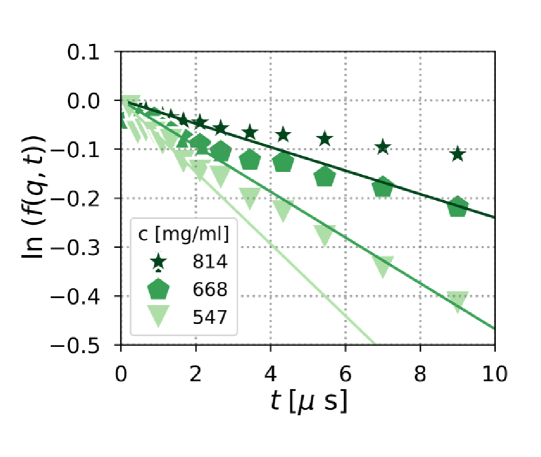
To estimate , the logarithm of intermediate scattering function was fitted using a linear function as depicted in Fig. S7 for 2 µs.
5 and
The and of egg yolk-plasma at different concentrations are compared in a double-Y plot as shown in Fig. S8.
6 Modeling of hydrodynamic interactions
The -dependence of experimentally extracted hydrodynamic functions was captured by the theoretical expressions given in the main text (Eq. 12 and Eq. 13). The -dependent part was estimated using the Jscatter (?) Python library, where the experimental structure factor of the samples was used as input. The rescaled hydrodynamic function fits the experimental data well (solid line in Fig. S9). The dashed lines are theoretical predictions using Eq. 12.
7 Comparison of experimental with theoretical model of Medina-Noyola et al.
The theoretical estimation of the normalized long-time self-diffusion coefficient proposed by Medina-Noyola (?) and Blaaderen et al. (?) is,
| (S3) |
8 Memory Equation
The memory equation relating to the collective memory function is given by (?),
| (S4) |
where is the integration time parameter. The first term on the right-hand side determines the short-time dynamics, describing an exponential decay of due to free or weakly interacting particle motion. The second term, often referred to as the memory term, relates the present rate of change of to its past values, capturing the effects of many-body interactions and dynamic caging. In the short-time () regime, the second term in Eq. S4 does not contribute and hence decays exponentially. However, for , memory effects become significant, leading to a slower, non-exponential decay of , characteristic of particle caging and the onset of viscoelastic behavior.
9 MSD estimation
The MSD of all samples at is estimated using the relation Eq. 7. The calculated MSD values collapse to a single curve (Fig. S11), indicating the validity of Eq. 7.
10 Viscoelastic properties from MSD
The frequency-dependent () visco-elastic properties of complex fluids can be extracted from the time-dependent MSD using the formalism described in (?). Here, we estimate the storage modulus, , and loss modulus, , of all samples from the MSD fit given in Fig. 6 using the formalism provided in ref. (?). The estimated values are shown in Fig. S12A. At all times , indicated by loss-tangent (= ) 1 in Fig. S12B. This confirms that all samples are in the liquid state. For hard-spheres the localization length determines the storage modulus via,
| (S5) |
The estimated values of with are shown in Fig. S12C. Clearly, the hard-sphere model underestimates the values of LDL solutions.
11 Viscosity from rheology
Shear-dependent viscosity measurements were performed using a Bolin Gemini rotational HR nano-rheometer. The samples were sheared using a cone plate with an angle of 1o (angle formed between the cone and its base) and a diameter of 40 mm. Due to limited shear ranges of the instrument and spilling of sample at high shear rates, the experiments were limited to shear rates below 1/s. In Fig. S13, the estimated values of viscosity from rheology, , for all three samples, along with estimated from XPCS, are given.
12 Contribution of long-range hydrodynamic interactions to long-time diffusion
In Fig. S14, the contribution of direct interactions and long-range hydrodynamic interactions to the long-time self-diffusion coefficient is depicted.
13 Experimental parameters of SAXS measurements at ESRF
The SAXS measurements were performed at ID02 beamline at ESRF, and the experimental parameters are given in Table. S1.
| X-ray energy [keV] | 12.23 |
|---|---|
| beam size [µm µm] | 4040 |
| detector | EIGER2 4M |
| pixel size [µm µm] | 7575 |
| sample to detector distance [m] | 1.5 |
14 Assessment of X-ray induced beam damage
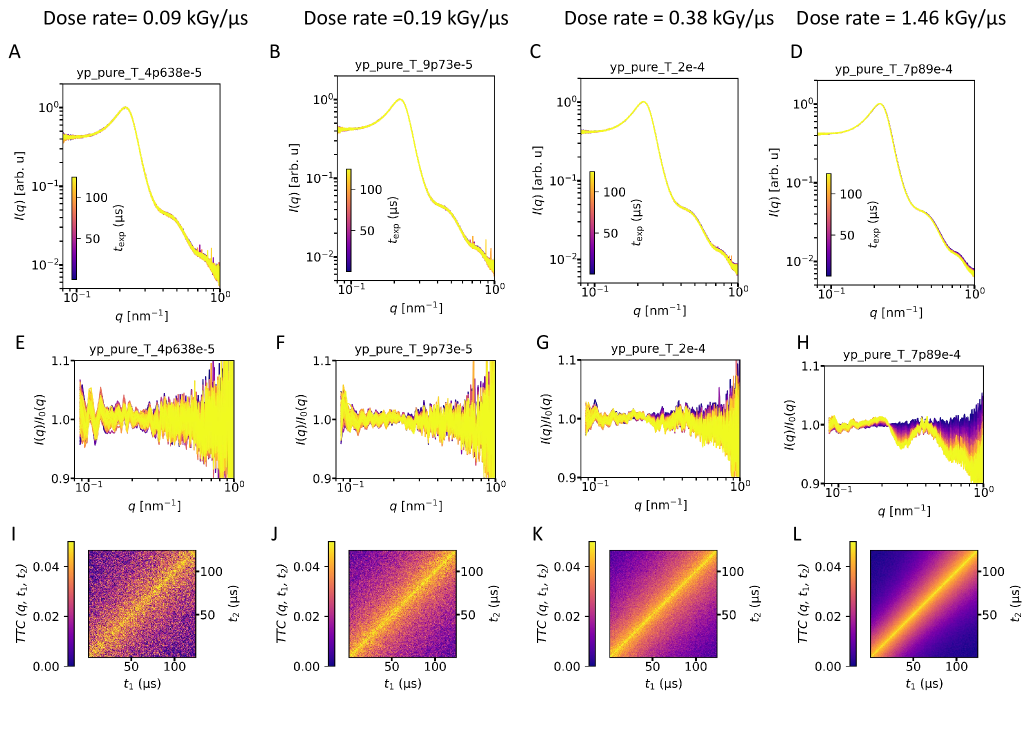
In X-ray scattering measurements, exposing the material to X-rays above a critical dosage causes radiation-induced damage. In XPCS experiments, X-ray beam-induced damage is characterized by the changes in the native structure and equilibrium dynamics (?, ?, ?). Recent investigations reveal that beam-induced effects depend on both cumulative dosage and dose rate (?). To eliminate beam-induced artifacts in XPCS measurements, it is necessary to determine the critical dose and critical dose rate thresholds for a specific sample system and execute subsequent experiments below these limits. To determine the critical dose and dose rate of yolk-plasma, we performed XPCS measurements at various incident X-ray intensities such that the dose rate on the sample is different for the same exposure time. The dose absorbed by the sample is estimated using the relation (?),
| (S6) |
where , and are the energy of the incident X-ray, the thickness of the capillary, the beam size, and the density of water (see Table. S2). is the attenuation coefficient of the sample. The attenuation coefficient of water was used for the estimation of the dose. The estimated values of the dose rate corresponding to different values of X-ray transmissions during two different beamtimes can be found in Table. S3.
| parameter | beamtime id | beamtime id |
|---|---|---|
| 5397 | 6996 | |
| X-ray energy [keV] | 10 | 9 |
| beam size [µm µm] | 1212 | 1515 |
| pulse energy [µJ] | 1640 | 460 |
| inter-pulse time [ns] | 222 | 444 |
| pulses per train | 310 | 280 |
| sample to detector distance [m] | 7.68 | 7.265 |
| Transmission | Dose rate [kGy/µs] | Transmission | Dose rate [kGy/µs] |
|---|---|---|---|
| beamtime id: 5397 | beamtime id: 6996 | ||
| 1.34 | 0.23 | 4.638 | 0.09 |
| - | 9.73 | 0.19 | |
| - | 2 | 0.38 | |
| - | 7.89 | 1.46 |
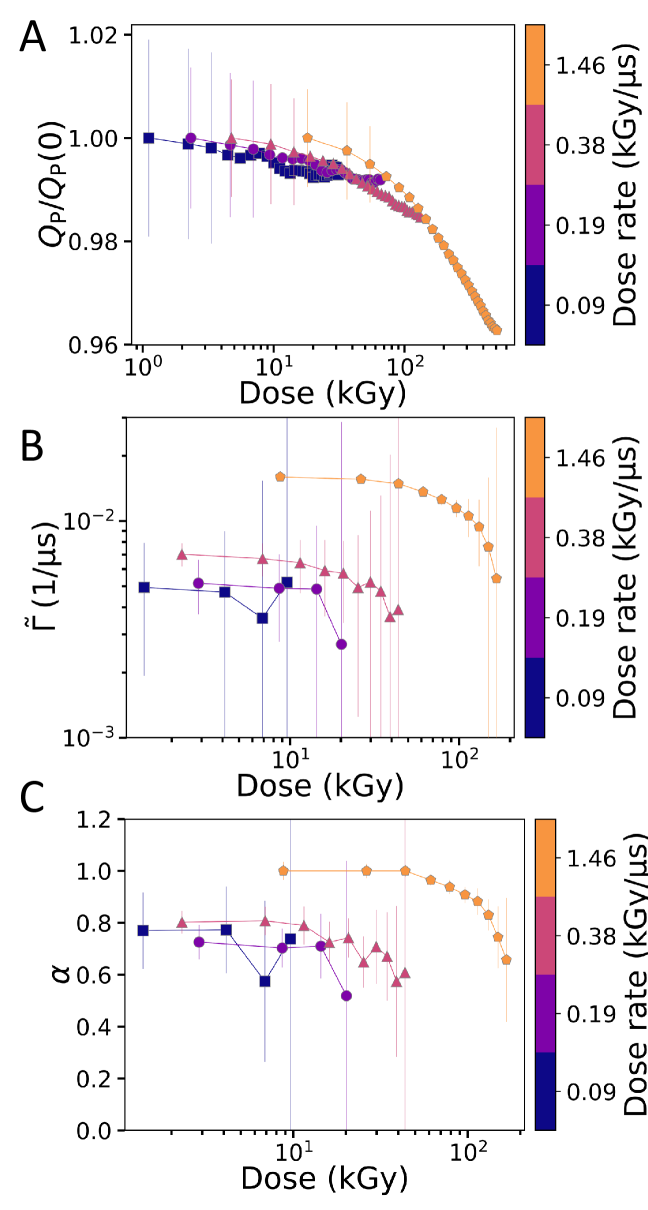
The as a function of X-ray exposure time at different dose rates is provided in Fig. S15A-D. To evaluate further, a normalized with respect to the first curve is shown in Fig. S15E-H. At low dose rates, there is almost no change in scattering intensity with increasing total accumulated dose within the experimental time, while at a dose rate of 1.46 kGy/µs, the shows a continuous increase with longer exposure. To quantify further, we estimate the Porod invariant (?) using
| (S7) |
The lower and upper limit of integration are = 0.3 nm-1 and = 0.8 nm-1 respectively. This range is chosen as the beam-induced structural changes start to be observed in this region, as shown in Fig. S15H. The normalized with respect to the initial value is depicted in Fig. S16A. Interestingly, the normalized decreases after a deposited dose of 20 kGy, thus giving an upper estimate for the critical dose for the egg yolk samples. Next, we estimate the changes in the dynamical parameters of the sample. Representative TTCs extracted for XPCS scans with different dose rates are shown in Fig. S15, bottom row. Clearly, the dynamical slowdown is observed at the highest dose rate of 1.46 kGy/µs, as concluded from the broadening of the diagonal region in the . To quantify the changes in dynamics, we extracted autocorrelation functions and modeled them using Eq. 2. The extracted and KWW values are depicted in Fig. S16B and C, respectively. Equilibrium dynamics is observed up to a dose rate of 0.38 kGy/µs and a total dose of 20 kGy. Hence, all measurements shown in the main text were performed below the critical threshold of 20 kGy using a dose rate of 0.23 kGy/µs.
Further, X-ray induced heating effects (?, ?) were evaluated by estimating the temperature increase induced by a pulse with energy as,
| (S8) |
where and are specific heat capacity and effective attenuation length. For the estimation of , = 3120 J/kg K (of egg yolk (?)) and the attenuation length of water was used. The material density of egg yolk 1 g/cm3 (from ref. (?)) is used for the calculation. The increase in temperature of the solution after exposure to 310 pulses (a full train) during the experiment (experiment number 5397) is estimated to be 2 K. Such a minor change in temperature is insufficient to cause any protein denaturation and can thus be safely neglected.