Connecting the m-dots: accretion rates and thermonuclear burst recurrence times on neutron stars and white dwarfs
Abstract
We present a compilation of observed recurrence times () and infer the corresponding local mass-accretion rates () for type I X-ray bursts, milliHertz quasi-periodic oscillating sources and recurrent novae eruptions. We construct models of the relation for accreting white dwarfs and neutron stars and find that both are roughly consistent with a global inverse linear relation, connecting for the first time thermonuclear runaways on neutron stars and white dwarfs. We find that theoretical models of pure He bursts are in agreement with the best measurements in ultra-compact X-ray binaries at low (4U and 2S 0918-549). We suggest that the transient Z source XTE J1701-462 is a slow rotator, based on its mHz QPO properties. Finally, we discuss the implications for thermonuclear ignition and point out that the difference in eruption/burst energy () is consistent with the difference in area between neutron stars and white dwarfs . We conclude that ignitions of thermonuclear shell flashes on neutron stars and white dwarfs depend primarily on the specific mass accretion rate and do not depend on the nature of the underlying compact object.
keywords:
accretion – X-rays: bursts – novae, cataclysmic variables.1 Introduction
Neutron stars (NSs) and white dwarfs (WDs) in mass-transferring binaries accrete hydrogen- or helium-rich matter from the surfaces of their stellar companions. Depending on the mass-accretion rate , nuclear burning in the accreted fuel can be thermally stable or unstable (Fujimoto et al. 1981; Nomoto 1982; Narayan & Heyl 2003), or even marginally stable in some cases (Heger et al., 2007). Unstable burning of the accreted material in compact binaries gives rise to thermonuclear runaways (TNRs), where the accumulated material ignites at a specific depth in the envelope of the NS or WD, releasing energy and being observed as a shell flash. In NSs, these TNRs are seen mostly in X-rays and are known as type I X-ray bursts (XRBs hereafter, Lewin et al., 1993). TNRs on WDs release most of their energy in the optical band and are commonly named nova eruptions (in the systems known as classical or recurrent novae, CNe or RNe, respectively; Munari 2012; Pagnotta & Schaefer 2014). XRBs give us the ability to constrain the NS mass and radius, mainly through photospheric radius expansion (PRE) bursts (van Paradijs, 1979; Paczynski & Anderson, 1986). In nova eruptions, determining the mass and composition of the ejecta provides us with information on the chemical enrichment of the interstellar medium. More importantly, RNe are possible progenitors of type Ia supernovae (Hachisu et al., 1996), since the WD mass is expected to increase in each nova cycle.
The recurrence times (111We use the same symbol for NS bursts and WD eruptions.) of XRBs are connected to the accretion rate onto the NS, and range from minutes (Linares et al., 2012a) to years (Kuulkers, 2004). Because a thicker fuel layer takes longer to accumulate and cools down more slowly after burning, more energetic bursts have longer and durations (see, e.g., Strohmayer & Bildsten, 2006; José, 2016, for reviews). Normal H/He bursts on NSs (lasting from seconds to minutes) release an energy erg and have typical ranging from minutes to days (Galloway et al., 2020). Unusually long or "intermediate" bursts (lasting tens of minutes) release erg and have of weeks to months (Cumming et al., 2006; Alizai et al., 2023). While overlaps between long and normal bursts exist (Linares et al., 2012b), long bursts are thought to be produced by the ignition of a thick layer of pure He (Cumming et al., 2006; in’t Zand et al., 2007; Peng et al., 2007). Superbursts (lasting from hours to about a day) release erg and have of years (Cornelisse et al., 2000; Kuulkers, 2004; in’t Zand, 2017). Because they are attributed to the ignition of a different element (carbon; Cumming & Bildsten, 2001; Strohmayer & Brown, 2002), superbursts are not included in this study.
Nova eruptions are produced by H shell flashes on WDs (Starrfield et al., 1972), with observed between one year and several decades for RNe (Schaefer, 2010). For CNe, by definition, only one eruption has been observed so it is not possible to measure directly . However, CNe models typically predict222Yaron et al. (2005) reported for a wide range of models, obtaining values between yr and yr. The most extreme values of are only reachable for extreme combinations of and . yr (e.g., Shara et al., 2018). The ejected envelope expands into the surrounding material powering most of the optical transient emission, which typically lasts for days to months (Chomiuk et al. 2021; see, e.g., decline times of 93 CNe in the range d, Strope et al. 2010). In RNe, the flash duration (initial brightening to final decline) is observationally found to be d (Schaefer, 2010). The energy released in a nova explosion is typically erg (see Starrfield et al. 2008; José & Shore 2008; José 2016; Chomiuk et al. 2021, for reviews).
The main parameters considered in ignition models for XRBs are: i) the local mass-accretion rate on the NS surface (per unit surface area, ); ii) the accreted fuel composition (mass fractions of H, He and CNO elements: , and , respectively); and iii) the energy released from the deep crust, presumably from pycnonuclear reactions, heating up the accreted envelope "from below" (Fujimoto et al., 1981; Bildsten, 1998; Cumming & Bildsten, 2000; Haensel & Zdunik, 2003). When accreting solar composition fuel at the lowest (1% of the Eddington rate333, where is the Eddington limited luminosity, is the radiative efficiency, and c the speed of light.), unstable H burning can trigger a combined H/He burst (“H bursts”, Peng et al., 2007). At higher rates (about 14% Eddington), all H burns stably before reaching ignition depth, so that a thick He layer ignites in the absence of H (“pure He bursts", Fujimoto et al., 1981; Galloway & Cumming, 2006). NSs in ultra-compact binaries (UCXBs, with orbital periods shorter than 1 h) are thought to accrete mainly He, which can also lead to (more frequent and less energetic) “pure He bursts” (Cumming, 2003; Peng & Ott, 2010). Most XRBs at relatively high accretion rates (about 4100% Eddington) are thought to be triggered by He ignition in a mixed H and He environment, since steady H burning cannot exhaust the accreted H before reaching ignition depth (“mixed H/He bursts”, Bildsten, 1998). Finally, for very high accretion rates onto NSs (close to or above the Eddington limit) both H and He are expected to burn steadily (Bildsten, 1998; Cumming & Bildsten, 2000).
When the accretion rate onto the NS is close to the boundary between unstable and stable He burning, an oscillatory phenomenon called marginally-stable burning occurs (with a period similar to the geometric mean of thermal and accretion timescales; Heger et al., 2007). This is the leading model for the mHz quasi-periodic oscillations (mHz QPOs) observed in the X-ray flux of several accreting NSs (Revnivtsev et al., 2001, see Section 2.2). Thus, mHz QPOs can be used as a tracer for the stability boundary of He burning on accreting NSs.
The main parameters of the models for H ignition on WDs are, similarly to NSs: i) the , ii) the , iii) the WD temperature (or luminosity) and iv) metallicity of the accreted matter (Wolf et al., 2014; Yaron et al., 2005; Shara et al., 2018). Piro & Bildsten (2007) proposed that He novae can occur in a particular sub-class of WD binaries known as AM Canum Venaticorum (AM CVn), where unstable He burning on the accreting WD would give rise to He flashes (see also Shen & Bildsten 2009). In the case of V445 Puppis, while the spectra lack H and are rich in CI lines, do not conclusively point to a Helium nova (Woudt et al., 2009; Ashok & Banerjee, 2003). So far, only a handful of potential He novae have been proposed (Rosenbush, 2008).
Steady burning of H-rich matter is thought to power the super-soft phase of nova eruptions, and the so-called super-soft sources (SSSs, Kahabka & van den Heuvel, 1997). These are thought to accrete at a rate , where H burning on a WD is expected to be stable (Shen & Bildsten, 2008). Recently, a peculiar SSS was identified (lacking H lines), which could be burning He stably (Greiner et al., 2023). Thus, SSSs can help us trace the stability boundary of H (and perhaps He) burning on accreting WDs.
Here we investigate the relation between and , comparing observations of TNRs on NSs and WDs with models, in order to study H and He burning regimes on different compact objects. In Section 2 we compile XRB and mHz QPO properties and in Section 3 we collect and for nova eruptions in RNe. In Section 4 we describe the ignition models used in this work, and in Section 5 we discuss our results.
2 Neutron Stars
To compare thermonuclear burning regimes in NSs and WDs, we gathered from the literature estimates of and the corresponding . We define as the time elapsed between successive bursts in sequences of many bursts (more than 3). Exceptions of burst trains with short “wait times” exist, but are not included in this definition (Keek et al., 2010). In practice, for d it is not possible to observe an XRB source (or “burster”) uninterruptedly, so we must measure the long-term average (number of detected bursts over the effective exposure or on-source time; see, e.g., Linares et al., 2012b; Jenke et al., 2016). In a few cases, can be studied over a range of for one particular burster; most notably: GS 182624, IGR J175113057 and T5X2 (Galloway et al., 2004; Falanga et al., 2011; Linares et al., 2012a, respectively). In most bursters we must resort to large multi-instrument X-ray observations to constrain averaged over long timescales (years-decade; in’t Zand et al., 2007; Galloway et al., 2008, 2020). In addition, the accretion rate and luminosity can change strongly (by several orders of magnitude) in low-mass X-ray binaries (LMXBs), due to accretion disk instabilities (both in persistent and, especially, transient accretors). Thus, for several bursters we list and plot a range of (Sec. 2.1).
XRBs come from weakly magnetic (B1010 G) accreting NSs in LMXBs, most of them in transient systems. Their persistent X-ray luminosity (outside bursts, ) can be used to estimate the “bolometric” accretion luminosity and (e.g., Galloway et al., 2008). Here is a bolometric correction factor that converts from X-ray luminosity in a given observed band (set by the different detectors used) to the band where most accretion-powered energy is radiated (about 0.1-100 keV). However, the exact band depends on the source state and spectral model of choice so we find different values in the literature, starting at 0.01-0.8 keV and reaching up to 50-200 keV. Using the distances to each burster tabulated below (), we calculate when necessary from the reported unabsorbed X-ray flux in the same band (). In a few cases we estimate converting from instrument count rates and assuming a spectral model, as detailed below.
We then estimate under the simple assumption that all gravitational potential energy is released at the NS surface in the form of X-rays, using the general relativistic expression (Lewin et al., 1993),
| (1) |
Here is the gravitational redshift factor, and we adopt for simplicity a NS mass and radius =1.4 M⊙ and =10 km, respectively. Assuming that the accreted matter is evenly spread on the NS surface, we estimate the mass-accretion rate per unit area as simply . We also use erg , to calculate Eddington-normalized accretion luminosities and (in general this value depends on , and ; see, e.g., Lewin et al., 1993; Kuulkers et al., 2003). With our definition, the Eddington limit corresponds to global and local mass-accretion rates of g s yr-1 and g cm-2 s-1, respectively. Finally, we estimate a systematic uncertainty on the general bolometric correction, using WebPIMMS444https://heasarc.gsfc.nasa.gov/cgi-bin/Tools/w3pimms/w3pimms.pl and X-ray photon indices and . Assuming that this photon index range represents approximately the different spectral states of NS-LMXBs (Linares, 2009), we arrive at a systematic uncertainty on (excluding uncertainties) of about .
2.1 The XRB sample: recurrence times and accretion rates
We compiled a catalog of and inferred for the Galactic burster population. From the 120 bursters currently known in the Milky Way (in’t Zand, 2024), we include those that have: i) good measurements of ; ii) known or well-constrained distances and iii) reported or available measurements of the persistent flux around the bursts. This leaves us with 50 bursters, shown in Table 1 and Figure 1. The corresponding and values for each burster are also listed, together with the type or classification of each burster. We also give the orbital period for each system, to distinguish between UCXBs ( h) and normal LMXBs. This distinction serves as an indicator for the composition of the accreted fuel, since in UCXBs the NSs are expected to accrete H-poor matter.
We used two main references as a starting point to compile this information. First, in’t Zand et al. (2007) reported constraints from BeppoSAX Wide Field Camera (WFC) observations of 40 persistent bursters (in their Table 2). From these 40 bursters, 28 comply with our criteria i) and ii) mentioned above, so we include them in our catalog (noted with instrument "WFC" in our Table 1). The estimates from in’t Zand et al. (2007) come from the following instruments: RXTE Proportional Counter Array (PCA) bulge-scan light curves (in the energy range of 2-12 keV), converted to in the 2-10 keV band; and RXTE All-Sky Monitor (ASM) light curves (2-12 keV), converted to in the 2-10 keV band. From there, they assume a unique bolometric correction factor 2.9(1.4) to convert to “bolometric” energy flux. We also inferred the distance to each burster listed by in’t Zand et al. (2007), using their burst peak flux and (these inferred values are also shown in Table 1).
Second, we include constraints on for 12 bursters from Table 10 in Galloway et al. (2008), which lists the shortest burst interval longer than 0.9 h (thus excluding the atypical short recurrence-time burst “trains”). For completeness, we list in our Table 1 their distances (from PRE bursts, cf. their Table 9) and their values, which they derived from spectral fits to the persistent emission to convert from the PCA band (2.5-25 keV) to “bolometric” 0.1-200 keV energy flux. Together with the two references above, we included constraints on from MINBAR (Galloway et al., 2020), which we show in Figure 1. Finally, we also included improved or more recent measurements from 10 additional bursters which fulfill our selection criteria, briefly summarized next.
T5X2
The burster, transient and 11 Hz X-ray pulsar in the globular cluster Terzan 5, IGR J17480-2446, was nicknamed T5X2 for being the second bright X-ray source discovered in that cluster. It is peculiar for being the only burster where a smooth transition between bursts and mHz QPOs has been observed (Linares et al., 2012a), and for having an unusually slow spin and high NS surface magnetic field strength ( G; Papitto et al., 2011).
We include its and from Table 1 in Linares et al. (2012a), based on 46 RXTE-PCA observations of its 2010 outburst (the only one observed so far). They used to convert from in the PCA band (2.5-25 keV) to “bolometric” (0.01-50 keV) . T5X2 showed very short down to about 5 min when the inferred was high (18-50 % of ). At such high accretion rates, most other bursters rarely burst (Linares et al., 2012a; Cornelisse et al., 2003).
Circinus X-1
Since its discovery in the early days of X-ray astronomy (Margon et al., 1971), the NS-LMXB Circinus X-1 (Cir X-1) has shown large variations in (e.g., Armstrong et al., 2013). It is a peculiar LMXB in a 16.6 d eccentric orbit, which showed XRBs again in 2010, after 25 years without bursting detected (Linares et al., 2010).
For Cir X-1, we list for the 4 PCA bursts reported by Linares et al. (2010) with uninterrupted observations from the previous burst (i.e., where could be measured unambiguously). We use for those exact 4 bursts from Linares et al. (2010, 0.5-50 keV), and derive a to convert to “bolometric” in the keV band. The corresponding is about 20% of .
4U 0614+09
The persistent low-luminosity burster 4U 0614+09 features i) a tentative h (Shahbaz et al., 2008) which classifies it as a candidate UCXB, and ii) a lack of He lines in the optical spectrum (Nelemans et al., 2004), which suggests the companion is a C/O WD. This is puzzling since its burst behaviour seems consistent with pure He bursts (see Kuulkers et al., 2010, and references therein).
For this burster we list the d measured by Linares et al. (2012b) using 1 year (2010-2011) of Fermi Gamma-Ray Burst Monitor (GBM) observations. We also use their erg s-1, measured from RXTE-ASM and Swift Burst Alert Telescope (BAT) monitoring observations. The updated 2010-2013 GBM results (Jenke et al., 2016) and previous work by Kuulkers et al. (2010) showed similar behavior: an quite stable around 1% and a of about two weeks.
2S 0918-549
The persistent low-luminosity burster 2S 0918-549 also lacks He lines in the optical spectrum (Nelemans et al., 2004), and the companion is thought to be an ONe WD (Juett et al., 2001). It has been classified as a UCXB based on a low optical/X-ray flux ratio Juett et al. (2001) and on the likely min (Zhong & Wang, 2011).
SRGA J144459.2-604207
The newly discovered burster and transient SRGA J144459.2-604207 (Molkov et al., 2024), was observed by the Imaging X-ray Polarimetry Explorer (IXPE) from February 27 to March 8 2024 (Papitto et al., 2024; Takeda et al., 2024), during its outburst phase. From IXPE data, 52 XRBs were detected from this source (Papitto et al., 2024). To include its , we convert the measured IXPE persistent count rate in the 2-8 keV band (from Figure 9 in Papitto et al. 2024) to “bolometric” 0.1-100 keV . Following Papitto et al. (2024) and Ng et al. (2024), we used a power law model with photon index of 1.9 and a Galactic . We thus list the obtained % (assuming kpc) and include the measured h.
Rapid Burster
The Rapid Burster, MXB 1730-335, is a recurrent transient having multiple recorded previous outbursts (Masetti, 2002; Heinke et al., 2024). It has also shown different bursting epochs with appreciably different recurrence times, as well as type II bursts (Guerriero et al., 1999).
Similarly to T5X2, Bagnoli et al. (2013) find that in the Rapid Burster, the bursting rate keeps increasing over a large range of persistent flux. To quantify their measurements, they convert from the PCA band (3-25 keV) to “bolometric” 0.1-200 keV , using a bolometric correction factor which is not provided. We include the reported in Figure 3 and (Bagnoli et al., 2013), using a distance of kpc. Burst recurrence times reach down to about min, while the accretion rate ranges around % .
IGR J17511-3057
The burster and transient accreting millisecon pulsar IGR J17511-3057 was observed by RXTE, INTEGRAL, Swift, as well as Chandra and XMM-Newton during its 2009 outburst (Falanga et al., 2011). The 13 XRBs were mostly discovered with RXTE (PCA) and INTEGRAL (JEM-X) observations. In order to estimate the persistent luminosity, Falanga et al. (2011) convert from the PCA band (2-60 keV) to “bolometric” 0.8-300 keV . For the timing of XRBs, detections from Chandra and XMM-Newton were also used. We include the h and the corresponding % , shown in Figure 10 of Falanga et al. (2011), for a source distance kpc.
SAX J1748.9–2021
The atoll source, burster and transient SAX J1748.9–2021 was observed during its 2015 outburst by INTEGRAL, XMM-Newton and Swift (Li et al., 2018). Counting 56 total observed XRBs, 26 XRBs were detected by INTEGRAL in the hard state, 25 by XMM-Newton in the soft state, and 5 by Swift in both states. We include the relation shown in Figure 4 of Li et al. (2018). Bursts have h and a corresponding range % .
MAXI J1816-195
The transient MAXI J1816-195 was discovered by MAXI during its only known outburst in 2022 (Negoro et al. 2022), and was found to be an accreting millisecond pulsar in a 4.8 h orbit (Bult et al. 2022), showing XRBs (Mandal et al., 2023). Using Insight-HXMT and NICER observations of 83 XRBs, Wang et al. (2024) convert for the 17 joint XRBs the NICER persistent count rates (1-50 keV) to “bolometric” 0.1-200 keV . To do so, they fitted the X-ray spectrum with a model consisting of an accretion disk with thermal Comptonization, assuming a Galactic and kpc. We include the relation shown in Figure 7 of Wang et al. (2024), with h and % .
Clocked Burster
For the transient atoll source known as the Clocked Burster (GS 1826-24), Galloway et al. (2004) analyzed 24 XRBs observed by RXTE between 1997-2002, and used to convert from the PCA band (2.5-25 keV) to “bolometric” 0.1-200 keV . We thus list the relation shown in Figure 4 of Galloway et al. (2004), featuring h and a corresponding % .
1RXS J171824.2-402934
The low-luminosity candidate UCXB 1RXS J171824.2-402934 (the lowest- NS in our sample) was discovered by Kaptein et al. (2000), with the detection of one XRB with the WFC. It is one of the “burst only” or very-faint persistent NS-LMXBs, showing very low ( erg s-1) when observed with sensitive pointed X-ray telescopes (in’t Zand et al., 2009a; Armas Padilla et al., 2013; Wijnands et al., 2015). We include the values listed in Table 2 of in’t Zand et al. (2007), with h and % . This is derived from the BeppoSAX-WFC database (in’t Zand et al., 2004), by dividing the total exposure time through the number of detected bursts. A monitoring campaign by in’t Zand et al. (2009b) detected a second XRB, putting the average waiting time between bursts at d (consistent with the range above). While having very few XRBs detected, the burst characteristics and the low luminosity point to an extremely low (in’t Zand et al., 2005).
1RXS J180408.9-342058
First detected by the ROSAT satellite (Voges et al., 1999), the burster 1RXS J180408.9-342058 was observed during its 2015 outburst by Swift, INTEGRAL and NuStar (Fiocchi et al., 2019), showing spectral state transitions. Fiocchi et al. (2019) analyzed the quasi-simultaneous observations in the “bolometric” 0.8-200 keV energy band, using a bolometric correction factor , assuming a distance of kpc. We include the values reported therein, with h and .
| 44footnotetext: Notes: a 4U 0919-54; b GX 354-/+0; c Rapid Burster; d IGR J17480-2446, 11 Hz X-ray pulsar; e Clocked Burster, GS 1826-238; f value not reported, only unabsorbed bolometric flux provided; g Source type, same as Galloway et al. (2020); A = atoll source, C = UCXB (including candidates), D = “dipper,” E = eclipsing, G = globular cluster association, I = intermittent pulsar, M = microquasar, O = burst oscillation, P = pulsar, R = radio-loud X-ray binary, S = superburst, T = transient, Z = Z-source. 44footnotetext: References:(1)Galloway et al. (2008);(2)in’t Zand et al. (2007);(3)Linares et al. (2012b);(4)Jenke et al. (2016);(5)Papitto et al. (2024);(6)Linares et al. (2010);(7)Bagnoli et al. (2013);(8)Linares et al. (2012a);(9)Falanga et al. (2011);(10)Mandal et al. (2023);(11)Galloway et al. (2004);(12)Li et al. (2018);(46)Fiocchi et al. (2019). 44footnotetext: 1Fiocchi et al. (2011); 2 Shahbaz et al. (2008); 3 in’t Zand et al. (2007); 4 Zhong & Wang (2011); 5 in’t Zand et al. (2007); 6 in’t Zand et al. (2007); 7 Ray et al. (2024); 8 Kaluzienski et al. (1976); 9 Güver et al. (2021); 10 Mandal et al. (2023); 11 Cominsky & Wood (1984); 12 Galloway et al. (2008); 13 Revnivtsev et al. (2013); 14 Vincentelli et al. (2020); 15 in’t Zand et al. (2007); 16 in’t Zand et al. (2007); 17 Zolotukhin & Revnivtsev (2011); 18 Papitto et al. (2011); 19 Sansom et al. (1993); 20 Riggio et al. (2011); 21 Chakrabarty & Morgan (1998); 22 Strohmayer et al. (2003); 23 Padilla A. et al. (2022); 24 Bult et al. (2022); 25 Stella et al. (1987); 26 Meshcheryakov et al. (2010); 27 Engel et al. (2012); 28 Gladstone et al. (2007); 29 Thorstensen et al. (1978); 30 Gladstone et al. (2007); 31 Prodan & Murray (2015); 32 Cowley et al. (1979); 33 Altamirano et al. (2008); 34 in’t Zand (2024). Burster | D | Type g | Spin Freq. 34 | Instrument | |||||
| Name | (kpc) | (Hz) | (h) | (h) | (Refs.) | ||||
| 4U 0513-40 | 11.3 | CG | - | 0.3 1 | 1.9 | 35-63 | 2.9 | WFC(2) | |
| 4U 0614+09 | 3 | ACRS | 415 | 0.8 2 | 0.8-0.9 | 8-9 | 28872 | 1.3-1.7 | GBM(3) |
| EXO 0748-676 | 6.3 | DEOT | 552 | 3.8 3 | 1.0 | 4.7-5.5 | 2.9 | WFC(2) | |
| 1M 0836-425 | 8 | T | - | - | 33 | 2.0 | PCA(1) | ||
| 2S 0918-549 a | 5 | C | - | 0.4 4 | 0.3-0.7 | 3.3-6.4 | 1340290 | 1.9 | GBM(4) |
| 4U 1246-58 | 4.8 | C | - | - | 0.5 | 139-417 | 2.9 | WFC(2) | |
| 4U 1254-69 | 13.6 | DS | - | 3.9 5 | 17.0 | 36.1-53.7 | 2.9 | WFC(2) | |
| 4U 1323-62 | 14 | D | - | 2.9 6 | 4.3 | 28-50 | 2.9 | WFC(2) | |
| SRGA J144459.2-604207 | 8.5 | T | 448 | 5.2 7 | 5-23 | 50-228 | 2.2-7.9 | - f | ART-XC(5) |
| Cir X-1 | 7.8 | ADMRT | - | 398 8 | 17.6-22.4 | 174-221 | 0.33-0.5 | 1.02 | PCA-XRT(6) |
| 4U 1608-52 | 4.1 | AOST | 620 | 12.9 9 | 5.2 | 3.5 | PCA(1) | ||
| 4U 1636-53 | 5.3 | AOS | 581 | 3.8 10 | 10.9 | 7.9-9.9 | 2.9 | WFC(2) | |
| MXB 1659-298 | 10 | DEOT | 567 | 7.1 11 | 4 | 1.8 | 1.38 | PCA(1) | |
| 4U 1702-429 | 5.1 | AO | 329 | - | 2.7 | 10.4-12.4 | 2.9 | WFC(2) | |
| 1RXS J170854.4-321857 | 11.7 | C | - | - | 1.5 | 101-1904 | 2.9 | WFC(2) | |
| 4U 1705-440 | 5.8 | AR | - | - | 7.2 | 14.6-18.4 | 2.9 | WFC(2) | |
| XTE J1710-281 | 16 | DET | - | 3.9 12 | 0.8 | 3.3 | PCA(1) | ||
| SAX J1712.6-3739 | 6.4 | CT | - | 1.0 13 | 0.5 | 345-6507 | 2.9 | WFC(2) | |
| 1RXS J171824.2-402934 | 7.3 | C | - | - | 0.03 | 438-8254 | 2.9 | WFC(2) | |
| 4U 1724-307 | 5.4 | ACG | - | - | 1.8 | 45-69 | 2.9 | WFC(2) | |
| 4U 1728-34 b | 4.2 | AOR | 363 | 2 14 | 4.4 | 3.0-3.4 | 2.9 | WFC(2) | |
| MXB 1730-335 c | 7.9 | DGRT | - | - | 9-40 | 89-395 | 0.17-1.10 | - f | PCA(7) |
| KS 1731-260 | 7.2 | OST | 524 | - | 5 | 2.5-6.4 | PCA(1) | ||
| SLX 1735-269 | 6 | CS | - | - | 1.0 | 387-7301 | 2.9 | WFC(2) | |
| 4U 1735-44 | 7.7 | ARS | - | 4.7 15 | 28.6 | 25.1-34.7 | 2.9 | WFC(2) | |
| SLX 1737-282 | 5.9 | C | - | - | 0.4 | 412-7778 | 2.9 | WFC(2) | |
| 1A 1742-294 | 7.2 | - | - | - | 2.7 | 5.7-6.5 | 2.9 | WFC(2) | |
| SLX 1744-300 | 10.5 | T | - | 65 16 | 3.2 | 18-31.4 | 2.9 | WFC(2) | |
| SLX 1744-299 | 7 | T | - | 24 17 | 1.9 | 188-793 | 2.9 | WFC(2) | |
| GX 3+1 | 5.5 | AS | - | - | 22.2 | 18.7-24.1 | 2.9 | WFC(2) | |
| T5X2 d | 6.3 | GOPT | 11 | 21.3 18 | 18-50 | 178-495 | 0.08-60 | 1.13 | PCA(8) |
| EXO 1745-248 | 5.5 | DGST | - | - | 5 | 2.9 | PCA(1) | ||
| SAX J1748.9–2021 | 8.2 | AGIT | 410 | 8.7 33 | 13-27 | 129-272 | 0.9-2.1 | - f | JEMX-XRT(12) |
| 4U 1746-37 | 11 | ADG | - | 5.7 19 | 15 | 1.0 | PCA(1) | ||
| IGR J17511-3057 | 7 | OPT | 245 | 3.5 20 | 2-4 | 20-40 | 7.1-15.8 | - f | JEMX-PCA(9) |
| 1RXS J180408.9-342058 | 5.8 | - | - | - | 7.2-10.4 | 71-103 | 1.1-2.2 | 1.0 | XRT FPMA/B(46) |
| SAX J1808.4-3658 | 3.6 | OPRT | 401 | 2.0 21 | 1.1 | 21 | PCA(1) | ||
| XTE J1814-338 | 8 | OPT | 314 | 4.3 22 | 4 | 1.7-6 | PCA(1) | ||
| 4U 1812-12 | 3.5 | AC | - | 1.9 23 | 0.5 | 61.3-99.1 | 2.9 | WFC(2) | |
| GX 17+2 | 12 | RSZ | - | - | 263 | 76-134 | 2.9 | WFC(2) | |
| MAXI J1816-195 | 6.5 | T | - | 4.8 24 | 18-27 | 178-267 | 1.2-2 | - f | FPMA(10) |
| 4U 1820-303 | 6.1 | ACGRS | - | 0.2 25 | 24.7 | 22.8-30.4 | 2.9 | WFC(2) | |
| GS 1826-24 e | 6 | T | - | 2.1 26 | 4-7 | 40-70 | 3.5-5.9 | PCA(11) | |
| XB 1832-330 | 8.3 | G | - | 2.2 27 | 1.2 | 20.4-35.2 | 2.9 | WFC(2) | |
| Ser X-1 | 8.4 | ARS | - | - | 42.7 | 46-104 | 2.9 | WFC(2) | |
| 4U 1850-08 | 5.9 | ACGR | - | 0.3 28 | 0.5 | 1584 | 2.9 | WFC(2) | |
| Aql X-1 | 5 | ADIORT | 549 | 19 29 | 5.5 | 3.5 | PCA(1) | ||
| 4U 1915-05 | 5.7 | ACD | 270 | 0.8 30 | 1.1 | 20-42 | 2.9 | WFC(2) | |
| M15 X-2 | 7.4 | CGR | - | 0.4 31 | 1.2 | 37-984 | 2.9 | WFC(2) | |
| Cyg X-2 | 11.6 | RZ | - | 236 32 | 105 | 1.0 | 1.38 | PCA(1) |
2.2 mHz QPOs: correlation
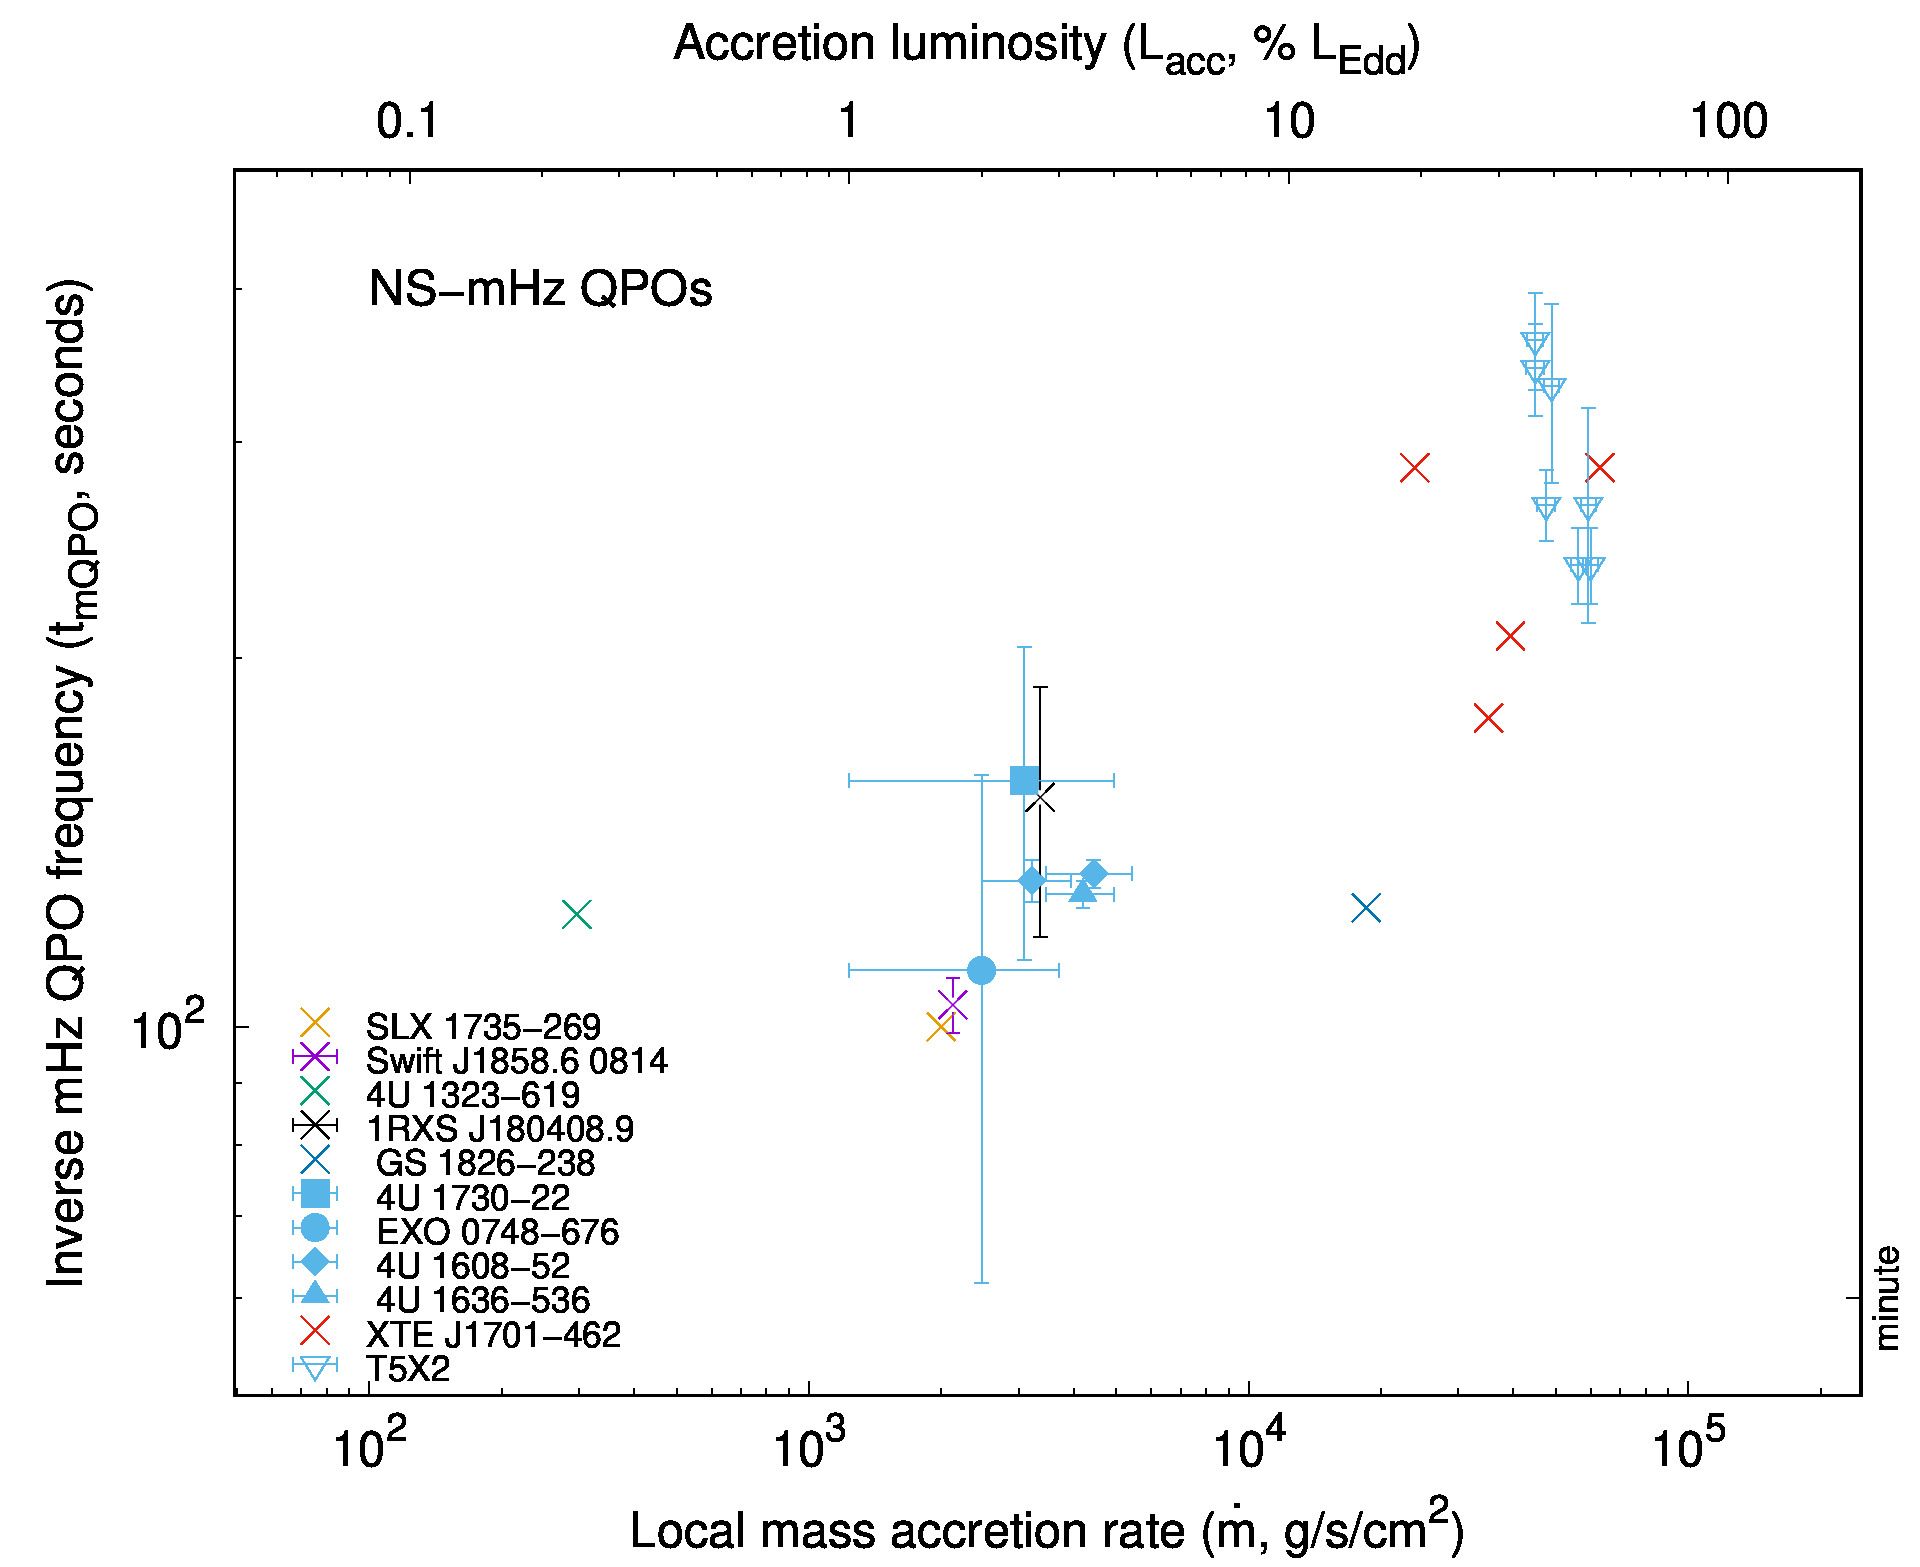
Furthermore, we compile the timescale of the inverse QPO frequency defined as , for the bursters that have also shown mHz QPOs, as well as the where these have been observed, listed in Table 2. We include the errors on the mHz QPO frequency, and the range of where applicable.
The frequency range of the observed mHz QPOs is mHz, which corresponds to timescales of s. We find 11 sources with mHz QPO detections in the literature, shown in Table 2. Only 8 of these are listed as bursters in Table 1, since the remaining 3 do not fullfill our selection criteria (Section 2.1)555We find no reliable measurements for XTE J1701-462 (the first known transient Z source), 4U 1730-22 and Swift J1858.6–0814, but we report the measured and the associated ..
In Figure 2, we present the ranges of , where mHz QPOs have been observed. The atoll sources cluster around , an order of magnitude below T5X2 and XTE J1701-462, which are observed around . The general trend seen in Figure 2 shows longer timescales (lower ) for mHz QPOs at higher accretion rates. Thus, we find that our sample of 22 observations of mHz QPO timescale and show a negative correlation, with a Pearson correlation coefficient (for ).
T5X2 is the only burster (and mHz QPO source) with a known spin frequency below 200 Hz, and it showed mHz QPOs at high and high (Linares et al., 2012a, see Tables 1 and 2). Interestingly, we find that XTE J1701-462 occupies the exact same region (Figure 2). This suggests that XTE J1701-462 might be a slow rotator, if the mHz QPO frequency and mass accretion rate are indeed dependent on the NS spin frequency. Alternatively, we could be witnessing marginally stable burning of different elements (hydrogen and helium) at different mass accretion rates (a few percent and a few tens of percent, respectively).
| 55footnotetext: References:(8)Linares et al. (2012a);(12)Tse et al. (2023);(13)Revnivtsev et al. (2001);(14)Strohmayer & Smith (2011);(15)Mancuso et al. (2019);(16)Mancuso et al. (2023);(17)Strohmayer et al. (2018);(18)Tse et al. (2021);(19)Buisson et al. (2020);(43)Molkov et al. (2005). Burster | Spin Freq. (Hz) | D (kpc) | Date (MJD) | QPOs frequency (mHz) | References | |
| XTE J1701-462 | - | 6.4 | 53817 | 3.5 | 510 | (12) |
| 53859 | 4.8 | 320 | ||||
| 53996 | 5.6 | 290 | ||||
| 54279 | 3.5 | 190 | ||||
| T5X2 | 11 | 6.3 | 55485.46 | 450 | (8) | |
| 55485.63 | 490 | |||||
| 55487.43 | 560 | |||||
| 55487.62 | 600 | |||||
| 55488.26 | 590 | |||||
| 55489.59 | 480 | |||||
| 55490.63 | 450 | |||||
| 4U 1608-52 | 620 | 4 | 50145-50148 | 50-80 | (13) | |
| 50896-50899 | 40-60 | |||||
| 4U 1636-536 | 581 | 5 | 50174-51210 | 30 | (13) | |
| 46285 | 30-50 | |||||
| 4U 1323-619 | - | 14 | 55648 | 8.1 | 2666 inferred from luminosity reported in Tse et al. (2021). | (14) |
| EXO 0748-676 | 552 | 7.1 | 53071-54439 | 5-13 | 10-30 | (15) |
| 4U 1730-22 | 585 | 6.9 | 59624-59809 | 4.5-8.1 | 10-40 | (16) |
| GS 1826-238 | - | 5.7 | 58005-58011 | 8 | 150 | (17) |
| 1RXS J180408.9-342058 | - | 5.8 | 57087 | 5-8 | 3 | (18) |
| Swift J1858.6–0814 | - | 12.8 | 58930 | 20 | (19) | |
| SLX 1735-269 | - | 8.5 | 52902 | 10 | 20 | (43) |
2.3 Results: neutron star burst recurrence times
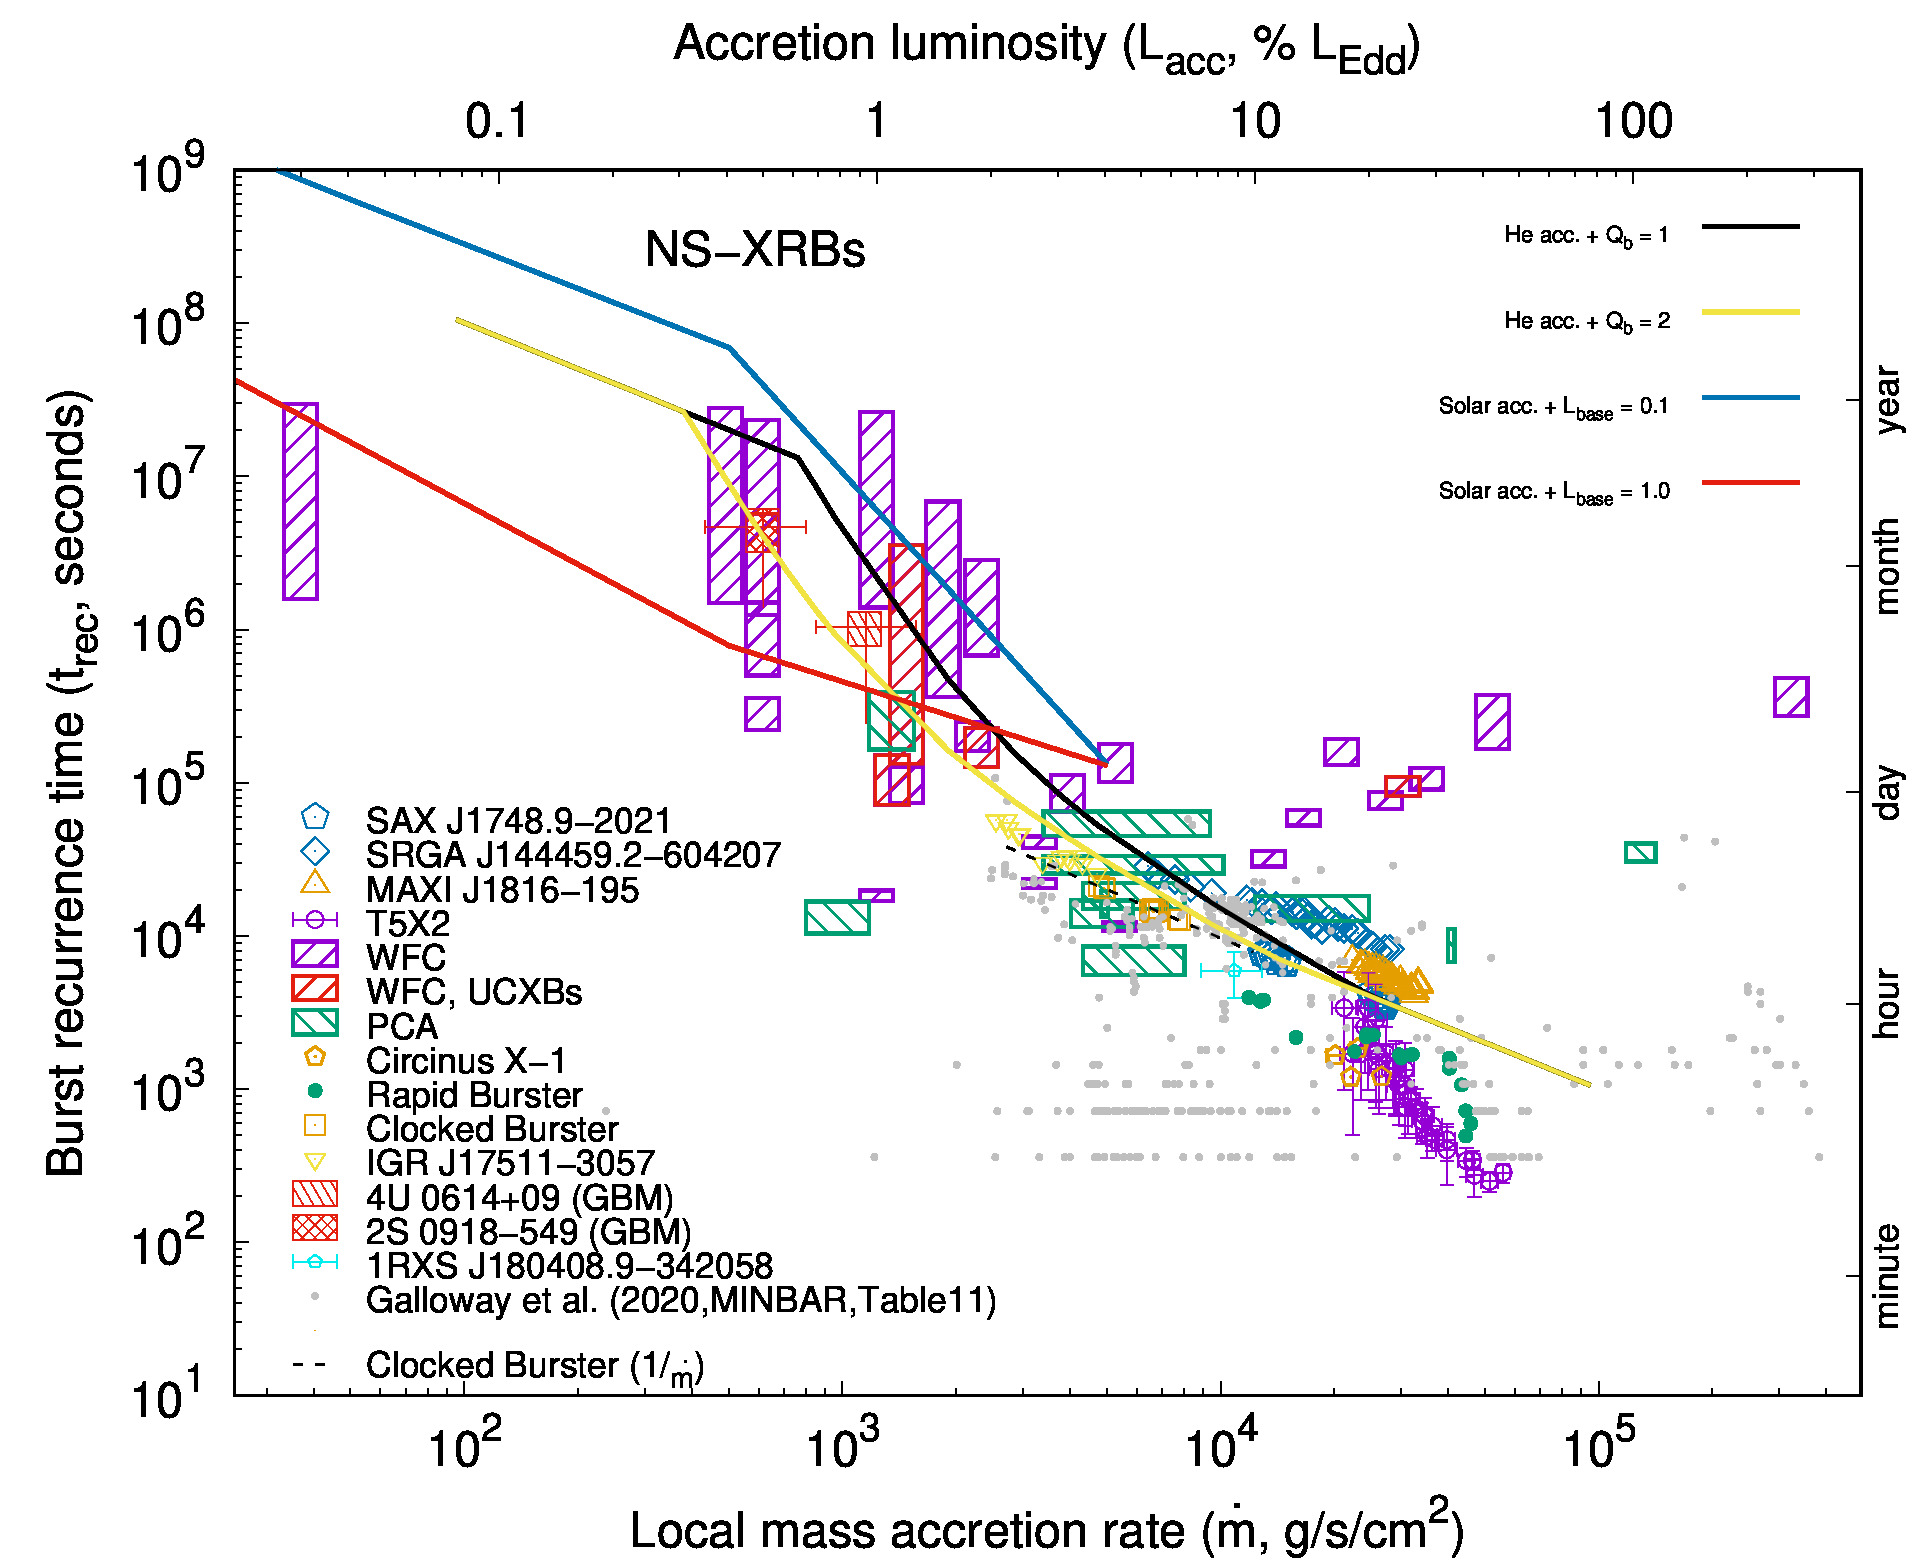
We show in Figure 1 the observed vs in XRBs, over a range of 5 orders of magnitude in and 4 orders of magnitude in . The WFC measurements from in’t Zand et al. (2007) are separated in two categories, the purple rectangles denoting LMXBs with h or unknown period, and the red rectangles (including the GBM measurements of 4U 0614+09 and 2S 0918-549) showing UCXBs. The 7 UCXBs reported in Table 1 are the systems: 4U 0513-40, 4U 0614+09, 2S 0918-549, 4U 1820-303, 4U 1915-05, 4U 1850-08 and M15 X-2. Most UCXBs are observed accreting around 1% of , with the exception of 4U 1820-303, which is at % .
The green rectangles indicate PCA measurements from Galloway et al. (2008). The remaining sources, namely SAX J1748.9-2021, SRGA J144459.2-604207, MAXI J1816-195, T5X2, Cir X-1, Rapid Burster, GS 1826-24 (Clocked burster) and IGR J17511-3057, are shown separately with different symbols. We also show the relation (, with ) for the bursting evolution of the Clocked burster (dotted black line in Figure 1, fit from Figure 4 of Galloway et al. 2004). The source which follows a similar evolution in the is SAX J1748.9-2021, with (Li et al., 2018).
For , a bifurcation in the frequency of observed XRBs is seen. Some systems burst more frequently for higher accretion rates (Linares et al., 2012a), whereas others show less frequent bursts (Cornelisse et al., 2003). The mechanism behind this observed difference may be attributed to a changing accretion geometry (Bildsten, 1998), to the ignition location with respect to the pole of the NS, or to the spin rate (Linares et al., 2012a; Cavecchi et al., 2017). Mixing of the ashes with burning layers has also been invoked as a possible explanation (Galloway et al., 2018). In the pure He ignition regime, a relation is expected (Cumming et al., 2006). Linares et al. (2012a) found for the lower bursts from T5X2 (their regime B). In summary, XRBs at high accretion rates () show a complex phenomenology, deviations from a linear relation and evidence for a possible influence of the underlying NS spin (Linares et al., 2012a; Cavecchi et al., 2017; Galloway et al., 2018).
At low , the overall XRB trend is roughly consistent with a relation (see Section 5 for further discussion). Two sources clearly depart from such overall trend: EXO 0748676 and XTE J1710281 ( and of a few h). They are both "dippers" and eclipsing systems, which suggests that the mass accretion rates may be underestimated (i.e., that inclination effects are critical and the assumption of isotropic accretion luminosity may break).
3 White dwarfs
In this section we compile a list of recurrence times of known recurrent novae (RNe), together with , estimated from the average provided from observational constraints (explained separately for each source listed in Table 3). These RNe can be identified by having at least two confirmed observed eruptions, or alternatively based on the presence of nova super-shells, that confirm past explosions (Darnley et al. 2019).
3.1 The RNe sample: recurrence times and accretion rates
Our list consists of the Galactic RNe with measured recurrence times (Schaefer, 2010; Schaefer et al., 2022b), as well as confirmed RNe in the Large Magellanic Cloud (LMC, from Rosenbush 2020) and M31 (Shafter et al., 2015). We only list RNe which have empirical constraints on both and . This means that the RNe V394 CrA and V745 Sco listed in Schaefer (2010) (with respective of 30 and 23 yr) are not shown in Table 3, because to the best of our knowledge no observational constraints exist on the of these systems (only model estimations on the and the can be found in Shara et al. 2018).
Calculating will allow us to compare XRBs from accreting NS with RNe from accreting WDs. Using the known relation for the WD radius (Chandrasekhar, 1933):
| (2) |
and the tabulated for each system, we calculate , and report them in Table 3. This is a simplified mass-radius relation for massive WDs, but sufficient for our goal of estimating . It is also useful to mention that is high in many RNe (see also Shara et al. (2018), where the 10 Galactic RNe analyzed, have an average of 1.31).
The eruption for 9 out of the 11 known Galactic RNe are reported in Schaefer (2010), where is calculated taking possible missed eruptions into account. This is done by calculating statistically the efficiency of the discovery of a nova event, as well as studying the time interval ranges between eruptions. The justification for this assumption is based on the fact that a multitude of reasons can lead the observing runs to miss a nova event (Schaefer, 2010). The and of the 12 RNe are listed in Table 3. We present in Figure 3 the vs relation.
CNe are expected to have that are much longer than 100 yr, and so much lower , and possibly lower are expected to be present in these systems, in general. These estimates have been reported in multiple works (see e.g., Shara et al. 2018). We now move on to explain how the listed in Table 3 are estimated for each RN.
T Pyx
One of the most well known, and the first to be classified as RN, T Pyxidis first nova eruption was in 1890, discovered by H.Leavitt (Pickering, 1913). Since then it has had 5 confirmed eruptions, the last one being in 2011. Selvelli et al. (2008) estimate from the International Ultraviolet Explorer (IUE) spectroscopic and optical data, by assuming that the accretion disk is heated by viscous dissipation of gravitational energy. From their Equation (10), given the luminosity of the disk and a range of masses , they report a range of . They also estimated from the boundary layer luminosity, yielding a value of . The third estimate used was the absolute optical magnitude versus the accretion rate for the “reference” alpha-disc model of Shakura & Sunyaev (1973) (), and depending on the inclination, one can get values for as high as for T Pyx. The value we adopt here is the range of given in Table 3 of Selvelli et al. (2008), with , for a range of and yr (Schaefer, 2010).
IM Nor
IM Normae shows similarities to T Pyx, such as the orbital light curves. It was discovered in 1920 (Woods, 1920), and since then, not much was known about the system until the second eruption in 2002 (Liller, 2002). The recurrence time listed in Table 3 is an upper limit (Patterson et al., 2022), and the intrinsic value is given by , with N being the uncertain number of missed eruptions (taking the values of 1, 2, 3 or 4). Patterson et al. (2022) use the eclipse times to derive and its derivative of the system, which they then combine with the masses of the binary system (assuming a WD mass and a companion mass of ), to infer a mass transfer rate (assuming this is approximately equal to ) of , which we list, together with yr.
CI Aql
CI Aql had its first confirmed eruption in 1917 (Schaefer, 2010). Sion et al. (2019) obtained an estimate for by fitting Far UV spectrum data (FUV, to ) from Hubble Space Telescope (HST), to model WD accretion disks and photospheres. Together with the Gaia parallax (giving a distance of 3.062 kpc), they constructed models of modified "standard disk" (Godon et al., 2017) of Wade & Hubeny (1998), choosing the disk radius and photosphere temperature, as well as the system parameters (inclination, , ), in order to best fit the spectra obtained. They estimated a value of . Similarly to Selvelli et al. (2008), using P and , Sion et al. (2019) are able to also estimate the WD in the range . We use and plot the value of , in conjunction with yr.
V2487 Oph
V2487 Ophiuchi was first discovered on June 15 1998 (Lynch et al., 2000). Schaefer et al. (2022a) obtained and combined a large set of photometric observations, spanning from 2002 to 2018. By constructing the lightcurve and interpreting the shape of the spectral energy density (SED) profile, Schaefer et al. (2022a) argue that the disk dominates the flux, and estimate by fitting to the available SED an alpha-disc model (Shakura & Sunyaev, 1973) plus a blackbody model (Section 2.4 therein). Another way they obtain is through the absolute magnitude of the disc in the V-band. Here, using only the alpha-disc model, in the V-band the luminosity is almost entirely from the disc, and considering the possible range of inclination angles ( to ), Schaefer et al. (2022a) get a range of . The two methods give and respectively, with the central value being . In our Table 3 and Figure 3, we include the full range of estimated , with yr.
U Sco
U Scorpii had its first identified eruption in 1863 (Schaefer, 2010). Following its 2010 outburst, Maxwell et al. (2014) aimed to study the system in quiescence, by obtaining Very Large Telescope (VLT) and Southern African Large Telescope (SALT) spectra 18 and 30 months after the outburst respectively. A model of the accretion disc and the companion star as a single stellar model was fitted to the VLT spectra. This method gave low values of , in the range . The second method used, common for RNe, is the strength of the He II line, which is shown to serve as an empirical relation of in compact CVs (Patterson & Raymond, 1985). The latter gave a range of accretion rates . Maxwell et al. (2014) argue that the discrepancy between the values is mainly due to different epochs during outbursts, since shortly after the outburst the disc hasn’t reached its steady state, which took 18 months to fully reform. We take the accretion rate, being the more representative measure of the average between eruptions, for yr.
T CrB
T Coronae Borealis is among the best known RNe, showing recorded eruptions in 1866 and 1946, but also possible eruptions in 1217 and 1787 (Schaefer, 2023). With the next outburst predicted to occur imminently (see José & Hernanz (2025), for new nucleosynthesis predictions
for the forthcoming outburst), monitoring campaigns and observations are being prepared to study the system in detail once again. To estimate , Zamanov et al. (2023) performed and analyzed UBV photometry during and after its superactive state between 2016 and 2023. From their analysis, they obtained the and colors of T CrB, and subtracted the contribution of the ’cool’ component of the system (red giant). This left them with the hot component of the system (the WD), where using a distance of 914 pc and calculating the dereddened magnitude of the WD, they were able to calculate the effective radius and optical luminosity of the WD. Finally, by linking the optical luminosity to through the relation
| (3) |
with being the inclination angle, assuming the main contributor to the optical luminosity is the accretion disc, Zamanov et al. (2023) obtained in the range , which we use together with yr (Schaefer, 2010).
RS Oph
Nelson et al. (2011) obtained and analyzed light curves and spectra for RS Oph in 2007 and 2008 using Chandra and XMM-Newton. It became apparent that the source was variable, suggesting that this was due to accretion-induced flickering. They estimated the amplitude of the flickering to constrain , following Bruch (1992). This method gave lower limits on in the range (not sufficient to explain such frequent eruptions). To place an upper limit on , a cooling flow model was used to fit the spectra (Mukai et al., 2003) and an optically-thick region of the boundary layer of the accretion disc was assumed (Patterson & Raymond, 1985). This called for the addition of a blackbody component to the model fit. Using values for the distance between 1.6 and 2.45 kpc, the cooling flow plus optically-thick disc can produce a value of in the range , which we include together with yr.
V3890 Sgr
The first eruption of V3890 Sgr occurred in 1962, and was published by Dinerstein & Hoffleit (1973). By analyzing SALT optical photometry and spectroscopy data of the system at quiescence, Mikołajewska et al. (2021) deduce the of the binary and the mass of the WD (shown in Table 3). Through the presence and intensity of the He II line, they place a lower limit value on the accretion rate of . Secondly, from the luminosity of the blue continuum of the source, as well as indicating that the supersoft X-ray emission begins 8.5 d later, and ends by day 26 of the nova outburst, they also infer an upper limit of . Thus, we use , and yr.
KT Eri
Schaefer et al. (2022b) also used the alpha-disc model to convert the absolute optical magnitude of the system KT Eridani into an estimate of . This was done by calculating the average V-magnitude of the system when in quiescence, and then correcting with the absolute optical magnitude of the disc alone. The latter can be calculated from fitting a blackbody plus alpha disc model to the SED profile of the system. The accretion luminosity gives out a flux both in the optical, as well as the ultraviolet, but Schaefer et al. (2022b) argue that the is a good proxy of . The value they get is , which is a very high rate, and is sitting in the zone of stable and continuous H burning on the surface of the WD (see also Figure 8 of Schaefer et al. 2022b).
A key difference in this system lies in the way is calculated. Instead of looking for observations of previous eruptions and using the intervening quiescent epoch, archival sky photographs worldwide were investigated to constrain the possible times of prior eruptions. This gave the only possible ranges of yr and yr. From the optical, X-ray light curves and the radial velocity curves, the mass of the WD in KT Eri was constrained within . Thus, we include the aforementioned mass range and an accretion rate . Combining the archival constraints, and the average and derivation, including uncertainties, we take the range of yr given in Schaefer et al. 2022b.
M31N 2008-12a
M31N 2008-12a was first discovered during a nova eruption in 2008 (Nishiyama & Kabashima, 2008). The curious case of this RN erupting every year (Darnley et al., 2016) requires model assumptions of (simultaneously) very high values of , and initial WD luminosity to power such frequent nova eruptions. To obtain in quiescence from photometric observations of M31N from HST, Darnley et al. (2017) follow up the 2015 eruption and construct the SED of the system. By constructing a model accretion disc to be fitted to the SED, they arrive at a range of . This is the highest accretion rate inferred to date in any RN. The of the system hasn’t been determined, but constraints have been placed due to knowledge of the and the radius of the donor (see Sec. 5.3 in Darnley et al. 2017), which we report in Table 3.
Nova LMC 1968
Nova LMC 1968 (in the Large Magellanic Cloud) was the first extragalactic nova discovered (Shore et al., 1991). Rosenbush (2020) lists known and candidate extragalactic RNe, where Nova LMC 2016-01a is reported as an extragalactic RN with 6 known eruptions (newest reported in Darnley et al. 2024), and a yr. In that work, using an estimated mass ejection of from photoionization modeling, Shore et al. (1991) inferred a lower limit of (also mentioned in Kuin et al. 2020), which we include. From the observed UV luminosity, it is also argued that a He-enriched mixture for the fuel is more appropriate.
Nova LMC 1971b
First discovered in 2009 (Liller & Monard, 2009) and also reported in Rosenbush (2020), Nova LMC 2009-2a has had two eruptions confirmed so far, the first one being Nova LMC 1971b (cofirmed by position measurements within 0.11”, see Bode et al. 2016) yielding yr. By obtaining optical and near-infrared photometry using the Small and Moderate Aperture Research Telescope System (SMARTS) 1.3 m telescope, as well as spectroscopy, Bode et al. (2016) measure the intensity of the He II 4686 line, and also argue that from the shape of the SED, the luminosity of the system is dominated by the disc. By fitting a model disc to the data, they derive an accretion rate range of , which we list, as well as with yr.
3.2 Extragalactic RNe without constraints
Other extragalactic RNe with confirmed eruptions, as well as candidate RNe in the Andromeda galaxy (M31), Large Magellanic Cloud (LMC) and Small Magellanic Cloud (SMC) have been reported by Shafter et al. (2015) and Rosenbush (2020) respectively (as well as telegrams and discovery reports therein). These systems either lack detailed photometry and spectroscopy for analysis, or have not been studied in detail as of yet. We only report the recurrence times found for each source below.
From the confirmed RNe in M31 (Shafter et al., 2015), M31N 1926-07c (having detected subsequent eruptions 1997-10f and 2008-08b, Table 3 of Shafter et al. 2015) and M31N 2017-01e (with all recorded eruptions being M31N 2012-01c, 2017-01e, 2019-09d, and 2022-03d, see Shafter et al. 2022) have of 2.8 and 2.5 yr, respectively. One of the most recently identified and most luminous known RNe in M31 is M31N 2013-10c (reported in Shafter et al. 2023, 2024), having an upper limit of yr, and being the RNe identified so far in M31.
3.3 Results: white dwarf eruption recurrence times
In Table 3 we present the compiled vs for RNe, which we also show in Figure 3. The range from to . In the cases of KT Eri and IM Nor (as explained above), their is given as an upper limit in the first case and as a range in the second.
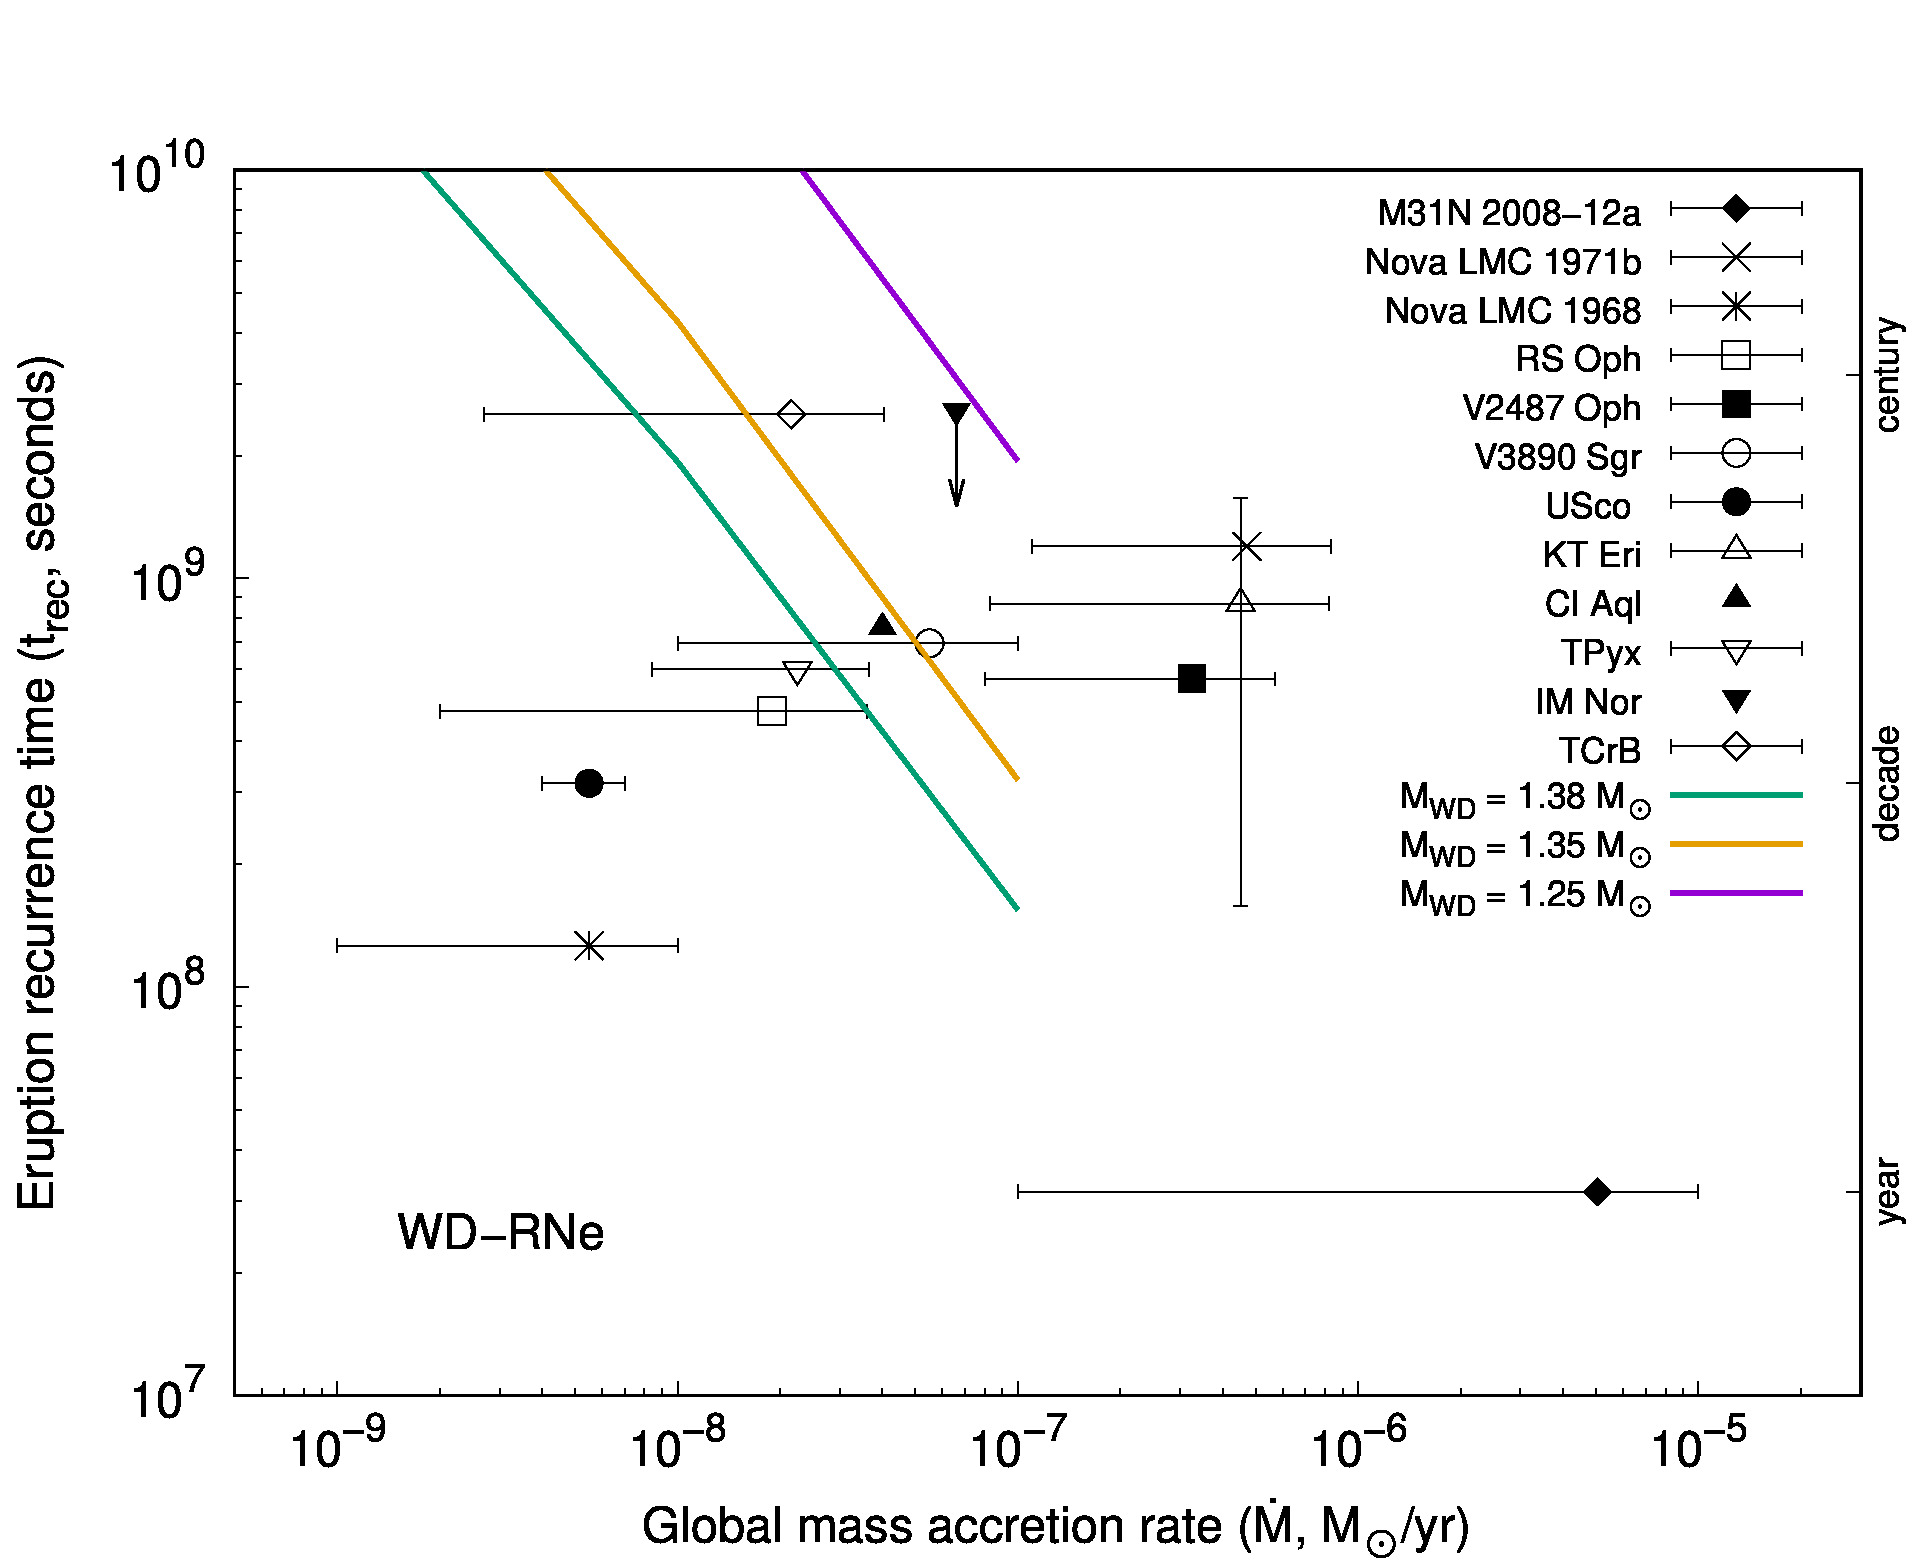
We find that the RN M31N 2008-12a (with yr; Darnley et al., 2016; Henze et al., 2018) bridges the gap between the much less frequent WD eruptions ( decades-century) and the XRBs from NS-LMXBs ( minutes-months). This subcategory of RNe (with yr) are referred to as ’rapid recurrent novae’ (RRNe) (Darnley & Henze, 2020). Only extragalactic RRNe have been observed so far (in M31), RN M31N 2008-12a being the only one with estimates and thus included in Table 3 (but see also Section 3.2 and Shafter et al. 2015).
From our WD sample, we find no significant correlation between and . The Pearson correlation coefficient for our sample of 12 RNe is (with a P-value of 0.3564), suggesting weak or no correlation. This observed lack of correlation may be due to a combination of:
-
1.
a small WD sample spanning a relatively narrow range of . Our NS sample spans 4 orders of magnitude, whereas the WD sample covers 3 orders of magnitude in . However, the - anti-correlation is seen in NSs over much smaller ranges (1 order of magnitude, see Fig. 1).
-
2.
Uncertainties in our estimates of . We used different methods to estimate the mass accretion rate in our WD sample, and this could increase the scatter in the - relation.
- 3.
In the future, a larger sample of RNe with measured as well as more accurate estimates could reveal whether WDs trace a single relation, or they trace intrinsically different tracks in the - plane.
4 Ignition models
4.1 SHIVA
The simulations of RNe and XRBs presented in this study were conducted using the hydrodynamic, Lagrangian, finite-difference, time-implicit code SHIVA (see José & Hernanz 1998; José 2016, for details). SHIVA is based on the standard set of stellar evolution differential equations (conservation of mass, energy, and momentum, along with energy transport) and has been a extensively used in the study of stellar explosions for over 25 years. The code employs a detailed equation of state that includes contributions from a degenerate electron gas, a multicomponent ion plasma, and radiation (Blinnikov et al., 1996). Coulomb corrections to the electron pressure are accounted for, and OPAL Rosseland mean opacities are adopted (Iglesias & Rogers, 1996). Nuclear energy generation is calculated using a reaction network comprising 120 isotopes (from 1H to 48Ti) and 630 nuclear processes, for recurrent novae, and 324 isotopes (1H to 107Te) and 1392 nuclear interactions, for Type I X-ray bursts. Reaction rates are drawn from the STARLIB database (Sallaska et al. 2013, and C. Iliadis, pers. comm.). The code incorporates as well screening factors and neutrino energy losses.
All simulations utilizing SHIVA in this work assume that the plasma accreted from the companion star has a Solar composition, with abundances taken from Lodders et al. (2009). SHIVA also features a time-dependent formalism for modeling convective transport, which activates when the characteristic convective timescale exceeds the integration timestep. Partial mixing between adjacent convective shells is treated using a diffusion approximation (Prialnik et al., 1979). No additional processes such as semiconvection or thermohaline mixing are included in the simulations.
4.2 SETTLE
To recreate the XRB ignition models of Cumming & Bildsten (2001) over a wide range in , we used the latest version of pysettle888https://github.com/adellej/pysettle (Goodwin et al., 2019). Pysettle is a semi-analytic ignition model for XRBs, using a multi-zone model of the accreting layer and a one-zone ignition criterion. Pysettle assumes that the accumulating fuel layer is heated by hot CNO H burning within the layer, and a constant flux from deeper layers (see Section 4.3 below). It does not include heating from energy released in previous bursts, or the possibility of ignition of unburnt fuel within the ashes of previous bursts. All pysettle models assume pure He accretion (=0), and a metallicity of . Models for XRBs including compressional heating in pysettle were also calculated for the , but the results did not differ from the non-compressional heating models.
4.3 Heat flux and relation
Heat flux from the NS crust (e.g., due to pycnonuclear reactions, Haensel & Zdunik, 1990) or from the WD reaching the base of the envelope can have an important effect on . Such base flux is parameterized in SHIVA by a constant luminosity imposed at the base of the envelope (), while settle uses a heat flux proportional to : the energy released per accreted nucleon (). These two parameterizations are simply related as (e.g., =1 corresponds to MeV nucleon-1 at = 1% ).
To estimate the relation for hydrogen-rich XRBs on NSs at low accretion rates, we calculate using SHIVA the time until the first burst for [0.1, 1.0] , and for three values of =[, , ] . We then infer the corresponding for the resulting grid of models (assuming that the time between bursts remains constant). The resulting hydrogen XRB relations are shown in Figure 1 (blue and red solid lines).
To estimate the relation for pure He bursts on NSs at a wide range of , we run two sequences of models with settle using and 2 MeV nucleon-1. From Figure 1 (yellow line), it is evident that the XRB ignition for pure He and agrees very well with the observations at 1%. The two UCXBs 4U 0614+09 and 2S 0918-549, which have the most precise constraints thanks to Fermi-GBM monitoring observations (Linares et al., 2012b; Jenke et al., 2016), are connected by these 2 MeV nucleon-1 models. For accretion rates , the observed XRB behavior is more complex (as summarized in Section 2.1). We do not attempt to model this regime in this work, but focus instead on low- XRBs and the connection with WD RNe.
The WD relations (solid lines) shown in Figure 3 have been modeled in this work using SHIVA. By using different WD masses, and keeping the same luminosity and metallicity, we obtain qualitatively different tracks. The observed systems vary significantly in . Thus, we calculate three different sequences with , all using a WD luminosity and a metallicity . The resulting models are shown in Figure 3. As expected, only the models with the highest and are able to reproduce RNe with less than a decade.
5 Discussion
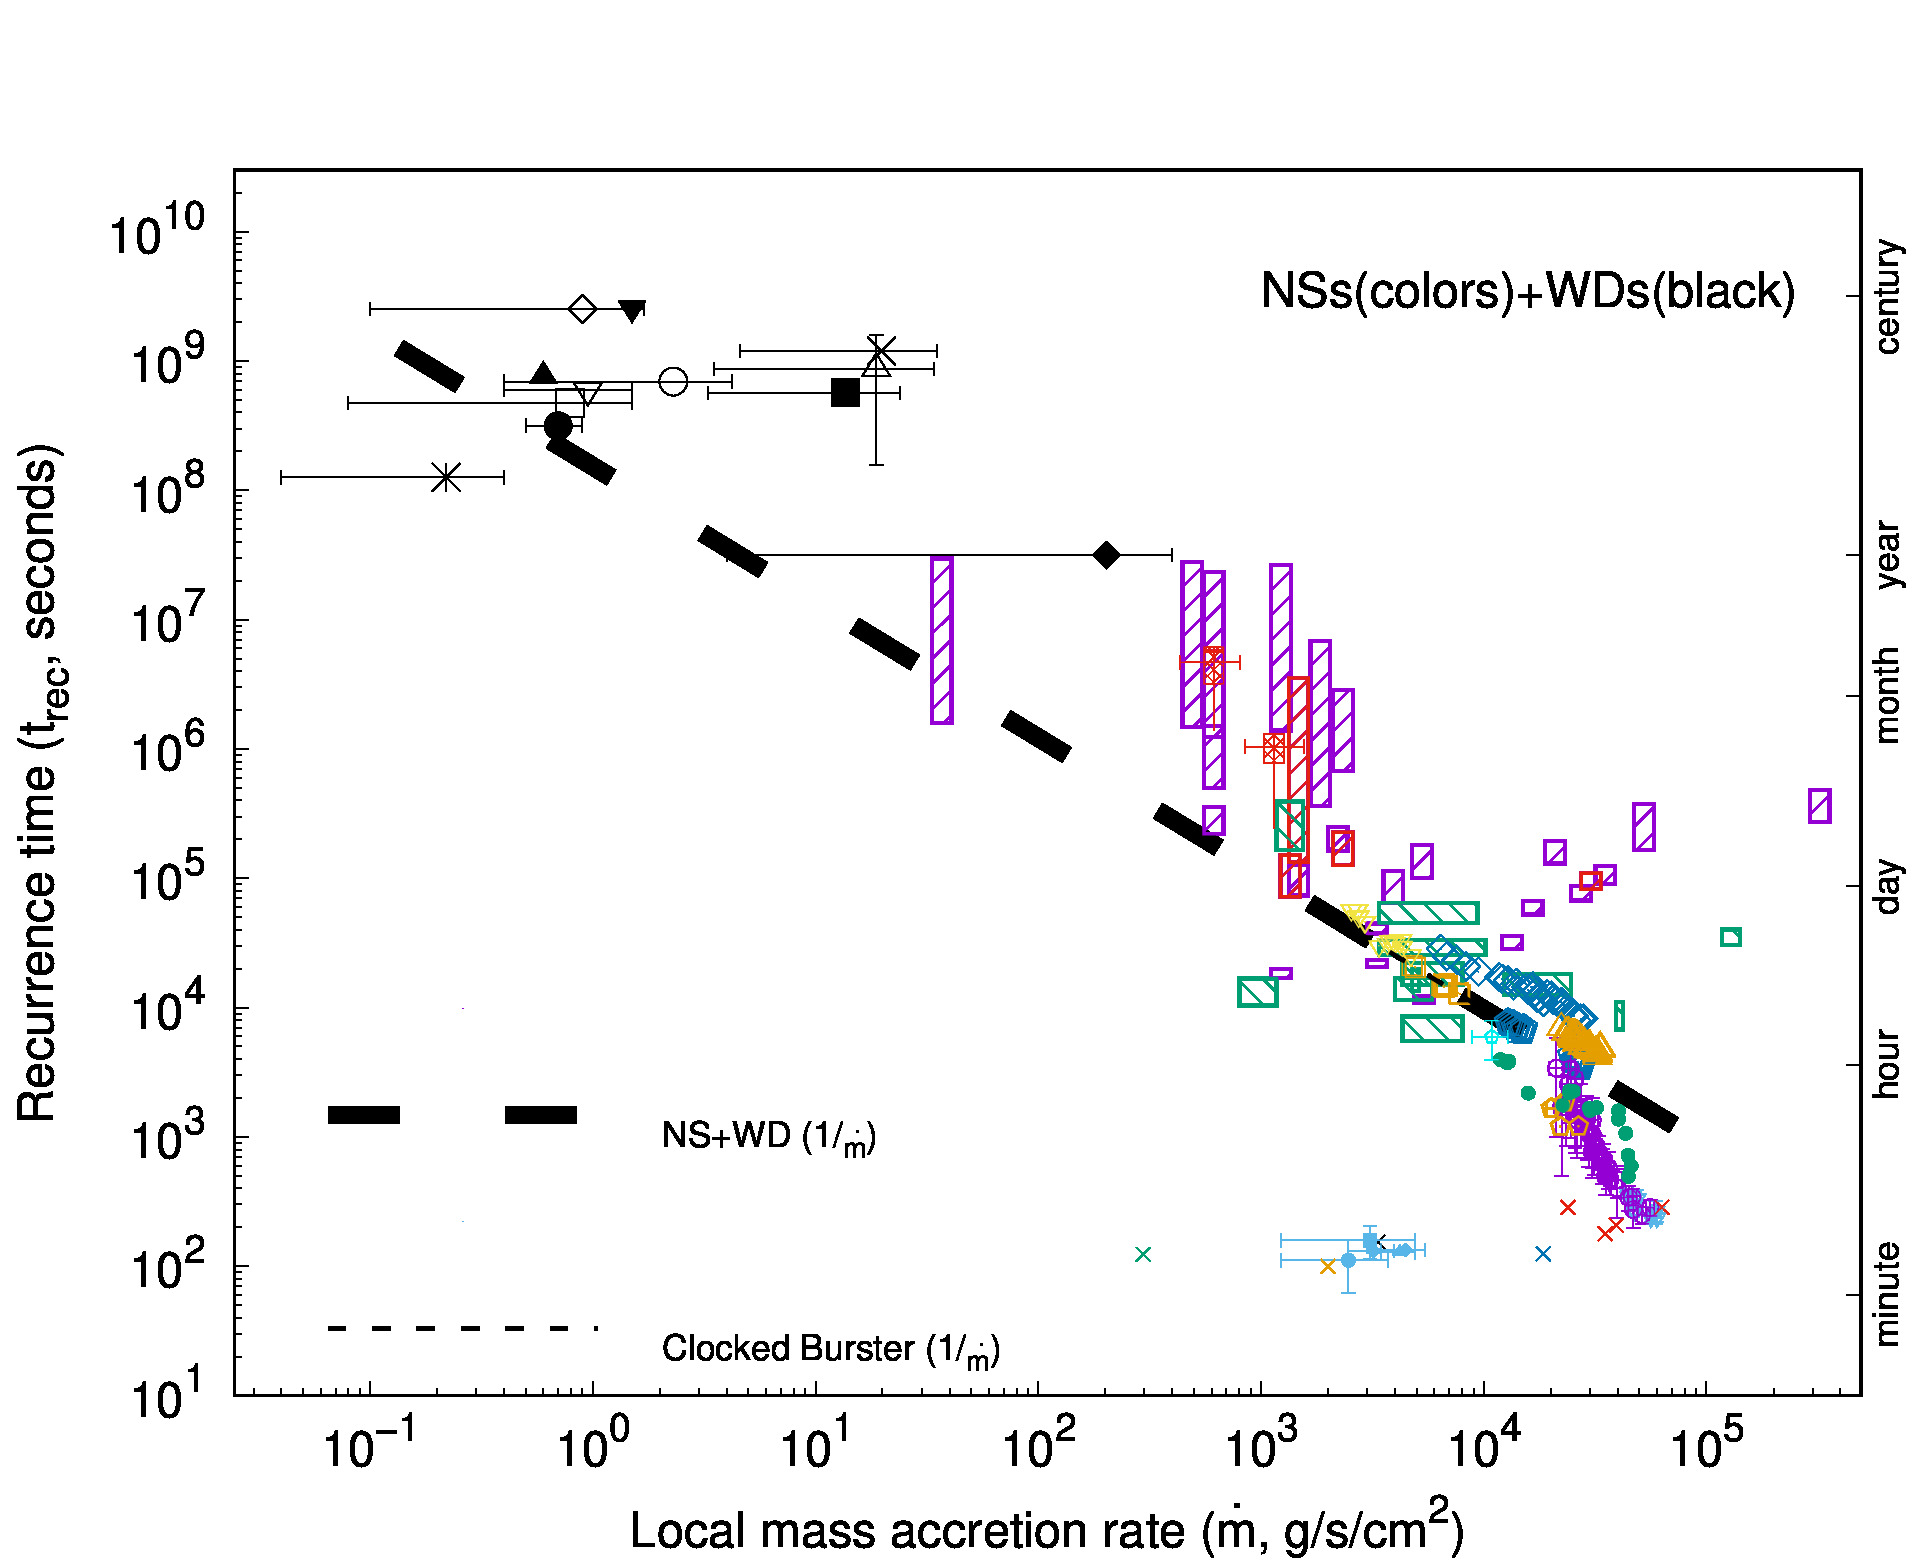
In Figure 4 we bring together RNe, XRBs and mHz QPOs, in order to compare the - relations found in NSs and WDs. Overall, NSs and WDs together exhibit TNRs over 5 orders of magnitude in and more than 6 orders of magnitude in . The burst/eruption energetics are very different, but both XRBs and RNe can be used as probes of thermonuclear burning in the NS and WD envelope, respectively.
We find a similar general range of mass accretion rates for our NS and WD samples: M⊙ yr-1 (Tables 1 and 3). These are likely set by binary evolution processes and the long-term mass transfer rate (and limited by the Eddington limit). However, when estimating local mass accretion rates (per unit area) we find that RNe cover ranges down to g cm-2 s-1. This is partly due to the much larger WD size: the accreted fuel must be spread over a larger area (by a factor ).
The ranges are also different: from 1 to 80 yr in WD/RNe and between about 5 min and more than a month for NS/XRBs. Interestingly, two systems with different accretors overlap in the - plane, within the large uncertainties: M31N 2008-12a and 1RXS J171824.2-402934 (Secs. 2.1 and 3, for details). We identify these as a WD and a NS that accrete (per unit area) roughly at the same rate, and that show TNRs with about the same frequency. We discuss their properties in more detail below in Section 5.2.
5.1 NS - WD: connecting thermonuclear runaways
Our combined NS and WD sample relation has a Pearson correlation coefficient (with ), indicating weak or no correlation between and . A power law fit of the joint sample has an index of , diverting from the clocked burster relation seen in Figure 4. We show for comparison, how a linear anti-correlation between and for both NSs and WDs would look, by extrapolating in Figure 4 the relation of the clocked burster (Galloway et al., 2004) to a wider range of and (thick black dashed line). As mentioned in Section 2.3, the high- XRBs from NSs show a complex phenomenology which goes beyond this simple anti-correlation. Moreover, the differences in fundamental system parameters (Spin Freq., , fuel composition, magnetic field strength, masses) can potentially account for the large scatter in this power law fit.
Nonetheless, this overall power law is able to connect the timescales of XRBs and RNe eruptions. This suggests that, despite having very different sizes and magnetic field strenghts, thermonuclear runaways on WDs and NSs share similar ignition conditions. It is worth noting that shell flashes in WDs and NSs are thought to be triggered by different nuclei: H ignition in the case of RNe and He ignition in the vast majority of XRBs. Their recurrence times are nevertheless connected, which suggests that these are mostly set by common nuclear processes (and not by surface gravity, which is drastically different on the surface of NSs and WDs).
5.2 Radiated energies and ignition depths for WDs and NSs
We now examine more closely the overlap between NS and WD and . As mentioned above, M31N 2008-12a and 1RXS J171824.2-402934 have both close to 1 yr and close to . Thus, it is interesting to assess if the energies radiated by the TNRs in this WD and NS are consistent with the difference in radius and area between them.
To do this, we need an estimate for the total radiated flux of M31N 2008-12a during an eruption, as well as for a burst in 1RXS J171824.2-402934. The models of Kato et al. (2016, 2017) point to a total photospheric luminosity for M31N, leading to a total radiated eruption energy of erg (for an eruption time scale of roughly 29 d). However, this is a crude estimate, and thus can only be considered as an upper limit. The high mass of the WD implies a low critical ignition mass, meaning that a smaller amount of material is ignited than in a typical RN (Henze et al., 2018). This should result in a lower total radiated flux than the value reported here. For 1RXS J171824.2-402934, the total radiated burst energy is estimated at erg, for a distance of kpc (in’t Zand et al., 2005).
With these estimates for , we can calculate the corresponding ignition column depth , where is the gravitational redshift, R the NS or WD radius and is the energy release, assuming a H fraction X at ignition (Galloway et al., 2008). For a , 10 km radius NS, . For a , 2000 km radius WD, the redshift is . In the case of M31N 2008-12a, we assume solar composition (), and for 1RXS J171824.2-402934, we calculate the ignition depth for both solar abundances and pure He (). Thus, for M31N 2008-12a we derive an ignition depth , whereas for 1RXS J171824.2-402934 we get for solar abundances, and for pure He.
With the assumed radii, estimated and inferred y, the ratio between WD and NS areas is , while the energy ratio is . The inferred ignition depths, on the other hand, are similar (, depending on the accreted composition). We conclude that, apart from having similar and , these two sources show a similar ignition depth, and the difference in eruption/burst energy is consistent with the difference in radius and area between NSs and WDs. In other words, the thickness of the fuel layer that ignites is similar but the WD eruption is 104 times more energetic since the WD radius is 102 times larger.
Acknowledgements
We are grateful to J. J. M.in’t Zand and D.Galloway, for reading the manuscript and providing valuable comments that have improved this paper. We would like to thank J.Basu for his valuable insights on the M31N 2008-12a eruption energy, and M.Darnley for his critical comments. This work has been partially supported by the Spanish MINECO grant PID2023-148661NB-100, the E.U. FEDER funds, and the AGAUR/Generalitat de Catalunya grant SGR-386/2021. ML acknowledges funding from the European Research Council (ERC) under the European Union’s Horizon 2020 research and innovation programme (grant agreement No. 101002352).
Data Availability
The data used in this work can be provided upon reasonable request to the authors.
References
- Alizai et al. (2023) Alizai K., et al., 2023, MNRAS, 521, 3608
- Altamirano et al. (2008) Altamirano D., Casella P., Patruno A., Wijnands R., van der Klis M., 2008, ApJ, 674, L45
- Armas Padilla et al. (2013) Armas Padilla M., Degenaar N., Wijnands R., 2013, MNRAS, 434, 1586
- Armstrong et al. (2013) Armstrong R. P., et al., 2013, MNRAS, 433, 1951
- Ashok & Banerjee (2003) Ashok N. M., Banerjee D. P. K., 2003, A&A, 409, 1007
- Bagnoli et al. (2013) Bagnoli T., in’t Zand J. J. M., Galloway D. K., Watts A. L., 2013, MNRAS, 431, 1947
- Bildsten (1998) Bildsten L., 1998, in Buccheri R., van Paradijs J., Alpar A., eds, NATO Advanced Study Institute (ASI) Series C Vol. 515, The Many Faces of Neutron Stars. p. 419 (arXiv:astro-ph/9709094), doi:10.48550/arXiv.astro-ph/9709094
- Blinnikov et al. (1996) Blinnikov S. I., Dunina-Barkovskaya N. V., Nadyozhin D. K., 1996, ApJS, 106, 171
- Bode et al. (2016) Bode M. F., et al., 2016, ApJ, 818, 145
- Brandi et al. (2009) Brandi E., Quiroga C., Mikołajewska J., Ferrer O. E., García L. G., 2009, A&A, 497, 815
- Bruch (1992) Bruch A., 1992, A&A, 266, 237
- Buisson et al. (2020) Buisson D. J. K., et al., 2020, MNRAS, 499, 793
- Bult et al. (2022) Bult P., et al., 2022, ApJ, 935, L32
- Cavecchi et al. (2017) Cavecchi Y., Watts A. L., Galloway D. K., 2017, ApJ, 851, 1
- Chakrabarty & Morgan (1998) Chakrabarty D., Morgan E. H., 1998, Nature, 394, 346
- Chandrasekhar (1933) Chandrasekhar S., 1933, MNRAS, 93, 390
- Chomiuk et al. (2021) Chomiuk L., Metzger B. D., Shen K. J., 2021, ARA&A, 59, 391
- Cominsky & Wood (1984) Cominsky L. R., Wood K. S., 1984, ApJ, 283, 765
- Cornelisse et al. (2000) Cornelisse R., Heise J., Kuulkers E., Verbunt F., in’t Zand J. J. M., 2000, A&A, 357, L21
- Cornelisse et al. (2003) Cornelisse R., et al., 2003, A&A, 405, 1033
- Cowley et al. (1979) Cowley A. P., Crampton D., Hutchings J. B., 1979, ApJ, 231, 539
- Cumming (2003) Cumming A., 2003, ApJ, 595, 1077
- Cumming & Bildsten (2000) Cumming A., Bildsten L., 2000, ApJ, 544, 453
- Cumming & Bildsten (2001) Cumming A., Bildsten L., 2001, ApJ, 559, L127
- Cumming et al. (2006) Cumming A., Macbeth J., in ’t Zand J. J. M., Page D., 2006, ApJ, 646, 429
- Darnley & Henze (2020) Darnley M. J., Henze M., 2020, Advances in Space Research, 66, 1147
- Darnley et al. (2016) Darnley M. J., et al., 2016, ApJ, 833, 149
- Darnley et al. (2017) Darnley M. J., et al., 2017, ApJ, 849, 96
- Darnley et al. (2019) Darnley M. J., et al., 2019, Nature, 565, 460
- Darnley et al. (2024) Darnley M. J., Kuin N. P. M., Page K. L., 2024, The Astronomer’s Telegram, 16752, 1
- Dinerstein & Hoffleit (1973) Dinerstein H., Hoffleit D., 1973, Information Bulletin on Variable Stars, 845, 1
- Engel et al. (2012) Engel M. C., Heinke C. O., Sivakoff G. R., Elshamouty K. G., Edmonds P. D., 2012, ApJ, 747, 119
- Falanga et al. (2011) Falanga M., et al., 2011, A&A, 529, A68
- Fiocchi et al. (2011) Fiocchi M., Bazzano A., Natalucci L., Landi R., Ubertini P., 2011, MNRAS, 414, L41
- Fiocchi et al. (2019) Fiocchi M., Bazzano A., Bruni G., Ludlam R., Natalucci L., Onori F., Ubertini P., 2019, ApJ, 887, 30
- Fujimoto et al. (1981) Fujimoto M. Y., Hanawa T., Miyaji S., 1981, ApJ, 247, 267
- Galloway & Cumming (2006) Galloway D. K., Cumming A., 2006, ApJ, 652, 559
- Galloway et al. (2004) Galloway D. K., Cumming A., Kuulkers E., Bildsten L., Chakrabarty D., Rothschild R. E., 2004, ApJ, 601, 466
- Galloway et al. (2008) Galloway D. K., Muno M. P., Hartman J. M., Psaltis D., Chakrabarty D., 2008, ApJS, 179, 360
- Galloway et al. (2018) Galloway D. K., et al., 2018, ApJ, 857, L24
- Galloway et al. (2020) Galloway D. K., et al., 2020, ApJS, 249, 32
- Gladstone et al. (2007) Gladstone J., Done C., Gierliński M., 2007, MNRAS, 378, 13
- Godon et al. (2017) Godon P., Sion E. M., Balman Ş., Blair W. P., 2017, ApJ, 846, 52
- Goodwin et al. (2019) Goodwin A. J., Galloway D. K., Heger A., Cumming A., Johnston Z., 2019, MNRAS, 490, 2228
- Greiner et al. (2023) Greiner J., et al., 2023, Nature, 615, 605
- Guerriero et al. (1999) Guerriero R., et al., 1999, MNRAS, 307, 179
- Güver et al. (2021) Güver T., et al., 2021, ApJ, 910, 37
- Hachisu et al. (1996) Hachisu I., Kato M., Nomoto K., 1996, ApJ, 470, L97
- Haensel & Zdunik (1990) Haensel P., Zdunik J. L., 1990, A&A, 227, 431
- Haensel & Zdunik (2003) Haensel P., Zdunik J. L., 2003, A&A, 404, L33
- Heger et al. (2007) Heger A., Cumming A., Woosley S. E., 2007, ApJ, 665, 1311
- Heinke et al. (2024) Heinke C. O., Zheng J., Maccarone T. J., Degenaar N., Bahramian A., Sivakoff G. R., 2024, arXiv e-prints, p. arXiv:2407.18867
- Henze et al. (2018) Henze M., et al., 2018, ApJ, 857, 68
- Iglesias & Rogers (1996) Iglesias C. A., Rogers F. J., 1996, ApJ, 464, 943
- Jenke et al. (2016) Jenke P. A., Linares M., Connaughton V., Beklen E., Camero-Arranz A., Finger M. H., Wilson-Hodge C. A., 2016, ApJ, 826, 228
- José (2016) José J., 2016, Stellar explosions: hydrodynamics and nucleosynthesis. CRC Press
- José & Hernanz (1998) José J., Hernanz M., 1998, ApJ, 494, 680
- José & Hernanz (2025) José J., Hernanz M., 2025, A&A, in press
- José & Shore (2008) José J., Shore S. N., 2008, in Bode M. F., Evans A., eds, , Vol. 43, Classical Novae. Cambridge University Press, pp 121–149, doi:10.1017/CBO9780511536168.008
- Juett et al. (2001) Juett A. M., Psaltis D., Chakrabarty D., 2001, ApJ, 560, L59
- Kahabka & van den Heuvel (1997) Kahabka P., van den Heuvel E. P. J., 1997, ARA&A, 35, 69
- Kaluzienski et al. (1976) Kaluzienski L. J., Holt S. S., Boldt E. A., Serlemitsos P. J., 1976, ApJ, 208, L71
- Kaptein et al. (2000) Kaptein R. G., in’t Zand J. J. M., Kuulkers E., Verbunt F., Heise J., Cornelisse R., 2000, A&A, 358, L71
- Kato et al. (2016) Kato M., et al., 2016, ApJ, 830, 40
- Kato et al. (2017) Kato M., Saio H., Hachisu I., 2017, ApJ, 838, 153
- Keek et al. (2010) Keek L., Galloway D. K., Zand J. J. M. i. t., Heger A., 2010, Astrophys. J., 718, 292
- Kuin et al. (2020) Kuin N. P. M., et al., 2020, MNRAS, 491, 655
- Kuulkers (2004) Kuulkers E., 2004, Nuclear Physics B Proceedings Supplements, 132, 466
- Kuulkers et al. (2003) Kuulkers E., den Hartog P. R., in’t Zand J. J. M., Verbunt F. W. M., Harris W. E., Cocchi M., 2003, A&A, 399, 663
- Kuulkers et al. (2010) Kuulkers E., et al., 2010, A&A, 514, A65+
- Lederle & Kimeswenger (2003) Lederle C., Kimeswenger S., 2003, A&A, 397, 951
- Lewin et al. (1993) Lewin W. H. G., van Paradijs J., Taam R. E., 1993, Space Sci. Rev., 62, 223
- Li et al. (2018) Li Z., et al., 2018, A&A, 620, A114
- Liller (2002) Liller W., 2002, IAU Circ., 7789, 1
- Liller & Monard (2009) Liller W., Monard L. A. G., 2009, IAU Circ., 9042, 1
- Linares (2009) Linares M., 2009, PhD thesis, University of Amsterdam, Anton Pannekoek Institute for Astronomy
- Linares et al. (2010) Linares M., et al., 2010, ApJ, 719, L84
- Linares et al. (2012a) Linares M., Altamirano D., Chakrabarty D., Cumming A., Keek L., 2012a, ApJ, 748, 82
- Linares et al. (2012b) Linares M., et al., 2012b, ApJ, 760, 133
- Lodders et al. (2009) Lodders K., Palme H., Gail H. P., 2009, Landolt Börnstein, 4B, 712
- Lynch et al. (2000) Lynch D. K., Rudy R. J., Mazuk S., Puetter R. C., 2000, ApJ, 541, 791
- Mancuso et al. (2019) Mancuso G. C., Altamirano D., García F., Lyu M., Méndez M., Combi J. A., Díaz-Trigo M., in’t Zand J. J. M., 2019, MNRAS, 486, L74
- Mancuso et al. (2023) Mancuso G. C., et al., 2023, MNRAS, 521, 5616
- Mandal et al. (2023) Mandal M., Pal S., Chauhan J., Lohfink A., Bharali P., 2023, MNRAS, 521, 881
- Margon et al. (1971) Margon B., Lampton M., Bowyer S., Cruddace R., 1971, ApJ, 169, L23+
- Masetti (2002) Masetti N., 2002, A&A, 381, L45
- Maxwell et al. (2014) Maxwell M. P., Rushton M. T., Eyres S. P. S., 2014, in Woudt P. A., Ribeiro V. A. R. M., eds, Astronomical Society of the Pacific Conference Series Vol. 490, Stellar Novae: Past and Future Decades. p. 205 (arXiv:1305.3424), doi:10.48550/arXiv.1305.3424
- Meshcheryakov et al. (2010) Meshcheryakov A. V., Revnivtsev M. G., Pavlinsky M. N., Khamitov I., Bikmaev I. F., 2010, Astronomy Letters, 36, 738
- Mikołajewska & Shara (2017) Mikołajewska J., Shara M. M., 2017, ApJ, 847, 99
- Mikołajewska et al. (2021) Mikołajewska J., Iłkiewicz K., Gałan C., Monard B., Otulakowska-Hypka M., Shara M. M., Udalski A., 2021, MNRAS, 504, 2122
- Molkov et al. (2005) Molkov S., Revnivtsev M., Lutovinov A., Sunyaev R., 2005, A&A, 434, 1069
- Molkov et al. (2024) Molkov S. V., et al., 2024, arXiv e-prints, p. arXiv:2404.19709
- Mukai et al. (2003) Mukai K., Kinkhabwala A., Peterson J. R., Kahn S. M., Paerels F., 2003, ApJ, 586, L77
- Munari (2012) Munari U., 2012, JAAVSO, 40, 582
- Narayan & Heyl (2003) Narayan R., Heyl J. S., 2003, ApJ, 599, 419
- Nelemans et al. (2004) Nelemans G., Jonker P. G., Marsh T. R., van der Klis M., 2004, MNRAS, 348, L7
- Nelson et al. (2011) Nelson T., Mukai K., Orio M., Luna G. J. M., Sokoloski J. L., 2011, ApJ, 737, 7
- Ng et al. (2024) Ng M., et al., 2024, ApJ, 968, L7
- Nishiyama & Kabashima (2008) Nishiyama K., Kabashima F., 2008, CBAT
- Nomoto (1982) Nomoto K., 1982, ApJ, 253, 798
- Paczynski & Anderson (1986) Paczynski B., Anderson N., 1986, ApJ, 302, 1
- Padilla A. et al. (2022) Padilla A. M., et al., 2022, ApJ, 931, L9
- Pagnotta & Schaefer (2014) Pagnotta A., Schaefer B. E., 2014, ApJ, 788, 164
- Papitto et al. (2011) Papitto A., D’Aì A., Motta S., Riggio A., Burderi L., di Salvo T., Belloni T., Iaria R., 2011, A&A, 526, L3
- Papitto et al. (2024) Papitto A., et al., 2024, arXiv e-prints, p. arXiv:2408.00608
- Patterson & Raymond (1985) Patterson J., Raymond J. C., 1985, ApJ, 292, 550
- Patterson et al. (2017) Patterson J., et al., 2017, MNRAS, 466, 581
- Patterson et al. (2022) Patterson J., et al., 2022, ApJ, 924, 27
- Peng & Ott (2010) Peng F., Ott C. D., 2010, ApJ, 725, 309
- Peng et al. (2007) Peng F., Brown E. F., Truran J. W., 2007, ApJ, 654, 1022
- Pickering (1913) Pickering E. C., 1913, Annals of Harvard College Observatory, 72, 79
- Piro & Bildsten (2007) Piro A. L., Bildsten L., 2007, ApJ, 663, 1252
- Prialnik et al. (1979) Prialnik D., Shara M. M., Shaviv G., 1979, A&A, 72, 192
- Prodan & Murray (2015) Prodan S., Murray N., 2015, ApJ, 798, 117
- Ray et al. (2024) Ray P. S., et al., 2024, The Astronomer’s Telegram, 16480, 1
- Revnivtsev et al. (2001) Revnivtsev M., Churazov E., Gilfanov M., Sunyaev R., 2001, A&A, 372, 138
- Revnivtsev et al. (2013) Revnivtsev M. G., Kniazev A., Karasev D. I., Berdnikov L., Barway S., 2013, Astronomy Letters, 39, 523
- Riggio et al. (2011) Riggio A., Papitto A., Burderi L., di Salvo T., Bachetti M., Iaria R., D’Aì A., Menna M. T., 2011, A&A, 526, A95
- Rodríguez-Gil et al. (2023) Rodríguez-Gil P., Corral-Santana J. M., Elías-Rosa N., Gänsicke B. T., Hernanz M., Sala G., 2023, MNRAS, 526, 4961
- Rosenbush (2008) Rosenbush A. E., 2008, in Werner A., Rauch T., eds, Astronomical Society of the Pacific Conference Series Vol. 391, Hydrogen-Deficient Stars. p. 271
- Rosenbush (2020) Rosenbush A., 2020, arXiv e-prints, p. arXiv:2007.10480
- Sallaska et al. (2013) Sallaska A. L., Iliadis C., Champange A. E., Goriely S., Starrfield S., Timmes F. X., 2013, ApJS, 207, 18
- Sansom et al. (1993) Sansom A. E., Dotani T., Asai K., Lehto H. J., 1993, MNRAS, 262, 429
- Schaefer (2009) Schaefer B. E., 2009, The Astrophysical Journal, 697, 721–729
- Schaefer (2010) Schaefer B. E., 2010, ApJ SS, 187, 275
- Schaefer (2023) Schaefer B. E., 2023, Journal for the History of Astronomy, 54, 436
- Schaefer & Ringwald (1995) Schaefer B. E., Ringwald F. A., 1995, ApJ, 447, L45
- Schaefer et al. (2022a) Schaefer B. E., Pagnotta A., Zoppelt S., 2022a, MNRAS, 512, 1924
- Schaefer et al. (2022b) Schaefer B. E., Walter F. M., Hounsell R., Hillman Y., 2022b, MNRAS, 517, 3864
- Selvelli et al. (2008) Selvelli P., Cassatella A., Gilmozzi R., González-Riestra R., 2008, A&A, 492, 787
- Shafter et al. (2015) Shafter A. W., et al., 2015, ApJS, 216, 34
- Shafter et al. (2022) Shafter A. W., Taguchi K., Zhao J., Hornoch K., 2022, Research Notes of the American Astronomical Society, 6, 241
- Shafter et al. (2023) Shafter A. W., et al., 2023, The Astronomer’s Telegram, 16354, 1
- Shafter et al. (2024) Shafter A. W., et al., 2024, Research Notes of the American Astronomical Society, 8, 5
- Shahbaz et al. (2008) Shahbaz T., Watson C. A., Zurita C., Villaver E., Hernandez-Peralta H., 2008, PASP, 120, 848
- Shakura & Sunyaev (1973) Shakura N. I., Sunyaev R. A., 1973, A&A, 24, 337
- Shara et al. (2018) Shara M. M., Prialnik D., Hillman Y., Kovetz A., 2018, ApJ, 860, 110
- Shen & Bildsten (2008) Shen K. J., Bildsten L., 2008, ApJ, 678, 1530
- Shen & Bildsten (2009) Shen K. J., Bildsten L., 2009, ApJ, 699, 1365
- Shore et al. (1991) Shore S. N., Sonneborn G., Starrfield S. G., Hamuy M., Williams R. E., Cassatella A., Drechsel H., 1991, ApJ, 370, 193
- Sion et al. (2019) Sion E. M., Wilson R. E., Godon P., Starrfield S., Williams R. E., Darnley M. J., 2019, ApJ, 872, 68
- Stanishev et al. (2004) Stanishev V., Zamanov R., Tomov N., Marziani P., 2004, A&A, 415, 609
- Starrfield et al. (1972) Starrfield S., Truran J. W., Sparks W. M., Kutter G., 1972, Astrophysical Journal, vol. 176, p. 169, 176, 169
- Starrfield et al. (2008) Starrfield S., Iliadis C., Hix W. R., 2008, in Bode M. F., Evans A., eds, , Vol. 43, Classical Novae. Cambridge University Press, pp 77–101, doi:10.1017/CBO9780511536168.006
- Stella et al. (1987) Stella L., Priedhorsky W., White N. E., 1987, ApJ, 312, L17
- Strohmayer & Bildsten (2006) Strohmayer T., Bildsten L., 2006, New views of thermonuclear bursts. pp 113–156
- Strohmayer & Brown (2002) Strohmayer T. E., Brown E. F., 2002, ApJ, 566, 1045
- Strohmayer & Smith (2011) Strohmayer T. E., Smith E. A., 2011, The Astronomer’s Telegram, 3258, 1
- Strohmayer et al. (2003) Strohmayer T. E., Markwardt C. B., Swank J. H., in’t Zand J., 2003, ApJ, 596, L67
- Strohmayer et al. (2018) Strohmayer T. E., et al., 2018, ApJ, 865, 63
- Strope et al. (2010) Strope R. J., Schaefer B. E., Henden A. A., 2010, AJ, 140, 34
- Takeda et al. (2024) Takeda T., et al., 2024, arXiv e-prints, p. arXiv:2411.10992
- Thoroughgood et al. (2001) Thoroughgood T. D., Dhillon V. S., Littlefair S. P., Marsh T. R., Smith D. A., 2001, MNRAS, 327, 1323
- Thorstensen et al. (1978) Thorstensen J., Charles P., Bowyer S., 1978, ApJ, 220, L131
- Tse et al. (2021) Tse K., Galloway D. K., Chou Y., Heger A., Hsieh H.-E., 2021, MNRAS, 500, 34
- Tse et al. (2023) Tse K., Galloway D. K., Heger A., 2023, arXiv preprint arXiv:2309.05236
- Vincentelli et al. (2020) Vincentelli F. M., Cavecchi Y., Casella P., Migliari S., Altamirano D., Belloni T., Diaz-Trigo M., 2020, MNRAS, 495, L37
- Voges et al. (1999) Voges W., et al., 1999, A&A, 349, 389
- Wade & Hubeny (1998) Wade R. A., Hubeny I., 1998, ApJ, 509, 350
- Wang et al. (2024) Wang P. J., et al., 2024, A&A, 689, A47
- Wijnands et al. (2015) Wijnands R., Degenaar N., Armas Padilla M., Altamirano D., Cavecchi Y., Linares M., Bahramian A., Heinke C. O., 2015, MNRAS, 454, 1371
- Wolf et al. (2014) Wolf W. M., Bildsten L., Brooks J., Paxton B., 2014, ApJ, 782, 117
- Woods (1920) Woods I. E., 1920, Harvard College Observatory Bulletin, 733, 1
- Woudt et al. (2009) Woudt P. A., et al., 2009, ApJ, 706, 738
- Yaron et al. (2005) Yaron O., Prialnik D., Shara M. M., Kovetz A., 2005, ApJ, 623, 398
- Zamanov et al. (2023) Zamanov R., et al., 2023, A&A, 680, L18
- Zhong & Wang (2011) Zhong J., Wang Z., 2011, ApJ, 729, 8
- Zolotukhin & Revnivtsev (2011) Zolotukhin I. Y., Revnivtsev M. G., 2011, MNRAS, 411, 620
- in’t Zand (2017) in’t Zand J., 2017, in Serino M., Shidatsu M., Iwakiri W., Mihara T., eds, 7 years of MAXI: monitoring X-ray Transients. p. 121 (arXiv:1702.04899), doi:10.48550/arXiv.1702.04899
- in’t Zand (2024) in’t Zand J. J. M., 2024, List of Galactic Type-I X-ray bursters, https://sronpersonalpages.nl/˜jeanz/bursterlist.html
- in’t Zand et al. (2004) in’t Zand J., et al., 2004, Nuclear Physics B Proceedings Supplements, 132, 486
- in’t Zand et al. (2005) in’t Zand J. J. M., Cornelisse R., Méndez M., 2005, A&A, 440, 287
- in’t Zand et al. (2007) in’t Zand J. J. M., Jonker P. G., Markwardt C. B., 2007, A&A, 465, 953
- in’t Zand et al. (2009a) in’t Zand J. J. M., Jonker P. G., Bassa C. G., Markwardt C. B., Levine A. M., 2009a, A&A, 506, 857
- in’t Zand et al. (2009b) in’t Zand J. J. M., Jonker P. G., Bassa C. G., Markwardt C. B., Levine A. M., 2009b, A&A, 506, 857
- van Paradijs (1979) van Paradijs J., 1979, ApJ, 234, 609