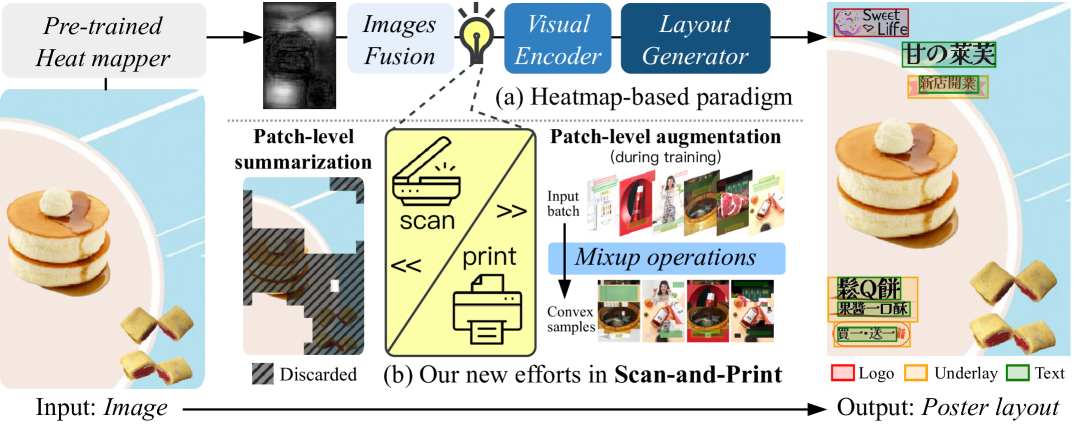
Scan-and-Print: Patch-level Data Summarization and Augmentation
for Content-aware Layout Generation in Poster Design
Abstract
In AI-empowered poster design, content-aware layout generation is crucial for the on-image arrangement of visual-textual elements, e.g., logo, text, and underlay. To perceive the background images, existing work demanded a high parameter count that far exceeds the size of available training data, which has impeded the model’s real-time performance and generalization ability. To address these challenges, we proposed a patch-level data summarization and augmentation approach, vividly named Scan-and-Print. Specifically, the scan procedure selects only the patches suitable for placing element vertices to perform fine-grained perception efficiently. Then, the print procedure mixes up the patches and vertices across two image-layout pairs to synthesize over 100% new samples in each epoch while preserving their plausibility. Besides, to facilitate the vertex-level operations, a vertex-based layout representation is introduced. Extensive experimental results on widely used benchmarks demonstrated that Scan-and-Print can generate visually appealing layouts with state-of-the-art quality while dramatically reducing computational bottleneck by 95.2%. The project page is at https://thekinsley.github.io/Scan-and-Print/.
1 Introduction
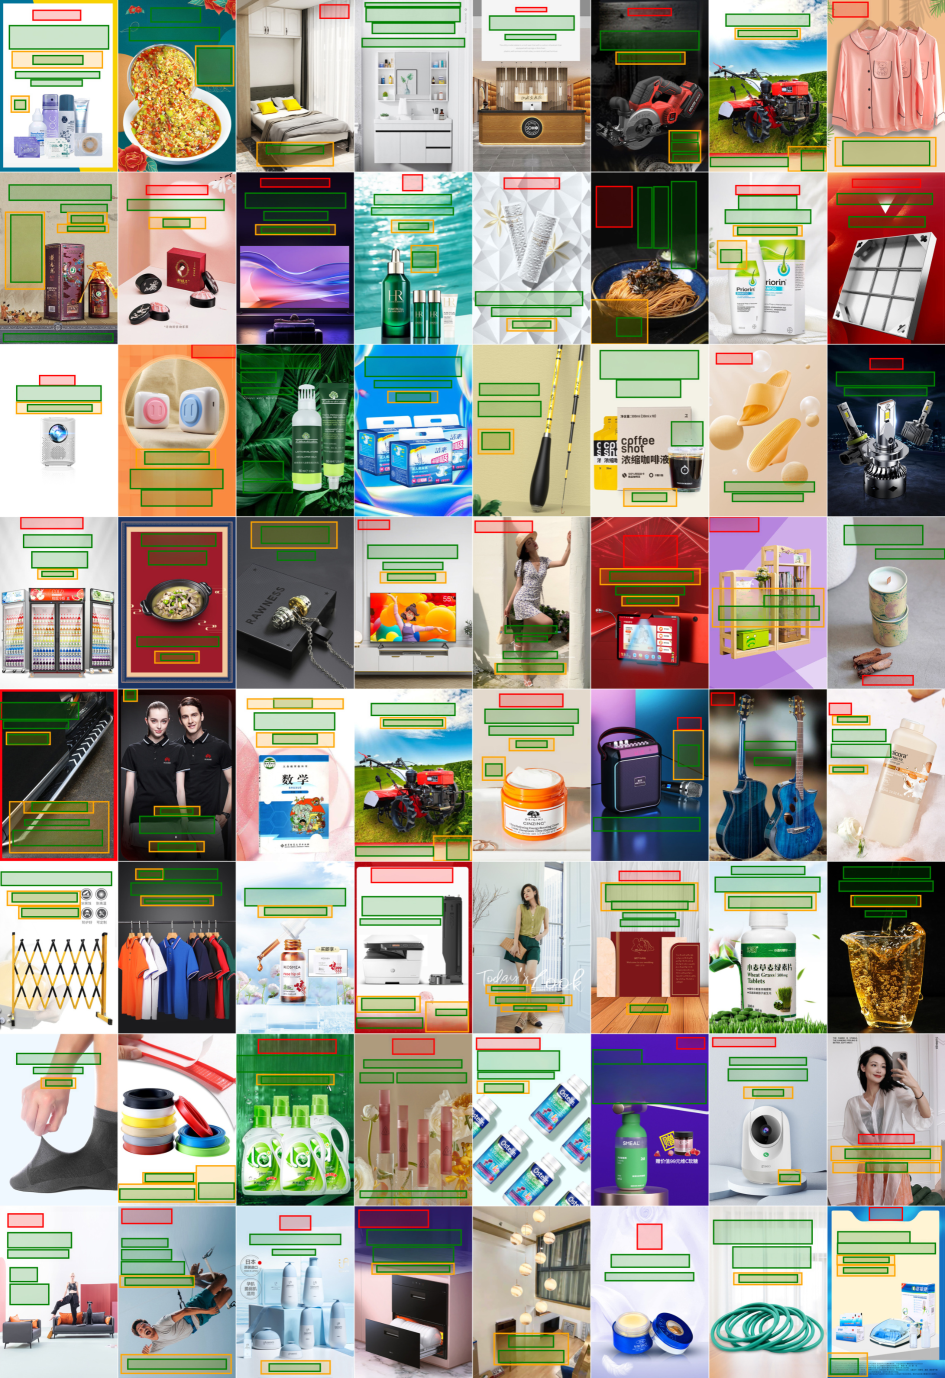
Integrating artificial intelligence (AI) with art and creativity has emerged as a pivotal trend in the design domain. According to a survey of a mainstream design platform with over 185 million monthly users, 90% of respondents agreed that AI has improved their work Canva (2024). Among these advancements, content-aware layout generation plays a crucial role in automating poster design Lin et al. (2023b); Yang et al. (2023); Weng et al. (2024); Wang et al. (2024) by indicating the arrangement of visual-textual elements, e.g., logo, text, and underlay, on the background image, as shown in Fig. 1.
Despite the increasing attention to this valuable task Zhou et al. (2022); Hsu et al. (2023b); Xu et al. (2023); Horita et al. (2024), existing methods faced a high computational bottleneck in perceiving images. Taking the current state-of-the-art (SOTA) method, RALF Horita et al. (2024), as an example, even when neglecting the time required for image-retrieval augmentation Fu et al. (2024), it took an average of 385 ms per single inference on an NVIDIA A40 GPU. The saliency detection in preprocessing accounted for 55 ms, while more critically, the image encoders during generation occupied over 69.5% of the model parameters. This not only poses significant challenges for real-time performance, but the scarcity of training data relative to the model’s capacity also impairs the model’s generalization ability.
To relieve the inefficiency and overfitting issues in the field, we proposed Scan-and-Print, an auto-regressive model accompanied by patch-level data summarization and augmentation. Specifically, (a) the scan procedure selects only the few patches from an input image that are predicted to have a high probability of placing element vertices, thereby concentrating computational resources on the most applicable areas. Then, (b) the print procedure synthesizes augmented samples by mixing the patches and vertices from two image-layout pairs, effectively increasing both the size and diversity of datasets. We also introduced a new (c) vertex-based layout representation to facilitate vertex-level mixup operations.
We conducted extensive experiments on the public benchmarks Zhou et al. (2022); Hsu et al. (2023b) and demonstrated that Scan-and-Print has achieved new SOTA performance. Compared to RALF Horita et al. (2024), it has drastically reduced 95.2% of the FLOPs in image encoders. The synthesized data have consistently shown positive impacts even when the augmentation rate reached more than 100%, highlighting their plausibility and usability. Besides, we demonstrated the adaptability of Scan-and-Print to user-specified constraints, particularly beneficial for the real-world poster design workflow.
The contribution of this work are summarized as follows:
-
•
A data summarization approach (Scan) selects only the few patches suitable for arranging vertices of layout elements to efficiently perceive input image content.
-
•
A data augmentation approach (Print) mixes the patches and vertices from two image-layout pairs to synthesize extensive new plausible samples at a low cost.
-
•
A vertex-based layout representation (VLR) models fine-grained geometric properties to facilitate delicate vertex-level mixup operations across layouts.
-
•
Comprehensive evaluations verify the practical application value of Scan-and-Print, being the first in the field to focus on reducing computational complexity.
2 Related Work
2.1 Content-aware Layout Generation
Different from general layout tasks Li et al. (2020a); Weng et al. (2023), content-aware layout generation additionally takes into account the given background image, thus possessing high application value in the field of AI-empowered design Wang et al. (2024); Weng et al. (2024). Pioneered in CGL-GAN Zhou et al. (2022) and PKU PosterLayout Hsu et al. (2023b) to establish the heatmap-based paradigm, i.e., utilizing object saliency Li et al. (2021); Qin et al. (2022) or spatial density Hsu et al. (2023a) maps to enhance the awareness of image composition. Although CGL and PKU contributed valuable datasets, the total size of training data remains scarce around 70.5k samples, urging for heuristic techniques or data augmentation approaches to improve model performance.
Inspired by the prior design experiences Guo et al. (2021); Li et al. (2020b), DS-GAN Hsu et al. (2023b) organized layout elements in a motivation-aligned order to mine patterns in the data more effectively during GANs’ training. Chai et al. (2023b) employed a general diffusion model Chai et al. (2023a) for content-aware tasks by incorporating predefined aesthetic constraints and a saliency-aware layout plausibility ranker. In another way, RALF Horita et al. (2024) incorporated retrieval augmentation by searching for the nearest neighbors of the input image Fu et al. (2024) and using their layout features as additional input for autoregressive models. LayoutPrompter Lin et al. (2023a) coarsely extracted the minimum bounding rectangle from the saliency maps and retrieved layout examples to enable the in-context learning of LLMs. PosterLlama Seol et al. (2024) synthesized new image-layout samples by a depth-guided image generation with refined text descriptions Zhang et al. (2023); Li et al. (2023), while maintaining the corresponding layouts unchanged, to fine-tune DINOv2 Oquab et al. (2023); Zhu et al. (2023) and CodeLlama-7B Roziere et al. (2023); Hu et al. (2021) successively.
However, along with these efforts, the size of model parameters, especially image encoders, often exceeds that of the available training data. This leads to significant challenges in real-time performance and generalization ability. In light of this, we devote this work to a compact model with selective scan and efficient data augmentation– print.
2.2 Patch-level Data Augmentation
Data augmentation is a crucial regularization method to enhance model generalization by artificially increasing the size and diversity of training data. In image understanding, traditional operations such as random cropping and flipping have been widely used. An advanced field is mixing-based data augmentation, which synthesizes new data by combining multiple samples. E.g., Mixup Zhang et al. (2018) randomly drew two image-label pairs and linearly interpolated them to obtain the convex combination .
Upon the success of Mixup, patch-level mixing approaches have been developed to create more realistic samples that preserve the spatial structure of the images. CutMix Yun et al. (2019) cropped a rectangular region of and filled the corresponding part of , showing particular advantages in localization tasks. As random selection sometimes results in mixed patches lacking supervisory information, saliency detection has been introduced into the process. Puzzle Mix Kim et al. (2020) formulated an optimization problem, maximizing the exposed saliency, to jointly determine the size of the mixing mask and its spatial offset between the samples. SaliencyMix Uddin et al. (2021) straightforwardly selected the peak salient area within and pasted it on . In contrast, Co-Mixup Kim et al. (2021) sophisticatedly paired the samples from the mini-batch to obtain the largest possible accumulated saliency regions. GuidedMix Kang and Kim (2023) further sped up this complicated process by splitting apart the pairing and mask determination.
These efforts have consistently enhanced model robustness and generalization ability in deep learning-based computer vision methods Bochkovskiy et al. (2020); Bang et al. (2022). However, the labels in previous tasks are often simplistic, e.g., one-hot vectors, which fail to serve the complex, hierarchical structure of layout elements. In light of this, we discussed the vertex-level label mixup to mitigate this gap.

3 The Proposed Approach: Scan-and-Print
Considering the computational overhead and generalization issues of current content-aware layout generation approaches, we propose Scan-and-Print. It is an autoregressive model that achieves efficiency in parameter count, image perception, and data augmentation. An overview is shown in Fig. 2. Briefly, we propose (a) vertex-based layout representation (VLR) to capture the fine-grained structure of elements and facilitate the two procedures, namely, (b) scan that identifies and perceives a small size of image patches applicable for element placement, and (c) print that synthesizes new training samples by mixing patches and vertices across two image-layout pairs and within the given mini-batch.
3.1 Vertex-based Layout Representation
Input: Layout
Parameter: Category ID of underlay
Output: Start-end vertex tensor
Conventionally, a layout is represented as a set of bounding boxes, each described by its center coordinates and size, i.e., . With its simplicity comes the difficulty of modeling fine-grained spatial relationships and manipulating geometric properties precisely, leading to poor graphic quality, such as misalignment Zhou et al. (2022). To this end, we propose a more direct representation based on the vertices of boxes. As depicted in Algorithm 1, VLR first derives the top-left and bottom-right coordinates of elements, and then performs group-element-id to construct ID trees, which explicitly reflects the hierarchical structure in . Subsequently, the categories and coordinates are transformed into the attributes of start-end vertices. Inspired by Hsu et al. (2023b), arrange-severtex-id is performed to sort and obtain the vertex tensor but only considers the reading order and grouping relationship. For a smooth reading experience, the definitions of the two functions are postponed to Appendix A.
3.2 Scan Procedure: Data Summarization
Image encoder with patch selection.
In the target context, image understanding essentially boils down to a binary determination of whether specific areas are suitable for placing layout elements. Relative to its limited complexity, existing methods are prone to employing disproportionately heavy image encoders, occupying up to 82.4% of the model’s trainable parameters Hsu et al. (2023b). This insight naturally leads us to a compact encoder focusing on a small proportion within the input image . Preliminarily, a parameter-efficient density mapping network is pre-trained semi-supervised as in Hsu et al. (2023a) to identify top- patches with the highest scores for placing element vertices, where the number of patches . This selection is performed after the positional embedding, so the subsequent encoder retains the original spatial information of as well, which is crucial for understanding global relationships.
Image-to-layout alignment and autoregressive decoder.
Following Horita et al. (2024), a layout tokenizer is utilized to quantize and into 128 bins. To bridge the modality gap Chen et al. (2024) between visual and geometric features, a two-layer FFN is inserted after the last layer of the encoder. Finally, an autoregressive decoder, trained through the next token prediction objective, sequentially predicts tokens– detokenized as elements afterward.
3.3 Print Procedure: Data Augmentation
Based on the concept of Mixup Zhang et al. (2018), image-layout pairs and are picked from the given mini-batch to construct a convex combination , considering their patch indices and . In total, new samples are created per mini-batch during training, effectively improving the model’s generalization ability.
| Method | #Params | |||||||
| LLM-based | ||||||||
| LayoutPrompter | 8B | 0.0010 | 0.0026 | 0.4054 | 0.1621 | 0.2025 | 0.2539 | 0.0412 |
| PosterLLaMa‡ | 7B | 0.0006 | 0.0006 | 0.9986 | 0.9917 | 0.1764 | 0.1630 | 0.0285 |
| Non-LLM-based | ||||||||
| CGL-GAN | 41M | 0.1010 | 0.0048 | 0.7326 | 0.2743 | 0.1693 | 0.2105 | 0.0327 |
| DS-GAN | 30M | 0.0248 | 0.0046 | 0.7859 | 0.4676 | 0.1832 | 0.1894 | 0.0320 |
| ICVT | 50M | 0.2786 | 0.0480 | 0.4939 | 0.3549 | 0.1050 | 0.2686 | 0.0347 |
| LayoutDM† | 43M | 0.1638 | 0.0029 | 0.5987 | 0.3695 | 0.1475 | 0.1504 | 0.0264 |
| AutoReg | 41M | 0.0218 | 0.0052 | 0.7053 | 0.3537 | 0.1449 | 0.1535 | 0.0274 |
| RALF | 43M | 0.0175 | 0.0069 | 0.9548 | 0.8653 | 0.1452 | 0.1328 | 0.0231 |
| Scan-and-Print (Ours) | 26M | 0.0090 | 0.0024 | 0.9831 | 0.9709 | 0.1985 | 0.1162 | 0.0181 |
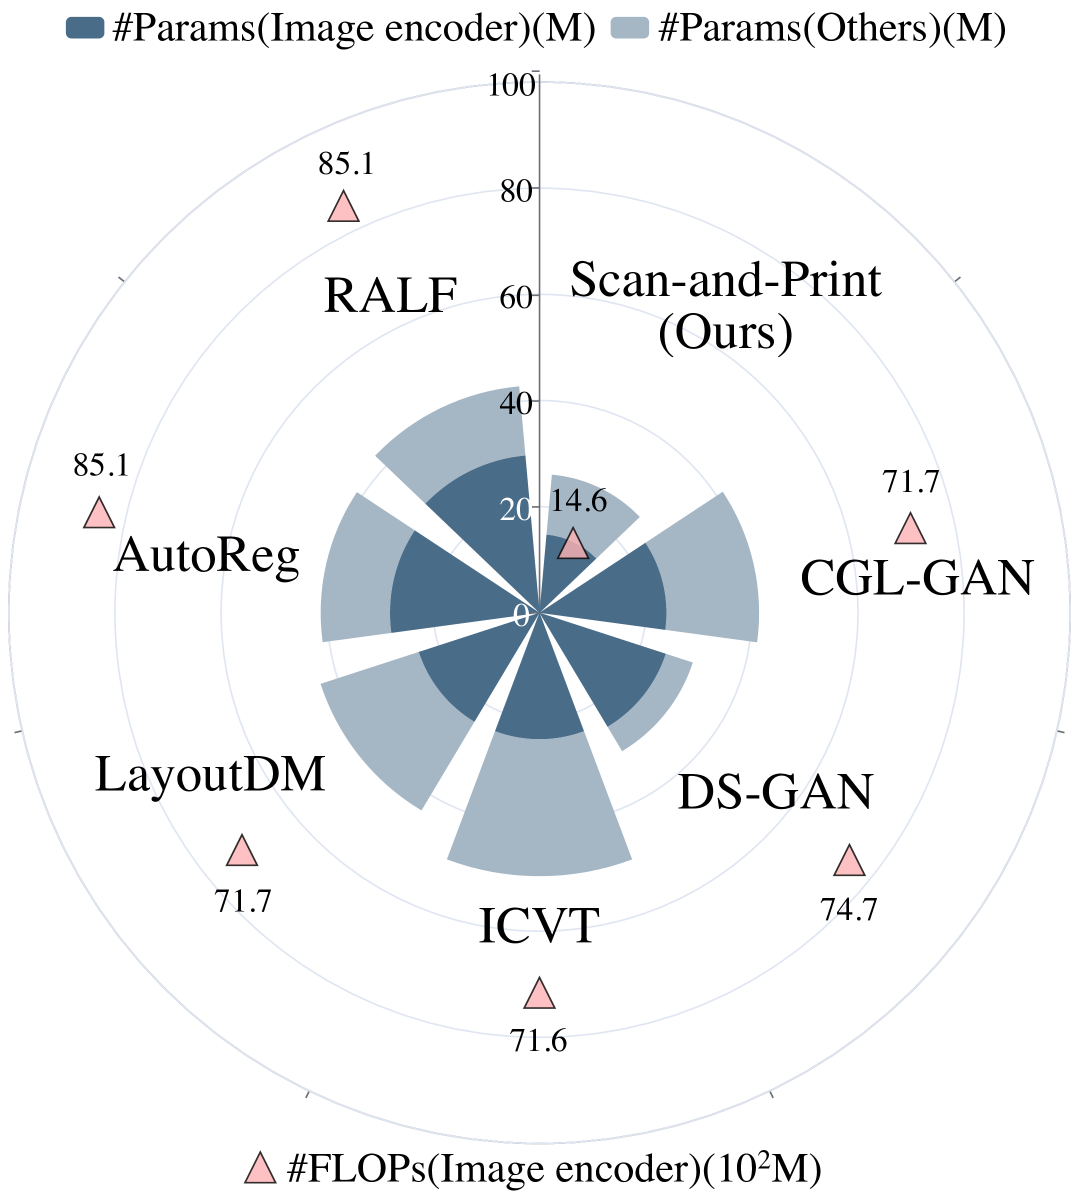
Image patch mixing.
and are combined using a binary mask and its complement , defined as:
| (1a) | ||||
| (1b) | ||||
| (1c) | ||||
where denotes patch-wise multiplication. This removes the applicable patches of and pastes on the corresponding patches of , making the challenging case containing fewer patches suitable for placing elements than the sources.
Element vertex mixing.
A stricter mask considering is initiated to constrain this process, ensuring that is a plausible layout for the input , and then, all continuous regions with at least three available patches in is found by depth-first search. Before mixing points in , the longest common subsequence (LCS) of their categories is obtained as of by dynamic programming. With indices and regions , the points are abstracted as:
| (2a) | ||||
| (2b) | ||||
| (2c) | ||||
This forms , where all starting points come from , and all ending points come from . To increase randomness, and are shuffled carefully before this process. Finally, the shifting operation is defined to move each pair of start-end points into the corresponding region while keeping their relative positions in the original patch, as:
| (3a) | ||||
| (3b) | ||||
| (3c) | ||||
| (3d) | ||||
where is the input image size, and left-top, right-bottom return coordinates of the specified patch.
4 Experiments
4.1 Datasets and Evaluation Metrics
To evaluate the proposed Scan-and-Print, we conduct experiments on widely used e-commerce poster datasets, PKU PosterLayout Hsu et al. (2023b) and CGL Zhou et al. (2022). Their train/annotated test/unannotated test splits are allocated following Horita et al. (2024) to ensure a fair comparison with existing work. Concretely, PKU PosterLayout contains 8,734/1,000/905 samples with three element types, which are logo, text, and underlay. CGL contains 54,546/6,002/1,000 samples with four element types, where the extra one is embellishment.
| Method | |||||||
| LayoutPrompter | 0.0026 | 0.0016 | 0.2693 | 0.1142 | 0.2008 | 0.4570 | 0.0644 |
| PosterLLaMa‡ | 0.0014 | 0.0007 | 0.9971 | 0.9771 | 0.1032 | 0.4687 | 0.0555 |
| CGL-GAN | 0.2668 | 0.0316 | 0.6774 | 0.1656 | 0.0554 | 0.4312 | 0.0512 |
| DS-GAN | 0.0991 | 0.0138 | 0.7566 | 0.2810 | 0.1339 | 0.4277 | 0.0526 |
| ICVT | 0.2045 | 0.1010 | 0.4357 | 0.2599 | 0.0360 | 0.4620 | 0.0397 |
| LayoutDM† | 0.0793 | 0.1822 | 0.6304 | 0.3853 | 0.0131 | 0.5438 | 0.0612 |
| AutoReg | 0.0577 | 0.0226 | 0.8848 | 0.7599 | 0.0572 | 0.3839 | 0.0427 |
| RALF | 0.0273 | 0.0189 | 0.9756 | 0.9315 | 0.0601 | 0.3359 | 0.0397 |
| S-and-P (Ours) | 0.0157 | 0.0197 | 0.9853 | 0.9736 | 0.0571 | 0.3356 | 0.0323 |
Following the above work, we evaluate layouts in two aspects, including (a) graphic metrics: overlay , alignment , loose, and strict underlay effectiveness , , and (b) content metrics: space utilization , salient object occlusion , and readability .
4.2 Implementation Details
We implement the image encoder and layer decoder with the first 8 layers of ViT-S Touvron et al. (2022) and a 4-layer Transformer Decoder, respectively. The size of the input image is (224, 224) and the embedding dimension is 384. We set the batch size, epoch, learning rate of the encoder, and of the others as 128, 15, , and . Considering the available data, the scan size is 96 and 48 for PKU PosterLayout and CGL, and the augmented sample size is 256 and 16, creating approximately 17,644 and 6,816 samples per epoch. All experiments are carried out on an NVIDIA A40 GPU.
4.3 Comparison with State-of-the-arts
We select approaches with open-sourced implementation as baselines, including the GAN-based CGL-GAN Zhou et al. (2022), DS-GAN Hsu et al. (2023b), autoregression-based ICVT Cao et al. (2022), AutoReg Horita et al. (2024), RALF Horita et al. (2024), diffusion model-based LayoutDM222The extended version presented in Horita et al. (2024). Inoue et al. (2023), and LLM-based PosterLlama333With the released CodeLlama-7B weight tuned on Hsu et al. (2023b), Zhou et al. (2022), and depth-guided augmented data. Seol et al. (2024), LayoutPrompter444With the Llama3.1-8B weight Dubey et al. (2024). Lin et al. (2023a).
| Method | |||||||
| Real data | 0.0010 | 0.0038 | 0.9955 | 0.9896 | 0.2238 | 0.1193 | 0.0109 |
| LayoutPrompter | 0.0017 | 0.0028 | 0.4085 | 0.1613 | 0.2104 | 0.2271 | 0.0309 |
| PosterLLaMa‡ | 0.0008 | 0.0006 | 0.9999 | 0.9982 | 0.1812 | 0.1489 | 0.0177 |
| CGL-GAN | 0.0966 | 0.0035 | 0.7854 | 0.3570 | 0.2065 | 0.1548 | 0.0191 |
| DS-GAN | 0.0261 | 0.0038 | 0.8350 | 0.5804 | 0.2078 | 0.1591 | 0.0199 |
| ICVT | 0.2572 | 0.0405 | 0.5384 | 0.3932 | 0.1161 | 0.2401 | 0.0259 |
| LayoutDM† | 0.1562 | 0.0018 | 0.6426 | 0.3873 | 0.1600 | 0.1432 | 0.0185 |
| AutoReg | 0.0187 | 0.0019 | 0.7863 | 0.4344 | 0.1994 | 0.1338 | 0.0164 |
| RALF | 0.0084 | 0.0028 | 0.9808 | 0.9201 | 0.2137 | 0.1195 | 0.01284 |
| S-and-P (Ours) | 0.0087 | 0.0014 | 0.9736 | 0.9639 | 0.2270 | 0.1173 | 0.01281 |
Baseline comparison.
As reported in Tab. 1 and Tab. 2, Scan-and-Print consistently achieves new SOTA performance across different benchmarks, especially on the severely data-scarce PKU PosterLayout. Compared to existing LLM-based methods that represent layouts as structured language and utilize LLMs’ coding abilities, ours shows unprecedentedly comparable graphic effectiveness with only 26M parameters while significantly improving content metrics. Particularly, it outperforms the SOTA approach, e.g., PosterLlama, by 28.7% and 28.4% in across two benchmarks. On the other hand, when compared to the non-LLM-based SOTA approach, e.g., RALF, it shows an overall superiority, especially improves by 12.2% and 4.5%. These observations demonstrate that the proposed Scan-and-Print can generate visually appealing layouts, ensuring that (1) salient objects in the input image are not occluded and (2) complex structural elements are correctly organized.
Results on the annotated splits are also reported, as in Tab. 3 and Tab. 4. We found the layouts generated by Scan-and-Print are already very close to the quality of ground truth data and even show better performance in and . While some metrics on CGL are slightly behind RALF, the overall performance of Scan-and-Print presents a good trade-off considering its reduced computational complexity, underlined in the next paragraph.
| Method | |||||||
| Real data | 0.0003 | 0.0024 | 0.9949 | 0.9875 | 0.1978 | 0.1353 | 0.0119 |
| LayoutPrompter | 0.0017 | 0.0030 | 0.3830 | 0.1740 | 0.1835 | 0.2380 | 0.0327 |
| PosterLLaMa‡ | 0.0006 | 0.0006 | 0.9987 | 0.9890 | 0.1775 | 0.1647 | 0.0184 |
| CGL-GAN | 0.2291 | 0.0123 | 0.6466 | 0.2281 | 0.1096 | 0.1811 | 0.0213 |
| DS-GAN | 0.0460 | 0.0022 | 0.9081 | 0.6308 | 0.2408 | 0.1476 | 0.0181 |
| ICVT | 0.2453 | 0.0179 | 0.5150 | 0.3326 | 0.1488 | 0.1945 | 0.0211 |
| LayoutDM† | 0.0184 | 0.0021 | 0.9216 | 0.8159 | 0.1933 | 0.1369 | 0.0137 |
| AutoReg | 0.0109 | 0.0023 | 0.9670 | 0.9171 | 0.1926 | 0.1250 | 0.0190 |
| RALF | 0.0042 | 0.0024 | 0.9912 | 0.9756 | 0.1969 | 0.1246 | 0.0180 |
| S-and-P (Ours) | 0.0034 | 0.0023 | 0.9701 | 0.9639 | 0.1957 | 0.1336 | 0.0126 |
Computational cost.
The parameter counts and FLOPs of different approaches are reported in Fig. 3. As observed, the total #Params in Scan-and-Print is only 61% of that in RALF, even less than #Params of RALF’s image encoders, which is the Scan-and-Print’s image encoder. This efficiency is further strengthened by the proposed scan procedure. Specifically, when the size is set to 96, our image encoder consumes only 1.46G FLOPs, which is 17% of the 8.51G FLOPs required by RALF. More exploration of values will be reported in the ablation study.
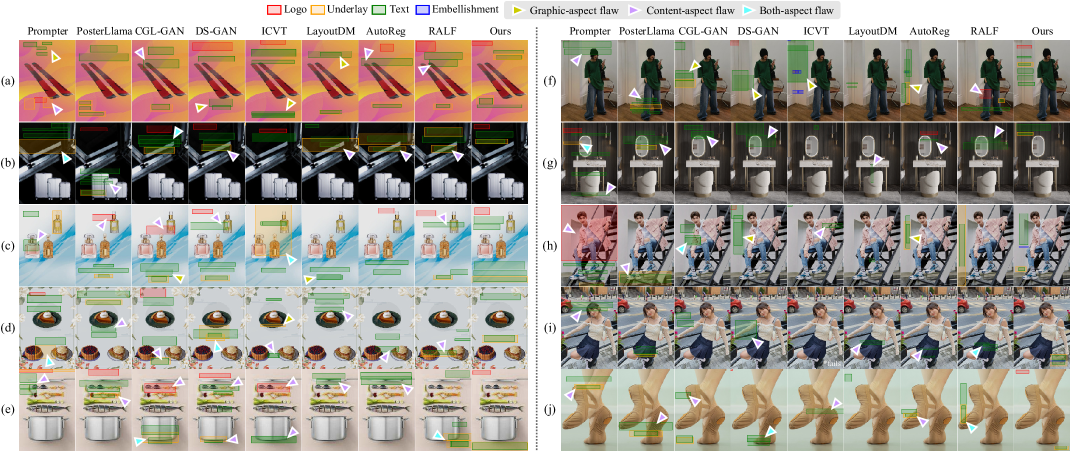
Visualized results.
Fig. 4 shows the layouts generated by different methods. The results illustrate that Scan-and-Print specializes in organizing combinations of elements rarely or never seen in datasets to suit applicable areas of diverse sizes and distributions, which is the charm of Print– the mixing-based data augmentation, while Scan ensures these elements are properly placed and reduces undesirable occlusions. Specifically, seeing the images in the first column, i.e., (a) and (f), although their only objects leave enough available spaces, layouts generated by existing methods still have minor flaws. In contrast, ours generates nearly perfect ones that actively utilize most spaces, creating more and better-organized elements. Moving on to the second column, as the complexity of objects in the image increases, the negative effect of overfitting shows and tends to place elements at the upper center, just like most training data. When the distribution of objects becomes dispersed and not centered, as in the third and fourth columns, or when there is very little available space, as in the fifth column, Scan-and-Print consistently generates visually appealing layouts, making full use of all available element types, even those that constitute a very small fraction of the training data, e.g., embellishment.
More visualized results of (1) constrained generation task, discussed in the next paragraph, and (2) mixed-up samples are presented in the supplementary material.
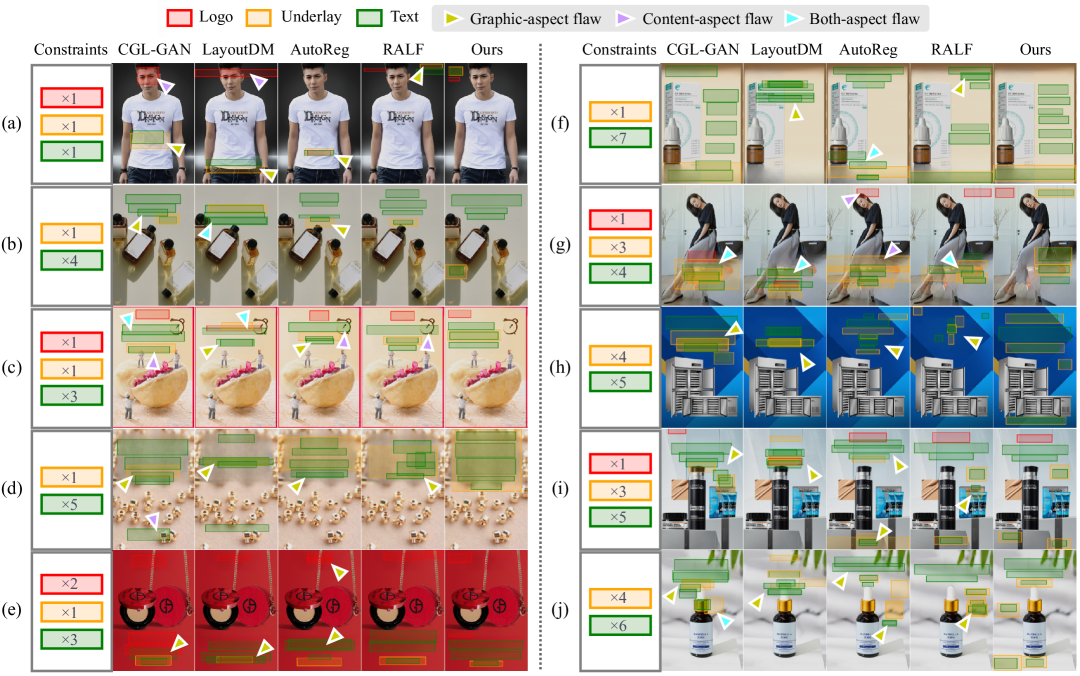
User-specified constraint.
Following RALF, we also explore constrained generation and demonstrate the adaptability of Scan-and-Print to the Category Size + Position task. As reported in Tab. 5, ours maintains a leading position in most metrics compared to RALF, showcasing its versatility to meet real-world needs. Moreover, Scan-and-Print achieves an average inference time of 267.8 ms per single inference, which is only 70% that of RALF (384.5 ms). This efficiency enables users to quickly explore a variety of high-quality layout options for their materials.
| Method | |||||||
| CGL-GAN | 0.0368 | 0.0046 | 0.8643 | 0.5701 | 0.2256 | 0.1483 | 0.0173 |
| LayoutDM† | 0.2311 | 0.0019 | 0.5875 | 0.1764 | 0.1212 | 0.2319 | 0.0324 |
| AutoReg | 0.0285 | 0.0030 | 0.7752 | 0.4298 | 0.2029 | 0.1348 | 0.0167 |
| RALF | 0.0095 | 0.0031 | 0.9687 | 0.8982 | 0.2137 | 0.1244 | 0.0138 |
| S-and-P (Ours) | 0.0136 | 0.0025 | 0.9659 | 0.9525 | 0.2173 | 0.1161 | 0.0131 |
| V | S | P | |||||||
| 0.0078 | 0.0028 | 0.9770 | 0.9015 | 0.1834 | 0.1331 | 0.0231 | |||
| 0.0153 | 0.0025 | 0.9781 | 0.9526 | 0.2091 | 0.1274 | 0.0192 | |||
| 0.0110 | 0.0027 | 0.9737 | 0.8999 | 0.1758 | 0.1394 | 0.0208 | |||
| 0.0147 | 0.0020 | 0.9855 | 0.9696 | 0.2102 | 0.1338 | 0.0223 | |||
| 0.0090 | 0.0024 | 0.9831 | 0.9709 | 0.1985 | 0.1162 | 0.0181 |
| #FLOPs | ||||||||
| Full | 2.90G | 0.0101 | 0.0027 | 0.9846 | 0.9770 | 0.1942 | 0.1158 | 0.0182 |
| 96 | 1.46G | 0.0090 | 0.0024 | 0.9831 | 0.9709 | 0.1985 | 0.1162 | 0.0181 |
| 48 | 0.76G | 0.0144 | 0.0032 | 0.9771 | 0.9506 | 0.2090 | 0.1224 | 0.0180 |
| 24 | 0.41G | 0.0093 | 0.0022 | 0.9848 | 0.9755 | 0.1962 | 0.1282 | 0.0192 |
| Selection | |||||||
| PCC | 0.0090 | 0.0024 | 0.9831 | 0.9709 | 0.1985 | 0.1162 | 0.01806 |
| COSIM | 0.0094 | 0.0025 | 0.9836 | 0.9754 | 0.1940 | 0.1172 | 0.01807 |
| Random | 0.0131 | 0.0030 | 0.9897 | 0.9828 | 0.1894 | 0.1150 | 0.0179 |
| Rate | ||||||||
| 32 | 25% | 0.0211 | 0.0020 | 0.9804 | 0.9480 | 0.2256 | 0.1134 | 0.0182 |
| 64 | 50% | 0.0113 | 0.0017 | 0.9667 | 0.9503 | 0.2096 | 0.1187 | 0.0192 |
| 128 | 100% | 0.0086 | 0.0026 | 0.9869 | 0.9781 | 0.1906 | 0.1195 | 0.0184 |
| 256 | 200% | 0.0090 | 0.0024 | 0.9831 | 0.9709 | 0.1985 | 0.1162 | 0.0181 |
4.4 Ablation Study
To gain insight into our implementation choices, including (1) each component, (2) the scan size , (3) mixed-up pairs selection strategy, and (4) the augmented sample size per mini-batch, we conduct extensive ablation studies with PKU PosterLayout, unannotated test split.
Effectiveness of each component.
As the comprehensive analysis provided in Tab. 6, all components of the Scan-and-Print have contributed positively to its performance. Starting from the first row, which is our baseline with a compact architecture, it has already outperformed the current SOTA approach, e.g., RALF, in almost all metrics. More concretely, it falls behind only in by a negligible 0.0003. This finding remarkably confirms the point we made in Introduction that the model complexity of existing methods has exceeded the size of available data supports, leading to counterproductive outcomes. More findings are as follows:
Row 1 2. When replacing conventional representation with the proposed VLR, an overall improvement is witnessed, especially in by 5.7%. While this is as expected, since VLR captures the fine-grained structure of layout elements, what impresses us is the coherent improvements in all content metrics, proving the value of the new representation.
Row 1 3. When joining the scan procedure, only a slight performance degradation comes with substantial computational cost savings. This strongly supports our view that the complexity of image perception in the target task is limited, verifying our decision to reduce its cost in pursuit of inference speed.
Row 2, 3 4. When involving both VLR and the scan procedure, their advantages are well combined, showing a good trade-off between effectiveness and computational efficiency.
Row 4 5. Finally, introducing the print procedure obtains the best results. It compensates for the slight visual information loss caused by the patch selection and further improves most graphic metrics through the diverse augmented samples. The only noticeable decrease in is attributed to the design of image mixing (Sec. 3.3) that tends to synthesize difficult cases of very few applicable patches, hence the in augmented samples is lower than the sources. Notably, the print procedure incurs only a time cost of 3.2 s per mini-batch and 54.8 min over the entire training period.
Exploration of different scan size .
Tab. 7 observes the impact of varying the perceived patch number on the performance. We experiment with candidates and also the full-size scenario. Surprisingly, compared to the full size, leads to an overall improvement in content metrics, which suggests that perceiving less applicable patches can introduce undesired noises. In contrast, if becomes smaller, where insufficient informative patches are selected, a downward trend of content metrics appears as expected. Another insight is that when the model pays less attention to visual information, layout features become more dominant and improve graphic metrics. Furthermore, it is important to highlight that all these results consistently outperform RALF. When , the cost saving significantly reaches 95.2% compared to RALF, which requires 8.51G FLOPs.
Different ways of selecting mixed-up pairs.
Selecting the mixed-up sources can be crucial Kim et al. (2021) to affect the quality and diversity of the augmented data, which in turn the model’s performance. Therefore, we experiment with three different strategies, including two based on patch indices , Pearson correlation coefficient (PCC) and cosine similarity (COSIM), as well as a data-agnostic random strategy. As reported in Tab. 8, PCC achieves the best overall results, particularly excelling in , which is most impacted by the synthesized challenging cases, as analyzed in previous studies. Since PCC and COSIM tend to select pairs with similar patch indices, their leading position is expected. Nevertheless, the random strategy achieves amazingly good results in other metrics. This finding demonstrates the robustness of the proposed mixup operations, which regains the advantages of their original concepts Zhang et al. (2018), namely, high adaptability and no stringent prerequisites for the existing training data.
Impacts of augmented sample size .
Last but not least, Tab. 9 provides insights into the augmented sample size per mini-batch. We experiment with candidates given a fixed mini-batch size 128. As observed, the best outcomes are found at , whereas additional improvement is witnessed in all content metrics when keeps increasing, demonstrating the potential of involving more augmented data for further advancement. It is worth reiterating that the cost of creating these samples is extremely low. Even at , it takes only 3.2 s per mini-batch, as reported in the previous study. However, the additional samples do consume more GPU memory and result in longer training times, which is a trade-off to consider. By investing more efforts in the training stage, the proposed Scan-and-Print has successfully demonstrated excellent real-time performance and generalization capabilities in the inference stage.
5 Discussion
Conclusion.
This work discussed the common pitfalls of current content-aware layout generation methods, i.e., high computational costs and low generalization ability. These defects are attributed to the large number of parameters relative to the limited available training data, and the image encoder is further identified as the culprit. To address these challenges, we presented a compact autoregressive model accompanying the proposed patch-level data summarization and augmentation approach, Scan-and-Print. Through extensive experiments, we demonstrated that it has achieved new SOTA results across various benchmarks. Moreover, compared to the previous SOTA method, it has saved 95% computational cost in image perception, required only 61% of the parameters, and reduced inference time to 70% in generation.
Future work.
We outline two promising directions that continuously bring valuable contributions to the field. The first one lies in introducing multi-modal content awareness into the scan procedure. While most existing work, including ours, considers mainly the background images, subsequent research can incorporate semantics of texts to be put in. This helps directly target the applicable areas adjacent to the relevant objects, enabling layout generation for the visual design of instructional materials. The second one is to explore different mixup operations in the print procedure. While mixup has been applied across various domains Bochkovskiy et al. (2020); Yoon et al. (2021), we introduce it to layout generation for the first time. We believe the proposed vertex-level mixup can also boost content-agnostic tasks, which is marvelous because it often works the other way around. Moreover, we hope this work encourages more researchers to explore various operations, such as the simpler box-level mixup, and we look forward to witnessing the benefits they bring.
Appendix A Definitions of Functions in Algorithm 1
The group-element-id and arrange-severtex-id functions invoked in Algorithm 1 are defined as follows:
Function group-element-id
Function arrange-severtex-id
Appendix B Supplementary Materials
This supplementary material provides additional information about the proposed approach, Scan-and-Print. Sec. B.1 presents more results of the constrained generation task. Sec. B.2 presents more examples of mixed-up samples synthesized by the print procedure.
B.1 Results of Constrained Generation Task
Fig. A shows the layouts generated by different methods under given categories. These results illustrate that Scan-and-Print can generate layouts complying with user-specific constraints for various poster background images. Regardless of the complexity of constraints, it consistently organizes elements into high-quality results. From the first column, (a), to the last one, (j), the number of given constraints monotonically increases, which makes the task progressively more challenging and simultaneously highlights our approach’s advantage. Specifically, it excels at arranging underlays and their enclosed elements, as seen in (d), where it perfectly places five texts within an underlay without any unpleasant overlays. Moreover, while some methods fail in difficult cases, such as CGL-GAN, LayoutDM, and AutoReg in (g) as well as RALF in (h), ours still obtains coherent and appropriate structure. Overall, we demonstrate that Scan-and-Print is highly robust and effective in diverse scenarios, meeting real-world requirements.
B.2 Examples of Mixed-up Samples
Given a mini-batch with 64 image-layout pairs, as shown in Fig. B, the print procedure synthesizes various challenging mixed-up samples, a part of which is visualized in Fig. C.
Acknowledgments
This work was supported by the grants from the National Natural Science Foundation of China (62525201, 62132001, 62432001) and Beijing Natural Science Foundation (L247006).
References
- Bang et al. [2022] Duhyeon Bang, Kyungjune Baek, Jiwoo Kim, Yunho Jeon, Jin-Hwa Kim, Jiwon Kim, Jongwuk Lee, and Hyunjung Shim. Logit mixing training for more reliable and accurate prediction. In Proceedings of the International Joint Conference on Artificial Intelligence, pages 2812–2819, 2022.
- Bochkovskiy et al. [2020] Alexey Bochkovskiy, Chien-Yao Wang, and Hong-Yuan Mark Liao. Yolov4: Optimal speed and accuracy of object detection. arXiv preprint arXiv:2004.10934, 2020.
- Canva [2024] Canva. Visual economy report 2024 edition: How visual communication fuels new business opportunities. https://www.canva.com/visual-economy-report/, 2024.
- Cao et al. [2022] Yunning Cao, Ye Ma, Min Zhou, Chuanbin Liu, Hongtao Xie, Tiezheng Ge, and Yuning Jiang. Geometry aligned variational transformer for image-conditioned layout generation. In Proceedings of the ACM International Conference on Multimedia, pages 1561–1571, 2022.
- Chai et al. [2023a] Shang Chai, Liansheng Zhuang, and Fengying Yan. Layoutdm: Transformer-based diffusion model for layout generation. In Proceedings of the IEEE/CVF Conference on Computer Vision and Pattern Recognition, pages 18349–18358, 2023.
- Chai et al. [2023b] Shang Chai, Liansheng Zhuang, Fengying Yan, and Zihan Zhou. Two-stage content-aware layout generation for poster designs. In Proceedings of the ACM International Conference on Multimedia, pages 8415–8423, 2023.
- Chen et al. [2024] Bingzhi Chen, Zhongqi Wu, Yishu Liu, Biqing Zeng, Guangming Lu, and Zheng Zhang. Enhancing cross-modal retrieval via visual-textual prompt hashing. In Proceedings of the International Joint Conference on Artificial Intelligence, pages 623–631, 2024.
- Dubey et al. [2024] Abhimanyu Dubey, Abhinav Jauhri, Abhinav Pandey, Abhishek Kadian, Ahmad Al-Dahle, Aiesha Letman, Akhil Mathur, Alan Schelten, Amy Yang, Angela Fan, et al. The llama 3 herd of models. arXiv preprint arXiv:2407.21783, 2024.
- Fu et al. [2024] Stephanie Fu, Netanel Tamir, Shobhita Sundaram, Lucy Chai, Richard Zhang, Tali Dekel, and Phillip Isola. Dreamsim: Learning new dimensions of human visual similarity using synthetic data. In Proceedings of the International Conference on Neural Information Processing Systems, pages 50742–50768, 2024.
- Guo et al. [2021] Shunan Guo, Zhuochen Jin, Fuling Sun, Jingwen Li, Zhaorui Li, Yang Shi, and Nan Cao. Vinci: an intelligent graphic design system for generating advertising posters. In Proceedings of the CHI Conference on Human Factors in Computing Systems, pages 1–17, 2021.
- Horita et al. [2024] Daichi Horita, Naoto Inoue, Kotaro Kikuchi, Kota Yamaguchi, and Kiyoharu Aizawa. Retrieval-augmented layout transformer for content-aware layout generation. In Proceedings of the IEEE/CVF Conference on Computer Vision and Pattern Recognition, pages 67–76, 2024.
- Hsu et al. [2023a] HsiaoYuan Hsu, Xiangteng He, and Yuxin Peng. Densitylayout: Density-conditioned layout gan for visual-textual presentation designs. In Proceedings of the International Conference on Image and Graphics, pages 187–199, 2023.
- Hsu et al. [2023b] HsiaoYuan Hsu, Xiangteng He, Yuxin Peng, Hao Kong, and Qing Zhang. Posterlayout: A new benchmark and approach for content-aware visual-textual presentation layout. In Proceedings of the IEEE/CVF Conference on Computer Vision and Pattern Recognition, pages 6018–6026, 2023.
- Hu et al. [2021] Edward J Hu, Yelong Shen, Phillip Wallis, Zeyuan Allen-Zhu, Yuanzhi Li, Shean Wang, Lu Wang, and Weizhu Chen. Lora: Low-rank adaptation of large language models. arXiv preprint arXiv:2106.09685, 2021.
- Inoue et al. [2023] Naoto Inoue, Kotaro Kikuchi, Edgar Simo-Serra, Mayu Otani, and Kota Yamaguchi. Layoutdm: Discrete diffusion model for controllable layout generation. In Proceedings of the IEEE/CVF Conference on Computer Vision and Pattern Recognition, pages 10167–10176, 2023.
- Kang and Kim [2023] Minsoo Kang and Suhyun Kim. Guidedmixup: an efficient mixup strategy guided by saliency maps. In Proceedings of the AAAI Conference on Artificial Intelligence, pages 1096–1104, 2023.
- Kim et al. [2020] Jang-Hyun Kim, Wonho Choo, and Hyun Oh Song. Puzzle mix: Exploiting saliency and local statistics for optimal mixup. In Proceedings of the International Conference on Machine Learning, pages 5275–5285, 2020.
- Kim et al. [2021] Jang-Hyun Kim, Wonho Choo, Hosan Jeong, and Hyun Oh Song. Co-mixup: Saliency guided joint mixup with supermodular diversity. In Proceedings of International Conference on Learning Representations, 2021.
- Li et al. [2020a] Jianan Li, Jimei Yang, Aaron Hertzmann, Jianming Zhang, and Tingfa Xu. LayoutGAN: Synthesizing graphic layouts with vector-wireframe adversarial networks. IEEE Transactions on Pattern Analysis and Machine Intelligence, 43(7):2388–2399, 2020.
- Li et al. [2020b] Jianan Li, Jimei Yang, Jianming Zhang, Chang Liu, Christina Wang, and Tingfa Xu. Attribute-conditioned layout GAN for automatic graphic design. IEEE Transactions on Visualization and Computer Graphics, 27(10):4039–4048, 2020.
- Li et al. [2021] Chenhui Li, Peiying Zhang, and Changbo Wang. Harmonious textual layout generation over natural images via deep aesthetics learning. IEEE Transactions on Multimedia, 2021.
- Li et al. [2023] Junnan Li, Dongxu Li, Silvio Savarese, and Steven Hoi. Blip-2: Bootstrapping language-image pre-training with frozen image encoders and large language models. In Proceedings of the International Conference on Machine Learning, pages 19730–19742, 2023.
- Lin et al. [2023a] Jiawei Lin, Jiaqi Guo, Shizhao Sun, Zijiang Yang, Jian-Guang Lou, and Dongmei Zhang. Layoutprompter: Awaken the design ability of large language models. In Proceedings of the International Conference on Neural Information Processing Systems, pages 43852–43879, 2023.
- Lin et al. [2023b] Jinpeng Lin, Min Zhou, Ye Ma, Yifan Gao, Chenxi Fei, Yangjian Chen, Zhang Yu, and Tiezheng Ge. Autoposter: A highly automatic and content-aware design system for advertising poster generation. In Proceedings of the ACM International Conference on Multimedia, pages 1250–1260, 2023.
- Oquab et al. [2023] Maxime Oquab, Timothée Darcet, Théo Moutakanni, Huy Vo, Marc Szafraniec, Vasil Khalidov, Pierre Fernandez, Daniel Haziza, Francisco Massa, Alaaeldin El-Nouby, et al. Dinov2: Learning robust visual features without supervision. arXiv preprint arXiv:2304.07193, 2023.
- Qin et al. [2022] Xuebin Qin, Hang Dai, Xiaobin Hu, Deng-Ping Fan, Ling Shao, and Luc Van Gool. Highly accurate dichotomous image segmentation. In Proceedings of the European Conference on Computer Vision, pages 38–56, 2022.
- Roziere et al. [2023] Baptiste Roziere, Jonas Gehring, Fabian Gloeckle, Sten Sootla, Itai Gat, Xiaoqing Ellen Tan, Yossi Adi, Jingyu Liu, Romain Sauvestre, Tal Remez, et al. Code llama: Open foundation models for code. arXiv preprint arXiv:2308.12950, 2023.
- Seol et al. [2024] Jaejung Seol, Seojun Kim, and Jaejun Yoo. Posterllama: Bridging design ability of language model to content-aware layout generation. In Proceedings of the European Conference on Computer Vision, pages 451–468, 2024.
- Touvron et al. [2022] Hugo Touvron, Matthieu Cord, and Hervé Jégou. Deit iii: Revenge of the vit. In Proceedings of the European Conference on Computer Vision, pages 516–533, 2022.
- Uddin et al. [2021] AFM Uddin, Mst Monira, Wheemyung Shin, TaeChoong Chung, Sung-Ho Bae, et al. Saliencymix: A saliency guided data augmentation strategy for better regularization. In Proceedings of International Conference on Learning Representations, 2021.
- Wang et al. [2024] Shaodong Wang, Yunyang Ge, Liuhan Chen, Haiyang Zhou, Qian Wang, Xinhua Cheng, and Li Yuan. Prompt2poster: Automatically artistic chinese poster creation from prompt only. In Proceedings of the ACM International Conference on Multimedia, pages 10716–10724, 2024.
- Weng et al. [2023] Haohan Weng, Danqing Huang, Tong Zhang, and Chin-Yew Lin. Learn and sample together: Collaborative generation for graphic design layout. In Proceedings of the International Joint Conference on Artificial Intelligence, pages 5851–5859, 2023.
- Weng et al. [2024] Haohan Weng, Danqing Huang, Yu Qiao, Zheng Hu, Chin-Yew Lin, Tong Zhang, and CL Chen. Desigen: A pipeline for controllable design template generation. In Proceedings of the IEEE/CVF Conference on Computer Vision and Pattern Recognition, pages 12721–12732, 2024.
- Xu et al. [2023] Chenchen Xu, Min Zhou, Tiezheng Ge, Yuning Jiang, and Weiwei Xu. Unsupervised domain adaption with pixel-level discriminator for image-aware layout generation. In Proceedings of the IEEE/CVF Conference on Computer Vision and Pattern Recognition, pages 10114–10123, 2023.
- Yang et al. [2023] Tao Yang, Fan Wang, Junfan Lin, Zhongang Qi, Yang Wu, Jing Xu, Ying Shan, and Changwen Chen. Toward human perception-centric video thumbnail generation. In Proceedings of the ACM International Conference on Multimedia, pages 6653–6664, 2023.
- Yoon et al. [2021] Soyoung Yoon, Gyuwan Kim, and Kyumin Park. Ssmix: Saliency-based span mixup for text classification. In Findings of the Association for Computational Linguistics, 2021.
- Yun et al. [2019] Sangdoo Yun, Dongyoon Han, Seong Joon Oh, Sanghyuk Chun, Junsuk Choe, and Youngjoon Yoo. Cutmix: Regularization strategy to train strong classifiers with localizable features. In Proceedings of the IEEE/CVF International Conference on Computer Vision, pages 6023–6032, 2019.
- Zhang et al. [2018] Hongyi Zhang, Moustapha Cisse, Yann N. Dauphin, and David Lopez-Paz. mixup: Beyond empirical risk minimization. In Proceedings of International Conference on Learning Representations, 2018.
- Zhang et al. [2023] Lvmin Zhang, Anyi Rao, and Maneesh Agrawala. Adding conditional control to text-to-image diffusion models. In Proceedings of the IEEE/CVF International Conference on Computer Vision, pages 3836–3847, 2023.
- Zhou et al. [2022] Min Zhou, Chenchen Xu, Ye Ma, Tiezheng Ge, Yuning Jiang, and Weiwei Xu. Composition-aware graphic layout GAN for visual-textual presentation designs. In Proceedings of the International Joint Conference on Artificial Intelligence, pages 4995–5001, 2022.
- Zhu et al. [2023] Deyao Zhu, Jun Chen, Xiaoqian Shen, Xiang Li, and Mohamed Elhoseiny. Minigpt-4: Enhancing vision-language understanding with advanced large language models. arXiv preprint arXiv:2304.10592, 2023.