PathBench: A comprehensive comparison benchmark for pathology foundation models towards precision oncology
Abstract
The emergence of pathology foundation models has revolutionized computational histopathology, enabling highly accurate, generalized whole-slide image analysis for improved cancer diagnosis, treatment planning, and prognosis assessment. While these models show remarkable potential across cancer diagnostics and prognostics, their clinical translation faces critical challenges including variability in optimal model across cancer types, potential data leakage in evaluation, and lack of standardized benchmarks. Without rigorous, unbiased evaluation, even the most advanced PFMs risk remaining confined to research settings, delaying their life-saving applications. Existing benchmarking efforts remain limited by narrow cancer-type focus, potential pretraining data overlaps, or incomplete task coverage. We present PathBench, the first comprehensive benchmark addressing these gaps through: multi-center in-hourse datasets spanning common cancers with rigorous leakage prevention, evaluation across the full clinical spectrum from diagnosis to prognosis, and an automated leaderboard system for continuous model assessment. Our framework incorporates large-scale, clinically diverse data with standardized evaluation protocols, enabling objective comparison of PFMs while reflecting real-world clinical complexity. All evaluation data comes from private medical providers, with strict exclusion of any pretraining usage to avoid data leakage risks. We have collected 15,888 whole-slide images (WSIs) from 8,549 patients across 10 hospitals, encompassing over 64 diagnosis and prognosis tasks. Currently, our evaluation of 19 PFMs shows that Virchow2 and H-Optimus-1 are the most effective models overall. PathBench’s dynamic benchmark supports ongoing community contributions through an automated evaluation pipeline. This work provides researchers with a robust platform for model development and offers clinicians actionable insights into PFM performance across diverse clinical scenarios, ultimately accelerating the translation of these transformative technologies into routine pathology practice.
Introduction
Histopathology serves as the cornerstone of modern oncology, guiding critical decisions from diagnosis to therapeutic strategy selection [1, 2, 3]. While convolutional neural networks (CNNs) and vision transformers (ViTs) have demonstrated remarkable success in computational pathology through supervised learning [4, 5, 6], the field now stands at an inflection point with the rise of pathology foundation models (PFMs). These pre-trained models leverage self-supervised training on massive amounts of pathological images to learn powerful visual representations [7, 8, 9], or employ contrastive learning to align images, text, and even genetic information to further enhance the model’s multimodal capabilities [10, 11, 12]. By pretraining on large-scale diverse data, PFMs are revolutionizing whole-slide image (WSI) analysis through three key advantages: superior generalization across institutions and staining protocols, reduced reliance on expensive extensive manual annotations, and emergent capabilities for multimodal reasoning in diagnostic contexts. The clinical potential of PFMs is evidenced by recent breakthroughs across multiple cancer types, including gastric inflammation [13], gastrointestinal cancer [14], breast cancer [15], and other malignancies [16, 17]. Notably, these models have demonstrated proficiency not only in classification tasks but also in predicting molecular subtypes, treatment responses, and patient outcomes directly from histomorphological patterns.
Despite these advances, three critical challenges hinder clinical translation of PFMs. First, optimal architecture and pretraining strategies show significant variability across cancer subtypes and clinical applications. Second, evaluation methodologies may suffer from data leakage or selection bias, particularly when test datasets overlap with pretraining data or share similar demographic characteristics. Third, the absence of standardized benchmarks makes it difficult to validate performance claims across real-world clinical settings. These challenges collectively underscore the need for a rigorous, leakage-free, and sustainable evaluation framework capable of objectively comparing PFM performance across diverse cancer types and clinical workflows.
While existing benchmarking efforts have made valuable contributions, they face notable limitations. Many rely exclusively on public datasets that may not reflect clinical diversity and often contain hidden overlaps with model pretraining data [18, 19, 20]. Others focus narrowly on specific cancer types like prostate [21] or ovarian cancer [22], limiting their generalizability. Even the most comprehensive studies [23] typically evaluate only a subset of clinically relevant tasks, neglecting critical aspects such as prognosis prediction and other multimodal tasks.
To address these gaps, we present PathBench, the first comprehensive benchmark for PFMs in clinical data across common cancers. PathBench is designed to evaluate PFM performance on a wide range of tasks—from diagnosis to prognosis—using large-scale, multi-center datasets that reflect the diversity and complexity of real-world clinical scenarios. The benchmark data are obtained solely from private medical institutions, and rigorous protocols are employed to guarantee that none of the data had been exposed to evaluated PFMs during pretraining, thereby eliminating any risk of data contamination. Given the rapid advancement of PFMs and the growing need for broader cancer type coverage, we also establish a live leaderboard, hosted on our GitHub repository, to streamline the evaluation of new models and datasets. Model developers can submit their models and corresponding weights via pull requests, after which our standardized evaluation pipeline automatically assesses performance on in-house data and updates the leaderboard accordingly. By providing a unified evaluation framework and a dynamic leaderboard, PathBench aims to accelerate the development and validation of PFMs, enhancing their reliability and clinical applicability. This benchmark not only enables researchers to compare PFM performance across multiple cancer types and tasks but also serves as a critical resource for clinicians and pathologists to assess the real-world utility of these models in clinical practice.
Results
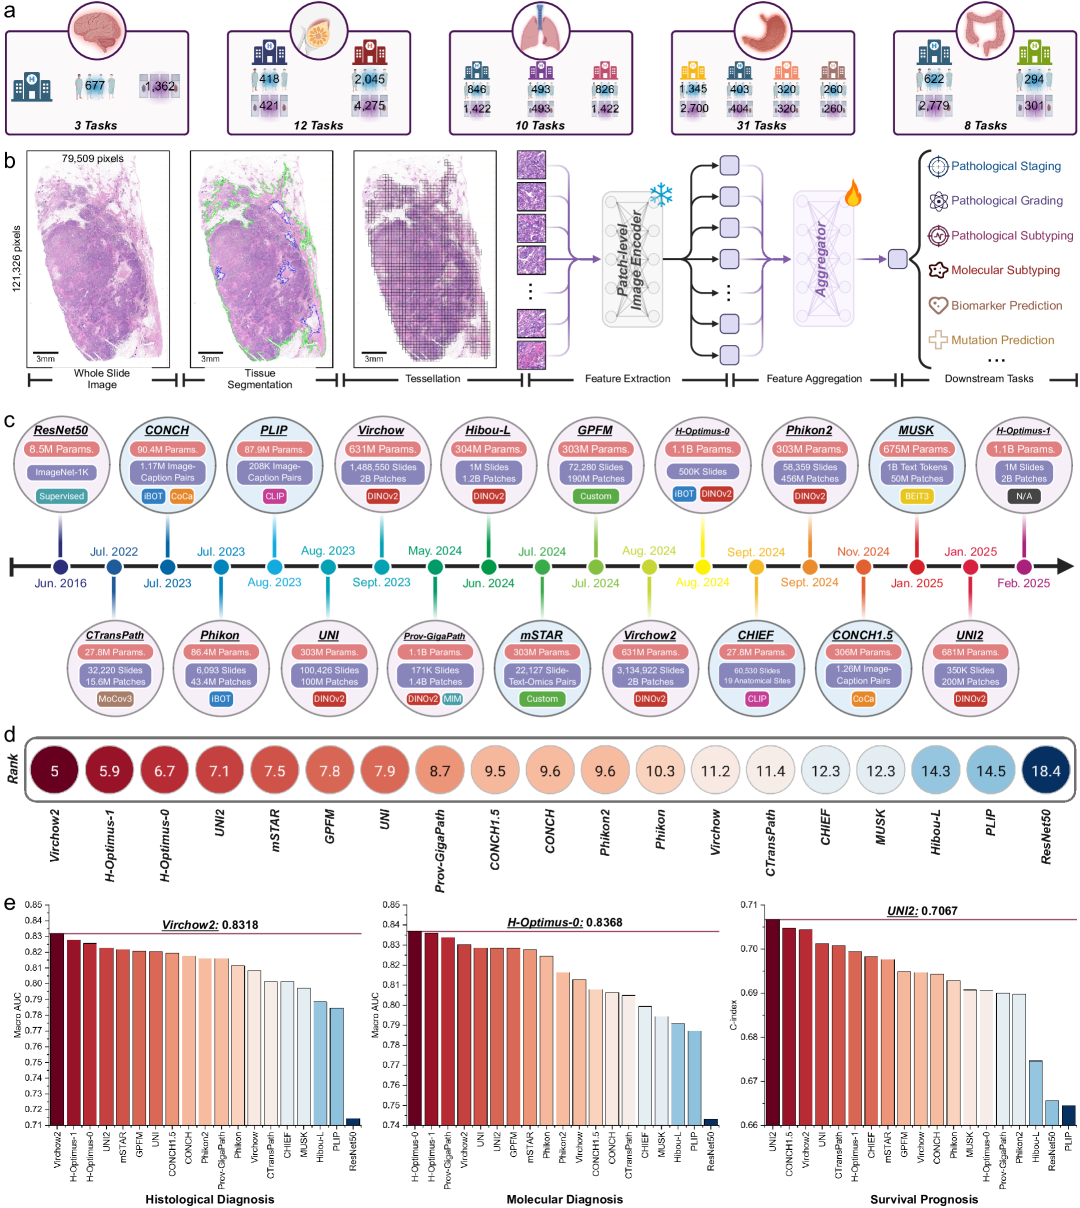
We evaluated 19 pathology foundation models, including vision-only, vision-language, and multimodal-enhanced architectures (Figure 1c). To ensure a comprehensive assessment, we tested these models on 64 tasks (Figure 1a) across five major cancer types: lung cancer (10 tasks), breast cancer (12 tasks), gastric cancer (31 tasks), colorectal cancer (8 tasks), and brain cancer (3 tasks). For each cancer type, we conducted extensive experiments on clinically relevant tasks, including diagnosis, staging, molecular subtyping, biomarker prediction, and survival analysis (Figure 1b). The evaluation utilized both internal validation sets and external cohorts to assess model generalizability and robustness across different clinical settings. Among the 64 tasks, Virchow2, H-optimus-1, H-optimus-0, UNI2, and mSTAR achieved Top-5 performance, with rank scores of 5.0, 5.9, 6.6, 7.1, and 7.4, respectively (Figure 1d). Specifically, Virchow2 and H-optimus-1 achieved Top-2 performance in histological subtyping tasks, while H-optimus-0 and H-optimus-1 excelled in molecular subtyping tasks. UNI2 and CONCH1.5 demonstrated the best performance in survival prognosis tasks (Figure 1e). In addition to overall performance, we also examined the models’ effectiveness across different organs. Notably, H-optimus-1 ranked first in lung and colorectal cancer data, whereas Virchow2 performed best in breast, brain, and gastric cancer. Overall, the vision foundation models (e.g., Virchow2 and H-Optimus-1) are still more effective than vision-language models for the clinical-level tasks.
Lung Cancer
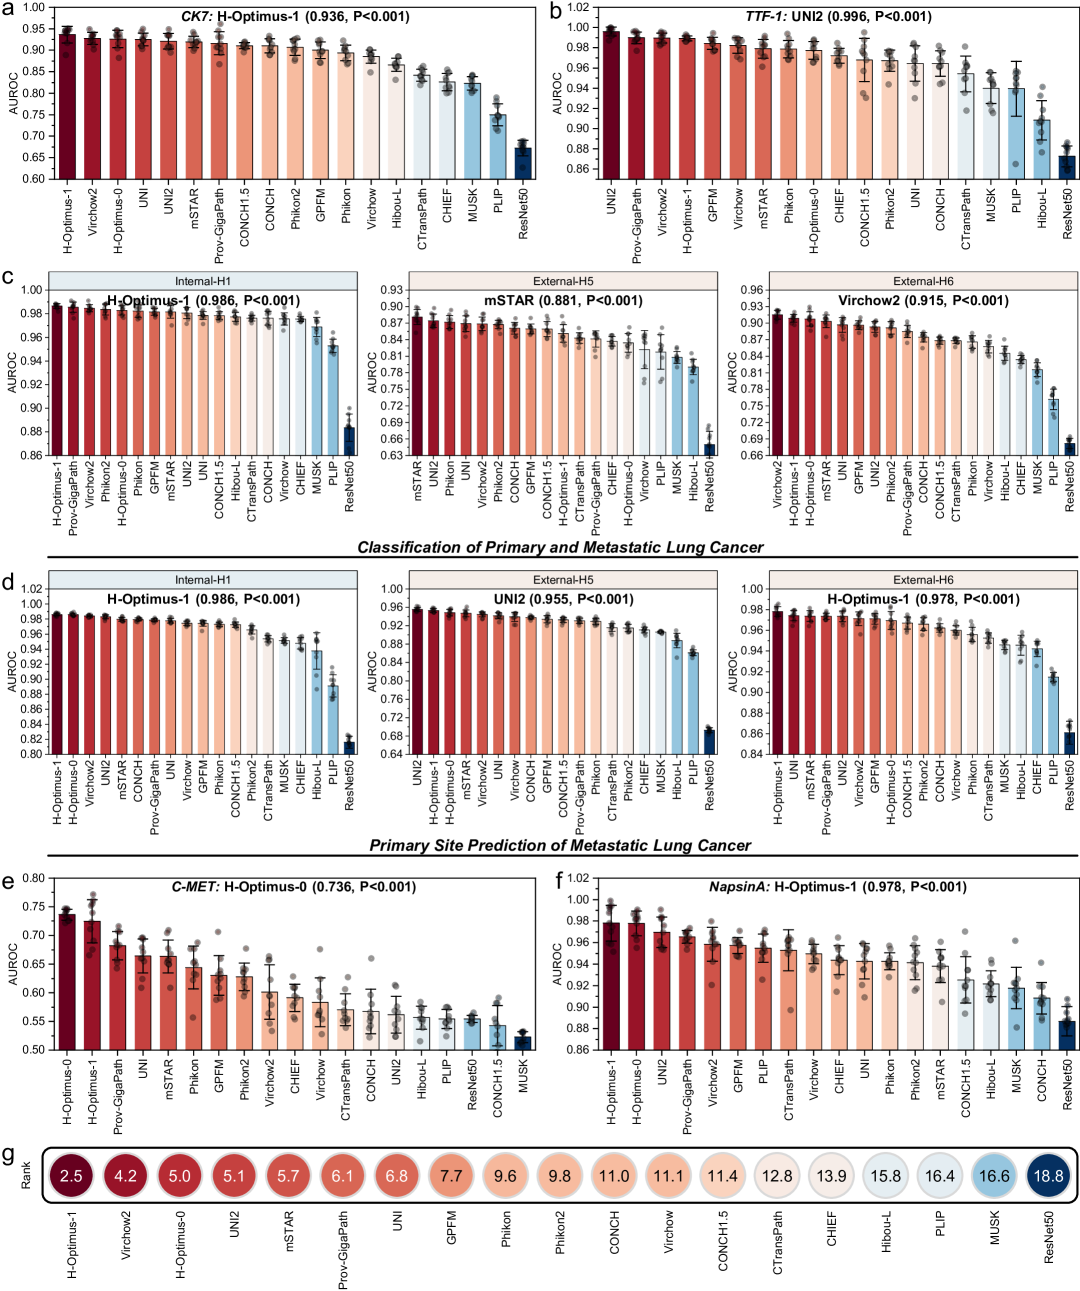
Lung cancer is the leading cause of cancer-related deaths worldwide [24]. In our evaluation of lung cancer data, we assessed the models on 10 tasks, including the classification of primary adenocarcinoma versus metastatic cancer, primary site prediction, and four molecular subtyping tasks based on H&E slides. Overall, H-optimus-1 achieved the highest average ranking score of 2.5, followed by Virchow2 with a score of 4.2 (Figure 2g). For the metastatic cancer classification task on the internal cohort, all pathology foundation models performed well, with an AUC around 0.97; Virchow2 achieved the highest AUC of 0.9865. In two external cohorts, mSTAR and Virchow2 demonstrated the best performance, with AUCs of 0.8811 and 0.9152, respectively (Figure 2c). To predict the primary site of lung cancer, H-optimus-1 excelled, achieving AUCs of 0.9782 on the internal cohort and 0.9861 on the external cohort H6 (Figure 2d). Overall, both H-optimus-1 and Virchow2 are the top models for metastatic-related tasks. We also investigated the performance of different models on molecular subtyping tasks. The H-optimus series performed best on three out of four molecular subtyping tasks: CK7 (Figure 2a), C-MET (Figure 2e), and NapsinA (Figure 2f). Predicting CK7 and NapsinA status proved relatively straightforward, with H-optimus-1 achieving AUCs of 0.9362 and 0.9781, respectively. In contrast, predicting C-MET status was more challenging; the best-performing model, H-optimus, achieved an AUC of only 0.7362. For the TTF-1 task, UNI2 performed best with an AUC of 0.996 (Figure 2b), indicating that TTF-1 status prediction is relatively easy. In summary, for the lung cancer dataset, H-optimus-1 and Virchow2 are the optimal choices for clinical research and applications.
Breast Cancer
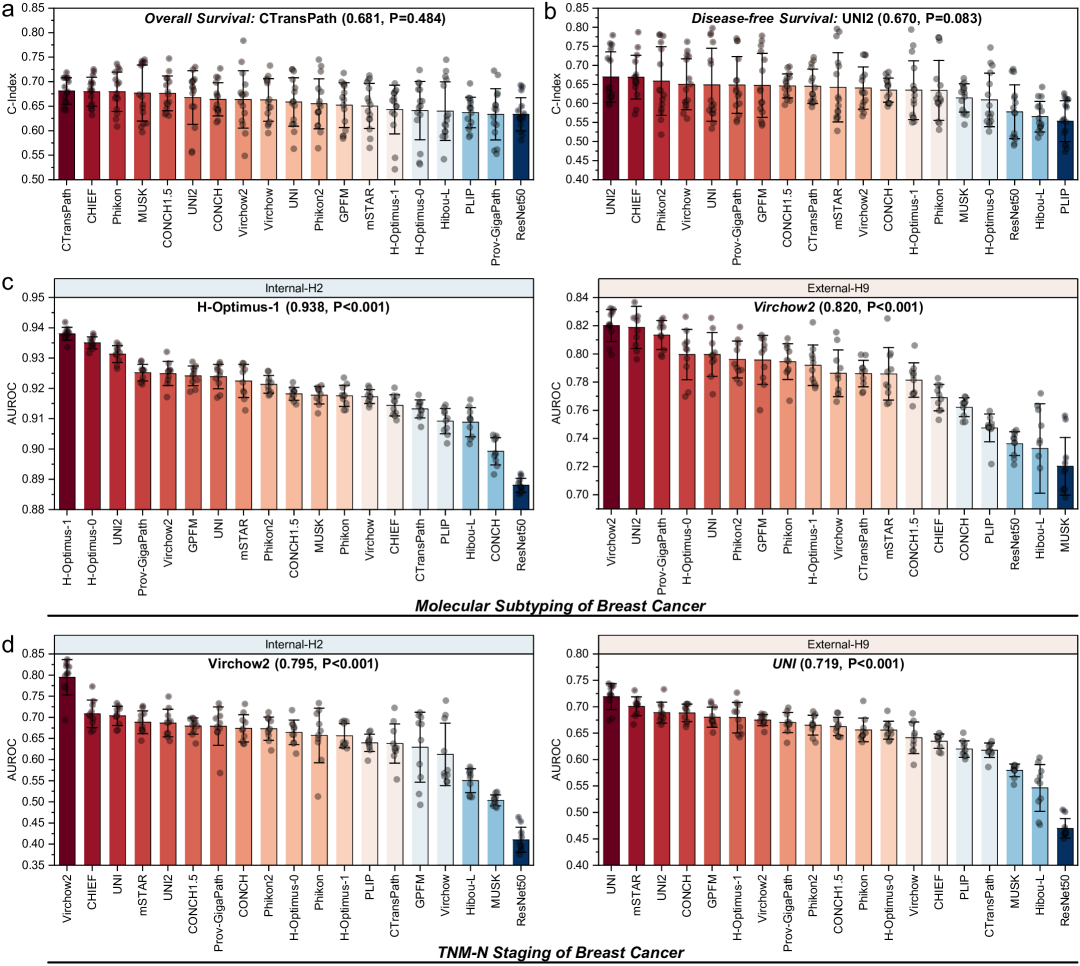
Breast cancer is the most prevalent cancer among women globally. The breast cancer dataset comprises 2,463 patients (4,696 WSIs) from two hospitals and covers 12 tasks, including molecular classification, subtype classification, and survival prediction. Results are presented in Figures 3 and 4. Overall, Virchow2 demonstrates the best performance across most tasks, with an average rank of 5.9, closely followed by UNI at an average rank of 6.3 (Figure 4g).
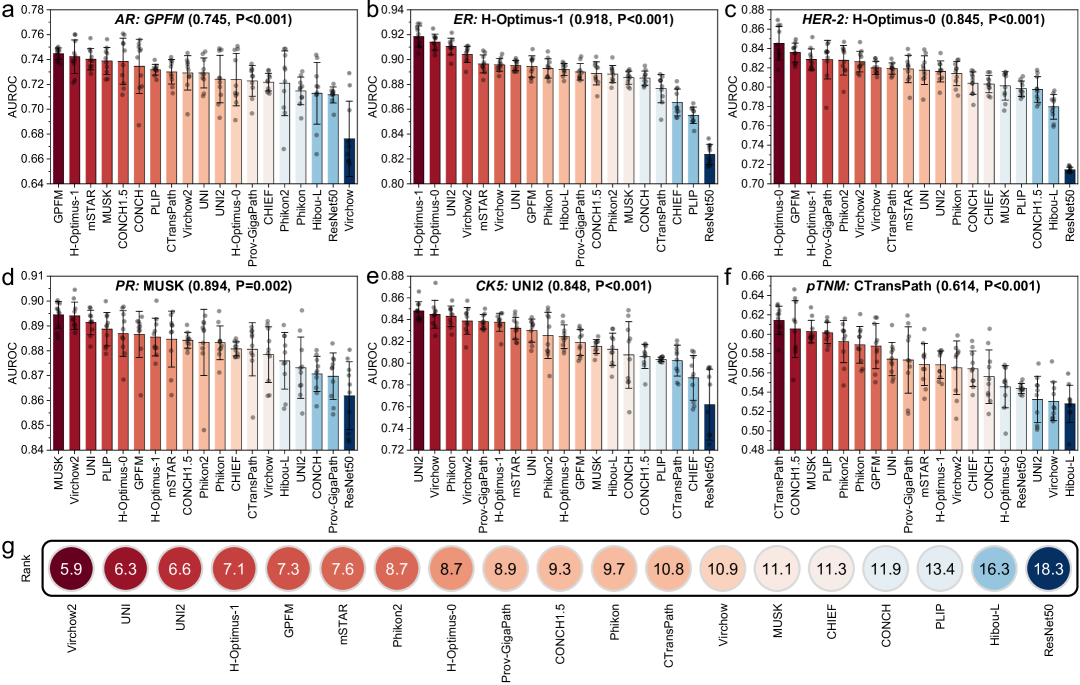
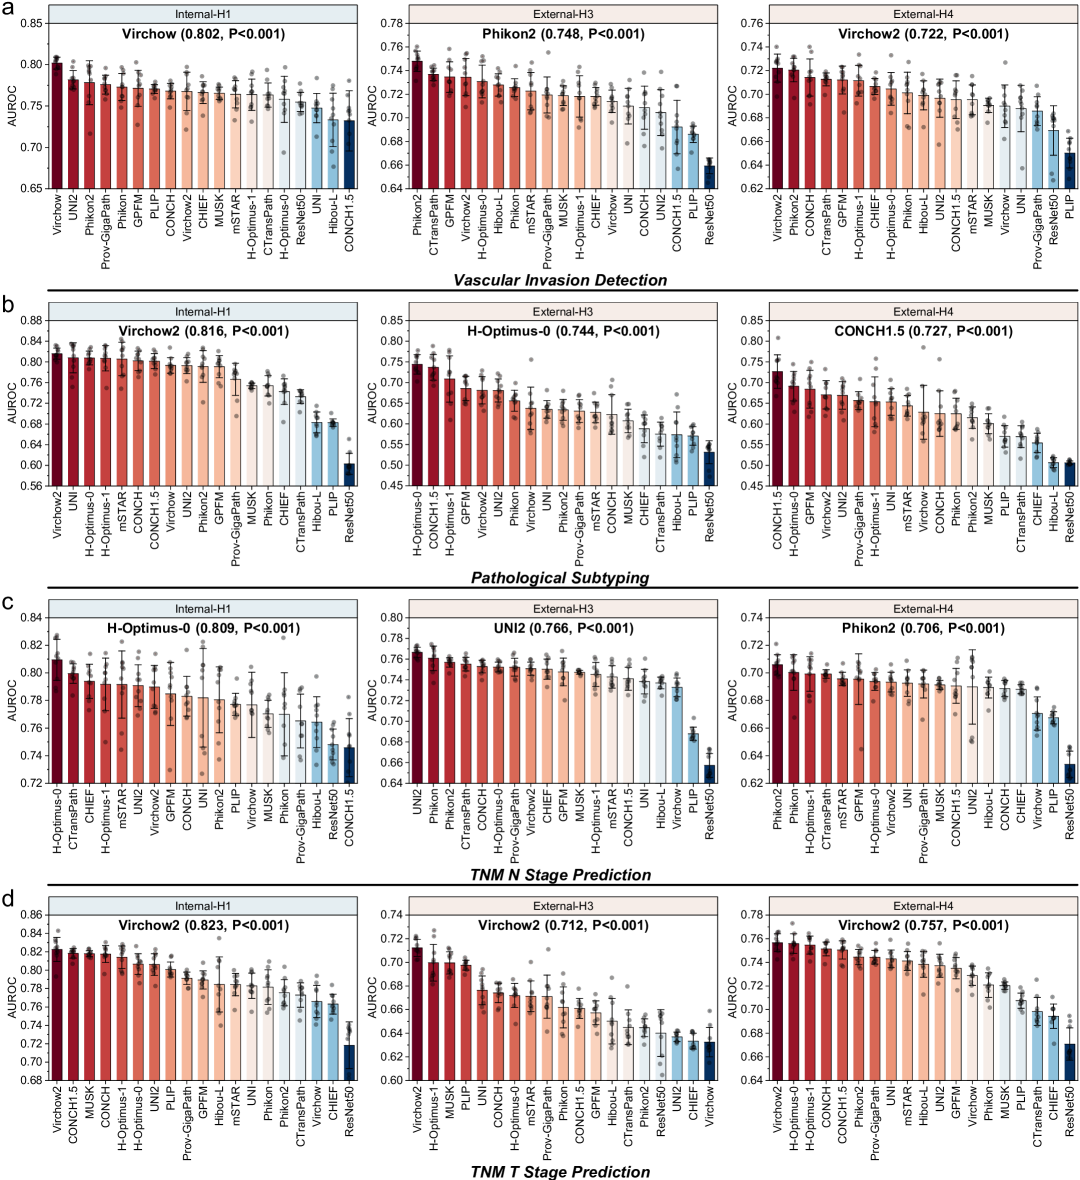
In molecular classification tasks, H-Optimus-1 achieves the highest performance on the internal cohort, with an AUC of 0.938. Conversely, Virchow2 excels in the external cohort, recording an AUC of 0.8202 (Figure 3c). For diagnostic tasks, we evaluated the performance of foundation models on the TNM N staging task. Results indicate that Virchow2 leads with an accuracy of 0.7949 on the internal cohort, while UNI performs best on the external cohort (Figure 3d). These findings suggest that predicting TNM N stage from WSIs remains challenging. Additionally, in the pTNM staging task, the top-performing model, CTransPath, achieves an AUC of only 0.6142, indicating further complexity (Figure 4f). We also assessed these models across five molecular subtyping tasks: AR, ER, PR, HER2, and CK5. These tasks present significant challenges, with no single method consistently outperforming the others. GPFM, H-Optimus-1, MUSK, H-Optimus-0, and UNI2 achieved the highest performance on AR, ER, PR, HER2, and CK5, with AUCs of 0.7447, 0.9185, 0.8944, 0.8454, and 0.8481, respectively (Figure 4a-e). Furthermore, we examined the models’ performance in prognosis tasks. CTransPath and UNI2 achieved the best results for overall survival and disease-free survival analysis, with C-Index of 0.6809 and 0.6697, respectively (Figures 3a-b).
In summary, no single model dominated all tasks in the breast cancer dataset, indicating significant opportunities for improvement in foundation models applied to breast cancer data.
Gastric Cancer
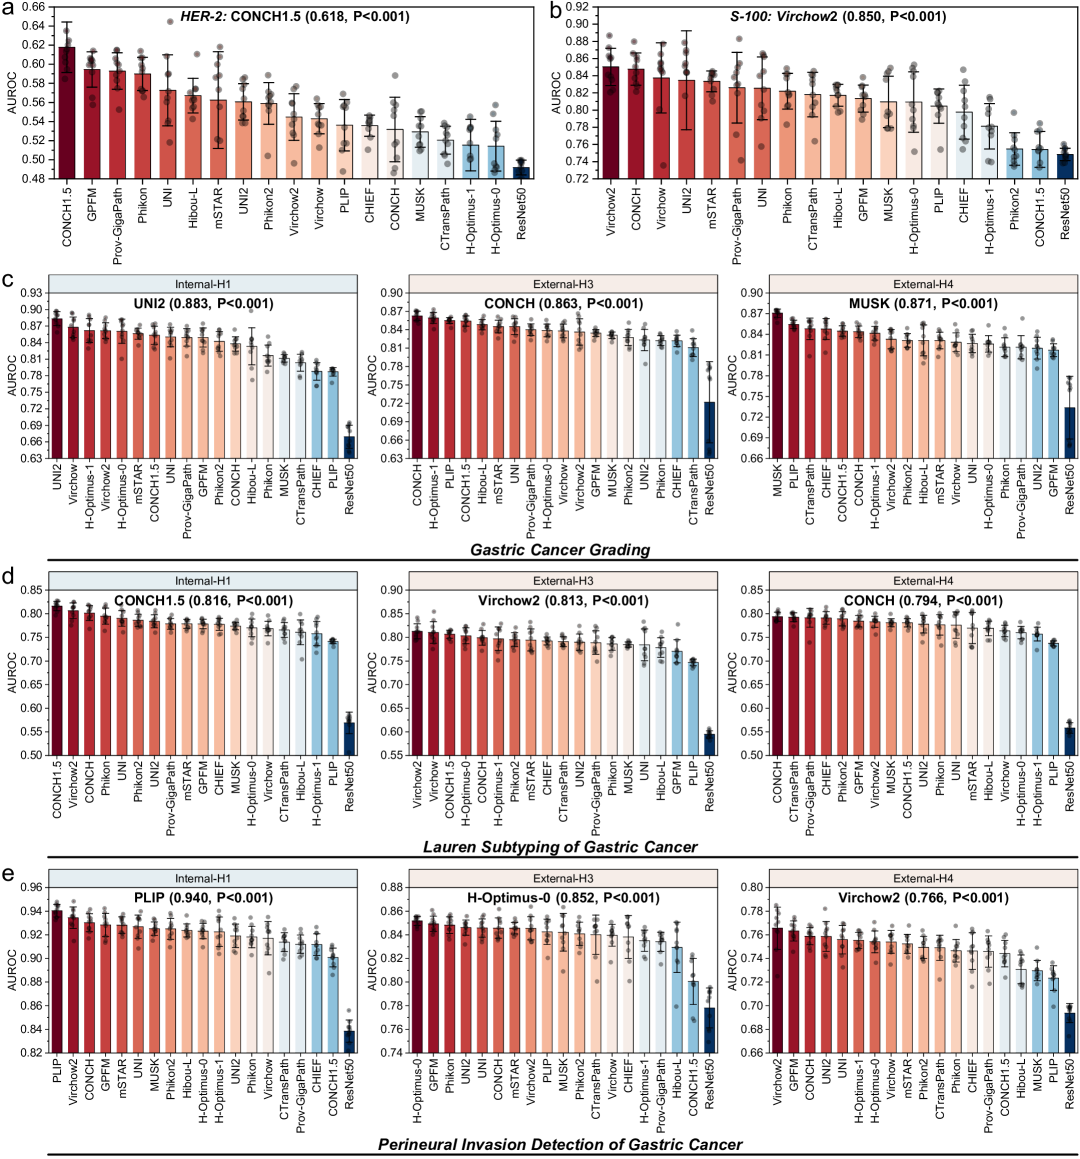
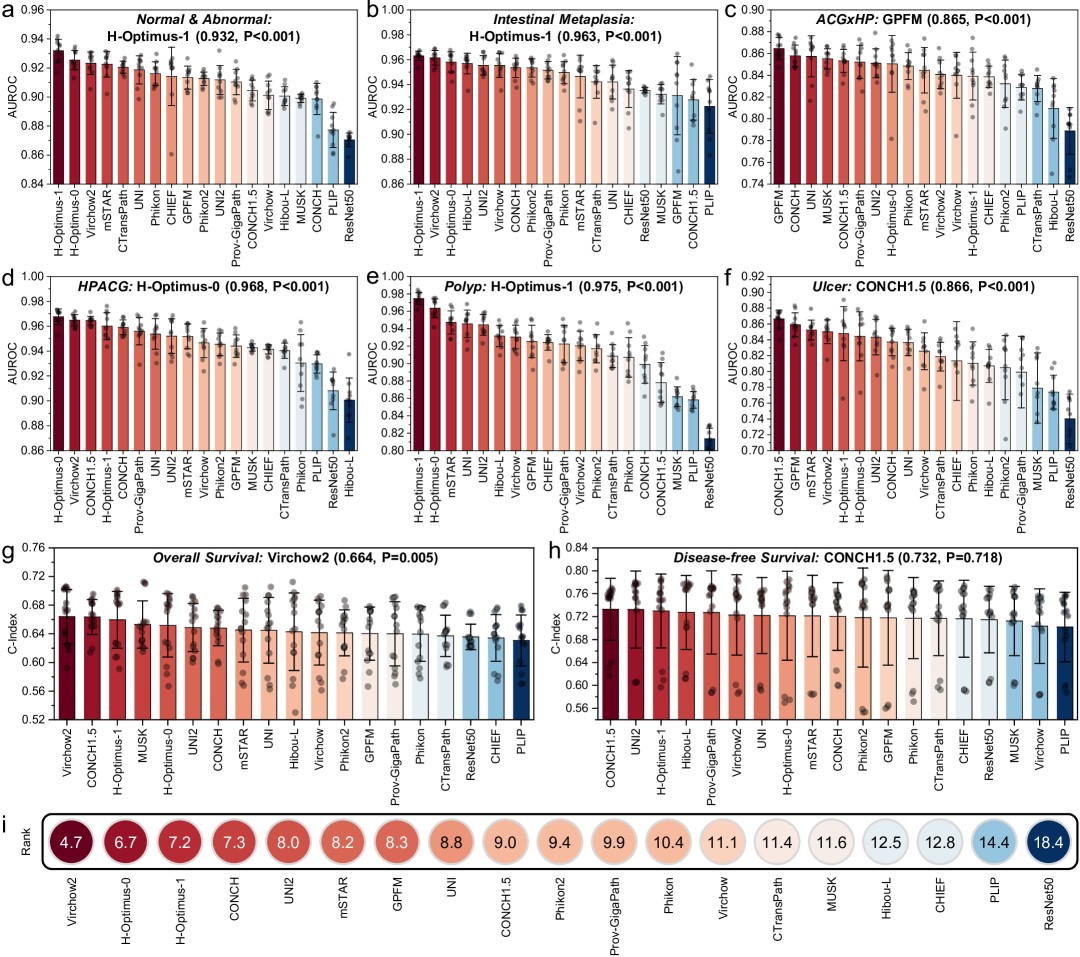
To evaluate the performance of foundation models on gastric cancer, we collected 3,684 WSIs from 2,328 patients across four hospitals, covering 31 tasks. Overall, Virchow2 achieved the best performance, with an average ranking score of 4.7, followed by H-Optimus-0 at 6.7 (Figure 7i). We first assessed the models on pathological subtyping, Lauren subtyping, and gastric grade assessment tasks. Virchow2, CONCH1.5, and UNI2 demonstrated the highest performance with AUCs of 0.8159 (Figure 6b), 0.8161 (Figure 5d), and 0.8834 (Figure 5c) on the internal cohort, respectively. Notably, vision-language models generally exhibited better generalizability on these tasks. In addition, we evaluated the perineural and vascular invasion detection tasks. Virchow2 and Phikon2 showed the best average performance on both internal and external datasets. However, all models performed poorly on the external dataset for the perineural invasion task (Figure 5e). The vascular invasion detection task proved even more challenging, with no model achieving an AUC above 0.81 on both internal and external cohorts (Figure 6a). We further investigated the TNM staging tasks, specifically for N stage and T stage prediction. For the T stage, Virchow2 consistently performed best on the internal cohort (AUC of 0.8226) and two external cohorts (AUCs of 0.7122 and 0.7566) (Figure 6d). For the N stage, H-Optimus, UNI2, and Phikon2 achieved the best performances on the internal and external cohorts H3 and H4, with AUCs of 0.8095, 0.7665, and 0.7095, respectively (Figure 6c). We also evaluated molecular subtyping tasks, where Virchow2 performed best on the S-100 marker with an AUC of 0.8502. Predicting the HER-2 biomarker was more challenging, with the best-performing model, CONCH1.5, achieving only an AUC of 0.6179. Additionally, we assessed the models on prognosis tasks. Virchow2 and CONCH1.5 achieved the best performance in overall survival analysis and disease-free survival analysis, with C-Indexes of 0.664 and 0.7329, respectively (Figures 7g-h).
Finally, we explored performance on gastric biopsy WSIs. H-Optimus-1 excelled in abnormal slide classification, intestinal metaplasia detection, and polyp detection, achieving AUCs of 0.9319, 0.9631, and 0.9746 respectively(Figure 7a, 7b and 7e). For the Helicobacter pylori-associated chronic gastritis task, H-Optimus performed best with an AUC of 0.9676 (Figure 7d). In the autoimmune chronic gastritis with Helicobacter pylori task, GPFM achieved the best performance with an AUC of 0.8645 (Figure 7c). For ulcer detection, CONCH1.5 was the top model (Figure 7f). Overall, H-Optimus-1 is the best choice for further research and applications in biopsy data.
Colorectal Cancer
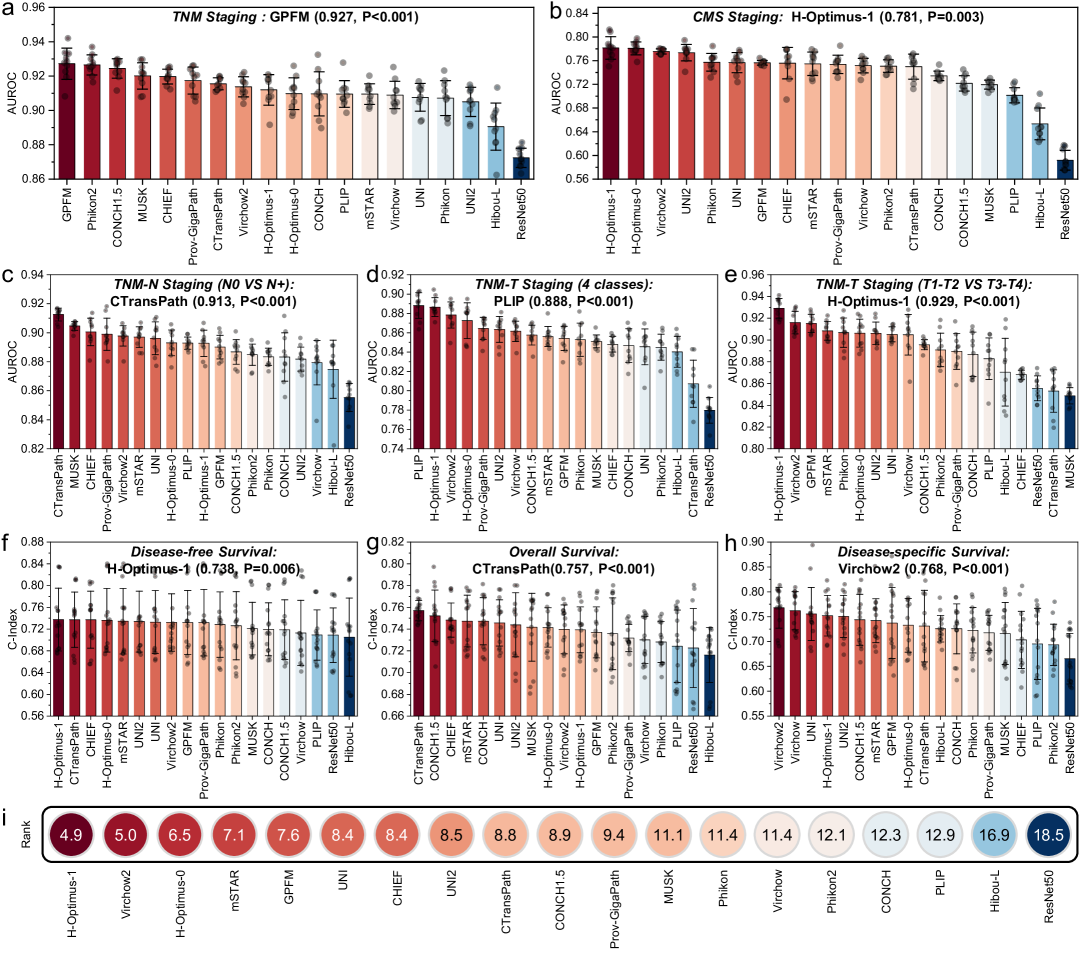
To evaluate foundation model on the colorectal cancer data, we collected 3,080 WSIs from 916 patients. Overall, H-optimus-1 achieved the best performance with an average ranking score of 4.9, while Virchow2 ranked second with a score of 5.0 (Figure 8i). We assessed these models on staging tasks, including TNM staging, further N staging, and T staging (both coarse-level and fine-level). No single model consistently outperformed the others across these four tasks (Figure 8a, 8c-e). Specifically, GPFM performed best on the TNM staging task with an AUC of 0.9272. For the further N staging task, CTransPath achieved the highest performance with an AUC of 0.9126. In the T staging task, H-optimus-1 excelled in coarse-level classification (2 classes) with an AUC of 0.9291, while PLIP attained the best performance with an AUC of 0.881 in fine-level classification (4 classes). Additionally, we evaluated the models on consensus molecular subtyping based on WSIs. The best-performing model, H-optimus-1, achieved an AUC of only 0.7814, indicating that consensus molecular subtyping is a more challenging task (Figure 8b). We also reported the performance of foundation models on survival prognosis tasks, including overall survival (OS), disease-free survival (DFS), and disease-specific survival (DSS). Similarly, no model outperformed the others across all survival prognosis tasks (Figure 8f-h). CTransPath, H-optimus-1, and Virchow2 excelled in OS, DFS, and DSS, with C-Index values of 0.7570, 0.7375, and 0.7678, respectively. Overall, there is still room for improvement in the foundation models for colorectal cancer.
Brain Cancer
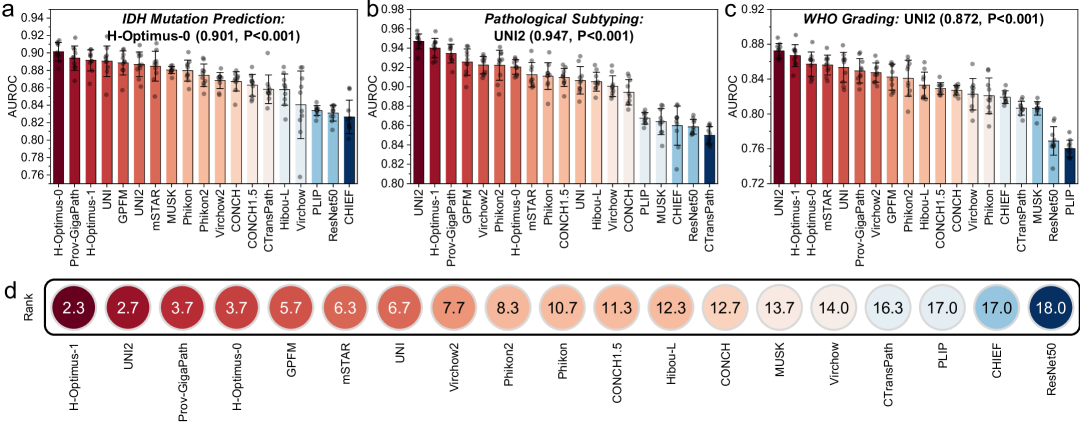
We investigated foundation models on brain cancer data, focusing on IDH mutation prediction, pathological subtyping, and WHO grading tasks. To achieve this, we collected 1,362 slides from 677 patients. Overall, H-optimus-1 demonstrated the best performance with an average ranking score of 2.3, followed by UNI2 with a score of 2.7 (Figure 9d). Specifically, H-optimus-1 excelled in the IDH mutation prediction task, achieving an AUC of 0.9013 (Figure 9a). In the pathological subtyping and WHO grading tasks, UNI2 outperformed with AUCs of 0.9469 and 0.8724, respectively (Figures 9b-c). Currently, both H-optimus-1 and UNI2 are strong performers in brain cancer analysis.
Discussion
The comprehensive evaluation through PathBench reveals several critical insights into the current state and future directions of pathology foundation models (PFMs) in computational pathology. Our benchmark demonstrates that while PFMs achieve remarkable performance across diverse diagnostic and prognostic tasks, their clinical applicability remains organ-specific and task-dependent. The observed performance variability across cancer types—with Virchow2 dominating gastric and breast cancer tasks, while H-Optimus-1 excels in lung and colorectal cancer. We highlight the following key findings. First, there is still significant room for improvement in vision-language models across most clinical tasks. For example, the best performed vision-language model CONCH1.5 ranks 8 among all 19 models. Second, the consistent performance gap between internal and external validation cohorts underscores the importance of rigorous, leakage-free evaluation, as implemented in PathBench, prior to clinical deployment. The results highlight the importance of improving the generalization ability of both the feature extractor and the aggregator. Third, it is worth noting that simply increasing the number of whole slide images and the parameters of the model remains effective, as evidenced by the top two models (both trained on >1 million WSIs).. In addition, The strong performance of mSTAR—trained solely on TCGA data yet outperforming vision models trained on larger datasets—suggests that integrating multimodal knowledge can compensate for limited data.
Our study has several limitations. While PathBench covers five major cancers, it does not yet address rare malignancies or pediatric tumors. Additionally, the interpretability of PFM decisions—a crucial factor for clinical adoption—remains unassessed. Future iterations of PathBench will incorporate explainability metrics and expand to include more cancer types through international collaborations.
The PathBench framework establishes a critical foundation for translating PFMs into clinical practice. By maintaining a dynamic leader board with automated evaluation pipelines, we enable continuous benchmarking against evolving clinical standards. This approach addresses a key limitation of static benchmarks in fast-moving AI fields, while our leakage prevention protocols mitigate inflated performance claims. Moving forward, integration with real-world evidence platforms and prospective validation in diagnostic workflows will be essential to realizing the full potential of PFMs in precision oncology.
Materials and Methods
1. Dataset
Lung Cancer
(1) Primary Adenocarcinoma and Metastatic Cancer Classification
Distinguishing
primary lung adenocarcinoma from metastatic carcinoma is critical for determining
appropriate treatment strategies. To evaluate the performance of existing
foundation models on this classification task, we collected a dataset of 846
cases from Hospital H1, comprising 389 primary cancers (686 WSIs) and 457
metastatic cancers (736 WSIs). The data were label-stratified into training,
validation, and test sets at a 7:1:2 ratio. To further validate model
robustness, we incorporated two independent external cohorts:
-
•
Hospital H5 cohort: 237 primary cases (237 WSIs) and 256 metastatic cases (256 WSIs).
-
•
Hospital H6 cohort: 465 primary cases (744 WSIs) and 361 metastatic cases (678 WSIs).
(2) Primary Site Prediction of Metastatic Lung Cancer
For
metastatic carcinomas, we curated an additional dataset from Hospital H1 to predict
the primary tumor origin. This dataset comprised six primary sites: lung (393
cases, 690 WSIs), colorectal (186 cases, 314 WSIs), kidney (25 cases, 36 WSIs), breast
(55 cases, 80 WSIs), and liver (34 cases, 63 WSIs), with a 7:1:2 training-validation-test
split. It is worth noting that the lung site only contains lung
adenocarcinoma cases. Additionaly, we also collected data from Hospital H5
and H6 for the external validation as follows:
-
•
Hospital H5: Lung (237 cases, 237 WSIs), breast (50 cases, 50 WSIs), colorectal (96 cases, 96 WSIs), kidney (30 cases, 30 WSIs), and liver (10 cases, 10 WSIs).
-
•
Hospital H6: Lung (273 cases, 487 WSIs), colorectal (141 cases, 279 WSIs), kidney (43 cases, 87 WSIs), breast (63 cases, 104 WSIs), and liver (5 cases, 10 WSIs).
(3) Biomarker Prediction of Lung Cancer
Accurate prediction of
biomarkers based on H&E slides can help pathologists have a overall
understanding of the tumor microenvironment and guide treatment decisions. To
evaluate the performance of foundation models on biomarker prediction, we
curated data from hospital H1 to perform the prediction of 4 biomarkers: C-MET,
CK7, TTF-1, and Napsin A. The label is derived from the corresponding immunohistochemistry
(IHC) results. The details of the dataset are as follows:
-
•
C-MET: 195 C-MET negative slides, and 235 C-MET positive slides.
-
•
CK7: 248 CK7 negative slides, and 171 CK7 positive slides.
-
•
TTF-1: 369 TTF-1 negative slides, and 148 TTF-1 positive slides.
-
•
Napsin A: 263 Napsin A negative slides, and 92 Napsin A positive slides.
The data were label-stratified into training, validation, and test sets at a 7:1:2 ratio.
Breast Cancer
(1) TNM-N Staging of Breast Cancer
Accurate lymph node staging (N
stage) is crucial for breast cancer prognosis and treatment planning. To evaluate
the performance of foundation models on this task, we curated a dataset from
Hospital H2 and H9, focusing on N stage classification with two distinct categories:
N0 (no regional lymph node metastasis) and N+ (presence of lymph node
metastases, including both the N1 to N3 substages). The dataset from Hospital
H2 includes 343 N0 cases (916 slides) and 125 N+ cases (381 slides). For training,
validation and testing, the data are stratified at the case level in a 7:1:2
ratio to avoid potential data leakage. In addition, we also collected data from
Hospital H9 for external validation, which includes 62 N0 cases (62 slides)
and 23 N+ cases (23 slides).
(2) pTNM Staging of Breast Cancer
Furthermore, we established a
dataset for evaluating foundation models in pTNM staging. The dataset are collected
from Hospital H2, which includes 192 stage I cases (451 slides), 232 stage II
cases (727 slides), and 43 stage III cases (116 slides). The data were case-level
label-stratified into training, validation, and test sets at a 7:1:2 ratio,
ensuring proportional representation of each stage across splits.
(3) Molecular Subtyping of Breast Cancer
Accurate molecular
subtyping of breast cancer is essential for personalized treatment
strategies and prognostic assessment. To evaluate the performance of foundation
models on this task, we curated datasets from Hospital H2 and H9. The dataset
from Hospital H2 includes 307 Luminal A cases (310 slides), 614 Luminal B1
cases (618 slides), 243 Luminal B2 cases (268 slides), 589 TNBC cases (1,932
slides), and 292 HER-2 cases (323 slides). The data were case-level label-stratified
into training, validation, and test sets at a 7:1:2 ratio. For external validation,
we also collected data from Hospital H9, which includes 102 Luminal A cases,
89 Luminal B1 cases, 24 Luminal B2 cases, 101 TNBC cases, and 102 HER-2 cases.
Each cases contains only one slide.
(4) Biomarker Prediction of Breast Cancer
Predicting biomarkers
from H&E slides can provide valuable insights and accelerate the diagnosis
of breast cancer. To evaluate the performance of foundation models on biomarker
prediction, we curated data from Hospital H2 to perform the prediction of 5
biomarkers: AR, ER, PR, HER2, and CK5. The details of the dataset are as
follows:
-
•
AR: 463 AR negative cases (731 slides), and 677 AR positive cases (841 slides).
-
•
ER: 767 ER negative cases (1,264 slides), and 781 ER positive cases (786 slides).
-
•
PR: 623 PR negative cases (1,108 slides), and 933 PR positive cases (950 slides).
-
•
HER2: 511 HER2 negative cases (743 slides), and 833 HER2 positive cases (975 slides).
-
•
CK5: 753 CK5 negative cases (859 slides), and 208 CK5 positive cases (379 slides).
The data were case-level label-stratified into training, validation, and test sets at a 7:1:2 ratio, ensuring proportional representation of each biomarker across splits.
(5) Overall Survival Analysis of Breast Cancer
Accurate
prediction of overall survival (OS) is essential for guiding treatment
decisions and prognostic stratification in breast cancer. We established a dataset
for evaluating foundation models in predicting OS outcomes. The dataset are
collected from Hospital H2 inlcuding 392 censored patients (1,089 slides) and
59 deceased patients (181 slides). The 5-fold cross-validation was performed
to evaluate the model performance. To further avoid the randomness, we also performed
3 times of 5-fold cross-validation.
(6) Disease Free Survival Analysis of Breast Cancer
Furthermore,
we established a dataset for evaluating foundation models in disease-free
survival (DFS) outcomes, where ‘recurred’ is the outcome event. The dataset are collected from Hospital H2 inlcuding
380 disease-free patients (1,066 slides) and 71 recurred patients
(204 slides). The 5-fold cross-validation was performed to evaluate the
model performance. To further avoid the randomness, we also performed 3
times of 5-fold cross-validation.
Gastric Cancer
(1) Normal Gastric Biopsy Tissue and Abnormal tissue Classification
Distinguishing normal gastric bioposy tissue including chronic gastritis
without Helicobacter pylori infection (normal/CGxHP) from abnormal tissue is
essential for guiding clinical management and treatment decisions. To assess
the performance of computational pathology foundation models on this diagnostic
task, we compiled a dataset of 2,700 gastric biopsy slides from Hospital H7,
comprising 733 normal/CGxHP slides and 1,967 abnormal slides. The data were
label-stratified into training, validation, and test sets at a 7:1:2 ratio.
(2) Subtyping of Abnormal Gastric Biopsy Tissues
For the abnormal
gastric tissues, we further constructed a more practical multi-label classification
task to evaluate the foundation models. The abnormal tissues from Hospital
H7 contains 4 classes, including Helicobacter pylori-associated chronic gastritis
(HPACG, 223 slides), Autoimmune chronic gastritis with Helicobacter pylori (ACGxHP,
185 slides), Gastric polyps (144 slides), and Gastric ulcers (111 slides). Since
one slide may correspond to multiple labels, we perform binary
classification for each class. These slides were stratified by pathological labels
into training (70%), validation (10%), and test sets (20%).
(3) Binary Classification of Gastric Intestinal Metaplasia
Detecting intestinal metaplasia (IM) from non-IM gastric biopsy tissue is
critical for early detection of precancerous lesions and risk stratification
in gastric cancer screening. To evaluate the performance of foundation models
on this diagnostic task, we curated a dataset of 2,700 gastric biopsy slides
from Hospital H7, comprising 2,430 non-IM slides and 270 IM slides. The data
were label-stratified into training, validation, and test sets at a 7:1:2
ratio, ensuring proportional representation of IM cases across splits.
(4) Histopathological Grading Assesment of Gastric Cancer
Gastric cancer grading is a critical component of pathological assessment, reflecting
the degree of tumor cell differentiation and correlating with biological behavior
and prognosis. To evaluate foundation models for this task, we compiled a multi-institutional
dataset. From Hospital H1, we included 318 poorly differentiated (G3) cases (319
slides) and 81 well/moderately differentiated (G1+G2) cases (82 slides),
with a 7:1:2 ratio split for training, validation, and testing. Additionally,
we incorporated two additional cohorts for external validation: Hospital H3 contributed
190 G3 cases and 55 G1+G2 cases, while Hospital H4 provided 258 G3 cases and
62 G1+G2 cases.
(5) HER2 Status Prediction of Gastric Cancer
Accurate HER2 status
prediction is critical for guiding targeted therapy decisions in gastric
cancer. To evaluate foundation models for this task, we compiled a multi-center
dataset of 675 H&E-stained slides from Hospitals H1, H3, and H4, with HER2 labels
derived from corresponding Immunohistochemistry (IHC) results. The dataset
includes 549 negative cases (IHC 0/1+) and 126 non-negative cases (IHC 2+/3+).
Data were stratified into training (70%), validation (10%), and test sets
(20%) while preserving the original class distribution.
(6) S-100 Protein Expression Prediction of Gastric Cancer
S-100 protein
expression in gastric cancer has been associated with tumor differentiation,
neuroendocrine differentiation, and potential prognostic implications. To
evaluate the ability of computational pathology models in predicting S-100
status from H&E-stained slides, we compiled an multi-center dataset from Hospital
H1 and H3. The dataset contains 90 IHC 0 slides and 270 IHC 1+ slides. The
dataset were label-stratified into training, validation, and testing sets at
a ratio of 7:1:2.
(7) Lauren classification of Gastric Cancer
The Lauren classification
system is pivotal in gastric cancer prognostication and therapeutic decision-making,
categorizing tumors into distinct histomorphological subtypes with differing
biological behaviors. To evaluate foundation models for this critical task,
we constructed a multi-center dataset encompassing three Lauren subtypes: Diffuse
type, Intestinal type, and Mixed type. For the internal cohort, the dataset comprised
388 cases from Hospital H1 including 159 diffuse cases (160 slides), 102
intestinal cases (103 slides), and 127 mixed cases (127 slides). All data
were label-stratified into training (70%), validation (10%), and test sets
(20%), with subtype proportions preserved across splits. To ensure generalizability,
two independent external datasets were included:
-
•
Hospital H3: 141 slides (77 Diffuse, 33 Mixed, 31 Intestinal)
-
•
Hospital H4: 319 slides (143 Diffuse, 86 Mixed, 90 Intestinal)
(8) Pathological Subtyping of Gastric Cancer
Accurate
classification of gastric cancer pathological subtypes is essential for
prognostic stratification and therapeutic planning. To evaluate foundation models
on this task, we curated a dataset from Hospital H1 including 163 Signet
Ring Cell Carcinoma (163 slides), 166 Tubular Adenocarcinoma (167 slides),
and 66 non-specified Stomach Adenocarcinoma (67 slides). The internal data were
stratified into training (70%), validation (10%), and test sets (20%)
while preserving subtype proportions. Additionally, to assess model
generalizability, we also adopted data from Hospital H3 and H4 as the external
validation.
-
•
Hospital H3: 233 Stomach Adenocarcinoma, 82 Signet Ring Cell
-
•
Hospital H4: 195 Stomach Adenocarcinoma, 59 Signet Ring Cell
(9) Detection of Perineural Invasion in Gastric Cancer
Perineural
invasion (PNI) is an important prognostic factor in gastric cancer associated
with increased recurrence risk and poor survival outcomes. To evaluate
foundation models for this critical histopathological feature, we compiled a
dataset with standardized PNI assessment from Hospital H1, consisting of 255
PNI-positive cases (256 slides) and 141 PNI-negative cases (142 slides). The
internal data were stratified into training (70%), validation (10%), and test
sets (20%) while maintaining the original PNI positivity rate. we also included
two independent cohort from Hospital H3 and H4 as the external validation as
follows:
-
•
Hospital H3: 156 PNI-positive slides and 76 PNI-negative slides
-
•
Hospital H4: 112 PNI-positive slides and 207 PNI-negative slides
(10) Detection of Vascular Invasion in Gastric Cancer
Vascular invasion
(VI) is a critical histopathological feature in gastric cancer that correlates
with hematogenous metastasis risk and guides adjuvant therapy decisions. To
assess foundation models for VI identification, we established a dataset with
balanced representation of positive and negative cases from Hospital H1. The
internal cohort contained 197 VI-positive cases (198 slides) and 198 VI-negative
cases (199 slides). To validate the robustness of evaluted models, we
included another two cohort from Hospital H3 and H4 as the external
validation as follows:
-
•
Hospital H3: 90 VI-negative and 140 VI-positive slides
-
•
Hospital H4: 197 VI-negative and 122 VI-positive slides
The internal data were stratified into training (70%), validation (10%), and test sets (20%) while preserving the balanced class distribution.
(11) N Staging Classification in Gastric Cancer
Accurate nodal
status (N stage) determination is crucial for gastric cancer prognosis and
treatment planning. We developed a clinically relevant binary classification
task distinguishing node-negative (N0) from node-positive (N+, encompassing
N1-N3) cases to evaluate foundation models’ performance in this critical
diagnostic task. The internal dataset comprised 212 N+ cases (212 slides)
and 186 N0 cases (188 slides). For the external validation, we include two
cohorts from Hospital H3 and H4 as follows:
-
•
Hospital H3: 175 N+ slides and 85 N0 slides
-
•
Hospital H4: 175 N+ slides and 145 N0 slides
All internal data were stratified into training (70%), validation (10%), and test sets (20%) while preserving the original N0/N+ ratio.
(12) T Staging Classification in Gastric Cancer
Precise
assessment of tumor invasion depth (T stage) is fundamental for gastric
cancer treatment stratification and surgical planning. We evaluated foundation
models on this critical four-class classification task (T1-T4) using a multi-institutional
dataset. The internal dataset was collected from Hospital H1 comprising 115
T1 slides (115 cases), 55 T2 slides (54 cases), 121 T3 slides (121 cases), and
107 T4 slides (106 cases). To assess generalizability across different
hospitals, we collected two cohorts from Hospital H3 and H4 for external validation
as follows:
-
•
Hospital H3: 260 slides (33 T1, 35 T2, 75 T3, 117 T4)
-
•
Hospital H4: 320 slides (64 T1, 46 T2, 125 T3, 85 T4)
All internal data were stratified into training (70%), validation (10%), and test sets (20%) while preserving T-stage proportions.
(13) Disease Free Survival Analysis of Gastric Cancer
Prognostic prediction
of disease recurrence is crucial for postoperative surveillance and adjuvant
therapy planning in gastric cancer. We established a dataset for evaluating
foundation models in predicting disease-free survival (DFS) outcomes based
on WSIs. The dataset are collected from Hospital H3 comprising 260 slides from
260 cases: 157 disease-free patients and 103 recurred
patients. The 5-fold cross-validation was performed to evaluate the model performance.
To further avoid the randomness, we also performed 3 times of 5-fold cross-validation.
(14) Overall Survival Analysis of Gastric Cancer
Accurate prediction
of overall survival (OS) is essential for guiding treatment decisions and prognostic
stratification in gastric cancer. We established a dataset for evaluating
foundation models in predicting OS outcomes. The dataset are collected from Hospital
H3 comprising 260 slides from 260 cases: 172 censored
patients and 88 uncensored patients. The 5-fold cross-validation was performed
to evaluate the model performance. To further avoid the randomness, we also performed
3 times of 5-fold cross-validation.
Colorectal Cancer
(1) Lymph Node Staging (N Stage) in Colorectal Cancer
Lymph node metastasis
in colorectal cancer, a critical component of TNM staging that significantly
impacts treatment planning and outcome prediction. To evaluate the performance
of foundation models in this task, we curated a data set from Hospital H8, focusing
specifically on N-stage classification with two distinct categories: N0 (no regional
lymph node metastasis) and N+ (presence of lymph node metastases, including both
the N1 and N2 substages). The collection comprises 367 N0 cases (1,848
slides) and 230 N+ cases (871 slides). For training, validation and testing,
the data are stratified at the case level in a 7:1:2 ratio to avoid potential
data leakage.
(2) Tumor Invasion Depth (T Stage) in Colorectal Cancer (2 classes)
Tumor
invasion depth (T stage) is a key determinant in colorectal cancer prognosis and treatment
strategy, distinguishing between early-stage (T1+T2) and advanced local
invasion (T3+T4). To assess foundation models’ capability in this diagnostic
task, we compiled the a dataset from Hospital H8, grouping cases into two
clinically relevant categories: T1+T2 (tumor confined to bowel wall) and T3+T4
(tumor extending beyond muscularis propria). It contains 519 T3+T4 cases (2,391
slides) and 76 T1+T2 cases (319 slides). The data is rigorously case-level split
into training (70%), validation (10%), and test sets (20%) to ensure
clinically meaningful evaluation.
(3) Tumor Invasion Depth (T Stage) in Colorectal Cancer (4 classes) To further challenge the models’ discriminative capabilities, we extended the task to fine-grained T-stage prediction (T1, T2, T3, T4). This 4-class classification problem reflects the full spectrum of tumor invasion depth, demanding higher precision from the models. The dataset includes 595 cases (2,710 slides) with the following distribution: 20 T1 (71 slides), 26 T2 (244 slides), 440 T3 (2,130 slides), and 79 T4 (261 slides). Consistent with the 2-class task, we applied a case-level split (training:validation:testing = 7:1:2) to maintain evaluation integrity and prevent data leakage.
(4) TNM Staging of Colorectal Cancer
Accurate TNM staging is fundamental
for colorectal cancer management, directly guiding therapeutic decisions and
prognostic evaluation. To evaluate foundation models in this task, we
curated a dataset from Hospital H8 including 63 stage I cases (263 slides), 288
stage II cases (1535 slides), 135 stage III cases (633 slides), and 120 stage
IV cases (120 slides). The data were case-level stratified into training, validation,
and testing at a ratio of 7:1:2.
(5) Consensus Molecular Subtyping in Colorectal Cancer
Consensus molecular
subtyping in colorectal cancer is crucial for precision oncology and treatment stratification.
To evalute the performance of foundation models in this task, we curated a dataset
from Hospital H8 containing 588 molecularly-characterized cases classified into
four Consensus Molecular Subtypes (CMS): 76 CMS1 (372 slides), 239 CMS2 (1061
slides), 86 CMS3 (393 slides), and 187 CMS4 (857 slides). For training, validation,
and testing, the data were case-level stratified at a ratio of 7:1:2.
(6) Disease Free Survival Analysis of Colorectal Cancer
Accurate
prediction of disease-free survival (DFS) is crucial for postoperative
surveillance and adjuvant therapy planning in colorectal cancer. We established a
dataset for evaluating foundation models in predicting DFS outcomes based on
WSIs. The dataset are collected from Hospital H8 comprising 2,779 slides
from 608 cases. It contains 389 disease-free patients (1,874 slides) and 219
recurred/progressed patients (904 slides). The 5-fold cross-validation was
performed to evaluate the model performance. To further avoid the randomness,
we also performed 3 times of 5-fold cross-validation.
(7) Disease Specific Survival Analysis of Colorectal Cancer
We further
established a dataset for evaluating foundation models in disease-specific
survival (DSS) outcomes based on WSIs. The dataset are collected from Hospital
H1 inlcuding 294 patients (301 slides). It contains 252 living, or dead but tumor-free patients (259 slides) and 42 dead patients with tumor (42 slides). The 5-fold
cross-validation was performed to evaluate the model performance. To further
avoid the randomness, we also performed 3 times of 5-fold cross-validation.
(8) Overall Survival Analysis of Colorectal Cancer
Finally, we
established a dataset for evaluating foundation models in overall survival (OS)
outcomes based on WSIs. The dataset are collected from Hospital H8 inlcuding
608 patients (2,779 slides). It contains 440 living patients (2,081 slides)
and 168 deceased patients (698 slides). The 5-fold cross-validation was performed
to evaluate the model performance. To further avoid the randomness, we also performed
3 times of 5-fold cross-validation.
Brain Cancer
(1) Histopathological Subtyping of Glioma Accurate classification of glioma subtypes is critical for precise diagnosis and treatment planning in neuro-oncology. To evaluate the performance of computational pathology models on this task, we constructed a dataset comprising 1,353 WSIs from 673 cases collected at Hospital H1. The dataset includes four major glioma subtypes: 274 Glioblastoma cases (558 slides), 231 Diffuse astrocytoma cases (450 slides), 132 Oligodendroglioma (269 slides), and 36 Diffuse midline glioma (76 slides). The data were label-stratified into training (70%), validation (10%), and test sets (20%).
(2) WHO Grading of Glioma This task is designed for automated WHO grading of gliomas, a critical determinant of clinical management and prognosis in neuropathology. This dataset comprises 1,350 WSIs from 672 cases collected at Hospital H1, covering three WHO grades: 310 Grade 4 cases (634 slides), 117 Grade 3 cases (234 slides), and 245 Grade 2 cases (482 slides). The dataset is lebel-stratified into training, validation, and testing at a ratio of 7:1:2.
(3) IDH Mutation Prediction of Glioma Isocitrate dehydrogenase (IDH) mutation is a critical molecular marker with diagnostic, prognostic, and therapeutic implications in glioma management. To evaluate the potential of pathology foundation models in predicting mutation status from histopathological WSIs, we constructed a dataset comprising 1,341 slides from 667 cases collected from Hospital H1, categorized into two classes: 275 IDH-mutant cases (562 slides) and 392 IDH-wildtype cases (779 slides). The data is label stratified into a training, validation, and test sets at a ratio of 7:1:2.
2. Model
| PFM | #Slides | #Patches | Params. | Architecture | Pretraining Strategy | Pretraining Data Source | Stain | Released Date | Publication |
| Vision-only | |||||||||
| ResNet50 [25] | - | - | 8.5M | ResNet-50 | Supervised Learning | ImageNet-1K | - | Jun-16 | CVPR |
| CtransPath [26] | 32,220 | 15.6M | 27.8M | Swin-T/14 | MoCov3 | TCGA, PAIP | H&E | Jul-22 | MedIA |
| Phikon [27] | 6,093 | 43.4M | 86.4M | ViT-B/16 | iBOT | TCGA | H&E | 26-Jul-23 | Preprint |
| UNI [28] | 100,426 | 100M | 303M | ViT-L/16 | DINOv2 | GTEx, In-house | H&E | 29-Aug-23 | NM |
| Virchow [29] | 1,488,550 | 2.0B | 631M | ViT-H/14 | DINOv2 | In-house | H&E | 14-Sep-23 | NM |
| Prov-GigaPath [30] | 171K | 1.4B | 1.1B | ViT-G/14 | DINOv2, MIM | In-house | H&E, IHC | 22-May-24 | Nature |
| Hibou-L [31] | 1.1M | 1.2B | 304M | ViT-L/14 | DINOv2 | - | H&E, others | 7-Jun-24 | Preprint |
| GPFM [32] | 72,280 | 190M | 303M | ViT-L/14 | Custom | 33 Public datasets | H&E | 26-Jul-24 | NBME |
| Virchow2 [33] | 3,134,922 | 2.0B | 631M | ViT-H/14 | DINOv2 | In-house | H&E, IHC | 1-Aug-24 | Preprint |
| H-Optimus-0 [34] | 500K | - | 1.1B | ViT-G/14 | iBOT, DINOv2 | - | - | 8-Aug-24 | - |
| Phikon2 [35] | 58,359 | 456M | 303M | ViT-L/16 | DINOv2 | 132 Public datasets | H&E, IHC | 13-Sep-24 | Preprint |
| UNI2 [28] | 350K | 200M | 681M | ViT-H/14 | DINOv2 | GTEx, In-house | H&E, IHC | 14-Jan-25 | NM |
| H-Optimus-1 [36] | 1M | 2.0B | 1.1B | ViT-G/14 | - | - | - | 1-Feb-25 | - |
| Vision-Language | |||||||||
| PLIP [37] | - | 208K | 87.9M | ViT-B/32 | CLIP | Tweets, Replies, LAION-5B | H&E, IHC | 17-Aug-23 | NM |
| CONCH [38] | 21,442 | 1.17M | 90.4M | ViT/B-16 | iBOT, CoCa | PubMed, EDU, In-house | H&E, IHC | 24-Jul-23 | NM |
| CHIEF [39] | 60,530 | - | 27.8M | Swin-T/14 | CLIP | 8 public datasets, 6 in-house datasets | H&E | 4-Sep-24 | Nature |
| CONCH1.5 [38] | - | 1.26M | 306M | ViT-L/16 | CoCa | - | H&E, IHC | Nov-24 | - |
| MUSK [40] | 33K | 1M | 675M | ViT-L/16 | BEiT3 | PubMed, TCGA, QUILT-1M, PathAsst | H&E | 8-Jan-25 | Nature |
| Multimodal-enhanced | |||||||||
| mSTAR [41] | 22,127 | 116M | 303M | ViT-L/16 | Custom | TCGA | H&E | 22-Jul-24 | Preprint |
PathBench seeks to create a dynamically updatable evaluation platform for ongoing validation. As of March 2025, we have included 19 pathology foundation models that have publicly released their model weights, which can be categorized into three types: 1) Vision-only models, which are pretrained on pathological images only, 2) Vision-Language models, which leverage the paired data of pathological images and textual descriptions for pretraining, and 3) Multimodal models, which are enhanced by extra pathology-related modalities data. The details of PFMs information are summarized in Table 1. Notably, we will continuously update the benchmark by incorporating additional PFMs once their weights are publicly released.
(1) Vision-only PFM. Prior to the era of foundation models, ResNet50 [25] pretrained on ImageNet was widely applied in the computational pathology community. Therefore, we include it as a baseline for validation. As a pioneering model in this field, CTransPath [26] first leveraged the MoCo-v3 [42] strategy for pre-training on over 30K publicly available H&E slides. Building upon the iBOT framework, Phikon [27] empirically validated Vision Transformer’s [43] (ViT) ability to derive pan-cancer representation learning. As a groundbreaking work, UNI [28] introduced the first model pre-trained on over 100,000 WSIs using DINOv2 framework [44]. Additionally, it brought the issue of data contamination to the forefront, and established a robust evaluation benchmark across 34 representative pathological tasks to mitigate contamination risks. Recently, both Phikon and UNI have introduced their advanced versions, Phikon2 [35] and UNI2, by enlarging the pretraining data scale and IHC staining data. Virchow [29] first scaled pretraining data to the million-level while expanding the model architecture to ViT-H/14. Furthermore, Virchow2 pushed the boundary of PFM again by extending the pretraining data to over 3 million slides, resulting in the largest model in this field with 1.9B parameters (ViT-G/14). With the remarkable success of the DINOv2 framework in CPath community, Hibou-L [31], H-Optimus-0 and H-Optimus-1 have consistently employed this architecture on over 1 million slides. Building upon these powerful PFMs, GPFM [32] incorporates the strengths of diverse PFMs by distilling their knowledge into a generalizable pathology foundation model. Beyond patch extractors pretraining, Prov-GigaPath first broadened the scope of modelling into whole slides.
(2) Vision-Language PFMs. As the seminal vision-language foundation model in pathology, PLIP [37] leveraged extensive pathological image-text pairs collected from Twitter, replies and LAION-5B [45] to pretrain a model based on CLIP [46] framework. CONCH [38] crawled a substantial collection of image-text pairs from high-quality PubMed and educational sources, while additionally incorporating proprietary in-house datasets comprising paired pathology reports and electronic medical records for pretraining based on CoCa [47] framework. Recently, CONCH has released the advanced version, CONCH1.5, with more pretraining data and a larger model. CHIEF designed a CLIP-like variant by leveraging the textual description of sites pretrained on over 60k slides. Furthermore, MUSK developed a multimodal transformer with unified masked modelling for vision-language modelling based on BEiT3 architecture.
(2) Multimodal PFMs. Beyond the modalities of vision and language, multimodal PFMs aim to incorporate more pathology-related modalities to enhance their capability of pathological image modelling. In this work, we involve mSTAR [41], a whole-slide PFM, enhanced by pathology reports and gene expression data. Recently, more multimodal PFMs continue to emerge, such as THREADS [48], which is boosted by genomic and transcriptomic profiles. However, due to unavailable model weights, they have not yet been included at this stage. We will maintain ongoing monitoring and will dynamically incorporate them into our updatable evaluation platform once their models are released.
3. Standardized Preprocessing
To ensure fair and reliable comparisons across heterogeneous WSI datasets, we established a standardized preprocessing pipeline addressing three key aspects: resolution variability, processing efficiency, and reproducibility. Our preprocessing approach consisted of the following steps:
-
•
Foreground extraction: We exclusively analyzed foreground tissue patches, excluding background regions. Using consistent parameters for tissue detection ensured reproducibility across datasets. For slides with faint staining that challenged automated detection, we excluded them entirely rather than relying on manual annotations, thus maintaining methodological consistency.
-
•
Patch extraction: All WSIs were processed at the base level (level 0), with patch dimensions scaled according to magnification: pixels for 40 WSIs and pixels for 80 WSIs. This configuration maintained a consistent tissue coverage of 0.25 m2/pixel across all samples.
-
•
Model-specific adaptations: When implementing baseline models, we strictly followed their original specifications. For instance, with the MUSK model [49], we incorporated their recommended multiscale augmentation strategies as provided in the official implementation.
4. Evaluating Protocols
Paradigm
Downstream tasks in this benchmark can be typically categorized into 2 types: 1) classification and 2) survival prediction. To fully demonstrate the capabilities of PFMs, we adopt the conventional two-stage multiple instance learning (MIL) paradigm for slide-level tasks. Following the mainstream evaluation strategy [28, 29], ABMIL [50] is employed as an MIL aggregator to merge all patch features of a WSI into a slide-level representation using attention-based weighting, which is trained from scratch for every downstream task given patch features extracted by various PFMs. The details of training hyperparameters can be found in Table 26, which are kept consistently for different PFMs to guarantee fair comparison.
Data Split
Both internal and external validation are employed for robust and generalizable evaluation. To maintain statistically valid assessments, for classification, the dataset for each task is split into training, validation, and test sets in a 7:1:2 ratio on every internal cohort, with experiments repeated 10 times using different random seeds. All 10 models generated from the repeated training process are subsequently assessed on external datasets to validate generalizability. For survival prediction, we adopt 5-fold cross-validation repeated 3 times experiments to achieve reliable comparisons given different seeds, resulting in 15 times repeated runs for each dataset. Similarly, all models trained across every fold and every seed are used for inference on external datasets.
Statistical Analysis
To rigorously evaluate whether the observed assessment results demonstrate statistically significant differences, we apply non-parametric 1000 times bootstrapping for every experimental run. As a result, 10,000 and 15,000 bootstrap replicates are employed under the aforementioned data splits to estimate 95% confidence intervals (CI) for every classification and survival task, respectively. For the best-performing model on every task, we estimate if it has a statistical difference from every other model via the one-sided Wilcoxon signed-rank test [51], and P-value is subsequently reported.
Metrics
For classification tasks, we report the AUC and its 95% CI, which is a common metric used in classification independent of the decision threshold choice and remains unaffected by variations in class imbalance. For survival tasks, Concordance Index (C-Index) is commonly adopted, which represents the probability that, when two individuals are randomly chosen, their predicted risks will be ranked correctly.
References
- [1] Lu, M. Y. et al. Ai-based pathology predicts origins for cancers of unknown primary. \JournalTitleNature 594, 106–110 (2021).
- [2] Song, A. H. et al. Artificial intelligence for digital and computational pathology. \JournalTitleNature Reviews Bioengineering 1, 930–949 (2023).
- [3] Skrede, O.-J. et al. Deep learning for prediction of colorectal cancer outcome: a discovery and validation study. \JournalTitleThe Lancet 395, 350–360 (2020).
- [4] Shmatko, A., Ghaffari Laleh, N., Gerstung, M. & Kather, J. N. Artificial intelligence in histopathology: enhancing cancer research and clinical oncology. \JournalTitleNature cancer 3, 1026–1038 (2022).
- [5] Verma, R. et al. Sexually dimorphic computational histopathological signatures prognostic of overall survival in high-grade gliomas via deep learning. \JournalTitleScience advances 10, eadi0302 (2024).
- [6] Shen, Y. et al. Explainable survival analysis with convolution-involved vision transformer. In Proceedings of the AAAI conference on artificial intelligence, vol. 36, 2207–2215 (2022).
- [7] Oquab, M. et al. Dinov2: Learning robust visual features without supervision. \JournalTitlearXiv preprint arXiv:2304.07193 (2023).
- [8] Zhou, F. & Chen, H. Cross-modal translation and alignment for survival analysis. In Proceedings of the IEEE/CVF International Conference on Computer Vision, 21485–21494 (2023).
- [9] Chen, X., Xie, S. & He, K. An empirical study of training self-supervised vision transformers. In Proceedings of the IEEE/CVF international conference on computer vision, 9640–9649 (2021).
- [10] Radford, A. et al. Learning transferable visual models from natural language supervision. In International conference on machine learning, 8748–8763 (PmLR, 2021).
- [11] Yu, J. et al. Coca: Contrastive captioners are image-text foundation models. \JournalTitlearXiv preprint arXiv:2205.01917 (2022).
- [12] Xu, Y. et al. A multimodal knowledge-enhanced whole-slide pathology foundation model. \JournalTitlearXiv preprint arXiv:2407.15362 (2024).
- [13] Bilal, M. et al. Foundation models in computational pathology: A review of challenges, opportunities, and impact. \JournalTitlearXiv preprint arXiv:2502.08333 (2025).
- [14] Wang, X. et al. Foundation model for predicting prognosis and adjuvant therapy benefit from digital pathology in gi cancers. \JournalTitleJournal of Clinical Oncology JCO–24 (2025).
- [15] Fournier, L. M. et al. Extended pre-training of histopathology foundation models uncovers co-existing breast cancer archetypes characterized by rna splicing or tgf- dysregulation. \JournalTitlebioRxiv 2025–03 (2025).
- [16] Kondepudi, A. et al. Foundation models for fast, label-free detection of glioma infiltration. \JournalTitleNature 637, 439–445 (2025).
- [17] Mulliqi, N. et al. Foundation models–a panacea for artificial intelligence in pathology? \JournalTitlearXiv preprint arXiv:2502.21264 (2025).
- [18] Neidlinger, P. et al. Benchmarking foundation models as feature extractors for weakly-supervised computational pathology. \JournalTitlearXiv preprint arXiv:2408.15823 (2024).
- [19] Lee, J., Lim, J., Byeon, K. & Kwak, J. T. Benchmarking pathology foundation models: Adaptation strategies and scenarios. \JournalTitleComputers in Biology and Medicine 190, 110031 (2025).
- [20] Majzoub, R. A. et al. How good is my histopathology vision-language foundation model? a holistic benchmark. \JournalTitlearXiv preprint arXiv:2503.12990 (2025).
- [21] Gustafsson, F. K. & Rantalainen, M. Evaluating computational pathology foundation models for prostate cancer grading under distribution shifts. \JournalTitlearXiv preprint arXiv:2410.06723 (2024).
- [22] Breen, J. et al. A comprehensive evaluation of histopathology foundation models for ovarian cancer subtype classification. \JournalTitleNPJ Precision Oncology 9, 33 (2025).
- [23] Campanella, G. et al. A clinical benchmark of public self-supervised pathology foundation models. \JournalTitleNature Communications 16, 3640 (2025).
- [24] Cao, W., Qin, K., Li, F. & Chen, W. Comparative study of cancer profiles between 2020 and 2022 using global cancer statistics (globocan). \JournalTitleJournal of the National Cancer Center 4, 128–134 (2024).
- [25] He, K., Zhang, X., Ren, S. & Sun, J. Deep residual learning for image recognition. In Proceedings of the IEEE conference on computer vision and pattern recognition, 770–778 (2016).
- [26] Wang, X. et al. Transformer-based unsupervised contrastive learning for histopathological image classification. \JournalTitleMedical image analysis 81, 102559 (2022).
- [27] Filiot, A. et al. Scaling self-supervised learning for histopathology with masked image modeling. \JournalTitlemedRxiv 2023–07 (2023).
- [28] Chen, R. J. et al. Towards a general-purpose foundation model for computational pathology. \JournalTitleNature Medicine 30, 850–862 (2024).
- [29] Vorontsov, E. et al. A foundation model for clinical-grade computational pathology and rare cancers detection. \JournalTitleNature medicine 30, 2924–2935 (2024).
- [30] Xu, H. et al. A whole-slide foundation model for digital pathology from real-world data. \JournalTitleNature 630, 181–188 (2024).
- [31] Nechaev, D., Pchelnikov, A. & Ivanova, E. Hibou: A family of foundational vision transformers for pathology. \JournalTitlearXiv preprint arXiv:2406.05074 (2024).
- [32] Ma, J. et al. Towards a generalizable pathology foundation model via unified knowledge distillation. \JournalTitleNature Biomedical Engineering (2025).
- [33] Zimmermann, E. et al. Virchow2: Scaling self-supervised mixed magnification models in pathology. \JournalTitlearXiv preprint arXiv:2408.00738 (2024).
- [34] Saillard, C. et al. H-optimus-0 (2024).
- [35] Filiot, A., Jacob, P., Mac Kain, A. & Saillard, C. Phikon-v2, a large and public feature extractor for biomarker prediction. \JournalTitlearXiv preprint arXiv:2409.09173 (2024).
- [36] Saillard, C. et al. H-optimus-1 (2024).
- [37] Huang, Z., Bianchi, F., Yuksekgonul, M., Montine, T. J. & Zou, J. A visual–language foundation model for pathology image analysis using medical twitter. \JournalTitleNature medicine 29, 2307–2316 (2023).
- [38] Lu, M. Y. et al. A visual-language foundation model for computational pathology. \JournalTitleNature Medicine 30 (2024).
- [39] Wang, X. et al. A pathology foundation model for cancer diagnosis and prognosis prediction. \JournalTitleNature 634, 970–978 (2024).
- [40] Xiang, J. et al. A vision–language foundation model for precision oncology. \JournalTitleNature 1–10 (2025).
- [41] Xu, Y. et al. A multimodal knowledge-enhanced whole-slide pathology foundation model. \JournalTitlearXiv preprint arXiv:2407.15362 (2024).
- [42] Chen, X., Xie, S. & He, K. An empirical study of training self-supervised vision transformers. In Proceedings of the IEEE/CVF international conference on computer vision, 9640–9649 (2021).
- [43] Dosovitskiy, A. et al. An image is worth 16x16 words: Transformers for image recognition at scale. In International Conference on Learning Representations.
- [44] Oquab, M. et al. Dinov2: Learning robust visual features without supervision. \JournalTitleTransactions on Machine Learning Research .
- [45] Schuhmann, C. et al. Laion-5b: An open large-scale dataset for training next generation image-text models. \JournalTitleAdvances in neural information processing systems 35, 25278–25294 (2022).
- [46] Radford, A. et al. Learning transferable visual models from natural language supervision. In International conference on machine learning, 8748–8763 (PmLR, 2021).
- [47] Yu, J. et al. Coca: Contrastive captioners are image-text foundation models. \JournalTitleTransactions on Machine Learning Research .
- [48] Vaidya, A. et al. Molecular-driven foundation model for oncologic pathology. \JournalTitlearXiv preprint arXiv:2501.16652 (2025).
- [49] Xiang, J. et al. A vision–language foundation model for precision oncology. \JournalTitleNature 1–10 (2025).
- [50] Ilse, M., Tomczak, J. & Welling, M. Attention-based deep multiple instance learning. In International conference on machine learning, 2127–2136 (PMLR, 2018).
- [51] Wilcoxon, F. Individual comparisons by ranking methods. In Breakthroughs in statistics: Methodology and distribution, 196–202 (Springer, 1992).
Supplementary information
| Organ | Source | Cohort | Case Number | Slides Number |
|---|---|---|---|---|
| Lung | H1 | Metastatic-Cohort | 846 | 1,422 |
| Lung | H5 | Metastatic-Cohort | 493 | 493 |
| Lung | H6 | Metastatic-Cohort | 826 | 1,422 |
| Stomach | H7 | Biopsy-Cohort | 1,345 | 2,700 |
| Stomach | H1 | Gastric-Cohort | 403 | 404 |
| Stomach | H4 | Gastric-Cohort | 320 | 320 |
| Stomach | H3 | Gastric-Cohort | 260 | 260 |
| Colorectal | H8 | Colorectal-Cohort | 622 | 2,779 |
| Colorectal | H1 | Colorectal-Cohort | 294 | 301 |
| Breast | H9 | Breast-Cohort | 418 | 421 |
| Breast | H2 | Breast-Cohort | 2,045 | 4,275 |
| Brain | H1 | Glioma-Cohort | 677 | 1,362 |
| Model | Internal (H1) | External (H5) | External (H6) |
|---|---|---|---|
| ResNet50 | 0.8835 (0.8236-0.9329) | 0.6497 (0.5824-0.7129) | 0.6819 (0.6393-0.7225) |
| UNI | 0.9785 (0.9579-0.9932) | 0.8690 (0.8253-0.9082) | 0.8968 (0.8601-0.9235) |
| UNI2 | 0.9805 (0.9579-0.9948) | 0.8743 (0.8359-0.9116) | 0.8932 (0.8635-0.9189) |
| CONCH | 0.9763 (0.9524-0.9922) | 0.8610 (0.8190-0.8990) | 0.8744 (0.8434-0.9000) |
| CHIEF | 0.9755 (0.9541-0.9914) | 0.8372 (0.7942-0.8772) | 0.8339 (0.8030-0.8630) |
| GPFM | 0.9815 (0.9614-0.9949) | 0.8595 (0.8209-0.8974) | 0.8963 (0.8705-0.9204) |
| mSTAR | 0.9815 (0.9599-0.9951) | 0.8811 (0.8371-0.9166) | 0.9034 (0.8674-0.9277) |
| Virchow2 | 0.9846 (0.9676-0.9960) | 0.8686 (0.8278-0.9070) | 0.9152 (0.8902-0.9371) |
| CONCH1.5 | 0.9783 (0.9579-0.9929) | 0.8592 (0.8125-0.9030) | 0.8683 (0.8401-0.8937) |
| Phikon | 0.9822 (0.9595-0.9968) | 0.8718 (0.8326-0.9093) | 0.8657 (0.8321-0.8951) |
| CTransPath | 0.9763 (0.9560-0.9913) | 0.8428 (0.8010-0.8825) | 0.8680 (0.8415-0.8922) |
| Phikon2 | 0.9835 (0.9602-0.9972) | 0.8676 (0.8297-0.9018) | 0.8914 (0.8596-0.9175) |
| PLIP | 0.9528 (0.9189-0.9799) | 0.8177 (0.7403-0.8772) | 0.7619 (0.7108-0.8038) |
| Prov-GigaPath | 0.9855 (0.9658-0.9974) | 0.8413 (0.7904-0.8824) | 0.8849 (0.8531-0.9143) |
| Virchow | 0.9756 (0.9524-0.9921) | 0.8221 (0.7385-0.8771) | 0.8575 (0.8239-0.8880) |
| H-Optimus-0 | 0.9828 (0.9630-0.9952) | 0.8342 (0.7849-0.8808) | 0.9076 (0.8762-0.9374) |
| H-Optimus-1 | 0.9865 (0.9717-0.9962) | 0.8513 (0.8051-0.8965) | 0.9088 (0.8845-0.9307) |
| MUSK | 0.9688 (0.9380-0.9896) | 0.8079 (0.7606-0.8529) | 0.8157 (0.7768-0.8502) |
| Hibou-L | 0.9773 (0.9546-0.9938) | 0.7905 (0.7395-0.8391) | 0.8453 (0.8106-0.8814) |
| Model | Internal (H1) | External (H5) | External (H6) |
|---|---|---|---|
| ResNet50 | 0.8610 (0.7998-0.9142) | 0.6927 (0.6423-0.7377) | 0.8162 (0.7704-0.8541) |
| UNI | 0.9742 (0.9503-0.9903) | 0.9417 (0.9153-0.9629) | 0.9777 (0.9670-0.9866) |
| UNI2 | 0.9735 (0.9493-0.9904) | 0.9555 (0.9350-0.9725) | 0.9830 (0.9740-0.9896) |
| CONCH | 0.9622 (0.9328-0.9850) | 0.9379 (0.9141-0.9576) | 0.9795 (0.9692-0.9877) |
| CHIEF | 0.9421 (0.9022-0.9720) | 0.9108 (0.8803-0.9373) | 0.9478 (0.9271-0.9649) |
| GPFM | 0.9711 (0.9470-0.9883) | 0.9341 (0.9045-0.9581) | 0.9742 (0.9606-0.9833) |
| mSTAR | 0.9738 (0.9494-0.9902) | 0.9469 (0.9210-0.9680) | 0.9796 (0.9704-0.9875) |
| Virchow2 | 0.9713 (0.9402-0.9896) | 0.9445 (0.9166-0.9664) | 0.9840 (0.9755-0.9908) |
| CONCH1.5 | 0.9671 (0.9343-0.9884) | 0.9327 (0.8993-0.9591) | 0.9726 (0.9601-0.9832) |
| Phikon | 0.9560 (0.9248-0.9818) | 0.9294 (0.9008-0.9524) | 0.9730 (0.9611-0.9832) |
| CTransPath | 0.9525 (0.9230-0.9757) | 0.9160 (0.8840-0.9416) | 0.9537 (0.9391-0.9668) |
| Phikon2 | 0.9660 (0.9370-0.9865) | 0.9150 (0.8823-0.9432) | 0.9655 (0.9484-0.9781) |
| PLIP | 0.9147 (0.8747-0.9510) | 0.8611 (0.8314-0.8887) | 0.8911 (0.8591-0.9238) |
| Prov-GigaPath | 0.9736 (0.9523-0.9893) | 0.9308 (0.9043-0.9531) | 0.9786 (0.9688-0.9867) |
| Virchow | 0.9600 (0.9278-0.9833) | 0.9391 (0.9095-0.9599) | 0.9744 (0.9628-0.9838) |
| H-Optimus-0 | 0.9695 (0.9232-0.9948) | 0.9484 (0.9208-0.9692) | 0.9859 (0.9786-0.9918) |
| H-Optimus-1 | 0.9782 (0.9447-0.9963) | 0.9533 (0.9333-0.9697) | 0.9861 (0.9785-0.9917) |
| MUSK | 0.9459 (0.9158-0.9712) | 0.9062 (0.8805-0.9291) | 0.9514 (0.9357-0.9662) |
| Hibou-L | 0.9456 (0.9017-0.9752) | 0.8878 (0.8374-0.9241) | 0.9375 (0.8798-0.9661) |
| Model | C-Met (H1) | CK7 (H1) | TTF-1 (H1) | NapsinA (H1) |
|---|---|---|---|---|
| ResNet50 | 0.5541 (0.4304-0.6782) | 0.6724 (0.5484-0.7885) | 0.8726 (0.7917-0.9401) | 0.8868 (0.7848-0.9636) |
| UNI | 0.6643 (0.5261-0.7870) | 0.9248 (0.8438-0.9856) | 0.9645 (0.9018-0.9957) | 0.9426 (0.8693-0.9894) |
| UNI2 | 0.5617 (0.4269-0.6985) | 0.9211 (0.8347-0.9836) | 0.9960 (0.9796-1.0000) | 0.9695 (0.9149-0.9987) |
| CONCH | 0.5671 (0.4289-0.7150) | 0.9103 (0.8282-0.9738) | 0.9644 (0.9081-0.9982) | 0.9083 (0.8250-0.9696) |
| CHIEF | 0.5912 (0.4563-0.7170) | 0.8260 (0.7185-0.9149) | 0.9721 (0.9324-0.9960) | 0.9437 (0.8753-0.9900) |
| GPFM | 0.6300 (0.4923-0.7652) | 0.9002 (0.8096-0.9682) | 0.9844 (0.9514-1.0000) | 0.9574 (0.9048-0.9918) |
| mSTAR | 0.6633 (0.5283-0.7875) | 0.9191 (0.8366-0.9796) | 0.9790 (0.9409-0.9983) | 0.9381 (0.8648-0.9863) |
| Virchow2 | 0.6012 (0.4506-0.7451) | 0.9276 (0.8464-0.9866) | 0.9895 (0.9682-1.0000) | 0.9586 (0.8936-0.9951) |
| CONCH1.5 | 0.5426 (0.4043-0.6799) | 0.9106 (0.8321-0.9724) | 0.9679 (0.8920-0.9995) | 0.9253 (0.8431-0.9853) |
| Phikon | 0.6441 (0.4951-0.7706) | 0.8938 (0.8075-0.9613) | 0.9786 (0.9432-0.9985) | 0.9426 (0.8795-0.9873) |
| CTransPath | 0.5701 (0.4361-0.7022) | 0.8422 (0.7458-0.9236) | 0.9541 (0.8828-0.9948) | 0.9528 (0.8714-0.9951) |
| Phikon2 | 0.6279 (0.4945-0.7545) | 0.9072 (0.8224-0.9724) | 0.9671 (0.9182-0.9948) | 0.9414 (0.8670-0.9882) |
| PLIP | 0.5544 (0.4261-0.6787) | 0.7498 (0.6280-0.8583) | 0.9394 (0.8396-0.9913) | 0.9549 (0.8931-0.9929) |
| Prov-GigaPath | 0.6818 (0.5472-0.7989) | 0.9163 (0.8257-0.9823) | 0.9899 (0.9667-1.0000) | 0.9652 (0.9190-0.9946) |
| Virchow | 0.5833 (0.4403-0.7316) | 0.8853 (0.7935-0.9569) | 0.9822 (0.9394-1.0000) | 0.9495 (0.8893-0.9885) |
| H-Optimus-0 | 0.7362 (0.6196-0.8417) | 0.9263 (0.8375-0.9858) | 0.9773 (0.9314-0.9992) | 0.9780 (0.9295-1.0000) |
| H-Optimus-1 | 0.7246 (0.5866-0.8500) | 0.9362 (0.8490-0.9930) | 0.9892 (0.9706-1.0000) | 0.9781 (0.9211-1.0000) |
| MUSK | 0.5226 (0.3959-0.6476) | 0.8231 (0.7171-0.9152) | 0.9400 (0.8625-0.9885) | 0.9178 (0.8364-0.9805) |
| Hibou-L | 0.5566 (0.4254-0.6850) | 0.8660 (0.7732-0.9399) | 0.9083 (0.8189-0.9767) | 0.9217 (0.8470-0.9761) |
| Model | Internal (H2) | External (H9) |
|---|---|---|
| ResNet50 | 0.8880 (0.8670-0.9077) | 0.7363 (0.7001-0.7706) |
| UNI | 0.9239 (0.9049-0.9411) | 0.7996 (0.7592-0.8377) |
| UNI2 | 0.9313 (0.9148-0.9465) | 0.8188 (0.7816-0.8554) |
| CONCH | 0.8992 (0.8775-0.9196) | 0.7622 (0.7292-0.7935) |
| CHIEF | 0.9144 (0.8949-0.9327) | 0.7690 (0.7342-0.8022) |
| GPFM | 0.9241 (0.9055-0.9410) | 0.7958 (0.7469-0.8323) |
| mSTAR | 0.9225 (0.9017-0.9408) | 0.7859 (0.7453-0.8340) |
| Virchow2 | 0.9249 (0.9065-0.9414) | 0.8202 (0.7850-0.8503) |
| CONCH1.5 | 0.9182 (0.9006-0.9346) | 0.7815 (0.7455-0.8164) |
| Phikon | 0.9175 (0.8982-0.9356) | 0.7945 (0.7532-0.8277) |
| CTransPath | 0.9132 (0.8939-0.9316) | 0.7861 (0.7532-0.8171) |
| Phikon2 | 0.9213 (0.9032-0.9383) | 0.7960 (0.7594-0.8322) |
| PLIP | 0.9092 (0.8881-0.9285) | 0.7475 (0.7092-0.7786) |
| Prov-GigaPath | 0.9251 (0.9077-0.9416) | 0.8134 (0.7817-0.8433) |
| Virchow | 0.9173 (0.8990-0.9343) | 0.7863 (0.7464-0.8281) |
| H-Optimus-0 | 0.9350 (0.9188-0.9500) | 0.7996 (0.7563-0.8377) |
| H-Optimus-1 | 0.9380 (0.9232-0.9523) | 0.7919 (0.7588-0.8315) |
| MUSK | 0.9178 (0.8993-0.9351) | 0.7203 (0.6763-0.7720) |
| Hibou-L | 0.9088 (0.8881-0.9277) | 0.7329 (0.6631-0.7885) |
| Model | Internal (H2) | External (H9) |
|---|---|---|
| ResNet50 | 0.4102 (0.2721-0.5560) | 0.4696 (0.3390-0.6026) |
| UNI | 0.7035 (0.5637-0.8317) | 0.7191 (0.5766-0.8453) |
| UNI2 | 0.6865 (0.5372-0.8232) | 0.6889 (0.5437-0.8275) |
| CONCH | 0.6741 (0.5209-0.8107) | 0.6884 (0.5491-0.8155) |
| CHIEF | 0.7082 (0.5751-0.8333) | 0.6349 (0.4821-0.7769) |
| GPFM | 0.6292 (0.4225-0.7969) | 0.6804 (0.5390-0.8134) |
| mSTAR | 0.6885 (0.5410-0.8249) | 0.7008 (0.5630-0.8259) |
| Virchow2 | 0.7949 (0.6375-0.9077) | 0.6748 (0.5287-0.8080) |
| CONCH1.5 | 0.6795 (0.5420-0.8047) | 0.6627 (0.5138-0.7982) |
| Phikon | 0.6572 (0.4568-0.8069) | 0.6561 (0.5108-0.7953) |
| CTransPath | 0.6381 (0.4829-0.7879) | 0.6178 (0.4637-0.7656) |
| Phikon2 | 0.6731 (0.5285-0.8060) | 0.6651 (0.5142-0.8015) |
| PLIP | 0.6397 (0.4982-0.7705) | 0.6199 (0.4686-0.7633) |
| Prov-GigaPath | 0.6792 (0.5091-0.8185) | 0.6703 (0.5191-0.8086) |
| Virchow | 0.6125 (0.4388-0.8043) | 0.6414 (0.4893-0.7820) |
| H-Optimus-0 | 0.6646 (0.5157-0.8011) | 0.6557 (0.5154-0.7883) |
| H-Optimus-1 | 0.6565 (0.5068-0.7952) | 0.6795 (0.5224-0.8206) |
| MUSK | 0.5034 (0.3744-0.6316) | 0.5795 (0.4287-0.7262) |
| Hibou-L | 0.5502 (0.4112-0.6870) | 0.5464 (0.3765-0.7189) |
| Model | ER (H2) | PR (H2) | HER2 (H2) |
|---|---|---|---|
| ResNet50 | 0.8236 (0.7728-0.8697) | 0.8619 (0.8095-0.9078) | 0.7145 (0.6520-0.7732) |
| UNI | 0.8952 (0.8571-0.9289) | 0.8914 (0.8497-0.9288) | 0.8176 (0.7563-0.8714) |
| UNI2 | 0.9105 (0.8740-0.9426) | 0.8732 (0.8248-0.9182) | 0.8162 (0.7612-0.8675) |
| CONCH | 0.8850 (0.8432-0.9216) | 0.8707 (0.8272-0.9096) | 0.8041 (0.7453-0.8596) |
| CHIEF | 0.8655 (0.8174-0.9089) | 0.8808 (0.8375-0.9201) | 0.8031 (0.7458-0.8554) |
| GPFM | 0.8944 (0.8533-0.9306) | 0.8866 (0.8393-0.9265) | 0.8358 (0.7826-0.8841) |
| mSTAR | 0.8964 (0.8561-0.9318) | 0.8847 (0.8378-0.9257) | 0.8188 (0.7584-0.8716) |
| Virchow2 | 0.9041 (0.8660-0.9370) | 0.8941 (0.8540-0.9307) | 0.8264 (0.7712-0.8775) |
| CONCH1.5 | 0.8888 (0.8459-0.9256) | 0.8843 (0.8450-0.9196) | 0.7976 (0.7378-0.8542) |
| Phikon | 0.8928 (0.8527-0.9293) | 0.8832 (0.8380-0.9233) | 0.8141 (0.7552-0.8660) |
| CTransPath | 0.8765 (0.8276-0.9174) | 0.8806 (0.8311-0.9213) | 0.8192 (0.7653-0.8678) |
| Phikon2 | 0.8883 (0.8479-0.9254) | 0.8834 (0.8295-0.9248) | 0.8278 (0.7679-0.8792) |
| PLIP | 0.8551 (0.8093-0.8960) | 0.8887 (0.8483-0.9248) | 0.7983 (0.7427-0.8491) |
| Prov-GigaPath | 0.8901 (0.8500-0.9271) | 0.8698 (0.8227-0.9125) | 0.8284 (0.7572-0.8817) |
| Virchow | 0.8957 (0.8571-0.9304) | 0.8784 (0.8313-0.9202) | 0.8200 (0.7673-0.8681) |
| H-Optimus-0 | 0.9140 (0.8788-0.9451) | 0.8869 (0.8419-0.9259) | 0.8454 (0.7870-0.8981) |
| H-Optimus-1 | 0.9185 (0.8818-0.9501) | 0.8855 (0.8421-0.9246) | 0.8286 (0.7753-0.8789) |
| MUSK | 0.8854 (0.8451-0.9216) | 0.8944 (0.8544-0.9293) | 0.8013 (0.7409-0.8559) |
| Hibou-L | 0.8919 (0.8506-0.9286) | 0.8759 (0.8272-0.9183) | 0.7796 (0.7169-0.8378) |
| Model | AR (H2) | CK5 (H2) | pTNM |
|---|---|---|---|
| ResNet50 | 0.7115 (0.6389-0.7812) | 0.7618 (0.6479-0.8552) | 0.5438 (0.4330-0.6525) |
| UNI | 0.7292 (0.6549-0.7987) | 0.8300 (0.7521-0.8986) | 0.5743 (0.4631-0.6843) |
| UNI2 | 0.7242 (0.6438-0.7982) | 0.8481 (0.7718-0.9124) | 0.5326 (0.4210-0.6467) |
| CONCH | 0.7345 (0.6501-0.8089) | 0.8076 (0.7120-0.8888) | 0.5560 (0.4489-0.6708) |
| CHIEF | 0.7218 (0.6518-0.7892) | 0.7865 (0.6968-0.8646) | 0.5642 (0.4502-0.6787) |
| GPFM | 0.7447 (0.6764-0.8097) | 0.8189 (0.7368-0.8915) | 0.5876 (0.4790-0.6923) |
| mSTAR | 0.7402 (0.6696-0.8077) | 0.8322 (0.7526-0.9018) | 0.5686 (0.4559-0.6818) |
| Virchow2 | 0.7292 (0.6526-0.7982) | 0.8388 (0.7644-0.9034) | 0.5652 (0.4518-0.6765) |
| CONCH1.5 | 0.7386 (0.6608-0.8100) | 0.8062 (0.7238-0.8785) | 0.6053 (0.4945-0.7185) |
| Phikon | 0.7147 (0.6412-0.7847) | 0.8432 (0.7690-0.9069) | 0.5890 (0.4820-0.6917) |
| CTransPath | 0.7301 (0.6585-0.7978) | 0.8023 (0.7168-0.8761) | 0.6142 (0.5027-0.7206) |
| Phikon2 | 0.7209 (0.6312-0.7970) | 0.8255 (0.7382-0.9006) | 0.5923 (0.4828-0.7004) |
| PLIP | 0.7318 (0.6621-0.7975) | 0.8035 (0.7208-0.8762) | 0.6015 (0.4906-0.7098) |
| Prov-GigaPath | 0.7228 (0.6492-0.7912) | 0.8381 (0.7648-0.9024) | 0.5732 (0.4510-0.6897) |
| Virchow | 0.6762 (0.5873-0.7676) | 0.8450 (0.7724-0.9085) | 0.5306 (0.4281-0.6407) |
| H-Optimus-0 | 0.7238 (0.6438-0.7992) | 0.8243 (0.7444-0.8942) | 0.5456 (0.4293-0.6603) |
| H-Optimus-1 | 0.7422 (0.6689-0.8101) | 0.8376 (0.7612-0.9039) | 0.5684 (0.4626-0.6763) |
| MUSK | 0.7388 (0.6672-0.8067) | 0.8155 (0.7414-0.8812) | 0.6026 (0.4946-0.7137) |
| Hibou-L | 0.7128 (0.6243-0.7901) | 0.8128 (0.7325-0.8817) | 0.5279 (0.4234-0.6372) |
| Model | OS (H2) | DFS (H2) |
|---|---|---|
| CHIEF | 0.6796 (0.4861-0.8408) | 0.6690 (0.4705-0.8495) |
| CONCH | 0.6641 (0.4733-0.8307) | 0.6352 (0.4617-0.7930) |
| CONCH1.5 | 0.6762 (0.4743-0.8446) | 0.6461 (0.4664-0.8076) |
| CTransPath | 0.6809 (0.4828-0.8489) | 0.6449 (0.4618-0.8133) |
| Prov-GigaPath | 0.6335 (0.4196-0.8281) | 0.6482 (0.4390-0.8417) |
| GPFM | 0.6523 (0.4532-0.8238) | 0.6475 (0.4318-0.8488) |
| H-Optimus-0 | 0.6410 (0.4008-0.8315) | 0.6093 (0.4068-0.8060) |
| H-Optimus-1 | 0.6431 (0.4049-0.8232) | 0.6347 (0.4227-0.8530) |
| Hibou-L | 0.6397 (0.4356-0.8248) | 0.5653 (0.3718-0.7422) |
| mSTAR | 0.6505 (0.4395-0.8358) | 0.6426 (0.4217-0.8512) |
| MUSK | 0.6768 (0.4635-0.8592) | 0.6145 (0.4281-0.7813) |
| Phikon | 0.6794 (0.4700-0.8533) | 0.6343 (0.4179-0.8510) |
| Phikon2 | 0.6548 (0.4526-0.8436) | 0.6588 (0.4196-0.8671) |
| PLIP | 0.6370 (0.4522-0.8029) | 0.5534 (0.3531-0.7409) |
| ResNet50 | 0.6335 (0.4384-0.8048) | 0.5782 (0.3812-0.7768) |
| UNI | 0.6586 (0.4406-0.8387) | 0.6491 (0.4257-0.8600) |
| UNI2 | 0.6676 (0.4432-0.8468) | 0.6697 (0.4715-0.8504) |
| Virchow | 0.6628 (0.4589-0.8282) | 0.6502 (0.4462-0.8303) |
| Virchow2 | 0.6637 (0.4512-0.8644) | 0.6404 (0.4453-0.8213) |
| Model | Intestinal Metaplasia | Normal/Abnormal | ACGxHP |
|---|---|---|---|
| ResNet50 | 0.9354 (0.8899-0.9686) | 0.8704 (0.8319-0.9052) | 0.7888 (0.7005-0.8555) |
| UNI | 0.9421 (0.8940-0.9713) | 0.9187 (0.8820-0.9454) | 0.8574 (0.7811-0.9124) |
| UNI2 | 0.9555 (0.9245-0.9775) | 0.9118 (0.8763-0.9437) | 0.8510 (0.7893-0.9047) |
| CONCH | 0.9535 (0.9196-0.9755) | 0.8987 (0.8576-0.9299) | 0.8578 (0.7867-0.9163) |
| CHIEF | 0.9364 (0.8817-0.9673) | 0.9143 (0.8480-0.9449) | 0.8385 (0.7809-0.8894) |
| GPFM | 0.9311 (0.8470-0.9734) | 0.9134 (0.8798-0.9414) | 0.8645 (0.8036-0.9123) |
| mSTAR | 0.9465 (0.8869-0.9736) | 0.9226 (0.8897-0.9480) | 0.8447 (0.7663-0.9065) |
| Virchow2 | 0.9615 (0.9337-0.9792) | 0.9232 (0.8908-0.9484) | 0.8408 (0.7717-0.9015) |
| CONCH1.5 | 0.9277 (0.8715-0.9678) | 0.9045 (0.8700-0.9345) | 0.8533 (0.7836-0.9111) |
| Phikon | 0.9495 (0.9135-0.9733) | 0.9161 (0.8848-0.9438) | 0.8484 (0.7809-0.9033) |
| CTransPath | 0.9422 (0.8909-0.9720) | 0.9206 (0.8925-0.9450) | 0.8278 (0.7620-0.8827) |
| Phikon2 | 0.9534 (0.9238-0.9761) | 0.9126 (0.8834-0.9391) | 0.8321 (0.7513-0.8950) |
| PLIP | 0.9225 (0.8544-0.9629) | 0.8773 (0.8364-0.9135) | 0.8288 (0.7609-0.8870) |
| Prov-GigaPath | 0.9515 (0.9220-0.9726) | 0.9103 (0.8751-0.9402) | 0.8522 (0.7823-0.9080) |
| Virchow | 0.9554 (0.9208-0.9766) | 0.9012 (0.8628-0.9337) | 0.8400 (0.7498-0.9037) |
| H-Optimus-0 | 0.9582 (0.9252-0.9771) | 0.9254 (0.8956-0.9508) | 0.8505 (0.7569-0.9068) |
| H-Optimus-1 | 0.9631 (0.9426-0.9780) | 0.9319 (0.9017-0.9559) | 0.8392 (0.7607-0.9046) |
| MUSK | 0.9322 (0.8896-0.9630) | 0.8991 (0.8685-0.9264) | 0.8551 (0.7914-0.9094) |
| Hibou-L | 0.9569 (0.9216-0.9758) | 0.9006 (0.8668-0.9306) | 0.8095 (0.7116-0.8802) |
| Model | HPACG | Polyp | Ulcer |
|---|---|---|---|
| ResNet50 | 0.9081 (0.8398-0.9562) | 0.8136 (0.7057-0.9053) | 0.7401 (0.6192-0.8388) |
| UNI | 0.9538 (0.9077-0.9810) | 0.9457 (0.8785-0.9860) | 0.8366 (0.7336-0.9241) |
| UNI2 | 0.9520 (0.9010-0.9802) | 0.9444 (0.8877-0.9824) | 0.8433 (0.7352-0.9285) |
| CONCH | 0.9591 (0.9306-0.9790) | 0.8990 (0.8003-0.9637) | 0.8372 (0.7341-0.9248) |
| CHIEF | 0.9413 (0.9034-0.9708) | 0.9242 (0.8619-0.9713) | 0.8133 (0.6297-0.9113) |
| GPFM | 0.9440 (0.9003-0.9745) | 0.9254 (0.8428-0.9800) | 0.8590 (0.7633-0.9348) |
| mSTAR | 0.9518 (0.9085-0.9786) | 0.9472 (0.8880-0.9858) | 0.8524 (0.7590-0.9313) |
| Virchow2 | 0.9647 (0.9408-0.9814) | 0.9203 (0.8325-0.9802) | 0.8502 (0.7564-0.9249) |
| CONCH1.5 | 0.9644 (0.9420-0.9813) | 0.8782 (0.7695-0.9610) | 0.8664 (0.7793-0.9330) |
| Phikon | 0.9304 (0.8546-0.9746) | 0.9071 (0.8082-0.9759) | 0.8101 (0.6839-0.9141) |
| CTransPath | 0.9403 (0.8973-0.9730) | 0.9085 (0.8160-0.9757) | 0.8187 (0.7161-0.9054) |
| Phikon2 | 0.9455 (0.9033-0.9748) | 0.9170 (0.8424-0.9702) | 0.8048 (0.6562-0.9131) |
| PLIP | 0.9297 (0.8825-0.9647) | 0.8583 (0.7563-0.9365) | 0.7738 (0.6604-0.8724) |
| Prov-GigaPath | 0.9559 (0.9078-0.9814) | 0.9224 (0.8404-0.9772) | 0.7991 (0.6434-0.9056) |
| Virchow | 0.9466 (0.9020-0.9756) | 0.9304 (0.8540-0.9804) | 0.8255 (0.7050-0.9210) |
| H-Optimus-0 | 0.9676 (0.9394-0.9841) | 0.9634 (0.9174-0.9907) | 0.8444 (0.7252-0.9291) |
| H-Optimus-1 | 0.9601 (0.9138-0.9864) | 0.9746 (0.9478-0.9930) | 0.8478 (0.7280-0.9287) |
| MUSK | 0.9428 (0.9115-0.9697) | 0.8618 (0.7555-0.9460) | 0.7790 (0.6372-0.8884) |
| Hibou-L | 0.9006 (0.8220-0.9609) | 0.9316 (0.8737-0.9728) | 0.8070 (0.6892-0.9036) |
| Model | Internal (H1) | External (H3) | External (H4) |
|---|---|---|---|
| ResNet50 | 0.6693 (0.4992-0.8235) | 0.7336 (0.6193-0.8283) | 0.7217 (0.5854-0.8292) |
| UNI | 0.8502 (0.7371-0.9405) | 0.8268 (0.7559-0.8897) | 0.8451 (0.7827-0.8986) |
| UNI2 | 0.8834 (0.7894-0.9543) | 0.8200 (0.7468-0.8834) | 0.8232 (0.7490-0.8866) |
| CONCH | 0.8377 (0.7312-0.9283) | 0.8438 (0.7809-0.9009) | 0.8626 (0.8053-0.9130) |
| CHIEF | 0.7878 (0.6579-0.9007) | 0.8479 (0.7790-0.9037) | 0.8218 (0.7549-0.8819) |
| GPFM | 0.8492 (0.7413-0.9397) | 0.8170 (0.7496-0.8797) | 0.8345 (0.7756-0.8867) |
| mSTAR | 0.8562 (0.7538-0.9412) | 0.8311 (0.7619-0.8914) | 0.8453 (0.7855-0.8974) |
| Virchow2 | 0.8616 (0.7589-0.9429) | 0.8330 (0.7684-0.8926) | 0.8364 (0.7676-0.8996) |
| CONCH1.5 | 0.8534 (0.7333-0.9471) | 0.8447 (0.7785-0.9024) | 0.8542 (0.7938-0.9062) |
| Phikon | 0.8165 (0.6850-0.9254) | 0.8214 (0.7534-0.8836) | 0.8223 (0.7602-0.8771) |
| CTransPath | 0.8035 (0.6799-0.9075) | 0.8481 (0.7767-0.9053) | 0.8110 (0.7378-0.8754) |
| Phikon2 | 0.8422 (0.7274-0.9355) | 0.8312 (0.7659-0.8902) | 0.8275 (0.7628-0.8847) |
| PLIP | 0.7871 (0.6367-0.9106) | 0.8545 (0.7988-0.9037) | 0.8549 (0.7995-0.9040) |
| Prov-GigaPath | 0.8494 (0.7292-0.9444) | 0.8214 (0.7496-0.8914) | 0.8400 (0.7775-0.8952) |
| Virchow | 0.8678 (0.7686-0.9486) | 0.8285 (0.7593-0.8926) | 0.8380 (0.7759-0.8939) |
| H-Optimus-0 | 0.8607 (0.7500-0.9448) | 0.8260 (0.7629-0.8868) | 0.8389 (0.7759-0.8944) |
| H-Optimus-1 | 0.8617 (0.7550-0.9453) | 0.8416 (0.7781-0.8966) | 0.8594 (0.7984-0.9116) |
| MUSK | 0.8115 (0.6863-0.9183) | 0.8707 (0.8174-0.9189) | 0.8310 (0.7689-0.8860) |
| Hibou-L | 0.8333 (0.6937-0.9367) | 0.8312 (0.7549-0.8963) | 0.8483 (0.7914-0.9000) |
| Model | Internal (H1) | External (H3) | External (H4) |
|---|---|---|---|
| ResNet50 | 0.5692 (0.4582-0.6698) | 0.5947 (0.5159-0.6713) | 0.5582 (0.5075-0.6089) |
| UNI | 0.7902 (0.7037-0.8737) | 0.7843 (0.7041-0.8637) | 0.7759 (0.7096-0.8332) |
| UNI2 | 0.7839 (0.6976-0.8657) | 0.7897 (0.7315-0.8517) | 0.7780 (0.7205-0.8252) |
| CONCH | 0.8016 (0.7184-0.8784) | 0.7990 (0.7341-0.8605) | 0.7937 (0.7497-0.8360) |
| CHIEF | 0.7775 (0.6925-0.8571) | 0.7924 (0.7297-0.8511) | 0.7911 (0.7453-0.8357) |
| GPFM | 0.7783 (0.6914-0.8610) | 0.7705 (0.7056-0.8481) | 0.7842 (0.7394-0.8283) |
| mSTAR | 0.7785 (0.6936-0.8588) | 0.7945 (0.7235-0.8637) | 0.7698 (0.6986-0.8340) |
| Virchow2 | 0.8064 (0.7220-0.8835) | 0.8128 (0.7538-0.8717) | 0.7828 (0.7363-0.8253) |
| CONCH1.5 | 0.8161 (0.7356-0.8881) | 0.8067 (0.7455-0.8654) | 0.7808 (0.7393-0.8211) |
| Phikon | 0.7949 (0.7077-0.8756) | 0.7861 (0.7266-0.8430) | 0.7764 (0.7154-0.8260) |
| CTransPath | 0.7655 (0.6783-0.8499) | 0.7908 (0.7315-0.8488) | 0.7925 (0.7485-0.8335) |
| Phikon2 | 0.7860 (0.6994-0.8683) | 0.7952 (0.7332-0.8554) | 0.7893 (0.7413-0.8347) |
| PLIP | 0.7413 (0.6514-0.8237) | 0.7470 (0.6800-0.8112) | 0.7371 (0.6962-0.7778) |
| Prov-GigaPath | 0.7785 (0.6955-0.8574) | 0.7888 (0.7203-0.8601) | 0.7913 (0.7253-0.8357) |
| Virchow | 0.7687 (0.6796-0.8529) | 0.8102 (0.7434-0.8793) | 0.7635 (0.7167-0.8087) |
| H-Optimus-0 | 0.7699 (0.6802-0.8558) | 0.8034 (0.7385-0.8654) | 0.7599 (0.7119-0.8058) |
| H-Optimus-1 | 0.7579 (0.6611-0.8481) | 0.7970 (0.7203-0.8646) | 0.7569 (0.7045-0.8041) |
| MUSK | 0.7740 (0.6881-0.8525) | 0.7846 (0.7275-0.8380) | 0.7809 (0.7401-0.8214) |
| Hibou-L | 0.7606 (0.6587-0.8471) | 0.7784 (0.7074-0.8469) | 0.7688 (0.7175-0.8149) |
| Model | Internal (H1) | External (H3) | External (H4) |
|---|---|---|---|
| ResNet50 | 0.6028 (0.5014-0.7084) | 0.5312 (0.4525-0.6028) | 0.5061 (0.4568-0.5533) |
| UNI | 0.8079 (0.6975-0.8939) | 0.6350 (0.5569-0.7168) | 0.6531 (0.5784-0.7314) |
| UNI2 | 0.7928 (0.7000-0.8770) | 0.6808 (0.5956-0.7640) | 0.6691 (0.5887-0.7452) |
| CONCH | 0.8023 (0.7120-0.8823) | 0.6225 (0.5476-0.7384) | 0.6250 (0.5627-0.7762) |
| CHIEF | 0.7426 (0.6348-0.8375) | 0.5879 (0.5011-0.6706) | 0.5543 (0.4933-0.6197) |
| GPFM | 0.7908 (0.6904-0.8777) | 0.6855 (0.5964-0.7704) | 0.6840 (0.5922-0.7759) |
| mSTAR | 0.8057 (0.6913-0.8972) | 0.6277 (0.5501-0.7108) | 0.6438 (0.5802-0.7139) |
| Virchow2 | 0.8159 (0.7290-0.8943) | 0.6813 (0.5946-0.7719) | 0.6704 (0.5953-0.7558) |
| CONCH1.5 | 0.8016 (0.7179-0.8775) | 0.7367 (0.6520-0.8228) | 0.7266 (0.6455-0.8271) |
| Phikon | 0.7538 (0.6563-0.8441) | 0.6558 (0.5774-0.7359) | 0.6247 (0.5560-0.7082) |
| CTransPath | 0.7328 (0.6386-0.8238) | 0.5752 (0.5004-0.6507) | 0.5694 (0.5037-0.6332) |
| Phikon2 | 0.7912 (0.6823-0.8802) | 0.6337 (0.5551-0.7170) | 0.6153 (0.5473-0.6805) |
| PLIP | 0.6825 (0.5859-0.7794) | 0.5706 (0.4985-0.6492) | 0.5700 (0.5043-0.6485) |
| Prov-GigaPath | 0.7663 (0.6551-0.8567) | 0.6309 (0.5467-0.7185) | 0.6564 (0.5952-0.7321) |
| Virchow | 0.7933 (0.7023-0.8789) | 0.6377 (0.5425-0.7786) | 0.6283 (0.5418-0.8034) |
| H-Optimus-0 | 0.8077 (0.7188-0.8885) | 0.7441 (0.6629-0.8207) | 0.6914 (0.6092-0.7707) |
| H-Optimus-1 | 0.8070 (0.7042-0.8925) | 0.7087 (0.5870-0.8172) | 0.6538 (0.5585-0.7805) |
| MUSK | 0.7539 (0.6685-0.8349) | 0.6071 (0.5317-0.6866) | 0.6006 (0.5424-0.6673) |
| Hibou-L | 0.6830 (0.5897-0.7776) | 0.5735 (0.4807-0.6977) | 0.5064 (0.4704-0.5457) |
| Model | Internal (H1) | External (H3) | External (H4) |
|---|---|---|---|
| ResNet50 | 0.8385 (0.7293-0.9320) | 0.7781 (0.7003-0.8477) | 0.6937 (0.6315-0.7519) |
| UNI | 0.9269 (0.8467-0.9863) | 0.8457 (0.7863-0.8974) | 0.7559 (0.6974-0.8098) |
| UNI2 | 0.9191 (0.8372-0.9800) | 0.8461 (0.7853-0.8993) | 0.7586 (0.7012-0.8136) |
| CONCH | 0.9303 (0.8482-0.9886) | 0.8457 (0.7870-0.8974) | 0.7588 (0.7036-0.8109) |
| CHIEF | 0.9118 (0.8310-0.9733) | 0.8382 (0.7676-0.8975) | 0.7463 (0.6837-0.8035) |
| GPFM | 0.9284 (0.8519-0.9825) | 0.8493 (0.7921-0.9007) | 0.7632 (0.7070-0.8143) |
| mSTAR | 0.9282 (0.8487-0.9876) | 0.8456 (0.7885-0.8972) | 0.7523 (0.6961-0.8059) |
| Virchow2 | 0.9345 (0.8657-0.9844) | 0.8455 (0.7844-0.8992) | 0.7656 (0.6998-0.8216) |
| CONCH1.5 | 0.9009 (0.8087-0.9725) | 0.8005 (0.7213-0.8679) | 0.7441 (0.6858-0.7999) |
| Phikon | 0.9181 (0.8330-0.9808) | 0.8482 (0.7901-0.9007) | 0.7465 (0.6900-0.8012) |
| CTransPath | 0.9138 (0.8370-0.9732) | 0.8401 (0.7694-0.8974) | 0.7490 (0.6900-0.8023) |
| Phikon2 | 0.9250 (0.8495-0.9802) | 0.8409 (0.7814-0.8950) | 0.7494 (0.6928-0.8032) |
| PLIP | 0.9404 (0.8713-0.9884) | 0.8425 (0.7799-0.8981) | 0.7234 (0.6629-0.7795) |
| Prov-GigaPath | 0.9121 (0.8290-0.9756) | 0.8341 (0.7703-0.8893) | 0.7458 (0.6860-0.8016) |
| Virchow | 0.9171 (0.8333-0.9772) | 0.8397 (0.7772-0.8937) | 0.7540 (0.6969-0.8076) |
| H-Optimus-0 | 0.9232 (0.8440-0.9817) | 0.8517 (0.7944-0.9026) | 0.7541 (0.6990-0.8058) |
| H-Optimus-1 | 0.9226 (0.8433-0.9803) | 0.8351 (0.7698-0.8906) | 0.7553 (0.7022-0.8061) |
| MUSK | 0.9252 (0.8479-0.9830) | 0.8421 (0.7733-0.9005) | 0.7297 (0.6728-0.7852) |
| Hibou-L | 0.9237 (0.8473-0.9808) | 0.8294 (0.7485-0.8907) | 0.7307 (0.6708-0.7874) |
| Model | Internal (H1) | External (H3) | External (H4) |
|---|---|---|---|
| ResNet50 | 0.7549 (0.6353-0.8619) | 0.6593 (0.5826-0.7337) | 0.6693 (0.5930-0.7353) |
| UNI | 0.7475 (0.6287-0.8578) | 0.7099 (0.6299-0.7833) | 0.6879 (0.6124-0.7495) |
| UNI2 | 0.7817 (0.6701-0.8825) | 0.7044 (0.6199-0.7831) | 0.6966 (0.6282-0.7569) |
| CONCH | 0.7680 (0.6551-0.8705) | 0.7085 (0.6254-0.7845) | 0.7142 (0.6487-0.7764) |
| CHIEF | 0.7663 (0.6528-0.8703) | 0.7182 (0.6443-0.7883) | 0.7065 (0.6472-0.7633) |
| GPFM | 0.7715 (0.6492-0.8786) | 0.7345 (0.6596-0.8035) | 0.7120 (0.6499-0.7701) |
| mSTAR | 0.7642 (0.6468-0.8697) | 0.7226 (0.6435-0.7959) | 0.6952 (0.6330-0.7561) |
| Virchow2 | 0.7677 (0.6456-0.8756) | 0.7345 (0.6559-0.8061) | 0.7221 (0.6607-0.7795) |
| CONCH1.5 | 0.7321 (0.5901-0.8538) | 0.6922 (0.6057-0.7752) | 0.6953 (0.6292-0.7586) |
| Phikon | 0.7730 (0.6577-0.8764) | 0.7256 (0.6517-0.7968) | 0.7011 (0.6328-0.7634) |
| CTransPath | 0.7633 (0.6476-0.8693) | 0.7367 (0.6649-0.8030) | 0.7126 (0.6552-0.7687) |
| Phikon2 | 0.7782 (0.6545-0.8858) | 0.7479 (0.6774-0.8121) | 0.7205 (0.6605-0.7780) |
| PLIP | 0.7706 (0.6592-0.8744) | 0.6861 (0.6100-0.7584) | 0.6502 (0.5848-0.7132) |
| Prov-GigaPath | 0.7759 (0.6630-0.8770) | 0.7193 (0.6409-0.7949) | 0.6857 (0.6222-0.7476) |
| Virchow | 0.8019 (0.6956-0.8964) | 0.7140 (0.6354-0.7883) | 0.6899 (0.6242-0.7556) |
| H-Optimus-0 | 0.7581 (0.6272-0.8684) | 0.7307 (0.6556-0.8010) | 0.7045 (0.6426-0.7666) |
| H-Optimus-1 | 0.7637 (0.6435-0.8717) | 0.7182 (0.6355-0.7934) | 0.7115 (0.6497-0.7716) |
| MUSK | 0.7655 (0.6519-0.8726) | 0.7188 (0.6449-0.7885) | 0.6906 (0.6307-0.7478) |
| Hibou-L | 0.7332 (0.5957-0.8517) | 0.7279 (0.6540-0.7968) | 0.6991 (0.6361-0.7587) |
| Model | S-100 | HER-2 |
|---|---|---|
| ResNet50 | 0.7483 (0.6007-0.8776) | 0.4919 (0.3634-0.6189) |
| UNI | 0.8254 (0.6687-0.9433) | 0.5727 (0.4242-0.7178) |
| UNI2 | 0.8347 (0.6177-0.9618) | 0.5607 (0.4309-0.6869) |
| CONCH | 0.8477 (0.7216-0.9449) | 0.5317 (0.3975-0.6660) |
| CHIEF | 0.7976 (0.6375-0.9231) | 0.5357 (0.4105-0.6574) |
| GPFM | 0.8135 (0.6667-0.9347) | 0.5945 (0.4617-0.7213) |
| mSTAR | 0.8335 (0.6988-0.9422) | 0.5625 (0.3878-0.7089) |
| Virchow2 | 0.8502 (0.7096-0.9568) | 0.5447 (0.4212-0.6663) |
| CONCH1.5 | 0.7542 (0.5798-0.8987) | 0.6179 (0.5011-0.7342) |
| Phikon | 0.8219 (0.6687-0.9400) | 0.5899 (0.4587-0.7151) |
| CTransPath | 0.8181 (0.6728-0.9333) | 0.5205 (0.3963-0.6440) |
| Phikon2 | 0.7548 (0.5979-0.8918) | 0.5590 (0.4262-0.6803) |
| PLIP | 0.8046 (0.6634-0.9197) | 0.5362 (0.4018-0.6657) |
| Prov-GigaPath | 0.8261 (0.6605-0.9404) | 0.5929 (0.4683-0.7116) |
| Virchow | 0.8374 (0.6745-0.9487) | 0.5429 (0.4190-0.6659) |
| H-Optimus-0 | 0.8095 (0.6485-0.9374) | 0.5142 (0.3824-0.6458) |
| H-Optimus-1 | 0.7812 (0.6121-0.9194) | 0.5153 (0.3844-0.6425) |
| MUSK | 0.8096 (0.6643-0.9305) | 0.5291 (0.4102-0.6493) |
| Hibou-L | 0.8172 (0.6745-0.9356) | 0.5671 (0.4440-0.6871) |
| Model | Internal (H1) | External (H3) | External (H4) |
|---|---|---|---|
| ResNet50 | 0.7481 (0.6312-0.8510) | 0.6572 (0.5784-0.7336) | 0.6337 (0.5706-0.6963) |
| UNI | 0.7820 (0.6485-0.8887) | 0.7383 (0.6656-0.8080) | 0.6927 (0.6318-0.7515) |
| UNI2 | 0.7908 (0.6786-0.8870) | 0.7665 (0.6964-0.8322) | 0.6899 (0.6096-0.7579) |
| CONCH | 0.7831 (0.6701-0.8831) | 0.7529 (0.6809-0.8198) | 0.6887 (0.6291-0.7477) |
| CHIEF | 0.7940 (0.6879-0.8856) | 0.7503 (0.6790-0.8177) | 0.6881 (0.6292-0.7455) |
| GPFM | 0.7848 (0.6637-0.8819) | 0.7476 (0.6726-0.8157) | 0.6955 (0.6197-0.7560) |
| mSTAR | 0.7916 (0.6726-0.8894) | 0.7428 (0.6696-0.8122) | 0.6957 (0.6368-0.7526) |
| Virchow2 | 0.7899 (0.6794-0.8846) | 0.7508 (0.6813-0.8183) | 0.6934 (0.6341-0.7521) |
| CONCH1.5 | 0.7458 (0.6223-0.8540) | 0.7411 (0.6670-0.8115) | 0.6906 (0.6265-0.7523) |
| Phikon | 0.7700 (0.6419-0.8788) | 0.7608 (0.6899-0.8278) | 0.7003 (0.6371-0.7592) |
| CTransPath | 0.7995 (0.6966-0.8894) | 0.7552 (0.6857-0.8201) | 0.6993 (0.6415-0.7554) |
| Phikon2 | 0.7805 (0.6604-0.8810) | 0.7570 (0.6890-0.8204) | 0.7059 (0.6462-0.7633) |
| PLIP | 0.7772 (0.6673-0.8782) | 0.6879 (0.6125-0.7602) | 0.6675 (0.6069-0.7263) |
| Prov-GigaPath | 0.7652 (0.6454-0.8670) | 0.7523 (0.6801-0.8198) | 0.6919 (0.6292-0.7500) |
| Virchow | 0.7768 (0.6543-0.8781) | 0.7327 (0.6584-0.8046) | 0.6705 (0.6072-0.7324) |
| H-Optimus-0 | 0.8095 (0.7029-0.8986) | 0.7524 (0.6819-0.8192) | 0.6938 (0.6339-0.7512) |
| H-Optimus-1 | 0.7917 (0.6758-0.8888) | 0.7452 (0.6711-0.8139) | 0.6993 (0.6356-0.7586) |
| MUSK | 0.7703 (0.6567-0.8718) | 0.7473 (0.6778-0.8130) | 0.6914 (0.6328-0.7487) |
| Hibou-L | 0.7643 (0.6468-0.8659) | 0.7371 (0.6655-0.8046) | 0.6894 (0.6298-0.7480) |
| Model | Internal (H1) | External (H3) | External (H4) |
|---|---|---|---|
| ResNet50 | 0.7183 (0.6298-0.7955) | 0.6401 (0.5823-0.6963) | 0.6708 (0.6258-0.7158) |
| UNI | 0.7831 (0.7104-0.8504) | 0.6763 (0.6353-0.7177) | 0.7429 (0.7064-0.7801) |
| UNI2 | 0.8062 (0.7331-0.8724) | 0.6369 (0.6066-0.6687) | 0.7371 (0.6986-0.7764) |
| CONCH | 0.8176 (0.7510-0.8779) | 0.6741 (0.6363-0.7131) | 0.7513 (0.7158-0.7862) |
| CHIEF | 0.7631 (0.6866-0.8390) | 0.6333 (0.5997-0.6679) | 0.6944 (0.6551-0.7316) |
| GPFM | 0.7894 (0.7197-0.8558) | 0.6572 (0.6199-0.6963) | 0.7351 (0.6968-0.7718) |
| mSTAR | 0.7843 (0.7121-0.8520) | 0.6713 (0.6324-0.7169) | 0.7412 (0.7036-0.7789) |
| Virchow2 | 0.8226 (0.7587-0.8797) | 0.7122 (0.6731-0.7504) | 0.7566 (0.7184-0.7931) |
| CONCH1.5 | 0.8184 (0.7504-0.8810) | 0.6610 (0.6248-0.6994) | 0.7504 (0.7122-0.7872) |
| Phikon | 0.7815 (0.7013-0.8545) | 0.6619 (0.6172-0.7118) | 0.7208 (0.6782-0.7611) |
| CTransPath | 0.7730 (0.6979-0.8441) | 0.6450 (0.6066-0.6943) | 0.6983 (0.6614-0.7418) |
| Phikon2 | 0.7754 (0.6989-0.8487) | 0.6446 (0.6066-0.6827) | 0.7445 (0.7085-0.7801) |
| PLIP | 0.8007 (0.7397-0.8576) | 0.6976 (0.6534-0.7408) | 0.7075 (0.6670-0.7471) |
| Prov-GigaPath | 0.7913 (0.7177-0.8603) | 0.6710 (0.6266-0.7242) | 0.7442 (0.7072-0.7807) |
| Virchow | 0.7660 (0.6875-0.8410) | 0.6324 (0.5956-0.6759) | 0.7287 (0.6886-0.7665) |
| H-Optimus-0 | 0.8066 (0.7358-0.8720) | 0.6719 (0.6310-0.7107) | 0.7559 (0.7179-0.7931) |
| H-Optimus-1 | 0.8141 (0.7438-0.8819) | 0.6996 (0.6571-0.7482) | 0.7546 (0.7162-0.7914) |
| MUSK | 0.8179 (0.7608-0.8720) | 0.6995 (0.6590-0.7402) | 0.7203 (0.6840-0.7554) |
| Hibou-L | 0.7845 (0.6905-0.8689) | 0.6502 (0.6029-0.7064) | 0.7383 (0.6947-0.7781) |
| Model | OS (H3) | DFS (H3) |
|---|---|---|
| CHIEF | 0.6343 (0.5183-0.7338) | 0.7164 (0.5248-0.8343) |
| CONCH | 0.6481 (0.5468-0.7403) | 0.7202 (0.5377-0.8315) |
| CONCH1.5 | 0.6636 (0.5630-0.7570) | 0.7329 (0.5594-0.8374) |
| CTransPath | 0.6372 (0.5327-0.7357) | 0.7171 (0.5344-0.8377) |
| Prov-GigaPath | 0.6400 (0.5176-0.7494) | 0.7272 (0.5266-0.8387) |
| GPFM | 0.6403 (0.5213-0.7447) | 0.7180 (0.4973-0.8432) |
| H-Optimus-0 | 0.6518 (0.5222-0.7578) | 0.7216 (0.5108-0.8431) |
| H-Optimus-1 | 0.6596 (0.5407-0.7636) | 0.7299 (0.5397-0.8419) |
| Hibou-L | 0.6429 (0.4994-0.7562) | 0.7273 (0.5473-0.8453) |
| mSTAR | 0.6452 (0.5184-0.7523) | 0.7212 (0.5211-0.8357) |
| MUSK | 0.6529 (0.5479-0.7601) | 0.7122 (0.5327-0.8297) |
| Phikon | 0.6397 (0.5237-0.7425) | 0.7174 (0.5194-0.8318) |
| Phikon2 | 0.6414 (0.5296-0.7401) | 0.7183 (0.4870-0.8452) |
| PLIP | 0.6308 (0.5158-0.7320) | 0.7018 (0.5263-0.8198) |
| ResNet50 | 0.6357 (0.5363-0.7277) | 0.7149 (0.5435-0.8270) |
| UNI | 0.6450 (0.5150-0.7525) | 0.7219 (0.5301-0.8350) |
| UNI2 | 0.6488 (0.5400-0.7504) | 0.7323 (0.5414-0.8448) |
| Virchow | 0.6417 (0.5138-0.7501) | 0.7034 (0.5198-0.8229) |
| Virchow2 | 0.6640 (0.5482-0.7676) | 0.7229 (0.5230-0.8412) |
| Model | IDH Mutation | Pathological Subtype | WHO Grading |
|---|---|---|---|
| ResNet50 | 0.8308 (0.7553-0.8966) | 0.8587 (0.8056-0.9081) | 0.7689 (0.7006-0.8360) |
| UNI | 0.8905 (0.8169-0.9501) | 0.9067 (0.8411-0.9542) | 0.8535 (0.7936-0.9066) |
| UNI2 | 0.8869 (0.8194-0.9446) | 0.9469 (0.9086-0.9746) | 0.8724 (0.8203-0.9195) |
| CONCH | 0.8673 (0.7958-0.9282) | 0.8943 (0.8424-0.9400) | 0.8271 (0.7756-0.8766) |
| CHIEF | 0.8265 (0.7420-0.9038) | 0.8600 (0.7804-0.9155) | 0.8193 (0.7645-0.8725) |
| GPFM | 0.8886 (0.8183-0.9462) | 0.9255 (0.8720-0.9667) | 0.8422 (0.7821-0.8954) |
| mSTAR | 0.8848 (0.8118-0.9452) | 0.9125 (0.8511-0.9569) | 0.8561 (0.8031-0.9047) |
| Virchow2 | 0.8684 (0.7973-0.9290) | 0.9224 (0.8619-0.9678) | 0.8474 (0.7946-0.8986) |
| CONCH1.5 | 0.8629 (0.7880-0.9251) | 0.9097 (0.8647-0.9477) | 0.8292 (0.7754-0.8812) |
| Phikon | 0.8797 (0.8133-0.9369) | 0.9110 (0.8574-0.9539) | 0.8208 (0.7561-0.8810) |
| CTransPath | 0.8583 (0.7852-0.9260) | 0.8498 (0.7899-0.9066) | 0.8066 (0.7494-0.8618) |
| Phikon2 | 0.8743 (0.8020-0.9354) | 0.9223 (0.8626-0.9624) | 0.8410 (0.7738-0.8974) |
| PLIP | 0.8340 (0.7618-0.8996) | 0.8675 (0.8096-0.9160) | 0.7602 (0.6986-0.8203) |
| Prov-GigaPath | 0.8940 (0.8264-0.9496) | 0.9344 (0.8893-0.9666) | 0.8495 (0.7921-0.9026) |
| Virchow | 0.8404 (0.7212-0.9238) | 0.9006 (0.8394-0.9521) | 0.8226 (0.7569-0.8846) |
| H-Optimus-0 | 0.9013 (0.8389-0.9533) | 0.9205 (0.8700-0.9609) | 0.8571 (0.7979-0.9094) |
| H-Optimus-1 | 0.8915 (0.8213-0.9484) | 0.9400 (0.8948-0.9730) | 0.8670 (0.8113-0.9169) |
| MUSK | 0.8804 (0.8179-0.9337) | 0.8640 (0.8005-0.9239) | 0.8064 (0.7468-0.8642) |
| Hibou-L | 0.8579 (0.7784-0.9224) | 0.9053 (0.8490-0.9518) | 0.8329 (0.7730-0.8895) |
| Model | N staging (H8) | T staging (4 class, H8) | T staging (2 class, H8) |
|---|---|---|---|
| ResNet50 | 0.8553 (0.7826-0.9166) | 0.7797 (0.6815-0.8637) | 0.8556 (0.7330-0.9519) |
| UNI | 0.8961 (0.8310-0.9500) | 0.8455 (0.7650-0.9091) | 0.9052 (0.8028-0.9798) |
| UNI2 | 0.8818 (0.8145-0.9391) | 0.8633 (0.7913-0.9215) | 0.9062 (0.8026-0.9832) |
| CONCH | 0.8832 (0.8113-0.9420) | 0.8466 (0.7575-0.9155) | 0.8868 (0.7624-0.9751) |
| CHIEF | 0.9006 (0.8386-0.9511) | 0.8481 (0.7729-0.9113) | 0.8681 (0.7453-0.9621) |
| GPFM | 0.8901 (0.8260-0.9448) | 0.8542 (0.7786-0.9189) | 0.9152 (0.8247-0.9789) |
| mSTAR | 0.8970 (0.8342-0.9497) | 0.8561 (0.7897-0.9155) | 0.9084 (0.8080-0.9801) |
| Virchow2 | 0.8978 (0.8362-0.9494) | 0.8783 (0.8115-0.9319) | 0.9160 (0.8271-0.9838) |
| CONCH1.5 | 0.8868 (0.8211-0.9422) | 0.8576 (0.7856-0.9187) | 0.8956 (0.7939-0.9766) |
| Phikon | 0.8834 (0.8190-0.9390) | 0.8528 (0.7767-0.9129) | 0.9067 (0.8046-0.9782) |
| CTransPath | 0.9126 (0.8566-0.9586) | 0.8072 (0.6977-0.8932) | 0.8531 (0.7064-0.9626) |
| Phikon2 | 0.8848 (0.8196-0.9403) | 0.8450 (0.7666-0.9118) | 0.8909 (0.7789-0.9752) |
| PLIP | 0.8929 (0.8311-0.9448) | 0.8881 (0.8154-0.9440) | 0.8828 (0.7437-0.9817) |
| Prov-GigaPath | 0.8990 (0.8356-0.9515) | 0.8644 (0.7952-0.9230) | 0.8895 (0.7615-0.9790) |
| Virchow | 0.8794 (0.8036-0.9375) | 0.8615 (0.7937-0.9207) | 0.9049 (0.8038-0.9789) |
| H-Optimus-0 | 0.8930 (0.8286-0.9463) | 0.8725 (0.7972-0.9306) | 0.9063 (0.7983-0.9846) |
| H-Optimus-1 | 0.8927 (0.8293-0.9466) | 0.8864 (0.8295-0.9358) | 0.9291 (0.8360-0.9918) |
| MUSK | 0.9047 (0.8450-0.9544) | 0.8511 (0.7728-0.9150) | 0.8487 (0.6983-0.9642) |
| Hibou-L | 0.8748 (0.7900-0.9363) | 0.8403 (0.7523-0.9105) | 0.8704 (0.7227-0.9717) |
| Model | TNM Staging | Consensus Molecular Subtyping |
|---|---|---|
| ResNet50 | 0.8724 (0.8207-0.9181) | 0.5919 (0.5120-0.6726) |
| UNI | 0.9076 (0.8641-0.9441) | 0.7567 (0.6788-0.8307) |
| UNI2 | 0.9050 (0.8625-0.9413) | 0.7735 (0.7004-0.8419) |
| CONCH | 0.9096 (0.8633-0.9491) | 0.7344 (0.6607-0.8042) |
| CHIEF | 0.9197 (0.8828-0.9519) | 0.7559 (0.6627-0.8300) |
| GPFM | 0.9272 (0.8894-0.9587) | 0.7565 (0.6847-0.8251) |
| mSTAR | 0.9095 (0.8682-0.9448) | 0.7547 (0.6767-0.8311) |
| Virchow2 | 0.9138 (0.8750-0.9478) | 0.7756 (0.7087-0.8380) |
| CONCH1.5 | 0.9244 (0.8865-0.9558) | 0.7217 (0.6440-0.7942) |
| Phikon | 0.9072 (0.8639-0.9438) | 0.7572 (0.6824-0.8269) |
| CTransPath | 0.9155 (0.8777-0.9486) | 0.7498 (0.6725-0.8223) |
| Phikon2 | 0.9265 (0.8898-0.9573) | 0.7509 (0.6782-0.8211) |
| PLIP | 0.9096 (0.8689-0.9457) | 0.7015 (0.6186-0.7814) |
| Prov-GigaPath | 0.9174 (0.8771-0.9509) | 0.7536 (0.6801-0.8234) |
| Virchow | 0.9090 (0.8665-0.9475) | 0.7517 (0.6773-0.8201) |
| H-Optimus-0 | 0.9097 (0.8687-0.9460) | 0.7808 (0.7094-0.8448) |
| H-Optimus-1 | 0.9120 (0.8692-0.9471) | 0.7814 (0.7051-0.8499) |
| MUSK | 0.9201 (0.8777-0.9541) | 0.7196 (0.6486-0.7873) |
| Hibou-L | 0.8906 (0.8365-0.9344) | 0.6532 (0.5657-0.7410) |
| Model | OS (H8) | DFS (H8) | DSS (H1) |
|---|---|---|---|
| CHIEF | 0.7482 (0.6549-0.8319) | 0.7372 (0.6062-0.8450) | 0.7035 (0.4491-0.9212) |
| CONCH | 0.7472 (0.6472-0.8374) | 0.7197 (0.6068-0.8363) | 0.7256 (0.4554-0.9346) |
| CONCH1.5 | 0.7522 (0.6505-0.8418) | 0.7188 (0.5985-0.8441) | 0.7437 (0.4918-0.9326) |
| CTransPath | 0.7570 (0.6685-0.8367) | 0.7373 (0.6141-0.8478) | 0.7311 (0.4654-0.9316) |
| Prov-GigaPath | 0.7318 (0.6382-0.8159) | 0.7319 (0.6103-0.8687) | 0.7176 (0.4868-0.9194) |
| GPFM | 0.7370 (0.6357-0.8293) | 0.7321 (0.6058-0.8620) | 0.7372 (0.4649-0.9375) |
| H-Optimus-0 | 0.7415 (0.6440-0.8302) | 0.7362 (0.6165-0.8707) | 0.7327 (0.5036-0.9256) |
| H-Optimus-1 | 0.7393 (0.6405-0.8309) | 0.7375 (0.6180-0.8693) | 0.7520 (0.5286-0.9228) |
| Hibou-L | 0.7161 (0.6053-0.8099) | 0.7052 (0.5469-0.8472) | 0.7258 (0.4925-0.9219) |
| mSTAR | 0.7474 (0.6441-0.8384) | 0.7345 (0.6088-0.8635) | 0.7420 (0.5252-0.9282) |
| MUSK | 0.7417 (0.6270-0.8312) | 0.7209 (0.6097-0.8416) | 0.7162 (0.4328-0.9223) |
| Phikon | 0.7281 (0.6284-0.8182) | 0.7284 (0.5961-0.8584) | 0.7227 (0.4806-0.9158) |
| Phikon2 | 0.7357 (0.6231-0.8332) | 0.7260 (0.5860-0.8554) | 0.6935 (0.4582-0.8938) |
| PLIP | 0.7242 (0.6075-0.8231) | 0.7092 (0.5954-0.8268) | 0.6953 (0.4033-0.9100) |
| ResNet50 | 0.7226 (0.6052-0.8271) | 0.7088 (0.5873-0.8205) | 0.6654 (0.3920-0.8936) |
| UNI | 0.7457 (0.6452-0.8356) | 0.7327 (0.6066-0.8578) | 0.7555 (0.5434-0.9352) |
| UNI2 | 0.7440 (0.6374-0.8390) | 0.7338 (0.6142-0.8639) | 0.7506 (0.4972-0.9430) |
| Virchow | 0.7300 (0.6269-0.8213) | 0.7128 (0.5932-0.8546) | 0.7619 (0.5223-0.9446) |
| Virchow2 | 0.7398 (0.6351-0.8314) | 0.7322 (0.6222-0.8606) | 0.7678 (0.5256-0.9369) |
| Hyperparameter | Classification | Survival |
|---|---|---|
| Hidden dim | 512 | 512 |
| Dropout | 0.25 | 0.25 |
| Batch size | 1 | 1 |
| Epochs | 50 | 30 |
| Optimizer | Adam | Adam |
| Learning rate | 2.00E-04 | 2.00E-04 |
| Scheduler | Cosine | Cosine |
| Weight decay | 1.00E-05 | 1.00E-05 |
| Loss | Cross-entropy | NLL |