A frequentist view on the two-body decaying dark matter model
Abstract
Decaying dark matter (DDM) has emerged as an interesting framework to extend the -cold-dark-matter (CDM) model, as many particle physics models predict that dark matter may not be stable over cosmic time and can impact structure formation. In particular, a model in which DM decays at a rate and imprints a velocity kick onto its decay products leads to a low amplitude of fluctuations, as quantified by the parameter , in better agreement with that measured by some past weak lensing surveys. Bayesian analyses have provided mixed conclusions regarding its viability, with a reconstructed clustering amplitude only slightly below the standard CDM value. In this paper, we contrast previous results with a frequentist analysis of Planck and SDSS BAO data. We find that the confidence level region corresponds to a decay half-life of and a velocity kick of km/s. These constraints strongly differ from their Bayesian counterparts, indicating the presence of volume effect in the Bayesian analysis. Moreover, we find that under the DDM model, the frequentist analysis predicts lower values of , in agreement with those found by KiDS-1000 and DES-Y3 at . We further show that previously derived KiDS-1000 constraints that appeared to exclude the best-fit model from Planck data were driven by priors on the primordial amplitude and spectral index . When those are removed from the analysis, KiDS-1000 constraints on the DDM parameters are fully relaxed. It is only when applying Planck-informed priors on and to the KiDS-1000 analysis that one can constrain the model. We further highlight that in the absence of such priors, the region of scales best-measured by KiDS-1000 does not exactly match the kernel (centred around Mpc), but rather a slightly smaller range of scales centred around Mpc. One must thus be careful in applying constraints to a model instead of the full data likelihood.
I Introduction
Over the past decades, the CDM (“Lambda” Cold Dark Matter) cosmological model has emerged as the standard paradigm for describing the Universe, providing an excellent fit to a wide range of observations spanning both early and late cosmic times. From the precise measurements of the Cosmic Microwave Background (CMB) and Big Bang Nucleosynthesis (BBN) to large-scale structure surveys, baryon acoustic oscillations (BAO), and supernovae type Ia (SNIa), the CDM framework has proven remarkably successful. Nonetheless, despite its empirical success, the fundamental nature of its dominant constituents – cold dark matter (CDM) and dark energy () – remains unknown, and tensions have emerged as the precision of cosmological data has improved.
Among the most prominent of these discrepancies is the so-called tension, referring to the disagreement between the amplitude of matter fluctuations inferred from high-redshift CMB data and direct measurements at low redshift from weak lensing (WL) surveys. The parameter , where quantifies the matter fluctuation amplitude on Mpc scales and the total matter density, encapsulates this tension under CDM. For instance, the Planck satellite has measured Aghanim et al. (2020a), while weak lensing surveys like the Kilo-Degree Survey (KiDS) Kuijken et al. (2019); Giblin et al. (2021), the Dark Energy Survey (DES) Amon et al. (2022), and the Hyper Supreme-Cam (HSC) Hamana et al. (2020) measure consistently lower values, such as in KiDS-1000 Busch et al. (2022). However, more recent analyses such as DES-Y3 Abbott et al. (2022) and the KiDS-Legacy results Stölzner et al. (2025) strongly mitigate the existence of a tension. The large constraining power of weak lensing will be vastly used by the Vera Rubin observatory Ivezić et al. (2019), Euclid Mellier et al. (2025), Nancy Grace Roman Space Telescope Spergel et al. (2015) and the Chinese Space Station Telescope Gong et al. (2019). Hence, we should expect definitive answers regarding small-scale physics in the next few years. However, whether or not there is an tension, constraining physically motivated models remains crucial, given that the nature of CDM is still entirely unknown.
While an tension might also emerge from small-scale physics such as baryonic feedback or nonlinear structure formation Tan et al. (2023); Amon and Efstathiou (2022); Aricò et al. (2023), it could also point to the need for new physics beyond the standard model. Among the many proposed extensions to CDM, a particularly well-motivated class involves modifying the properties of dark matter itself, see e.g. Refs. Schneider et al. (2020); Heimersheim et al. (2020); Joseph et al. (2023); Poulin et al. (2023); Ferlito et al. (2022) for recent models. In this context, decaying dark matter (DDM) scenarios Enqvist et al. (2015, 2020); Murgia et al. (2017); Franco Abellán et al. (2021) have received growing attention Chen et al. (2021); Choi and Yanagida (2022); Tanimura et al. (2023); Bucko et al. (2023, 2024), as they can naturally predict a suppression of power on small scales (Mpc), thereby alleviating the tension.
Many particle physics-motivated scenarios of dark matter Hambye (2011); Abazajian et al. (2012); Drewes et al. (2017); Berezinsky et al. (1991); Covi et al. (1999); Kim and Kim (2002); Feng et al. (2003); Fuß et al. (2025) question its stability on cosmological timescales and can effectively be described by a two-body DDM model. While the DDM framework has attracted attention for its potential to ease the tension, disfavoring it – as suggested by recent weak lensing measurements from DES-Y3 Abbott et al. (2022) and KiDS-Legacy Stölzner et al. (2025) – would have broader implications, potentially ruling out a wide class of unstable dark matter models.
The most simple class of DDM considers the decay of CDM into dark radiation, for which strong constraints can be obtained with CDM data Nygaard et al. (2021); Holm et al. (2023); Simon et al. (2022); Bucko et al. (2024). Another kind of interesting variant is the two-body decaying dark matter model (DDM) Wang and Zentner (2012), in which a fraction of the CDM decays into a massive daughter particle and a massless component (e.g. dark radiation). The massive product inherits a velocity kick from energy-momentum conservation, leading to a scale-dependent suppression of the matter power spectrum due to its free-streaming. This mechanism can alter structure formation like warm dark matter, but with a redshift and scale dependence that can leave the early time unchanged compared to CDM.
Previous studies have investigated the phenomenology of the DDM model using linear perturbation theory Wang and Zentner (2012); Franco Abellán et al. (2021) or simulations Peter and Benson (2010); Cheng et al. (2015). Constraints have been performed using the Planck CMB data, BAO and supernova Franco Abellán et al. (2021), BOSS full shape Simon et al. (2022), Milky Way satellite counts Mau et al. (2022), and Lyman- forest observations Wang et al. (2013); Fuß and Garny (2023). More recently, Ref. Bucko et al. (2024) used the weak lensing survey KiDS-1000 to derive the strongest constraints obtained. As far as the two-body decay is concerned – see Ref. Holm et al. (2023) for a profile likelihood analysis of the DDM model decaying into radiation – all these studies have used the standard Bayesian framework which is known to be affected by prior volume effects Nygaard et al. (2023).
In this work, we further explore the DDM scenario in light of the latest cosmological observations. We perform an independent analysis of KiDS-1000 cosmic shear data using a nonlinear matter power spectrum emulator developed in Ref. Bucko et al. (2024), and reanalyse the Planck 2018 CMB data, adding also BAO and supernovae, to extract updated constraints using a frequentist analysis to get rid of any prior volume effects. We also combine both datasets using Planck informed priors to assess the potential of this scenario to reconcile CMB and WL observations.
This paper is structured as follows: Section II introduces the DDM model, the dataset and the methodology used. In Section III, we present the standard Bayesian results and the Planck likelihood profiles analysis. Section IV discusses the constraints of KiDS-1000 and proposes a consistent KiDS-1000 and Planck joint analysis. The conclusions are presented in Section V.
II Model and Methodology
The standard cosmological model, flat CDM, is characterised by a set of fundamental parameters describing the evolution, composition and initial conditions of the Universe. These include the Hubble constant , the cold dark matter density parameter , the baryon energy density , and the photon energy density, which is now well constrained through the monopole temperature of the CMB, measured to be K Fixsen (2009). Motivated by single-field inflation models, the primordial initial conditions are assumed to be Gaussian and adiabatic perturbations, with a power spectrum following a power law with amplitude and spectral index .
We now focus on the scenario where CDM particles are unstable and can decay into a lighter particle and a massless relativistic particle.
II.1 Two-Body Decaying Dark Matter
In this work, we focus on the DDM model in which a CDM particle of mass decays into two lighter particles: a massive “warm” daughter particle of mass and a massless relativistic particle. The decay is characterised by the decay rate , which is inversely proportional to the particle’s lifetime. The warm daughter particle inherits a velocity kick . Given by the kinematic relation of the decay, the fraction of rest-mass energy of the mother particle converted into kinetic energy reads:
| (1) |
In the non-relativistic limit, the velocity kick is given by . A third parameter, , represents the fraction of unstable CDM that decays into WDM. In this analysis, we focus on the case , where all the CDM decays into WDM. A thorough account of the phenomenology of this model and the corresponding set of dynamical equations are presented in Refs. Blackadder and Koushiappas (2014); Franco Abellán et al. (2021).
Note that the CDM limit is recovered when the decay lifetime greatly exceeds the age of the Universe () or when the momentum transfer is negligible (), leaving the daughter particle effectively cold. The limit () corresponds to a one-body decay with the daughter particle acting effectively as dark radiation.
The momentum transfer to the daughter particle generates a time- and scale-dependent free-streaming scale. Below this scale, density perturbations are suppressed because the pressure of the warm daughter particle counteracts gravitational collapse. The time dependence of this effect is governed by the dark matter lifetime , such that only perturbation modes below the free-streaming scale are significantly affected after times . Consequently, perturbations evolve similarly to those of standard CDM for times and on scales larger than the free-streaming scale. This allows the model to reproduce the CMB temperature, polarisation and lensing anisotropies with a CDM-like behaviour while still reducing small-scale power in the late-time matter power spectrum due to the suppression of growth at small scales. The depth and the scale of the matter power suppression are controlled by and , respectively.
The growth of cosmic structures is often quantified by the variance of matter fluctuations smoothed over a scale , defined as:
| (2) |
where is the Fourier transform of a top-hat filter, is the corresponding wavenumber in Fourier space and is the matter power spectrum:
| (3) |
where is the total matter density contrast, and is the Dirac-delta function. The characteristic scale of cosmic-structure formation is usually taken to be Mpc, in which case we refer to in Eq. 2. The key signature of the warm dark matter species is to predict a smaller value of than CDM. However, weak lensing measurements are sensitive to both the amplitude of matter fluctuations, , and the total matter density, , leading to a degeneracy between these parameters. This motivates the use of the derived parameter
| (4) |
The linear evolution of the DDM model has been implemented in the Einstein-Boltzmann solver CLASS Lesgourgues (2011); Blas et al. (2011) and made publicly available Franco Abellán et al. (2021). This allows efficient numerical computation of the linear power spectrum and the CMB angular power spectra :
| (5) |
where is the Kronecker-delta, and denote temperature, polarisation, or lensing fields.
For late-time probes, such as the case of galaxy weak lensing, which we will consider, nonlinear corrections are required. The nonlinear matter power spectrum is often computed using Halofit Takahashi et al. (2012); Smith et al. (2003), calibrated on CDM simulations. DDM N-body simulations have been performed in Ref. Cheng et al. (2015). Here, the latest nonlinear power spectrum emulation of Ref. Bucko et al. (2024) is employed. Their emulator, DMemu Bucko et al. (2024), provides the nonlinear suppression factor:
| (6) |
A significant source of potential degeneracies is baryonic effects, which also affect small-scale power, necessitating careful modelling Giri and Schneider (2021). To include them, we use the same methodology as in Ref. Abbott et al. (2023), which consists of marginalising over the baryonic feedback parameter using HMcode2020 Mead et al. (2021).
II.2 Datasets and Methodology
In this work, we use two datasets labelled “Planck” and “KiDS-1000”.
-
•
Planck refers to the standard Planck CMB data compiled in the Plik 2018 likelihood Aghanim et al. (2020b), including high- and low- temperature, polarisation, and cross-correlations, as well as lensing Aghanim et al. (2020c). In addition, we include the BAO measurements from the low-redshift surveys 6dFGS Beutler et al. (2011) and SDSS DR7 Ross et al. (2015), as well as the full BOSS DR12 Alam et al. (2017). Finally, we include the Pantheon-Plus compilation of Type Ia supernovae distance moduli measurements Brout et al. (2022).
-
•
the Kilo-Degree Survey KiDS-1000 Asgari et al. (2021), also labeled as “KiDS”, is a galaxy catalog providing information about million galaxies divided into redshift bins covering a range of . The catalogue is analysed by the European Southern Observatory with the Very Large Telescope (VLT). We use the likelihood COSEBIs Schneider et al. (2010); Asgari et al. (2012, 2017).111Short before submission of this paper, the last data release was performed under the name KiDS-Legacy Stölzner et al. (2025).
To analyse these two datasets within the theoretical framework of Section II.1, we first perform a Bayesian analysis using the standard Markov Chain Monte Carlo (MCMC) method Metropolis et al. (1953); Hastings (1970). For the Planck analysis, we use MontePython Brinckmann and Lesgourgues (2019); Audren et al. (2013). For practical reasons, we use CosmoSIS Zuntz et al. (2015), which directly includes the COSEBIs likelihood, as well as more recent likelihoods such as DES-Y3 Abbott et al. (2022), and their joint analysis Abbott et al. (2023) which will be used in future works. We vary all 6-CDM parameters within large flat priors. This is particularly important for and , as we show later on. The DDM parameters are varied within log-flat priors in the Planck analysis:
| (8) |
For KiDS-1000, we restrict the priors to
| (9) |
to match the regime of validity of the emulator in Eq. 6.
Bayesian analyses can suffer from strong prior dependence. Even though the intrinsic interpretation of Bayesian and frequentist approaches differ and cannot strictly be compared, frequentist analyses provide prior-independent constraints that help disentangle the impact of the priors from that of the likelihood in Bayesian inferences.
To that end, frequentist analyses employ the “profile likelihood” method. Instead of marginalising over nuisance parameters as in Bayesian MCMC, the profile likelihood for a parameter set is defined as:
| (10) |
where is the full likelihood function, represents all parameters to be minimised and the subset of parameter to study. In our specific case, the parameters of interest are , while includes all remaining cosmological and nuisance parameters over which the likelihood is maximised. For Gaussian likelihoods, we have which allows us to determine confidence intervals from where here represents the global maximum likelihood of the DDM model, hence taking also as free parameter. To compare the improvement of a model with respect to a reference model – here CDM – we compare their global minima . We minimise using a simulated annealing method described in Ref. Hannestad (2000).
III Bayesian vs Frequentist Analyses
III.1 Bayesian constraints from Planck and KiDS-1000
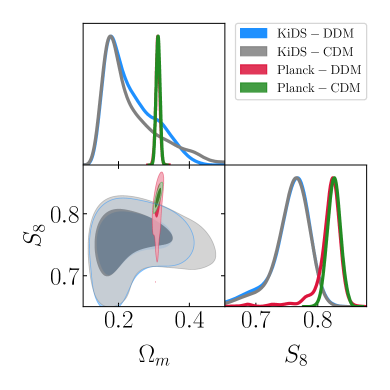
In Fig. 1, we reproduce the standard Bayesian analysis for DDM and CDM using the two aforementioned data sets. We show the 2D marginalised posteriors for relevant parameters in the two models: DDM in blue and red, for KiDS-1000 and Planck, respectively, and grey and green for the standard CDM model for KiDS-1000 and Planck, respectively. In agreement with what has been discussed in past literature, e.g. Ref. Asgari et al. (2021); Bucko et al. (2024), we can see how KiDS-1000, as well as Planck, independently provide precise measurements of . Famously, the so-called tension appears as a discrepancy between Planck and KiDS-1000 for the CDM model. In that regard, the DDM model helps decrease the tension by extending the Planck contour toward the low- KiDS-1000 contours. This apparently small improvement should be taken with caution because the DDM parameter space is not well constrained and can, therefore, be subject to a significant volume effect that alters the reconstructed posteriors in a Bayesian analysis. Moreover, as mentioned in the introduction, more recent data such as the DES-Y3 Abbott et al. (2022) and the KiDS-Legacy results Stölzner et al. (2025) do not show any tension between these two datasets. What we see here is, therefore, likely due to systematic effects in the KiDS-1000 analysis pipeline (see Wright et al. (2025) for details).
III.2 Planck Profile Likelihood
We now compute the 1- and 2-dimensional profile likelihood of the two additional parameters of the DDM model and for the Planck data set and discuss their consistency with the KiDS-1000 measurements of . We focus in the main text on the case of Planck data because we have found that the KiDS-1000 profile is strongly affected by the boundary set to one of the nuisance parameters, making difficult the interpretation of the frequentist analysis of KiDS-1000. Concretely, the galaxy intrinsic alignment model parameters (i.e. the intrinsic alignment redshift dependence in CosmoSIS and in Ref. Abbott et al. (2023)) seems inconsistent between KiDS-1000 or DES-Y3 compared to direct observation, see footnote in Ref. Abbott et al. (2023). A flat prior is adopted on this parameter, making it reach the boundaries during the minimisation procedure, potentially spoiling the results, which at the same time reach the upper bound of the prior on . We present this analysis in Appendix A and focus here on the case of Planck.
We first run a global minimisation and find a global improvement of the DDM fit compared to CDM of
| (11) |
corresponding to values
| (12) |
Interestingly, this value of lies at the edge of the Bayesian posterior reconstructed from the analysis of Planck data (from Fig. 1 we obtain ), indicating the presence of a significant volume effect as anticipated. In fact, it is even below the interval measured by KiDS-1000. Computing the profile likelihood will thus allow us to derive prior-independent confidence intervals and robustly establish the extent to which the DDM model can reduce and fit both Planck and KiDS-1000 data.
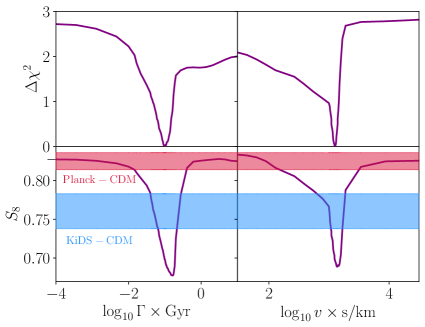
III.2.1 1-dimensional profile
In Fig. 2, we show the profile likelihood as a function of and on the first and second columns, respectively, by using Eq. 10. The top and bottom panels show respectively the and the derived parameter computed at the maximum likelihood . We show the reconstructed value of in the KiDS-1000 analysis as a blue band and the Planck CDM prediction as a red band in the bottom panels of Fig. 2. Confidence intervals can be extracted from the profile using the Neyman construction Neyman (1937), which for 1D profile amounts to computing at 68% (95%) C.L. This procedure yields
| (13) |
where we have defined to be the half-life of DDM and and are respectively the present and initial number of DDM particles. Interestingly, rather than exclusion, the profile likelihood suggests that a specific region of values of and is weakly favoured over the CDM model, although the CDM limit is obtained at . Hence, our best-fit and credible interval give us a half-life of Gyr, which means that of the initial DDM particles would have already decayed today. We anticipate that including information from the full shape galaxy power spectrum would alter those constraints, see e.g. Ref. Simon et al. (2022), and we leave a dedicated combined analysis for future work.
Since low values of indicate a large lifetime compared to the age of the Universe while low suggests that the decay products remain cold, we trivially recover in these two limits the CDM case and its CDM value. For too large values of or , corresponding to either quick decays or hot decay products, the CDM limit is also recovered: the algorithm simply adjusts whichever decay parameter is allowed to freely vary to its CDM limit to prevent a degradation of the fit. Consequently, one recovers again the CDM value of . Importantly, one can see that the KiDS-1000 band corresponds to consistently better values than the Planck CDM band. This suggests that the DDM model can indeed accommodate the low value measured by KiDS-1000 despite the apparent Bayesian constraints.
III.2.2 2-dimensional profile
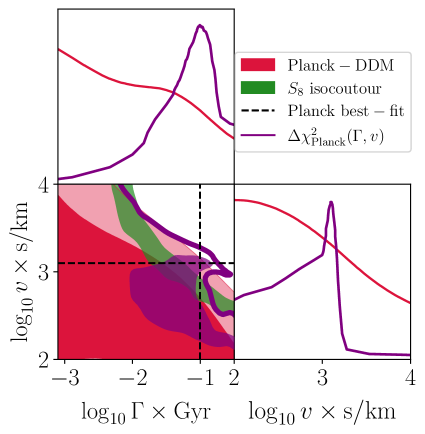
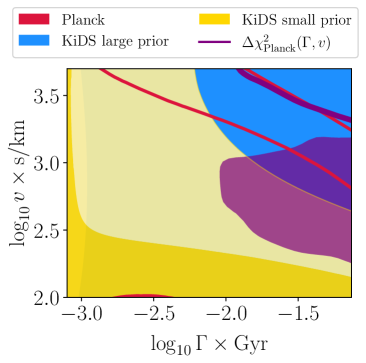
We show in Fig. 3 the comparison between Bayesian and frequentist intervals reconstructed from the analysis of Planck data in the 2-dimensional plane, as well as in the 1-dimensional case for each parameter. In the frequentist case, shown in purple, we display the 2-dimensional confidence intervals derived with the Neyman construction at () and () and the -dimensional profile of Fig. 2 normalised to unity. The marginalised Bayesian posteriors reconstructed from Planck are instead shown in red and are similar to those presented in Refs. Bucko et al. (2024); Franco Abellán et al. (2022). In green, we show the isocontours of for the lower and upper limits of the KiDS-1000 measurements , similar to the blue band of Fig. 2. The global minimum is highlighted with the black dashed line, and we recall that it is associated with a low value of , according to Eq. 12.
First and foremost, one can see that the 1 confidence intervals differ from their Bayesian counterparts, confirming the presence of a volume effect. The frequentist interval reveals a closed contour at , indicating a slight preference for a specific DDM parameter region within Planck data. However, the improvement in the fit is too small to overcome the large prior volume, disfavoring the DDM model in the Bayesian analysis. This is similar to what was found in Ref. Holm et al. (2023) in a decaying dark matter model with massless decay products.
Second, it is striking that the values reconstructed from the KiDS-1000 analysis (green band) intersect the confidence interval. This confirms that Planck data can indeed accommodate a low value within the DDM model at . Note also that the confidence intervals follow the Bayesian contours at , indicating that volume effects are negligible at that level and that the 2 constraints are robust.
IV KiDS-1000 analysis
IV.1 What KiDS-1000 Actually Measures
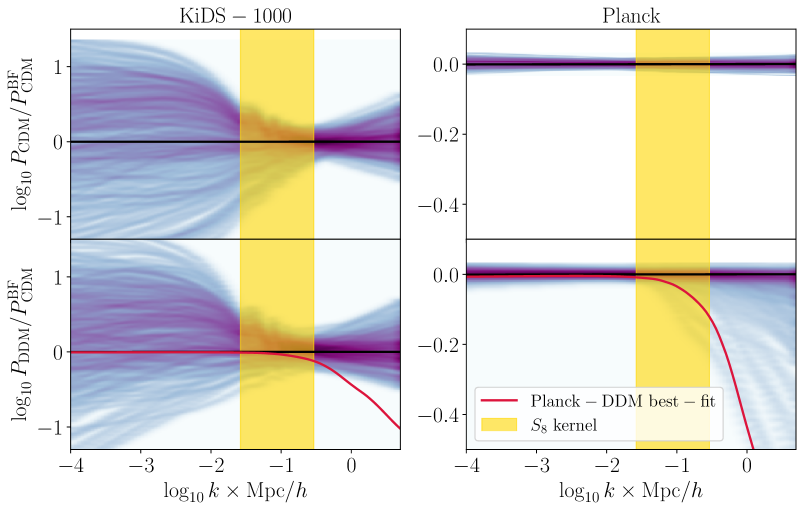
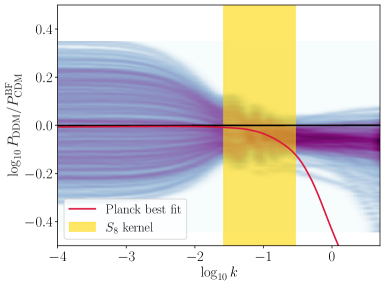
To better understand the origin of the data constraining power and the tension, we show in Fig. 4 the constraints to the matter power spectrum obtained with the KiDS-1000 weak lensing survey (left panels) and the Planck CMB survey (right panels). There, we have computed the power spectra of random points in the CDM (upper panels) and DDM (lower panels) models taken from their respective MCMC chains and plotted the density of points, all normalised to the best-fit CDM model. In red, we also show the best-fit to Planck data in the DDM model. We can, therefore, see the Bayesian constraints on the matter power spectrum for each scale directly by eye. The yellow band represents the main support of the kernel . The power spectra with less power in this region correspond to a lower value.
This figure is instructive in several ways: first, it shows that, for Planck and in the CDM case (top right panel), the power spectrum is highly constrained at all scales at a level. However, a large power suppression is allowed in the DDM model (bottom right panel), starting precisely around the kernel and extending to smaller scales. In that sense, the DDM model can alleviate the tension: it reduces without spoiling the fit to the CMB. However, one can see that the largest density of points reconstructed in a Bayesian analysis remains compatible with CDM and no suppression. However, the best-fit to Planck data in the DDM model lies on the edge of the point density region, another illustration of the prior volume effect we studied.
Second, it is apparent that KiDS-1000 data only constrain a range of small scales close to the band. However, the band does not perfectly overlap with the region of highest density of points and strongest constraints. In fact, it appears that KiDS-1000 data would better constrain a kernel centred around Mpc/h. The data lacks effective constraining power at large scales, and the constraints are independent of the model (DDM or CDM). This explains why the reconstructed value in Fig. 1 remains consistent across both models. A power suppression within the DDM model is degenerate with changes in and ; thus, opening up the DDM parameter space does not significantly affect the reconstructed matter power spectrum. Moreover, this suggests that constraints “from KiDS-1000 alone” on the DDM model are prior dependent and that in the absence of any priors on and , this data set does not significantly constrain the DDM model. This will be demonstrated explicitly in the next section. To break the degeneracy between all parameters in the DDM model, one needs to combine observations that probe all scales, e.g., combining Planck constraints to and with KiDS-1000.
IV.2 Prior Dependence of KiDS-1000 Constraints
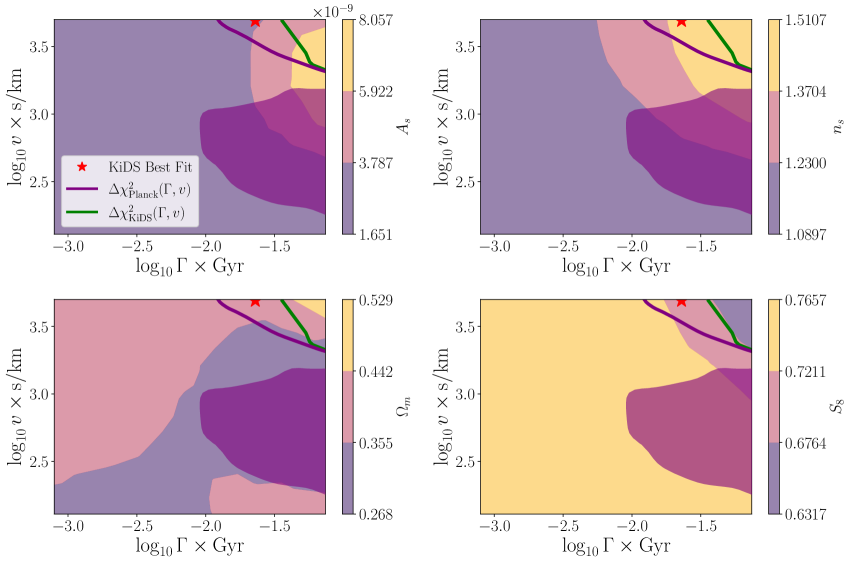
In Fig. 5 we show the reconstructed Bayesian posteriors from the analysis of KiDS-1000 data alone in the plane. To illustrate the importance of the priors set on and for the constraints derived on the DDM parameters, we show results for two different sets of priors, given in Table 1.
| Parameter | Large prior | Small prior |
|---|---|---|
The smaller prior range is similar to that used in Ref. Bucko et al. (2024). We further compare these constraints with those from Planck derived both in a Bayesian and a frequentist framework. Note that the emulator of Eq. 6 does not span the whole range of and that we studied for Planck. In particular, the best-fit obtained with Planck data corresponds to a value of slightly above its upper limit in the range of the emulator.
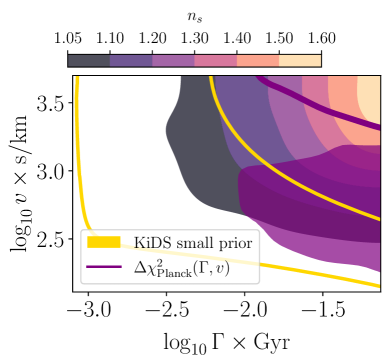
One can see that when we use large priors on and (in blue), we obtain no constraints in the range of parameters spanned by the emulator, while when we use small priors (in yellow) similar to Ref. Bucko et al. (2024), we exclude a large region of the parameter space corresponding to high values of and . This behaviour can be understood by looking at the correlation between the spectral index and the plan , depicted in Fig. 6. The coloured bands correspond to isocontours of values. It is clear that and are strongly correlated with the value of that reaches for models with high and . This demonstrates that, as anticipated from our discussion of Fig. 4, one can compensate for the effect of a power suppression in the DDM model by adjusting the spectral tilt.
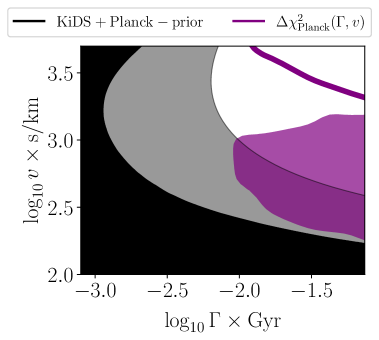
However, it is clear that imposing Planck priors on and in the KiDS-1000 analysis can prevent the strong degeneracy that we have uncovered from affecting the resulting constraints on the DDM parameters. We show in Fig. 7 the impact of imposing Planck constraints to and as Gaussian priors through the black contours, with values provided in Table 2. All the upper right part of the plan is now consistently excluded. Interestingly, one can identify a region of the parameter space at the intersection of the confidence level built from Planck data and the constraints from KiDS-1000. This is precisely the region that was found to alleviate the tension in past studies Franco Abellán et al. (2022, 2021); Simon et al. (2023); Bucko et al. (2024). As KiDS-1000 data have recently been updated in KiDS-Legacy Stölzner et al. (2025), whether the new data would firmly rule out this region remains to be confirmed. This figure also illustrates the power of multi-probe and multi-scale cosmological analyses: the constraining power of Planck at large scales allowed to obtain accurate and constraints, while the constraints from KiDS-1000 at small-scales constrain and therefore the DDM parameters.
Summarising, our results are nicely illustrated by the combined Bayesian constraints on the matter power spectrum shown from KiDS-1000 with Planck priors on and , shown in Fig. 8. One can see that with such priors, the -kernel does match the best constrained area, although it extends to even smaller scales. In that case, the Planck best-fit DDM model appears to be excluded as it predicts a too strong suppression above /Mpc. However, constraints to the matter power spectrum relax at scales /Mpc. This result underscores the constraining power of large-scale structure data beyond the sole statistic and highlights the importance of consistent, physically motivated priors when combining early- and late-time cosmological observations to constrain DM properties.
| Dark matter model | CDM | DDM | |||
|---|---|---|---|---|---|
| Dataset | Planck | KiDS-1000 | Planck | KiDS-1000 | KiDS-1000+Planck Prior |
| n/a | n/a | ||||
V Conclusions
We have investigated the two-body Decaying Dark Matter (DDM) model as an extension of the standard cosmological scenario, in which cold dark matter particles decay into a warm daughter particle and a massless dark relativistic particle Wang and Zentner (2012); Franco Abellán et al. (2021). This framework introduces two new physical parameters related to the decay dynamics: the decay rate and the momentum transfer . For sufficiently small values of these parameters, the model reproduces standard CDM predictions at early times, including CMB anisotropies with pure CDM component, while introducing distinctive late-time effects such as a time- and scale-dependent suppression of power on small scales. The ability of this model to relax late-time constraints on the properties of dark matter makes it a compelling candidate for addressing tensions in large-scale structure observations. Overall, it allows us to test the stability of dark matter on cosmological time scales, as unstable dark matter candidates naturally arise in many particle physics models Hambye (2011); Abazajian et al. (2012); Drewes et al. (2017); Berezinsky et al. (1991); Covi et al. (1999); Kim and Kim (2002); Feng et al. (2003).
Using the matter power spectrum prediction in the linear regime, Blackadder and Koushiappas (2014); Franco Abellán et al. (2021) and nonlinear regime calibrated on simulations Bucko et al. (2024), we have performed a standard Bayesian analysis of Planck-2018 + BOSS-BAO + the Pantheon-Plus supernovae data (referred to as “Planck”) on the one hand, and KiDS-1000 data on the other hand, reproducing previous results that suggest a limited ability of the DDM model to alleviate the tension between Planck and KiDS-1000 data. However, we have pointed out that the lack of constraints on the new DDM parameters can easily induce large volume prior effects that could alter the consistency of the two datasets.
To bypass this problem, we have performed for the first time a frequentist analysis of the DDM model in light of Planck data. Interestingly, we have found a 68% confidence level that strongly differs from its Bayesian counterparts, with the hint of a slight preference for a specific region of the DDM parameter space that allows to reduce . This confirms the presence of volume effects in the Bayesian analysis. In fact, we have found that the value reconstructed in the frequentist analysis is in agreement at with that of KiDS-1000, with a best-fit that is even lower, . At the 95% confidence level, frequentist and Bayesian constraints agree, and volume effects are negligible.
In a second part, we have discussed the constraints set by the different surveys directly at the level of the matter power spectrum in order to better understand the origin of the tension and its resolution within the DDM model. We have shown that Planck data can constrain large scales precisely but allow for significant power suppression precisely in the range of scales probed by KiDS-1000. On the other hand, KiDS-1000 do not allow to significantly constrain large-scales and small-scales independently (in particular and ). It only constrains a range of scales close to (but not exactly on) the kernel. As a result, large degeneracies with the DDM parameters prevent obtaining meaningful constraints on the DDM model in a KiDS-1000 only analysis.
Concretely, we demonstrated that when using broad, uninformative priors, KiDS-1000 data alone do not constrain the DDM parameters , owing to a degeneracy between the spectral index and . This sensitivity to the prior volume reveals that previous KiDS-1000 constraints on DDM, such as those from Ref. Bucko et al. (2024), are significantly influenced by prior choices. We have thus performed a dedicated KiDS-1000 analysis using Planck-informed priors on and . While this allows for a significant improvement of the constraints over the results from Planck and KiDS-1000 alone, we find that a region of parameter space favoured in the Planck frequentist analysis at C.L. does survive the KiDS-1000 constraints. This precisely matches the region that was found to alleviate the tension between both datasets in past studies Franco Abellán et al. (2022, 2021); Simon et al. (2023); Bucko et al. (2024). It remains to be seen whether the updated KiDS-Legacy or DES-Y3 data that show no tension with Planck would firmly exclude this region. Our work demonstrates the importance of combining probes that cover multiple scales to derive robust constraints on exotic dark matter properties. Looking forward, future weak lensing surveys such as Euclid will dramatically improve sensitivity to the scale- and time-dependent suppression of structure induced by DDM models. Recent forecast analyses Lesgourgues et al. (2025); Franco Abellán et al. (2024) show that Euclid will tighten constraints on the DDM parameter space by up to an order of magnitude, enabling a definitive test of the scenarios discussed in this work.
Acknowledgments
We thank Théo Simon, Andreas Nygaard, Jozef Bucko, Aurel Schneider and Oliver Hahn for useful discussions. We are particularly thankful to Guillermo Franco Abellán for his thoughtful comments and suggestions on the draft. EMT, TM, AP and VP are supported by funding from the European Research Council (ERC) under the European Union’s HORIZON-ERC-2022 (grant agreement no. 101076865). We gratefully acknowledge support from the CNRS/IN2P3 Computing Center (Lyon - France) for providing computing and data-processing resources needed for this work.
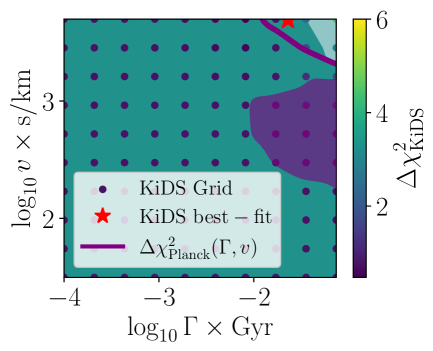
Appendix A KiDS-1000 Profile Likelihood
We have performed the 2D profile likelihood analysis of the KiDS-1000 data by following the same method as for Planck, see Eq. 10. The result is shown in Fig. 9. The global best-fit obtained is indicated as a red star while the colours of the grid points axis correspond to . In dark and light green, we show respectively the and confidence level defined as and . The KiDS-1000 frequentist analysis seems to show that the Bayesian constraints obtained in Ref. Bucko et al. (2024) and reproduced with small priors on in Fig. 5 is a prior effect.
However, we caution against strongly interpreting these results. Indeed, we find that the preferred value of tends to the highest value reachable by the emulator kms. At the same time, the redshift dependence of the intrinsic alignment parameter called in CosmoSIS and in Abbott et al. (2023) tends to the highest allowed value by the default prior . Unlike all the other nuisance parameters, only has a flat prior, which appears to make it diverge during the minimisation procedure. Furthermore, the correlation between and or is large, which means that can generate very low values () or large (). In Fig. 10 we plot the isocontours for the best-fit parameters , , and . For all these parameters, we observe that the upper right part gives high , and , that all together correspond to a very low value .
Appendix B Marginalised Statistics
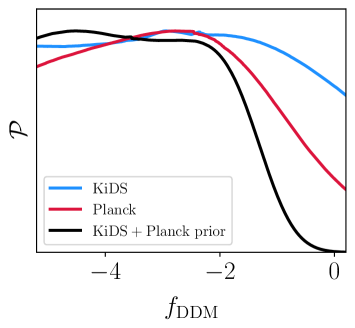
The constraints on DDM can be hard to represent with marginalised 1-dimensional statistics. Indeed, as long as CDM is not excluded, the two strongly correlated parameters and can take any value as long as the other one is small enough, i.e. a large momentum transfer would have no effect if the particle lifetime is much larger than the age of the Universe, while a small lifetime would have no effect if the daughter particle remains cold. For this reason, the marginalised constraints on these parameters depend on the prior, which makes it difficult to interpret and compare between different analyses. As we have seen, e.g. Figs. 3 and 7, the data can provide constraints on the combination of and such that only simultaneously large values can be excluded. Hence, it makes sense to define the effective parameter
| (14) |
where and are arbitrary normalization values. Here, we choose the upper bounds of the emulator Gyr-1 and km/s. Effectively, when , we recover the CDM limit either by large lifetime or small momentum transfer. Constraints to this DDM parameter are shown in Fig. 11. One can see that the combination of KiDS-1000 and Planck priors provide the strongest constraints to the model.
Finally, in Tab. 2, we show the 1-dimensional marginalised constraints for all parameters, the two models we have considered, CDM and DDM, and the two datasets we have used Planck and KiDS-1000. The last column shows the combination of KiDS-1000 and Planck informed priors on and .
References
- Aghanim et al. (2020a) N. Aghanim et al. (Planck), Astron. Astrophys. 641, A6 (2020a), [Erratum: Astron.Astrophys. 652, C4 (2021)], arXiv:1807.06209 [astro-ph.CO] .
- Kuijken et al. (2019) K. Kuijken et al., Astron. Astrophys. 625, A2 (2019), arXiv:1902.11265 [astro-ph.GA] .
- Giblin et al. (2021) B. Giblin et al., Astron. Astrophys. 645, A105 (2021), arXiv:2007.01845 [astro-ph.CO] .
- Amon et al. (2022) A. Amon et al. (DES), Phys. Rev. D 105, 023514 (2022), arXiv:2105.13543 [astro-ph.CO] .
- Hamana et al. (2020) T. Hamana et al., Publ. Astron. Soc. Jap. 72, 16 (2020), [Erratum: Publ.Astron.Soc.Jap. 74, 488-491 (2022)], arXiv:1906.06041 [astro-ph.CO] .
- Busch et al. (2022) J. L. v. d. Busch et al., Astron. Astrophys. 664, A170 (2022), arXiv:2204.02396 [astro-ph.CO] .
- Abbott et al. (2022) T. M. C. Abbott et al. (DES), Phys. Rev. D 105, 023520 (2022), arXiv:2105.13549 [astro-ph.CO] .
- Stölzner et al. (2025) B. Stölzner et al., (2025), arXiv:2503.19442 [astro-ph.CO] .
- Ivezić et al. (2019) v. Ivezić et al. (LSST), Astrophys. J. 873, 111 (2019), arXiv:0805.2366 [astro-ph] .
- Mellier et al. (2025) Y. Mellier et al. (Euclid), Astron. Astrophys. 697, A1 (2025), arXiv:2405.13491 [astro-ph.CO] .
- Spergel et al. (2015) D. Spergel et al., (2015), arXiv:1503.03757 [astro-ph.IM] .
- Gong et al. (2019) Y. Gong, X. Liu, Y. Cao, X. Chen, Z. Fan, R. Li, X.-D. Li, Z. Li, X. Zhang, and H. Zhan, Astrophys. J. 883, 203 (2019), arXiv:1901.04634 [astro-ph.CO] .
- Tan et al. (2023) T. Tan, D. Zuercher, J. Fluri, A. Refregier, F. Tarsitano, and T. Kacprzak, Mon. Not. Roy. Astron. Soc. 522, 3766 (2023), arXiv:2207.03598 [astro-ph.CO] .
- Amon and Efstathiou (2022) A. Amon and G. Efstathiou, Mon. Not. Roy. Astron. Soc. 516, 5355 (2022), arXiv:2206.11794 [astro-ph.CO] .
- Aricò et al. (2023) G. Aricò, R. E. Angulo, M. Zennaro, S. Contreras, A. Chen, and C. Hernández-Monteagudo, Astron. Astrophys. 678, A109 (2023), arXiv:2303.05537 [astro-ph.CO] .
- Schneider et al. (2020) A. Schneider, A. Refregier, S. Grandis, D. Eckert, N. Stoira, T. Kacprzak, M. Knabenhans, J. Stadel, and R. Teyssier, JCAP 04, 020 (2020), arXiv:1911.08494 [astro-ph.CO] .
- Heimersheim et al. (2020) S. Heimersheim, N. Schöneberg, D. C. Hooper, and J. Lesgourgues, JCAP 12, 016 (2020), arXiv:2008.08486 [astro-ph.CO] .
- Joseph et al. (2023) M. Joseph, D. Aloni, M. Schmaltz, E. N. Sivarajan, and N. Weiner, Phys. Rev. D 108, 023520 (2023), arXiv:2207.03500 [astro-ph.CO] .
- Poulin et al. (2023) V. Poulin, J. L. Bernal, E. D. Kovetz, and M. Kamionkowski, Phys. Rev. D 107, 123538 (2023), arXiv:2209.06217 [astro-ph.CO] .
- Ferlito et al. (2022) F. Ferlito, S. Vagnozzi, D. F. Mota, and M. Baldi, Mon. Not. Roy. Astron. Soc. 512, 1885 (2022), arXiv:2201.04528 [astro-ph.CO] .
- Enqvist et al. (2015) K. Enqvist, S. Nadathur, T. Sekiguchi, and T. Takahashi, JCAP 09, 067 (2015), arXiv:1505.05511 [astro-ph.CO] .
- Enqvist et al. (2020) K. Enqvist, S. Nadathur, T. Sekiguchi, and T. Takahashi, JCAP 04, 015 (2020), arXiv:1906.09112 [astro-ph.CO] .
- Murgia et al. (2017) R. Murgia, A. Merle, M. Viel, M. Totzauer, and A. Schneider, JCAP 11, 046 (2017), arXiv:1704.07838 [astro-ph.CO] .
- Franco Abellán et al. (2021) G. Franco Abellán, R. Murgia, and V. Poulin, Phys. Rev. D 104, 123533 (2021), arXiv:2102.12498 [astro-ph.CO] .
- Chen et al. (2021) A. Chen et al. (DES), Phys. Rev. D 103, 123528 (2021), arXiv:2011.04606 [astro-ph.CO] .
- Choi and Yanagida (2022) G. Choi and T. T. Yanagida, Phys. Lett. B 827, 136954 (2022), arXiv:2104.02958 [hep-ph] .
- Tanimura et al. (2023) H. Tanimura, M. Douspis, N. Aghanim, and J. Kuruvilla, Astron. Astrophys. 674, A222 (2023), arXiv:2301.03939 [astro-ph.CO] .
- Bucko et al. (2023) J. Bucko, S. K. Giri, and A. Schneider, Astron. Astrophys. 672, A157 (2023), arXiv:2211.14334 [astro-ph.CO] .
- Bucko et al. (2024) J. Bucko, S. K. Giri, F. H. Peters, and A. Schneider, Astron. Astrophys. 683, A152 (2024), arXiv:2307.03222 [astro-ph.CO] .
- Hambye (2011) T. Hambye, PoS IDM2010, 098 (2011), arXiv:1012.4587 [hep-ph] .
- Abazajian et al. (2012) K. N. Abazajian et al., (2012), arXiv:1204.5379 [hep-ph] .
- Drewes et al. (2017) M. Drewes et al., JCAP 01, 025 (2017), arXiv:1602.04816 [hep-ph] .
- Berezinsky et al. (1991) V. Berezinsky, A. Masiero, and J. W. F. Valle, Phys. Lett. B 266, 382 (1991).
- Covi et al. (1999) L. Covi, J. E. Kim, and L. Roszkowski, Phys. Rev. Lett. 82, 4180 (1999), arXiv:hep-ph/9905212 .
- Kim and Kim (2002) H.-B. Kim and J. E. Kim, Phys. Lett. B 527, 18 (2002), arXiv:hep-ph/0108101 .
- Feng et al. (2003) J. L. Feng, A. Rajaraman, and F. Takayama, Phys. Rev. D 68, 063504 (2003), arXiv:hep-ph/0306024 .
- Fuß et al. (2025) L. Fuß, M. Garny, and A. Ibarra, JCAP 01, 055 (2025), arXiv:2403.15543 [hep-ph] .
- Nygaard et al. (2021) A. Nygaard, T. Tram, and S. Hannestad, JCAP 05, 017 (2021), arXiv:2011.01632 [astro-ph.CO] .
- Holm et al. (2023) E. B. Holm, L. Herold, S. Hannestad, A. Nygaard, and T. Tram, Phys. Rev. D 107, L021303 (2023), arXiv:2211.01935 [astro-ph.CO] .
- Simon et al. (2022) T. Simon, G. Franco Abellán, P. Du, V. Poulin, and Y. Tsai, Phys. Rev. D 106, 023516 (2022), arXiv:2203.07440 [astro-ph.CO] .
- Wang and Zentner (2012) M.-Y. Wang and A. R. Zentner, Phys. Rev. D 85, 043514 (2012), arXiv:1201.2426 [astro-ph.CO] .
- Peter and Benson (2010) A. H. G. Peter and A. J. Benson, Phys. Rev. D 82, 123521 (2010), arXiv:1009.1912 [astro-ph.GA] .
- Cheng et al. (2015) D. Cheng, M. C. Chu, and J. Tang, JCAP 07, 009 (2015), arXiv:1503.05682 [astro-ph.CO] .
- Mau et al. (2022) S. Mau et al. (DES), Astrophys. J. 932, 128 (2022), arXiv:2201.11740 [astro-ph.CO] .
- Wang et al. (2013) M.-Y. Wang, R. A. C. Croft, A. H. G. Peter, A. R. Zentner, and C. W. Purcell, Phys. Rev. D 88, 123515 (2013), arXiv:1309.7354 [astro-ph.CO] .
- Fuß and Garny (2023) L. Fuß and M. Garny, JCAP 10, 020 (2023), arXiv:2210.06117 [astro-ph.CO] .
- Nygaard et al. (2023) A. Nygaard, E. B. Holm, S. Hannestad, and T. Tram, JCAP 11, 064 (2023), arXiv:2308.06379 [astro-ph.CO] .
- Fixsen (2009) D. J. Fixsen, Astrophys. J. 707, 916 (2009), arXiv:0911.1955 [astro-ph.CO] .
- Blackadder and Koushiappas (2014) G. Blackadder and S. M. Koushiappas, Phys. Rev. D 90, 103527 (2014), arXiv:1410.0683 [astro-ph.CO] .
- Lesgourgues (2011) J. Lesgourgues, (2011), arXiv:1104.2932 [astro-ph.IM] .
- Blas et al. (2011) D. Blas, J. Lesgourgues, and T. Tram, JCAP 07, 034 (2011), arXiv:1104.2933 [astro-ph.CO] .
- Takahashi et al. (2012) R. Takahashi, M. Sato, T. Nishimichi, A. Taruya, and M. Oguri, Astrophys. J. 761, 152 (2012), arXiv:1208.2701 [astro-ph.CO] .
- Smith et al. (2003) R. E. Smith, J. A. Peacock, A. Jenkins, S. D. M. White, C. S. Frenk, F. R. Pearce, P. A. Thomas, G. Efstathiou, and H. M. P. Couchmann (VIRGO Consortium), Mon. Not. Roy. Astron. Soc. 341, 1311 (2003), arXiv:astro-ph/0207664 .
- Giri and Schneider (2021) S. K. Giri and A. Schneider, JCAP 12, 046 (2021), arXiv:2108.08863 [astro-ph.CO] .
- Abbott et al. (2023) T. M. C. Abbott et al. (Kilo-Degree Survey, DES), Open J. Astrophys. 6, 2305.17173 (2023), arXiv:2305.17173 [astro-ph.CO] .
- Mead et al. (2021) A. Mead, S. Brieden, T. Tröster, and C. Heymans, Mon. Not. Roy. Astron. Soc. 502, 1401 (2021), arXiv:2009.01858 [astro-ph.CO] .
- Asgari et al. (2021) M. Asgari et al. (KiDS), Astron. Astrophys. 645, A104 (2021), arXiv:2007.15633 [astro-ph.CO] .
- Joachimi et al. (2021) B. Joachimi et al., Astron. Astrophys. 646, A129 (2021), arXiv:2007.01844 [astro-ph.CO] .
- Aghanim et al. (2020b) N. Aghanim et al. (Planck), Astron. Astrophys. 641, A5 (2020b), arXiv:1907.12875 [astro-ph.CO] .
- Aghanim et al. (2020c) N. Aghanim et al. (Planck), Astron. Astrophys. 641, A8 (2020c), arXiv:1807.06210 [astro-ph.CO] .
- Beutler et al. (2011) F. Beutler, C. Blake, M. Colless, D. H. Jones, L. Staveley-Smith, L. Campbell, Q. Parker, W. Saunders, and F. Watson, Mon. Not. Roy. Astron. Soc. 416, 3017 (2011), arXiv:1106.3366 [astro-ph.CO] .
- Ross et al. (2015) A. J. Ross, L. Samushia, C. Howlett, W. J. Percival, A. Burden, and M. Manera, Mon. Not. Roy. Astron. Soc. 449, 835 (2015), arXiv:1409.3242 [astro-ph.CO] .
- Alam et al. (2017) S. Alam et al. (BOSS), Mon. Not. Roy. Astron. Soc. 470, 2617 (2017), arXiv:1607.03155 [astro-ph.CO] .
- Brout et al. (2022) D. Brout et al., Astrophys. J. 938, 110 (2022), arXiv:2202.04077 [astro-ph.CO] .
- Schneider et al. (2010) P. Schneider, T. Eifler, and E. Krause, Astron. Astrophys. 520, A116 (2010), arXiv:1002.2136 [astro-ph.CO] .
- Asgari et al. (2012) M. Asgari, P. Schneider, and P. Simon, Astron. Astrophys. 542, A122 (2012), arXiv:1201.2669 [astro-ph.CO] .
- Asgari et al. (2017) M. Asgari, C. Heymans, C. Blake, J. Harnois-Deraps, P. Schneider, and L. Van Waerbeke, Mon. Not. Roy. Astron. Soc. 464, 1676 (2017), arXiv:1601.00115 [astro-ph.CO] .
- Metropolis et al. (1953) N. Metropolis, A. W. Rosenbluth, M. N. Rosenbluth, A. H. Teller, and E. Teller, J. Chem. Phys. 21, 1087 (1953).
- Hastings (1970) W. K. Hastings, Biometrika 57, 97 (1970).
- Brinckmann and Lesgourgues (2019) T. Brinckmann and J. Lesgourgues, Phys. Dark Univ. 24, 100260 (2019), arXiv:1804.07261 [astro-ph.CO] .
- Audren et al. (2013) B. Audren, J. Lesgourgues, K. Benabed, and S. Prunet, JCAP 02, 001 (2013), arXiv:1210.7183 [astro-ph.CO] .
- Zuntz et al. (2015) J. Zuntz, M. Paterno, E. Jennings, D. Rudd, A. Manzotti, S. Dodelson, S. Bridle, S. Sehrish, and J. Kowalkowski, Astron. Comput. 12, 45 (2015), arXiv:1409.3409 [astro-ph.CO] .
- Hannestad (2000) S. Hannestad, Phys. Rev. D 61, 023002 (2000), arXiv:astro-ph/9911330 .
- Wright et al. (2025) A. H. Wright et al., (2025), arXiv:2503.19441 [astro-ph.CO] .
- Heymans et al. (2021) C. Heymans et al., Astron. Astrophys. 646, A140 (2021), arXiv:2007.15632 [astro-ph.CO] .
- Neyman (1937) J. Neyman, Phil. Trans. Roy. Soc. Lond. A 236, 333 (1937).
- Franco Abellán et al. (2022) G. Franco Abellán, R. Murgia, V. Poulin, and J. Lavalle, Phys. Rev. D 105, 063525 (2022), arXiv:2008.09615 [astro-ph.CO] .
- Simon et al. (2023) T. Simon, P. Zhang, V. Poulin, and T. L. Smith, Phys. Rev. D 107, 063505 (2023), arXiv:2208.05930 [astro-ph.CO] .
- Lesgourgues et al. (2025) J. Lesgourgues et al. (Euclid), Astron. Astrophys. 693, A249 (2025), arXiv:2406.18274 [astro-ph.CO] .
- Franco Abellán et al. (2024) G. Franco Abellán, G. C. n. Herrera, M. Martinelli, O. Savchenko, D. Sciotti, and C. Weniger, JCAP 11, 057 (2024), arXiv:2403.14750 [astro-ph.CO] .