Fast inflowing ionized absorber tracing the gas dynamics at sub-parsec scale around Mrk 3
Abstract
Accretion onto supermassive black hole (SMBH) releases energy via radiation, jets or winds, providing feedback effects on the circumnuclear gas environment. However, the dynamics of accreting gas on sub-parsec scales near the SMBH remains poorly understood. With high-resolution X-ray spectra of Mrk 3, we detect a fast inflowing ionized absorber characterized by redshifted Fe XXV and Fe XXVI absorption lines. Photoionization modeling reveals the inflowing absorber is located at and is decelerating from to over 11 years. Only %–% of the inflowing material is estimated to reach the event horizon. This direct evidence of sub-parsec scale fueling inflow bridges the gap between the torus and the outer accretion disk. Furthermore, a -keV gas component with sub-solar metallicity (), outflowing at a velocity of , is detected in the soft X-ray band. It may corresponds to the [O III] biconical outflow in the narrow-line region. A putative ultra-fast disk wind outside our line-of-sight, or clouds within the broad-line region, are promising candidates for decelerating the inflowing absorber.
1 Introduction
A supermassive black hole (SMBH) at the center of nearly every galaxy has been considered as an essential component to galaxy evolution. Actively accreting SMBHs, manifesting themselves as active galactic nuclei (AGN) can convert accretion power into considerable energy output in the form of radiation, jets or winds, thereby regulating both black hole growth and star formation–an effect known as AGN feedback (Fabian, 2012). The infalling motion of cold accretion gas toward the central SMBH can be traced from extragalactic scales (through galaxy mergers and interaction), galactic scales (through secular processes), down to sub-hundred-parsec scale (through nuclear gas disks, bars or spirals)(Storchi-Bergmann & Schnorr-Müller, 2019). At smaller scales, Shi et al. (2016) detected a redshifted absorber in the spectra of a quasar and found that the inflowing medium is located at pc from the black hole near the AGN torus with reverberation mapping.
However, observational evidence of cold gas inflow that directly feeds black hole accretion disks on sub-parsec scales remains limited. In a small sample of quasars around (e.g, in J1035+1422), redshifted broad absorption lines reaching have been detected coexisting with blueshifted absorption lines. These observations features a potential feeding inflow, possibly connecting between the torus and the accretion disk within several , in addition to the disk wind(Zhou et al., 2019; Chen et al., 2022). Izumi et al. (2023) resolved a gravitationally unstable, dense gas disk driving sub-parsec scale accretion inflow onto the black hole in the Circinus Galaxy. Only 3% of the inflowing material is estimated to reach the event horizon, with the rest ejected by multiphase outflows.
Zhou et al. (2019) proposes the AGN torus as the gas reservoir fueling the accretion disk and attributes the scarcity of observed disk-feeding inflow to an observational bias due to line-of-sight effect. When the line of sight is close to the polar direction, it intercepts only the blueshifted, disk driven outflow aligned with the narrow-line region (NLR). Conversely, when the line of sight inclining towards the torus plane, the inflow material would be totally obscured by the optically thick torus. Only a modest inclination angle grazing the surface of the dusty torus, would enable a direct detection piercing through the inflowing medium connecting to the accretion disk.
As gas approaches sub-parsec scale toward the central AGN, it becomes heavily photoionized by the intense radiation field. The physical properties of such highly ionized gas are best probed through X-ray spectroscopy. Highly ionized, ultra-fast outflows characterized by blueshifted UV / X-ray absorption lines are ubiquitously found in up to –% of local AGN (Crenshaw & Kraemer, 2012; Tombesi et al., 2010), while their redshifted counterparts, fast inflows at sub-parsec scales are rarely reported. Therefore, detailed X-ray spectroscopic studies of individual AGN observed at grazing angles in the local Universe would help reveal the complex ‘inflow-outflow’ gas dynamics in the very vicinity of AGN and the narrow-line region.
Lying at a distance of (111https://ned.ipac.caltech.edu), Mrk 3 (Markarian 3) is an S0-type galaxy hosting a nearly obscured, Compton-thin AGN(Yaqoob et al., 2015). The mass of the central supermassive black hole is estimated to be based on stellar velocity dispersion (Woo & Urry, 2002). The Eddington ratio of Mrk 3 ranges between and . Signatures of ionized gas outflows have been discovered and well-studied in Mrk 3. Kinematic modeling of emission lines (e.g., [O III], [N II]) reveals a peak gas velocity of in the narrow-line region (NLR), tracing a biconical outflow extending to (Ruiz et al., 2001; Collins et al., 2005; Gnilka et al., 2020; Revalski et al., 2021; Meena et al., 2023). Diffuse X-ray emission observed in Chandra 0-order image reveals that the highly ionized gas extends along the direction roughly coincident with the [O III] outflow in the NLR (Bogdán et al., 2017). Guainazzi et al. (2016) analyzed the X-ray broadband spectrum of Mrk 3 with the state-of-the-art torus model to investigate its torus properties (including the torus opening angle). They concluded that the line-of-sight intercepts the torus surface. This makes Mrk 3 analogous to those quasars with a torus-grazing viewing angle mentioned above. They also reported the detection of redshifted, highly-ionized iron absorption lines in the stacked Chandra HEG spectrum, but left their origin unexplained.
Therefore, our motivation is to investigate the properties of the ionized absorber in detail, to explore the connection between torus, accretion inflows and outflows, and to get a better understanding of the hot gas dynamics and feedback effect in the vicinity of the central AGN in Mrk 3. This paper is organized as follows. In Section 2 we describe the data reduction processes in detail. In Section 3, results of spectral fitting for both soft and hard X-ray bands are presented, as well as a detailed photoionization modeling for potential redshifted ionized absorber. In Section 4, we try to propose a preferred scenario to explain the multi-scale, multi-phase dynamical behavior of the gas from sub-parsec to hundred parsec around Mrk 3 nuclei. We summarize our findings in Section 5.
2 Data Reduction
To detect plasma with bulk motion around the Mrk 3 nucleus, all available high-resolution X-ray spectroscopic data covering both soft and hard X-ray bands has been retrieved. The High Energy Transmission Grating (HETG) onboard Chandra X-ray Observatory, covering the energy band ranging from – , can retain a spectral resolution of around the iron fluorescent lines ( – ). For the soft X-ray band, the XMM-Newton Reflection Grating Spectrometer (RGS) offers a first-order full-width half maximum (FWHM) spectral resolution of over – range. We summarize the basic information of all the observations in Table 1.
2.1 HETG
Mrk 3 has been observed by HETG in 2000 and 2011 for a total clean exposure of . We reduce the data with the CIAO v4.15 software package (Fruscione et al., 2006). The -order High Energy Gratings (HEG) spectra have been extracted for all epochs. Half-width of the source extraction region in the cross-dispersion direction corresponds to in physical size for Mrk 3. The underlying continuum shows little variability, so all spectra are co-added for a baseline fit (See Sec.3.1 for further details). While the line features are analyzed separately for each epoch.
2.2 RGS
We retrieve 15 epochs of RGS observations for Mrk 3. After checking the flaring particle background, 4 epochs with an all-time high background have been abandoned, leaving a total clean exposure of as seen in Table 1. We extract the spectra from the two RGS modules following the standard pipeline rgsproc with the SAS v21.0.0 software package (Gabriel et al., 2004). These spectra are divided into 3 groups according to observation start time(2001-2002, 2012, and 2015) and co-added respectively. We find very little spectral variability across epochs. Thus all the RGS spectra are co-added together.
| Inst | Obs ID | Start Date | Net Exposure |
|---|---|---|---|
| (UT) | (ks) | ||
| HETG | 873 | 2000-03-18 06:58:08 | 100.6 |
| HETG | 12874 | 2011-04-19 15:53:47 | 77.06 |
| HETG | 12875 | 2011-04-25 09:34:32 | 29.86 |
| HETG | 13254 | 2011-08-26 02:56:58 | 31.53 |
| HETG | 13261 | 2011-05-02 00:17:30 | 22.08 |
| HETG | 13263 | 2011-04-28 23:08:33 | 19.72 |
| HETG | 13264 | 2011-04-27 19:45:10 | 35.76 |
| HETG | 13406 | 2011-05-03 12:54:21 | 21.43 |
| HETG | 14331 | 2011-08-28 13:09:38 | 51.21 |
| RGS | 0009220301 | 2001-03-12 23:10:35 | 4.2 |
| RGS | 0009220401 | 2002-03-10 13:17:59 | 16.9 |
| RGS | 0009220501 | 2002-03-25 17:05:48 | 13.6 |
| RGS | 0009220601 | 2001-03-20 20:03:15 | 22.5 |
| RGS | 0009220701 | 2001-03-28 20:47:56 | 6.9 |
| RGS | 0009220901 | 2001-09-12 00:27:09 | 5.1 |
| RGS | 0009221601 | 2002-09-16 05:09:12 | 4.5 |
| RGS | 0656580301 | 2012-03-15 11:27:22 | 40.8 |
| RGS | 0741050101 | 2015-03-19 17:32:26 | 4.0 |
| RGS | 0741050201 | 2015-04-08 16:23:36 | 5.8 |
| RGS | 0741050401 | 2015-04-20 15:39:41 | 6.5 |
3 Results
Spectra have been optimally rebinned and analyzed with SPEX v 3.08.01(Kaastra et al., 2024). Galactic foreground absorption with column density has always been included during spectral modeling by introducing a hot model with temperature fixed at . Error bars of the derived properties are taken as the 1- (68.3%) confidence level, unless otherwise mentioned in the following sections.
3.1 Modeling Baseline Continuum
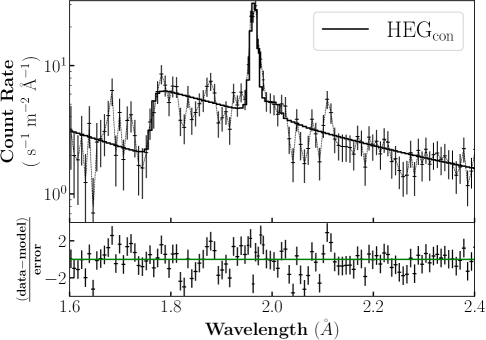
Co-added HEG spectrum of Mrk 3 over the – band consists of an intrinsically absorbed power law with a distinct absorption edge around , a prominent fluorescent Fe K line and a reflection component. We adopt a photoionized absorber (pion(abs)torus) in front of the baseline power-law (pow) to account for the intrinsic absorption. Especially, PION can simultaneously calculate and fit the illuminating continuum and ionization balance in a self-consistent way. A reflection component (refl) has also been added to describe the baseline continuum. The absorption edge energy ( in the source frame) indicates that the intrinsic absorber is almost neutral. Allowing the ionization parameter () of piontorus to vary freely during the fitting causes it to peg at the lower limit. So we fix of this component to the 3- upper limit of . Testing values lower than , results in negligible differences to the best fit. The best-fit column density of this neutral absorber is and it could be associated with the torus around AGN. Other best-fit parameters have been recorded in the column of Table 2.
Our result is roughly consistent with previous studies, indicating that the intrinsic torus column density in Mrk 3 lies near the boundary between the Compton-thin and Compton-thick regimes. Yaqoob et al. (2015) and Guainazzi et al. (2016) adopt self-consistent torus model with careful analysis, and conclude that the central AGN should be classified as Compton-thin. It should be noted that there are slight discrepancies between our derived torus parameters and previous studies. The main reason is that, the reflection model we applied in SPEX is built for plane-parallel, Compton-thick scattering material. Our baseline model is therefore not fully self-consistent in this context, but it provides a reasonable approximation. So we adopt it in the following analysis for simplification.
We also divide spectra of all the epochs into 2 groups depending on the observation time (epoch 2000 and 2011). The X-ray continuum below 10 keV is relatively stable as can be seen from Fig. 2.
3.2 redshifted Ionized Absorber
Two residual absorption line features can be found around – in the co-added HEG spectrum. The centroids of these two absorption lines are and if fitted with two gaussian models. They could be assigned to He-like () and H-like () Fe K lines with consistent redshifted velocity of around .
3.2.1 Inflowing Absorber Inside the Torus
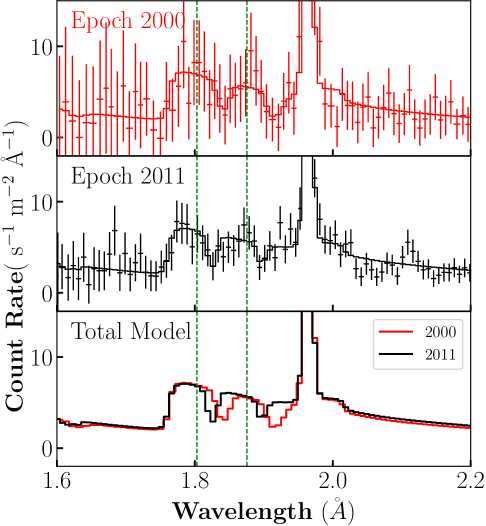
The two absorption-line features are present in both 2000 and 2011 observations (See Fig. 2). The persistent existence spanning 11 years suggests that it may not be transient. Thus we add an additional redshifted absorber pion(abs)red to account for this highly ionized inflowing absorption component and place it inside the neutral torus absorber, closer to the central black hole.
We noticed prominent variability of the redshifted absorption features across epochs, which must be taken into account. Phenomenological Gaussian modeling indicates that the centroids of the two highly ionized Fe absorption lines consistently shift by from 2000 to 2011, suggesting a potential deceleration of the ionized absorber between the two epochs. To derive the properties of this redshifted absorber, we fit the spectra of the two epochs separately with an additional redshifted PION(abs)red. The best-fit results are summarized in the columns of HEG2000 and HEG2011 of Table 2.
In this scenario, both the photon index of the illuminating power-law and the column density of torus for the two epochs are roughly consistent with the baseline fitting of co-added spectrum (HEGcon) in Sec. 3.1. However, the reflection fraction ( and ) becomes smaller. This reduction is due to the presence of the additional redshifted absorber model, which attenuates the incident continuum and leads to a higher best-fit normalization of the unabsorbed power-law component . The actual absolute magnitude of the reflection component remains unchanged. As a result the reflection fraction decreases.
Over the 11 years, the velocity of the putative inflowing absorber decelerates from to . Its velocity broadening also slightly decreases from to , with large uncertainties. Both the column density and ionization parameter increase with the decreasing of the bulk velocity across epochs.
| Mod | Par | Unit | ||||
|---|---|---|---|---|---|---|
| epoch | co-added | 2000 | 2011 | co-added | ||
| band | 1.6 – 6.2 | 1.6 – 6.2 | 1.6 – 6.2 | 1.6 – 6.2 | ||
| pow | - | |||||
| Norm | ||||||
| refl | scal | - | ||||
| pion(abs)torus | ||||||
| pion(abs)red | - | - | ||||
| - | - | |||||
| - | - | |||||
| - | - | |||||
| hot(abs)red | keV | - | - | - | ||
| - | - | - | ||||
| - | - | - | ||||
| –stat | 849.32 | 663.39 | 777.94 | 832.37 | ||
| d.o.f | 612 | 590 | 607 | 609 |
3.2.2 Alternative geometry
We also examined an alternative geometry, placing the redshifted absorber outside the torus. However, this configuration fails to produce a good fit, as most of the high energy photons are already absorbed by the inner torus and cannot further ionize Fe ions to the observed high states.
Another possible scenario is that the highly ionized absorber is not inside the torus and photoionized by the central AGN, but instead represents hot, dense collisionally ionized gas in the host galaxy that is moving away from us along line of sight. Based on the baseline continuum model in Sec. 3.1, a collisionally ionized absorber model hot(abs)red is placed outside the torus to fit the co-added HEG spectrum, as shown in the column HEGalter in Table 2. This model gives a best-fit with -stat ( for d.o.f). The temperature of the putative hot gas reaches . The presence of such hot and fast moving gas is difficult to explain by any mechanism unrelated to the central AGN.
3.3 Modeling the Soft X-ray Band
Multiple emission lines are clearly present in the co-added RGS spectrum. Instead of phenomenological gaussian models, we adopt physical emission models of collisionally ionized/photoionized gas embedded in SPEX (CIE/PION) rather than using phenomenological Gaussian lines. We adopt a similar underlying baseline continuum model as described in Section 3.1, consisting of an incident power-law continuum absorbed by the AGN torus. The reflection component is negligible in the soft X-ray band, and after evaluation we ignore it for simplification. The ionization parameter and column density of the torus are fixed at the values derived from co-added HEG spectrum.
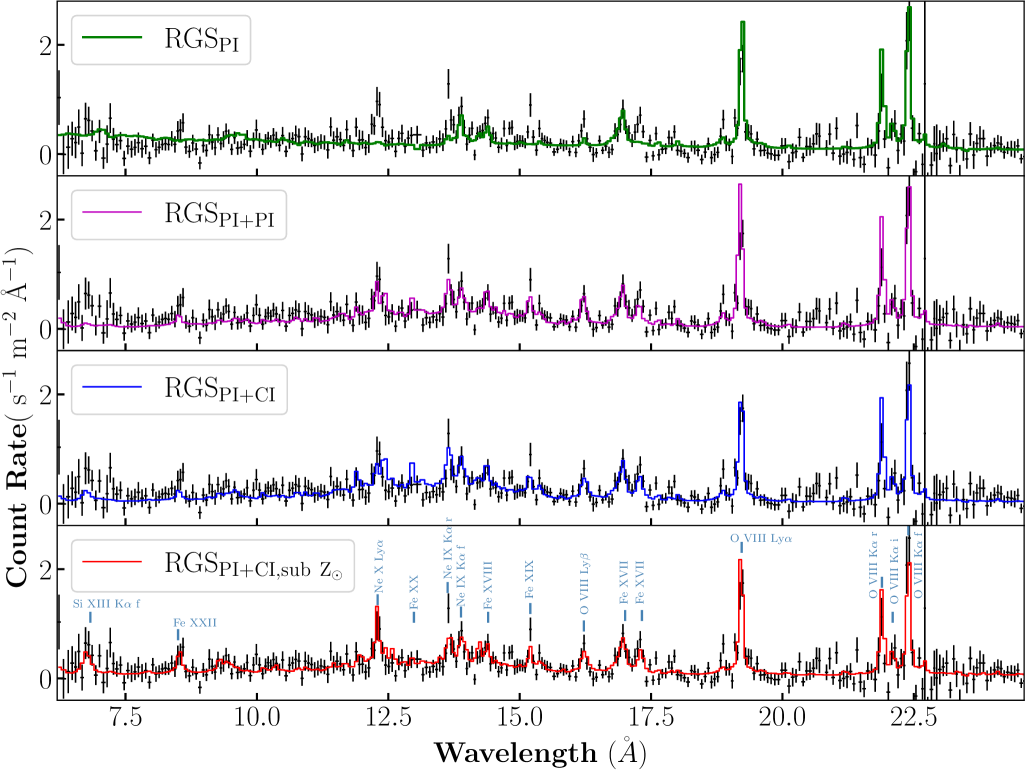
First, we try to reproduce the multiple lines with emission from a single static photoionized gas component (pion(emis)1). We denote this model set as . Gas in the vicinity of the black hole can naturally be illuminated and ionized by the central AGN. We assume that the power-law continuum irradiating the static photoionized gas is identical to that irradiating the torus. The covering factor of pion(emis)1 is fixed at unity for simplicity. The best-fit column density is . Detailed fitting results can be refer to Table 3 and Figure 3. The best-fit model underestimates the emission lines around , and .
Adding a second photoionized emission component (pion(emis)2) improves the fit with a -stat reduction of in for extra degrees of freedom (d.o.f). Detailed best-fit parameters of this new model set are listed in the column in Table 3. The illuminating power-law continuum and the bulk motion velocity of this new pion(emis)2 are allowed to vary, representing a potential (narrow-line region) outflow responding to a different illuminating continuum to the static photoionized gas. And the best-fit for the outflowing photoionized gas is , roughly consistent with the fiducial model set . This model slightly overpredicts the continuum level at short wavelength . Both the static and outflowing photoionized gas metallicity are assumed to be solar abundance. We test allowing the iron abundance to vary freely, but the best-fit abundance still remains around . A more flexible model is examined, in which the illuminating power law for the torus, the staic, and the outflowing photoionized components are all allowed to vary. However, the fit cannot converge successfully probably restricted by the spectral quality. We have also tried an alternative assumption that the torus and the outflowing pion(emis)2 share the same illuminating power law. This results in a slightly worse -stat of .
We attempt to substitute the outflowing photoionized component pion(emis)2 with a collisionally ionized component in solar metallicity. The best-fit result is recorded in the column of the Table 3 and Figure 3. The temperature of the cie gas is and it is outflowing with a blueshifted velocity of . Compared to RGSPI+PI, this model reduces -stat for with one fewer free parameter, implying a better fit. To further assess the goodness of fit, we calculate the corrected Akaike Information Criterion ()(Akaike, 1974; Franklin et al., 2002; Liddle, 2007), where represents the number of free model parameters and denotes the number of spectral bins. The likelihood between the model and data is described by for -stat. The cAIC does not require the model to be nested, making it particularly suitable for evaluating alternative physical scenarios. The cAIC for RGSPI+CI () reduces for 7 compared to RGSPI+PI (). This corresponds to a confidence level of % that is favored.
There remain some discrepancies between model and observation around Si XIII and Fe XXII lines, probably due to enhancement in element abundance. We allow the iron abundance of the outflowing CIE gas to vary freely. A new best-fit summarized in Table 3 with the column of has been achieved, with a sub-solar iron abundance . The cAIC for RGS () further reduces for one extra free parameter compared to the result with solar metallicity.
Adding further one more photoionized or collisional ionized component does not improve the goodness of fitting and thus is not necessary. So we conclude that the PI+CI with sub-solar metallicity scenario is preferred.
| Mod | Par | Unit | RGS | |||
|---|---|---|---|---|---|---|
| band | 6.2 – 24.8 | 6.2 – 24.8 | 6.2 – 24.8 | 6.2 – 24.8 | ||
| pow | - | |||||
| Norm | ||||||
| pion(abs)torus | ||||||
| pion(emis)1 | ||||||
| cie | T | - | - | |||
| - | - | |||||
| - | 1 | - | ||||
| Norm | - | - | ||||
| pion(emis)2 | - | - | - | |||
| - | - | - | ||||
| - | - | - | ||||
| - | - | - | ||||
| –stat | 699.41 | 568.01 | 579.86 | 485.35 | ||
| d.o.f | 304 | 301 | 299 | 300 |
4 Discussion
4.1 Inflowing torus clumps
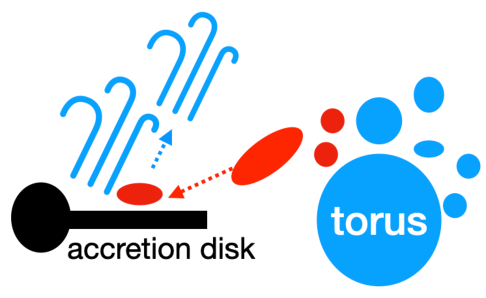
A redshifted, highly ionized absorber at a high velocity of several has been detected from the HEG spectrum, persistent over a timescale of at least . The most probable explanation for this inflowing while decelerating highly ionized absorber is that, instability at the outer surface of the torus leads to the evaporation of the torus clumps. These clumps are stretched and drawn inward toward the accretion flow under the gravitational influence of the central SMBH, and subsequently become highly ionized under the intense radiation field, as schematically illustrated in Figure 4. This process is expected to occur stochastically and persistently. The observed H-like and He-like iron absorption lines thus trace the extended inflowing material that connects between the clumpy torus and accretion disk.
Assuming that the thickness of this absorber is comparable to its distance from the ionizing source (i.e, ), we can estimate its number density and (maximum) radial location for 2000 and 2011 epochs, following standard practice in previous warm absorber studies (Krolik & Kriss, 2001; Laha et al., 2016; Wang et al., 2022). The ionization luminosity of Mrk 3 over – is given by our best-fit model. The redshifted absorber is located at a distance of () since 2000, and reduces to () in 2011, consistent with the observed increase in ionization parameter over time. As the absorber approaches the central black hole, its number density increases by nearly two orders of magnitude, while the line-of-sight velocity drops for . The derived properties of the infalling ionized absorber at both epochs are recorded in Table 4.
| Epoch | ||||
|---|---|---|---|---|
| 2000 | ||||
| 2011 |
The redshifted absorption features exist in two epochs spanning . By multiplying this timescale with the inflowing velocity, we estimate the dynamical length (or depth) of the absorber along line-of-sight to be . This value is comparable to the inferred in 2011, lending support to our previous assumption that .
The dust sublimation radius of Mrk 3 is estimated to be , where is AGN bolometric luminosity in units of (Barvainis, 1987). For simplification, the dust sublimation temperature is chosen to be and the angular-dependent geometrical factor is fixed at 1. This suggests the detected inflowing ionized absorber lies at a distance either interior to or comparable with the dusty torus of Mrk 3, consistent with our spectral modeling assumption that the inflowing absorber resides closer to the SMBH than the torus.
Guainazzi et al. (2016) reported a variability of – % in the line-of-sight column density () within – based on SED fitting of Mrk 3 NuSTAR spectra. These occultation events were interpreted as transits of small cloudlets within the torus, providing strong support for the clumpy nature of Mrk 3 torus. Notably, the best-fit column density of the highly-ionized redshifted absorber () in our analysis is of the same order of magnitude ( ) as that of the neutral torus (). Furthermore, the characteristic number density of individual torus clumps would be – (Netzer, 2013), comparable to the estimated average density we infer for the infalling absorber (). These consistencies add weight to our aforementioned scenario in which the redshifted absorber originates from torus clumps.
We compare the total mass of the observed infalling absorber with that of the AGN torus . can be interpreted as a combination of sky coverage () and volume filling factor inside the absorber. For , we take and assume . The total mass of the infalling ionized absorber decreases from in epoch 2000 to in epoch 2011, recorded in Table 4. For the AGN torus, we adopt a characteristic number density () and the best-fit average column density from our spectral modeling. The inner radius of the torus is assumed to correspond to the dust sublimation radius . The total mass of AGN torus is estimated to be . While the covering factors, and are hard to constrain, it is reasonable to assume that the torus has larger or comparable covering factor as the redshifted absorber. So the estimated torus mass is of several orders of magnitude larger than the ionized absorber, consistent with our scenario that the infalling absorber originates from the torus.
4.2 Deceleration mechanism
The deceleration of the ionized absorber suggests the presence of an extra force acting against the gravitational pull of the central SMBH. The observed deceleration rate is with the negative sign denoting force direction away from SMBH). The outward radiative acceleration exerted on the redshifted absorber () is significantly smaller than the inward gravitational acceleration . represents the absorbed flux and we take the solar proton-to-electron abundance . The radiation pressure is insufficient to compete with gravity, likely because the observed ionized absorber is too close to the central illuminating source and is already heavily ionized.
One possible explanation for the deceleration is ram pressure exerted by a putative disk wind. Highly ionized, high-velocity outflows are prevalent in luminous AGN. Ultra-fast outflows (UFOs), characterized by blueshifted K-shell absorption lines of H-like and He-like Fe with velocity exceeding can be found in up to % in local Seyfert galaxies (Tombesi & Cappi, 2014). The deceleration exerted on the inflowing absorber by such a ‘putative’ wind can be estimated as , where stands for the cross-sectional area of between infalling absorber and the wind. We also assume the covering factor of the infalling absorber is equivalent to its sky coverage and is the derived location of the absorber. Thus the ram pressure deceleration from the putative wind can be expressed as . Here the relative speed between the putative wind and inflowing absorber is considered. represents the number density of the putative wind. Based on the total mass and the location of the absorber estimated from Table 4, a UFO with a typical number density around and a velocity of can provide a deceleration rate –, comparable to the observed value. However, such a disk wind is elusive to detection, probably due to the narrow opening angle of such UFO and the misalignment between its outflow direction and our line of sight toward Mrk 3.
We have also considered the ram pressure braking by the dense broad line region (BLR) clouds. Similarly, the deceleration caused by the ambient, nearly static BLR clouds can be expressed as . Here describes the relative speed between the inflowing absorber and the dense BLR clouds. Assuming a typical average density for the BLR clouds , the deceleration rate is estimated to be – , which is also sufficient, possibly even excessive, to brake the fast-infalling material. Given the clumpy nature of BLR gas, such braking effect may not occur continuously. We speculate that the BLR cloud is also a plausible candidate to cause the observed deceleration.
4.3 Kinematics of the inflowing absorber
We compare the mass inflow rate of the detected ionized absorber with the intrinsic accretion rate of Mrk 3. The mass inflow rate of the redshifted ionized absorber is estimated as . Homogeneous absorber is assumed for simplification and a correction factor is included. For Mrk 3, the unabsorbed – luminosity from our best-fit model is , corresponding to a bolometric luminosity of after applying a bolometric correction factor (Duras et al., 2020). Assuming a energy transfer efficiency, the mass accretion rate at the event horizon is .
The inflow rate of the ionized absorber is almost 50 times higher than the mass accretion rate at the event horizon. These infalling torus clumps are sufficient to supply the accretion and maintain the nuclear activity in Mrk 3, provided that the correction factor . Probably these evaporated torus clumps possess a small sky covering factor and form stream-like structures above the torus surface, continuously fueling the accretion of central AGN. This may also explain the rarity of redshifted absorber detections, which requires a grazing line of sight to torus. Alternatively, and more likely, only % of the inflowing material finally reaches the accretion disk, with the majority being entrained and ejected by a putative disk wind. The derived and of the infalling ionized absorber increase during its deceleration, while its velocity dispersion decreases, implying that the velocity gradient is being suppressed. These observational signatures further supports the scenario that the ionized absorber is compressed and becomes denser as it approaches the SMBH.
4.4 Shocked interstellar medium in the NLR
The soft X-ray emission of Mrk 3 can be described by one photoionized plasma component together with one outflowing collisionally ionized plasma component.
The photoionized component is likely associated with emission from the narrow-line region and is nearly static, with a upper limit of for outflow velocity. In the optical band, three photoionized gas components have been adopted to describe emission lines detected by Hubble STIS in the NLR of Mrk 3 (Collins et al., 2005, 2009). We find that the ionization parameter of our soft X-ray photoionized plasma () is even higher than that of the most highly ionized optical components (), suggesting that the soft X-ray trace emission from the inner part of NLR, close to the central AGN. Considering a typical gas density of NLR to be – , the soft X-ray emission is estimated to come from gas around – , based on the best-fit ionization parameter .
The collisionally ionized plasma component, with a blueshifted velocity of , could trace the shocked interstellar medium (ISM) as proposed by (Bogdán et al., 2017). Our best-fit gas temperature () and iron abundance () are consistent with those derived from their MEG observation ( and ). They also suggest that the shocked gas component extends toward east and west, in alignment with the extended biconical warm ionized gas outflows traced by optical emission lines (e.g., [O III] and H). The average velocity of the [O III] outflow is , spanning over – (Ruiz et al., 2001; Gnilka et al., 2020; Meena et al., 2023), in agreement with the blueshifted velocity of the collisionally ionized soft X-ray gas. The outflow rate of [O III] gas peaks at around from the SMBH (Revalski et al., 2021), indicating that the biconical NLR outflow may be generated or accelerated at larger distances. A putative disk wind could propagate outward, interact with the surrounding medium, shock and excite the NLR outflow.
4.5 Coherent scenario
Overall, we propose a coherent scenario in Mrk 3 as illustrated by Figure 4. The redshifted, highly-ionized absorber observed in the hard X-ray band traces the inflowing clumps originated from torus instability. These clumps are evaporated from the torus at sub-parsec scales and serve as potential fuel for black hole accretion, falling roughly along the opening angle of the torus surface. Mrk 3, with a grazing line-of-sight configuration, may represent a local analog to the small sample of quasars, where parsec-scale inflows connecting torus and disk are characterized by broad/narrow optical absorption lines (Zhou et al., 2019; Chen et al., 2022). The deceleration of the inflowing ionized absorber indirectly supports the existence of a putative disk wind. Such a disk wind could also entrain and eject the accretion material away, explaining the reason why only a small fraction of the inflowing material finally reaches the black hole event horizon. The disk wind can propagate outward and interact with the surrounding ISM, traced by shocked collisionally ionized gas in soft X-ray band. It is also a promising candidate for driving or accelerating the biconical [O III] outflows in the NLR up to hundred-parsec scale. However, there are no clear spectral signatures of such a disk wind, probably because the opening angle of the wind is narrow and its outflow direction is out of our sight line.
5 Summary
We analyze the high resolution X-ray spectroscopic data of Mrk 3 nuclei and provide the direct evidence of sub-parsec scale feeding inflows bridging the gap between torus and SMBH accretion disk. Our main results are as follows:
-
•
A fast inflowing, highly ionized absorber characterized by redshifted Fe XXV and Fe XXVI absorption lines has been detected in the Chandra HEG spectra. It decelerates from to over 11 years. Photoionization modeling suggests that both the ionization parameter and column density increase during the deceleration, accompanied with a decrease in the distance to central black hole from to .
-
•
The inflowing ionized absorber is estimated to be located between the outer accretion disk and torus, with a mass inflow rate of . Compared with the accretion rate of Mrk 3, only % of the inflowing material finally reaches the event horizon.
-
•
Multiple emission lines detected in soft X-ray band can be well described by an almost static gas component illuminated by the central AGN, together with a collisionally ionized gas component with temperature of and sub solar metallicity () outflowing at a velocity of .
-
•
We propose a probable scenario to explain the gas dynamics in sub-parsec scale in Mrk 3. Torus clumps are evaporated and fall toward central black hole due to instability, manifesting as redshifted ionized absorber in a grazing line of sight to torus. The inflowing material is decelerated by the ram pressure from either dense BLR cloud or a putative ultra-fast disk wind. Such a disk wind lacks direct detection but is supported by the existence of a soft X-ray outflowing gas and the biconical [O III] outflow in the NLR of Mrk 3.
AGN with such grazing-view in the local Universe like Mrk 3 would enable us to pierce into the fueling inflow connecting torus and outer accretion disk. With high-resolution X-ray spectroscopy like Chandra HETG and XRISM Resolve, we would expect to find more cases with similar orientation. A comprehensive study of both inflow and outflow down to sub-parsec scale near the central engine is vital to obtain a clear insight of the feedback effect connecting multi-scale, multi-phase gas environment around SMBH.
References
- Akaike (1974) Akaike, H. 1974, IEEE Transactions on Automatic Control, 19, 716
- Barvainis (1987) Barvainis, R. 1987, ApJ, 320, 537, doi: 10.1086/165571
- Bogdán et al. (2017) Bogdán, Á., Kraft, R. P., Evans, D. A., Andrade-Santos, F., & Forman, W. R. 2017, ApJ, 848, 61, doi: 10.3847/1538-4357/aa8c76
- Chen et al. (2022) Chen, Z.-F., Gu, M., He, Z., et al. 2022, A&A, 659, A103, doi: 10.1051/0004-6361/202142307
- Collins et al. (2009) Collins, N. R., Kraemer, S. B., Crenshaw, D. M., Bruhweiler, F. C., & Meléndez, M. 2009, ApJ, 694, 765, doi: 10.1088/0004-637X/694/2/765
- Collins et al. (2005) Collins, N. R., Kraemer, S. B., Crenshaw, D. M., et al. 2005, ApJ, 619, 116, doi: 10.1086/426314
- Crenshaw & Kraemer (2012) Crenshaw, D. M., & Kraemer, S. B. 2012, ApJ, 753, 75, doi: 10.1088/0004-637X/753/1/75
- Duras et al. (2020) Duras, F., Bongiorno, A., Ricci, F., et al. 2020, A&A, 636, A73, doi: 10.1051/0004-6361/201936817
- Fabian (2012) Fabian, A. C. 2012, ARA&A, 50, 455, doi: 10.1146/annurev-astro-081811-125521
- Franklin et al. (2002) Franklin, A. B., Anderson, D. R., & Burnham, K. P. 2002, Journal of Applied Statistics, 29, 267, doi: 10.1080/02664760120108719
- Fruscione et al. (2006) Fruscione, A., McDowell, J. C., Allen, G. E., et al. 2006, in Society of Photo-Optical Instrumentation Engineers (SPIE) Conference Series, Vol. 6270, Observatory Operations: Strategies, Processes, and Systems, ed. D. R. Silva & R. E. Doxsey, 62701V, doi: 10.1117/12.671760
- Gabriel et al. (2004) Gabriel, C., Denby, M., Fyfe, D. J., et al. 2004, in Astronomical Society of the Pacific Conference Series, Vol. 314, Astronomical Data Analysis Software and Systems (ADASS) XIII, ed. F. Ochsenbein, M. G. Allen, & D. Egret, 759
- Gnilka et al. (2020) Gnilka, C. L., Crenshaw, D. M., Fischer, T. C., et al. 2020, ApJ, 893, 80, doi: 10.3847/1538-4357/ab8000
- Guainazzi et al. (2016) Guainazzi, M., Risaliti, G., Awaki, H., et al. 2016, MNRAS, 460, 1954, doi: 10.1093/mnras/stw1033
- Izumi et al. (2023) Izumi, T., Wada, K., Imanishi, M., et al. 2023, Science, 382, 554, doi: 10.1126/science.adf0569
- Kaastra et al. (2024) Kaastra, J. S., Raassen, A. J. J., de Plaa, J., & Gu, L. 2024, SPEX X-ray spectral fitting package, 3.08.01, Zenodo, doi: 10.5281/zenodo.12771915
- Krolik & Kriss (2001) Krolik, J. H., & Kriss, G. A. 2001, ApJ, 561, 684, doi: 10.1086/323442
- Laha et al. (2016) Laha, S., Guainazzi, M., Chakravorty, S., Dewangan, G. C., & Kembhavi, A. K. 2016, MNRAS, 457, 3896, doi: 10.1093/mnras/stw211
- Liddle (2007) Liddle, A. R. 2007, MNRAS, 377, L74, doi: 10.1111/j.1745-3933.2007.00306.x
- Meena et al. (2023) Meena, B., Crenshaw, D. M., Schmitt, H. R., et al. 2023, ApJ, 943, 98, doi: 10.3847/1538-4357/aca75f
- Mehdipour et al. (2016) Mehdipour, M., Kaastra, J. S., & Kallman, T. 2016, A&A, 596, A65, doi: 10.1051/0004-6361/201628721
- Netzer (2013) Netzer, H. 2013, The Physics and Evolution of Active Galactic Nuclei (Cambridge University Press)
- Revalski et al. (2021) Revalski, M., Meena, B., Martinez, F., et al. 2021, ApJ, 910, 139, doi: 10.3847/1538-4357/abdcad
- Ruiz et al. (2001) Ruiz, J. R., Crenshaw, D. M., Kraemer, S. B., et al. 2001, AJ, 122, 2961, doi: 10.1086/323917
- Shi et al. (2016) Shi, X.-H., Jiang, P., Wang, H.-Y., et al. 2016, ApJ, 829, 96, doi: 10.3847/0004-637X/829/2/96
- Storchi-Bergmann & Schnorr-Müller (2019) Storchi-Bergmann, T., & Schnorr-Müller, A. 2019, Nature Astronomy, 3, 48, doi: 10.1038/s41550-018-0611-0
- Tombesi & Cappi (2014) Tombesi, F., & Cappi, M. 2014, MNRAS, 443, L104, doi: 10.1093/mnrasl/slu091
- Tombesi et al. (2010) Tombesi, F., Cappi, M., Reeves, J. N., et al. 2010, A&A, 521, A57, doi: 10.1051/0004-6361/200913440
- Wang et al. (2022) Wang, Y., Kaastra, J., Mehdipour, M., et al. 2022, A&A, 657, A77, doi: 10.1051/0004-6361/202141599
- Woo & Urry (2002) Woo, J.-H., & Urry, C. M. 2002, ApJ, 579, 530, doi: 10.1086/342878
- Yaqoob et al. (2015) Yaqoob, T., Tatum, M. M., Scholtes, A., Gottlieb, A., & Turner, T. J. 2015, MNRAS, 454, 973, doi: 10.1093/mnras/stv2021
- Zhou et al. (2019) Zhou, H., Shi, X., Yuan, W., et al. 2019, Nature, 573, 83, doi: 10.1038/s41586-019-1510-y