: Video-to-Text Information Bottleneck
Evaluation for TL;DR
Abstract
Many decision-making tasks, where both accuracy and efficiency matter, still require human supervision. For example, tasks like traffic officers reviewing hour-long dashcam footage or researchers screening conference videos can benefit from concise summaries that reduce cognitive load and save time. Yet current vision-language models (VLMs) often produce verbose, redundant outputs that hinder task performance. Existing video caption evaluation depends on costly human annotations and overlooks the summaries’ utility in downstream tasks. We address these gaps with Video-to-text Information Bottleneck Evaluation (VIBE), an annotation-free method that scores VLM outputs using two metrics: grounding (how well the summary aligns with visual content) and utility (how informative it is for the task). VIBE selects from randomly sampled VLM outputs by ranking them according to the two scores to support effective human decision-making. Human studies on LearningPaper24, SUTD-TrafficQA, and LongVideoBench show that summaries selected by VIBE consistently improve performance—boosting task accuracy by up to and reducing response time by compared to naive VLM summaries or raw video.111Source code: https://github.com/UTAustin-SwarmLab/Task-aware-TLDR-Public
1 Introduction
Efficiently extracting relevant information from extensive video is a major bottleneck for human decision-making, where both accuracy and efficiency matter [1, 2, 3, 4]. Tasks demanding human supervision, such as a traffic officer analyzing hours of dashcam footage to determine fault or a researcher distilling key insights from a lengthy oral presentation, are often limited by the time and cognitive load required to process raw video streams. In this work, we aim to improve the quality and brevity of video summaries to boost human task performance compared to existing vision-language model (VLM) outputs and raw video, especially for longer clips where summarization offers greater utility.
Existing video caption evaluation metrics, however, rely heavily on reference-based comparisons to human-annotated summaries [5, 6, 7, 8]. These metrics face two main issues. First, these works require human annotators to watch video clips and write gold-standard captions, which contradicts the goal of reducing human response time and limits generalization to unseen video clips. Second, they are oblivious to downstream tasks and fail to measure how well captions support the tasks.
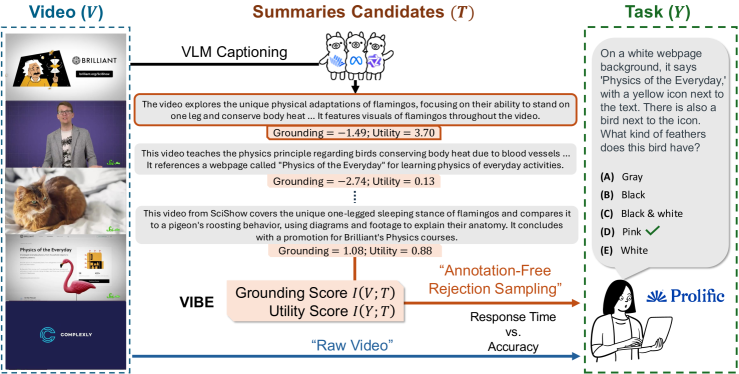
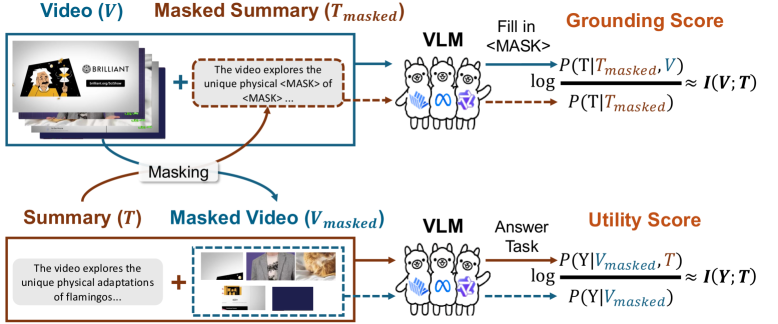
We propose Video-to-text Information Bottleneck Evaluation (VIBE), an annotation-free method for selecting task-relevant video summaries without model retraining. As shown in Figure˜1, VIBE defines two metrics—grounding and utility scores—based on the information bottleneck principle [9]. It uses pointwise mutual information to quantify how well a summary reflects video evidence and supports the downstream task. We leverage next-token prediction in VLMs to access the probability of generating summaries or task answers. By comparing these probabilities with and without key information, we measure how well one modality (text or video) compensates for missing information in the other to assess grounding and task relevance, as shown later in Figure˜2. Using these scores, VIBE selects the most decision-supportive summary for humans from randomly sampled VLM outputs via annotation-free rejection sampling, which filters candidates without human labels for faster task completion than watching full video clips.
To evaluate VIBE, we conduct between-subjects user studies with participants across three datasets—LearningPaper24 (self-curated), LongVideoBench [10], and SUTD-TrafficQA [11]—measuring human performance in terms of accuracy, response time, and inverse efficiency score, the ratio of response time to accuracy [12]. Results show that summaries selected with maximal utility score improve task accuracy by up to , while those chosen by maximizing grounding score yield up to gains, both on the LongVideoBench dataset. VIBE-selected summaries also significantly reduce response time compared to raw video. We also observe a strong positive correlation between utility score and human accuracy, and a strong negative correlation between summary length and response time per word. These patterns highlight the value of concise, relevant information for efficient human decision-making.
Contributions.
Our contributions are threefold: (a) We identify the need and propose the problem of annotation-free, task-aware evaluation for video-to-text summarization, improving human response time and accuracy without relying on gold-standard captions. (b) We propose VIBE, an annotation-free evaluation framework that combines grounding and utility scores of video clips to rank and select high-quality summaries from VLM outputs without requiring retraining. (c) We demonstrate through user studies that VIBE summaries significantly boost humans’ task accuracy by up to and reduce response time by up to compared to standard VLM outputs.
Critique and Open Problems.
This work reframes the video-to-text evaluation problem through the lens of human decision support, offering an annotation-free, scalable alternative to costly reference-based comparisons. VIBE’s ability to score and select summaries without training makes it a practical plug-in for both closed- and open-source VLMs. Looking ahead, VIBE opens several promising directions. One is exploring the joint optimization of summary generation and selection through self-supervised fine-tuning of VLMs. Another is extending beyond human supervision tasks to investigate whether task-aware captions can improve VLM performance on downstream reasoning tasks. These directions point to the broader applicability of VIBE beyond evaluating video summarization.
2 Related Work
Reference-based Video Caption Evaluation.
Evaluating video caption quality is crucial for tasks like video question answering [13, 14], text-to-video retrieval [5, 15, 16], and multimodal language model training. The quality of captions greatly impacts the downstream performance of tasks and models. While existing benchmarks compare VLM-generated captions to gold-standard references using metrics like ROUGE [17], BLEU [18], and CIDEr [19], these are costly to curate and focus solely on captions rather than video context. In contrast, we propose VIBE, a new evaluation metric that incorporates video context, requires no gold standard, and can be applied to unseen video-caption pairs. VIBE extends the information-theoretic approach of [20], which uses pointwise mutual information to assess news summaries for language model tuning. We adapt it for video captions and examine their effect on human task accuracy and response time.
Human-Centric Evaluation via Response Time and Accuracy.
In the context of human-agent interaction involving natural language [21], traditional human evaluations have focused on assessing summaries based on fluency and informativeness [22, 23], but these methods are often subjective and hard to scale. To address this, we adopt an extrinsic evaluation approach that measures how summaries affect human performance on downstream tasks [24, 25]. Specifically, we evaluate captions based on human response time and accuracy on multiple-choice questions grounded in video content. To account for the speed-accuracy tradeoff [26], we also report the inverse efficiency score [12], which normalizes response time by accuracy.
3 Preliminaries
Mutual Information.
Our work heavily relies on the concept of mutual information. For the ease of readers, we briefly introduce it here. Mathematically, for two random variables, , we can calculate their mutual information:
| (1) |
where the expectation operator is over the joint probability distribution of and .
Intuitively, mutual information measures the reduction in uncertainty about after observing . It is zero if and only if and are independent, meaning knowledge of provides no information about . Higher mutual information indicates stronger dependency between the two variables. In this work, we leverage mutual information to quantify how much the summaries retain relevant information from the raw video clips and how well they support the target downstream task.
Information Bottleneck.
The information bottleneck (IB) framework extracts relevant information from input data while compressing irrelevant details. [9] first introduced it to formalize the trade-off between accuracy and complexity in learning systems. Later, researchers applied it to domains such as neuroscience [27], natural language processing [28, 29], and computer vision [30, 31]. To ensure clarity, we modify the notation from [9] to align with our later sections, where is the raw video input, is the summary of the video, and is the downstream task of our interest.
We now introduce the IB framework, which seeks to learn a representation that discards sensitive and irrelevant information from the input while preserving information useful for predicting the target task . IB relies on minimizing the mutual information between input and a compressed representation , while preserving as much information as possible about a target variable :
| (2) |
where denotes mutual information, and controls the trade-off between compression and prediction. The optimization variable is the conditional distribution , which defines a stochastic encoder that maps to . The IB principle in eq.˜2 formalizes the trade-off between compression and prediction. Minimizing encourages stronger compression, while maximizing promotes the preservation of task-relevant information. The parameter balances these two competing objectives: a higher prioritizes retaining more information about , while a lower encourages stronger compression of .
Researchers use the IB principle to analyze generalization, regularization, and the role of hidden representations of neural networks [32, 33], where is the input of neural networks, is the output of intermediate layers, and is the classification label. It also drives recent advances in representation learning, where models aim for compact, informative encodings [34, 35].
4 Video-to-Text Information Bottleneck Evaluation (VIBE)
We now formally describe our video-to-text information bottleneck evaluation (VIBE) method. Inspired by the IB formulation in eq.˜2, we adapt its two terms for the purpose of evaluating video-to-text summary quality. We denote the raw video clips that are fed into the VLMs as , the summaries from the VLM response as , and the task target we care about as . For instance, let be a video of a paper presentation, be the summary of the presentation, and the task be to determine the primary area to see if it is of one’s interest.
Grounding Score.
In eq.˜2, the mutual information between raw data and representation is the compression term. In our setting, we reinterpret it as the grounding score, which quantifies how grounded the textual summary is to the video. The higher this score is, the more closely the summary is anchored to the video.
However, one cannot access the joint and marginal probability distributions over the occurrences of video clips or text summaries. Therefore, we can only calculate the empirical mutual information without the expectation operator to approximate the term. Literature refers to the empirical term without the expectation as pointwise mutual information [36], which we denote as . Unlike mutual information, which must be non-negative as it is the expectation of pointwise mutual information, pointwise mutual information ranges from .
We now explain the approximation technique in VIBE to calculate the grounding score. Recall from eq.˜1, we rewrite pointwise mutual information as:
| (3) |
We condition both the numerator and denominator with , a masked version of the text, to approximate . The approximation holds if is independent of both the video and the original text . Masking key content makes effectively uninformative and thus independent. Following [20], we use tf-idf [37] to identify keywords and replace them with a "<MASK>" token. This masking helps ensure that eq.˜3 reflects the true dependency between and , rather than exploiting shortcuts from the text itself. Thus, the grounding score measures how much the TL;DR remains genuinely grounded in the video beyond what the masked text alone would suggest.
To compute eq.˜3, we run two separate inferences with the same VLM to define the ratio of two conditional probabilities . The first, , is the product of next-token prediction probabilities when reconstructing the masked text given both the video and the masked input. The second, , is computed similarly but without providing the video. Only by conditioning on the masked input can we leverage the VLM’s next-token prediction probabilities to estimate these likelihoods. By dividing these two conditional probabilities and taking the logarithm, we approximate the pointwise mutual information, allowing us to estimate the grounding score.
Utility Score.
The second term in eq.˜2, the informativeness term, is the mutual information between the representation and the target task. We refer to it as the utility score, which measures how useful the summary is for solving the downstream task. A higher utility score indicates that the summary preserves more information relevant to predicting or completing the target task. Similar to the grounding score, directly computing is intractable because we cannot access the true probability distributions. Again, we approximate it using the pointwise mutual information with conditional probabilities:
| (4) |
Similar to the grounding score in eq.˜3, denotes video clips with key information removed to reduce their direct informativeness about both the summary and the task label . To compute the utility score in eq.˜4, we compare two model inferences: one conditioned on both the summary and the masked video , and the other on alone. Since both use the same masked visual input, any improvement in predicting must come from the information provided by . Intuitively, if a summary is useful, it should compensate for the missing content in the masked video and help recover task-relevant information. Thus, the utility score quantifies how well the summary restores information necessary for predicting the task, directly measuring the summary’s contribution to downstream decision-making.


Rejection Sampling over Grounding and Utility Scores.
We now describe how VIBE optimizes grounding and utility scores to select more informative and task-relevant video-to-text summaries for humans, as shown in Figure˜1. Given multiple summaries sampled from the VLM’s output distribution , VIBE selects the candidate that maximizes a weighted sum of the two pointwise mutual information terms:
| (5) |
Here, are hyperparameters controlling the trade-off between grounding and utility in eq.˜5. A higher emphasizes alignment with video, favoring summaries that faithfully reflect the video, while a higher prioritizes task relevance, selecting summaries that improve downstream performance.
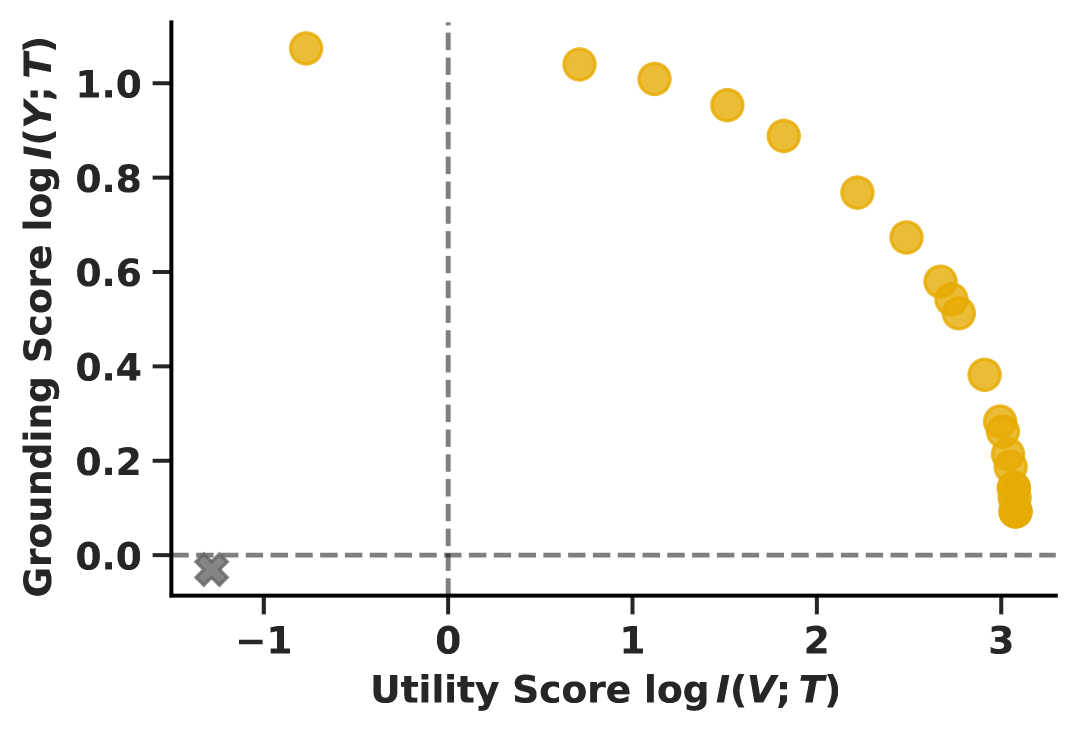
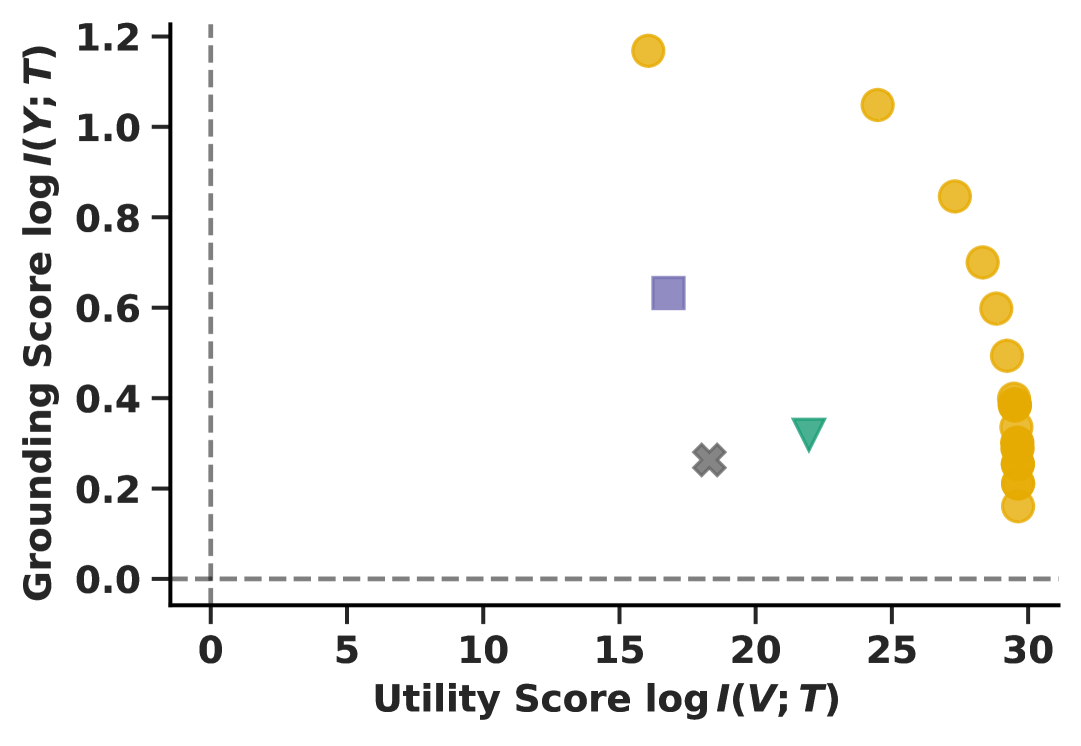
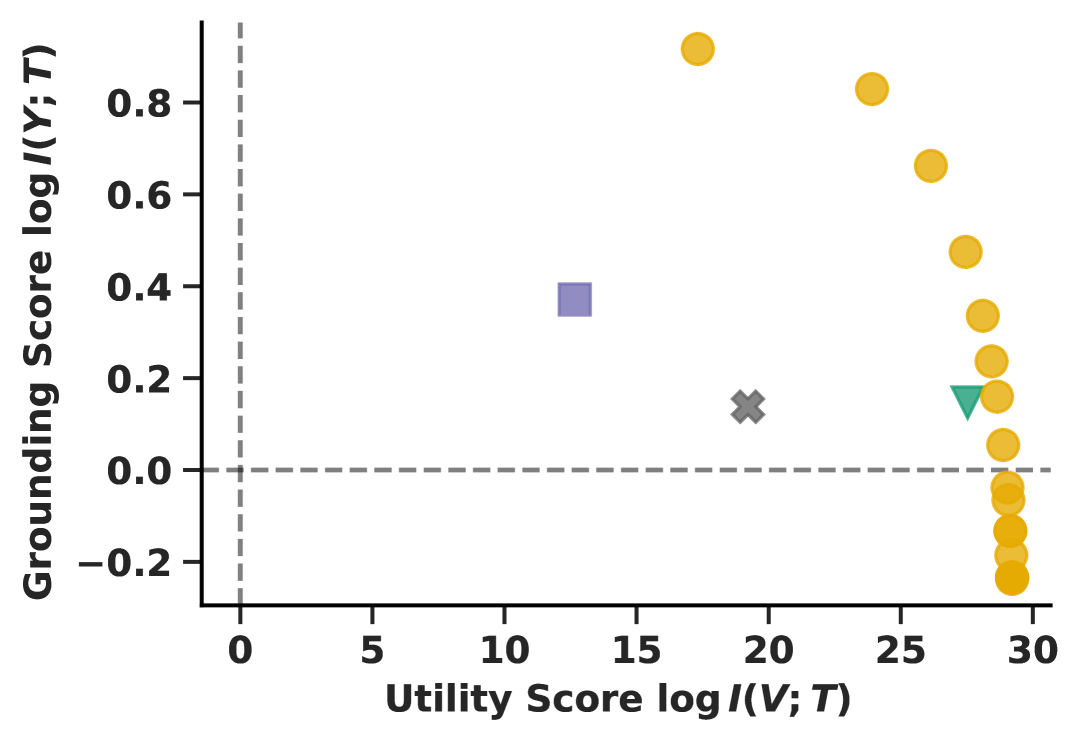
Our formulation differs from traditional IB, where compression serves as a regularizer during model training to mitigate overfitting. In contrast, VIBE does not train a model—it selects a summary. Overfitting is therefore not a concern, and maximizing both mutual information terms is desirable to produce summaries that are both useful and faithful. To this end, we consider to jointly maximize both scores. Then, to explore potential trade-offs between the two scores, we perform a convex combination sweep over , with . Each pair is applied consistently across all datasets. This linear scalarization technique, commonly used in multi-objective optimization [38], produces the convex (“Pareto curve") shown in Figure˜3, empirically revealing the inherent trade-off between grounding and utility scores.
Our results based on grounding and utility scores across sampled summaries from multiple datasets reveal a consistent trade-off between the two objectives. As shown in Figure˜3, summaries selected by VIBE with varying and form a Pareto front, capturing the inherent trade-off between the two VIBE scores. In contrast, randomly sampled summaries (Naive VLM) consistently fall inside this Pareto curve across datasets, indicating suboptimal grounding and utility. We observe this pattern when evaluating the two VIBE scores of VLM-generated summaries on tasks from LearningPaper24, SUTD-TrafficQA, and LongVideoBench. Summaries with high grounding scores tend to mirror the video content closely but often include redundant or irrelevant details for the task. In contrast, summaries with high utility scores boost task accuracy and response efficiency but may overlook important visual context. This trade-off reflects the core tension in the IB framework. By tuning and , VIBE adjusts this balance to match the needs of different downstream applications. We detail the experimental settings in the next section.
As shown empirically in the experiments, higher utility scores correlate with higher human task accuracy. Thus, one can use VIBE to select summaries with higher utility scores and present only the most informative summaries to humans, filtering out less useful ones. Notably, calculating the utility score requires access to task labels , but not gold-standard, human-annotated labels for summary as in previous works. When task labels are unavailable, VIBE can select summaries based on the highest grounding score, an unsupervised measure of alignment between the video and the generated summaries. Although the grounding score alone yields lower human performance than the utility score, our user study shows it still improves task accuracy compared to unfiltered VLM summaries.
From Evaluation to Real-World Use.
VIBE evaluates the quality of summaries only from the VLM perspective, but its connection to human decision-making performance remains unanswered solely by the formulation. To bridge this gap, we conduct user studies measuring how different summary qualities, as evaluated by VIBE, impact human decision-making performance in Section˜5. VIBE relies solely on text generation and next-token probability access, using black-box access to VLMs like the OpenAI API [39]. It enables VIBE to work with both closed- and open-source VLMs and scale well to real-world scenarios.
5 Experiment
We conduct user studies across three diverse datasets to evaluate how VIBE-generated summaries support human decision-making. The study measures participants’ accuracy and response time in answering questions about video content. Here, we use Qwen2.5-VL-72B-AWQ [40] to evaluate VIBE for all datasets. A representative qualitative example from the study is provided in Appendix˜A. We also show that VIBE works across various VLMs through ablation studies.
5.1 Datasets
For evaluation, we select three datasets varying in domain, duration, and task nature.
LearningPaper24
We introduce LearningPaper24, a curated dataset of 2,287 video presentations from ICLR 2024 and NeurIPS 2024, filtered based on key criteria: a valid OpenReview ID, an accessible SlidesLive video, an author-provided TL;DR and abstract, and a clearly defined primary area. Details on the curation process and dataset statistics are provided in Appendix˜C. The task associated with this dataset is to identify the primary area of each paper from options. See instruction details in Appendix˜E.
LongVideoBench & SUTD-TrafficQA
LongVideoBench [10] features long instructional clips with QA pairs for extended reasoning, while SUTD-TrafficQA [11] contains short traffic clips with multiple-choice questions on causal and temporal understanding. p-Participants answer one question per each LongVideoBench clip; four questions per each SUTD-TrafficQA clip.
Preprocessing
In all datasets, we mask text by removing keywords with high tf-idf scores. For LearningPaper24, which features slide videos, we extract and mask keywords in the slide using EasyOCR [41]. For the other two datasets, we apply random cropping to all video frames. We use a subset of each dataset for VIBE evaluation and user studies (details provided in Appendix˜D).
5.2 User Study Design
For each dataset, 10 video stimuli with multiple-choice questions are shown in randomized order. We adopt a between-subjects design where participants are assigned to one of the four conditions listed below, and the format in which the stimulus is presented varies by the condition.
Independent Variables.
Participants are assigned to one of four conditions. In the Video Only condition, they watch the original video without text. In the remaining conditions, they view only a VLM-generated summary: a randomly selected VLM summary (Naive), the top-ranked summary from response candidates222 in this study. by utility score (Max-U) or by grounding score (Max-G).
Dependent Measures.
We report three metrics: accuracy, the proportion of correct responses across 10 stimuli; response time, the time (in seconds) spent reading or watching each stimulus and answering its corresponding questions; and inverse efficiency score (IES), the ratio of response time to accuracy, to account for speed–accuracy trade-offs [12].
Hypotheses.
We evaluate the following hypotheses: (H1) Participants in the Max-U and Max-G will achieve higher accuracy than those in Naive VLM. (H2) Participants in the Max-U and Max-G will respond more quickly than those in the Video Only. (H3) Max-U and Max-G will yield lower (i.e., more efficient) IES scores than Video Only, reflecting a better speed–accuracy trade-off.
Participants.
We recruit participants across three datasets: for LearningPaper24, for SUTD-TrafficQA, and for LongVideoBench. For LearningPaper24, participants are primarily CS graduate students or prescreened degree holders on Prolific [42]; participants for the other datasets are recruited generally. The average age is years, with a gender distribution of male, female, and non-binary. Further details are provided in Appendix˜F.
5.3 User Study Results and Analysis
We assess statistical significance using the independent t-test, reporting the t-statistic (with degrees of freedom ), the significance level , and the effect size measured by Cohen’s .
| Dataset | Duration (s) | Metric | IV Conditions | |||
|---|---|---|---|---|---|---|
| Video Only | Naive | Max-G (ours) | Max-U (ours) | |||
| LearningPaper24 | 250–325 | Acc | 23.50 10.62 | 28.42 12.68 | 35.00 7.91 | 37.89 10.04 |
| RT | 192.73 108.01 | 47.48 20.31 | 61.13 39.33 | 46.69 25.06 | ||
| IES | 9.85 6.63 | 1.81 1.51 | 1.85 1.20 | 1.28 0.66 | ||
| LongVideoBench | 221–489 | Acc | 74.44 14.23 | 46.43 13.94 | 59.23 9.17 | 65.00 15.47 |
| RT | 202.35 87.26 | 86.50 63.33 | 71.93 35.96 | 65.86 41.34 | ||
| IES | 2.93 1.48 | 1.83 1.01 | 1.25 0.67 | 1.14 0.80 | ||
| SUTD-TrafficQA | 2–10 | Acc | 82.86 5.08 | 76.96 6.89 | 80.47 3.21 | 84.81 4.65 |
| RT | 48.63 21.30 | 79.46 25.77 | 80.97 41.11 | 137.27 81.64 | ||
| IES | 0.59 0.27 | 1.05 0.37 | 1.01 0.52 | 1.66 1.02 | ||
On H1 (Accuracy).
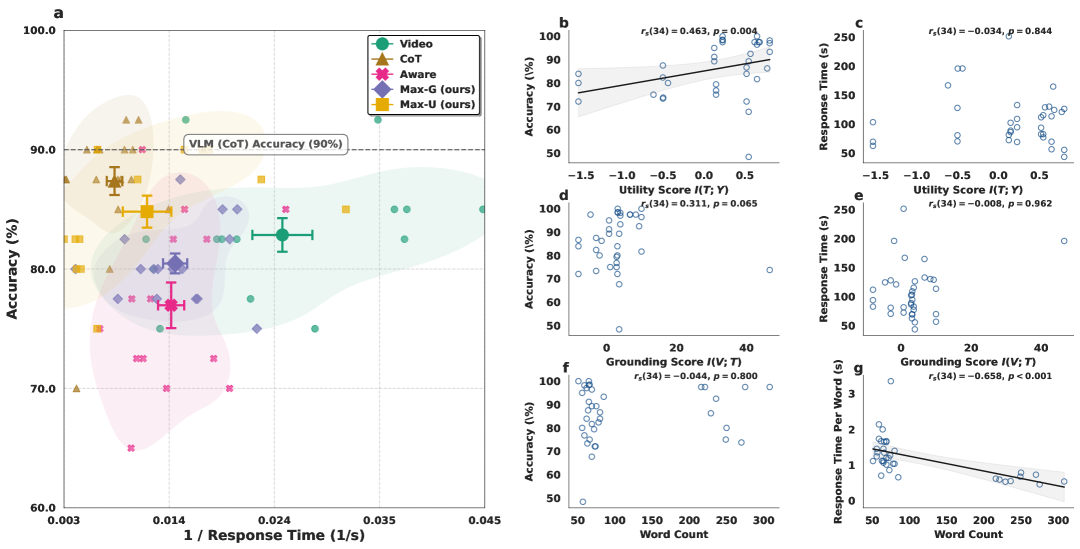
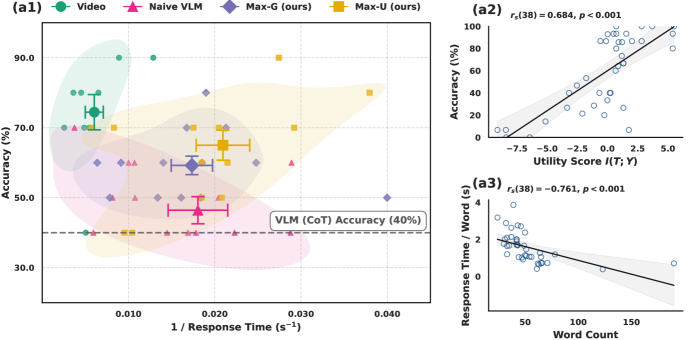
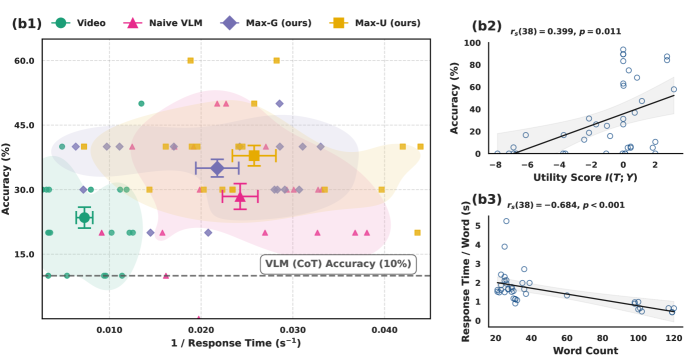
As shown in Table˜1 and (a1, b1) of Figure˜4 (with Max-U in yellow and Max-G in purple above Naive VLM in pink), both Max-U and Max-G consistently outperform the Naive VLM across all datasets, confirming H1. Max-U achieves the largest gains, with statistically significant improvements over Naive VLM in LearningPaper24 (), LongVideoBench (), and SUTD-TrafficQA (), likely due to its focus on task-relevant content that helps users quickly locate key information. However, computing the utility score requires task labels, which may limit its general applicability and scalability. Max-G, while yielding smaller gains, still significantly outperforms the baseline (e.g., LearningPaper24: ; LongVideoBench: ; SUTD-TrafficQA: ). Crucially, calculating the grounding score is fully self-supervised and does not require task labels, making it an alternative that still delivers meaningful accuracy gains.
On H2 (Response Time).
Table˜1 shows that both Max-U and Max-G significantly reduce response times compared to the Video baseline in LearningPaper24 () and LongVideoBench (). However, this trend does not extend to SUTD-TrafficQA, where response time shows no consistent improvement. It is not surprising, as the significantly shorter video durations (2–10 seconds, compared to over 3 minutes in the other datasets) inherently limit the benefits of summarization. These results align with the expectation that VIBE is most effective in reducing cognitive load for long video clips.
On H3 (IES).
As shown in Table˜1, Max-U significantly outperform the Video Only baseline in LearningPaper24 () and LongVideoBench (), with Max-G showing similar gains (LearningPaper24: , , ; LongVideoBench: , , ). Furthermore, Max-U also outperform Naive VLM () in LongVideoBench. These results highlight VIBE’s effectiveness in settings where processing full video clips is costly. In contrast, SUTD-TrafficQA shows limited IES improvement: despite Max-U’s accuracy improvements over Naive VLM and Video Only, the brevity of the clips and the visual nature of fine-grained actions reduce the benefit of text-based summaries.
Correlation Analyses.
We explore the correlation between utility score, grounding score, word count, and human performance (accuracy and response time) using Spearman’s rank coefficient [43], which is robust to outliers and non-linear relationships. Full plots are provided in Appendix˜G. Two consistent trends hold across datasets: First, utility score positively correlates with accuracy: strongly in LongVideoBench (, ), and moderately in LearningPaper24 (, ) and SUTD-TrafficQA (, ). Second, word count is strongly negatively correlated with response time per word (LongVideoBench: , LearningPaper24: , SUTD-TrafficQA: , all ), implying that longer summaries lead to faster processing per word, possibly due to reduced engagement and more shallow reading.
Key Takeaways.
Max-U and Max-G outperform Naive VLMs in accuracy, response time, and inverse efficiency score, with Max-U providing the most significant improvements, especially for longer video clips. Max-G, though offering smaller gains, remains a self-supervised alternative that improves accuracy without task labels. The benefits of summarization are less pronounced in shorter video clips, like those in SUTD-TrafficQA, where brief durations limit gains. Correlation analyses show the VIBE utility scores align with higher accuracy, while longer summaries tend to increase unit response time, highlighting the importance of concise, relevant information.
5.4 Ablation over VLM Variants
VIBE scores can inherit bias from the underlying VLMs due to their training data and conditional probability estimates used in mutual information computation. To assess robustness under such model-induced bias, we compare VLMs of varying size and source. As shown in Appendix˜B, different backbones produce consistent IB score trends and scales. This consistency suggests that lightweight models can efficiently verify outputs from larger ones. To further reduce bias, one can evaluate a single summary using multiple VLMs—an ensemble-style strategy aligned with mixture-of-experts [44, 45] and model selection techniques [46]. This reflects the intuition that good outputs are often hard to generate, but easy to verify.
Limitations.
Despite being training-free, VIBE requires multiple VLM inferences for grounding score evaluation, with the number of masked tokens influencing inference steps. Its pointwise mutual information estimate may be biased by two main factors: (a) the text and video masking strategy, and (b) the conditional probability modeling of the VLMs. For (a), the tf-idf score we use to select keywords for text masking requires hyperparameter tuning, and the optimal masking strategy remains an open question. For (b), VLMs introduce bias through their training data and modeling assumptions in computing eq.˜5. Using separate models for generation and evaluation, as discussed in Section˜5.4, can help mitigate this bias.
6 Conclusion
In this work, we introduce VIBE, an annotation-free framework for evaluating and selecting video-to-text summaries to support human decision-making. Unlike traditional caption evaluation metrics that rely on human-written references, VIBE uses information-theoretic scores—utility and grounding—to assess how well a summary supports a downstream task and aligns with video evidence. This enables scalable, task-aware summary selection without the need for retraining or annotations. Through a large-scale user study spanning three diverse datasets, we show that summaries selected by VIBE significantly improve both task accuracy and response time, especially for longer video clips where information overload is more likely.
References
- [1] Saleema Amershi et al. “Guidelines for Human-AI Interaction” In Proceedings of the 2019 CHI Conference on Human Factors in Computing Systems, CHI ’19 Glasgow, Scotland Uk: Association for Computing Machinery, 2019, pp. 1–13 DOI: 10.1145/3290605.3300233
- [2] Andreas Holzinger “Interactive machine learning for health informatics: when do we need the human-in-the-loop?” In Brain informatics 3.2 Springer, 2016, pp. 119–131
- [3] Doris Xin et al. “Accelerating Human-in-the-loop Machine Learning: Challenges and Opportunities” In Proceedings of the Second Workshop on Data Management for End-To-End Machine Learning, DEEM’18 Houston, TX, USA: Association for Computing Machinery, 2018 DOI: 10.1145/3209889.3209897
- [4] Andreas Holzinger, Kurt Zatloukal and Heimo Müller “Is human oversight to AI systems still possible?” In New Biotechnology 85, 2025, pp. 59–62 DOI: https://doi.org/10.1016/j.nbt.2024.12.003
- [5] Jun Xu, Tao Mei, Ting Yao and Yong Rui “Msr-vtt: A large video description dataset for bridging video and language” In Proceedings of the IEEE conference on computer vision and pattern recognition, 2016, pp. 5288–5296
- [6] Xin Wang et al. “VaTeX: A Large-Scale, High-Quality Multilingual Dataset for Video-and-Language Research” In The IEEE International Conference on Computer Vision (ICCV), 2019
- [7] Wenhao Chai et al. “AuroraCap: Efficient, Performant Video Detailed Captioning and a New Benchmark” In The Thirteenth International Conference on Learning Representations, 2025 URL: https://openreview.net/forum?id=tTDUrseRRU
- [8] Mathew Monfort et al. “Spoken moments: Learning joint audio-visual representations from video descriptions” In Proceedings of the IEEE/CVF Conference on Computer Vision and Pattern Recognition, 2021, pp. 14871–14881
- [9] Naftali Tishby, Fernando C. Pereira and William Bialek “The information bottleneck method”, 2000 arXiv: https://arxiv.org/abs/physics/0004057
- [10] Haoning Wu, Dongxu Li, Bei Chen and Junnan Li “Longvideobench: A benchmark for long-context interleaved video-language understanding” In Advances in Neural Information Processing Systems 37, 2024, pp. 28828–28857
- [11] Li Xu, He Huang and Jun Liu “Sutd-trafficqa: A question answering benchmark and an efficient network for video reasoning over traffic events” In Proceedings of the IEEE/CVF conference on computer vision and pattern recognition, 2021, pp. 9878–9888
- [12] James T Townsend and F Gregory Ashby “Stochastic modeling of elementary psychological processes” CUP Archive, 1983
- [13] Dejing Xu et al. “Video Question Answering via Gradually Refined Attention over Appearance and Motion” In ACM Multimedia, 2017
- [14] Yaoyao Zhong et al. “Video Question Answering: Datasets, Algorithms and Challenges”, 2022 arXiv: https://arxiv.org/abs/2203.01225
- [15] Po-han Li et al. “Any2Any: Incomplete Multimodal Retrieval with Conformal Prediction” In arXiv preprint arXiv:2411.10513, 2024
- [16] Mohammad Omama, Po-han Li and Sandeep P. Chinchali “Exploiting Distribution Constraints for Scalable and Efficient Image Retrieval” In The Thirteenth International Conference on Learning Representations, 2025 URL: https://openreview.net/forum?id=d0tlL0ZWlu
- [17] Chin-Yew Lin “Rouge: A package for automatic evaluation of summaries” In Text summarization branches out, 2004, pp. 74–81
- [18] Kishore Papineni, Salim Roukos, Todd Ward and Wei-Jing Zhu “Bleu: a method for automatic evaluation of machine translation” In Proceedings of the 40th annual meeting of the Association for Computational Linguistics, 2002, pp. 311–318
- [19] Ramakrishna Vedantam, C Lawrence Zitnick and Devi Parikh “Cider: Consensus-based image description evaluation” In Proceedings of the IEEE conference on computer vision and pattern recognition, 2015, pp. 4566–4575
- [20] Jaehun Jung et al. “Information-Theoretic Distillation for Reference-less Summarization” In First Conference on Language Modeling, 2024 URL: https://openreview.net/forum?id=JXcXnJJSuL
- [21] Shenghui Chen, Daniel Fried and Ufuk Topcu “Human-agent cooperation in games under incomplete information through natural language communication” In International Joint Conference on Artificial Intelligence, Human-Centred AI, 2024
- [22] Anja Belz and Ehud Reiter “Comparing automatic and human evaluation of NLG systems” In 11th conference of the european chapter of the association for computational linguistics, 2006, pp. 313–320
- [23] Yvette Graham, Timothy Baldwin, Alistair Moffat and Justin Zobel “Can machine translation systems be evaluated by the crowd alone” In Natural Language Engineering 23.1 Cambridge University Press, 2017, pp. 3–30
- [24] Ani Nenkova and Kathleen McKeown “Automatic summarization” In Foundations and Trends® in Information Retrieval 5.2–3 Now Publishers, Inc., 2011, pp. 103–233
- [25] Xiao Pu, Mingqi Gao and Xiaojun Wan “Is summary useful or not? an extrinsic human evaluation of text summaries on downstream tasks” In arXiv preprint arXiv:2305.15044, 2023
- [26] Richard P Heitz “The speed-accuracy tradeoff: history, physiology, methodology, and behavior” In Frontiers in neuroscience 8 Frontiers Media SA, 2014, pp. 150
- [27] Michael Kleinman et al. “A cortical information bottleneck during decision-making” In bioRxiv, 2023
- [28] Peter West, Ari Holtzman, Jan Buys and Yejin Choi “Bottlesum: Unsupervised and self-supervised sentence summarization using the information bottleneck principle” In arXiv preprint arXiv:1909.07405, 2019
- [29] Cenyuan Zhang et al. “Improving the adversarial robustness of NLP models by information bottleneck” In arXiv preprint arXiv:2206.05511, 2022
- [30] Gordon, Greenspan and Goldberger “Applying the information bottleneck principle to unsupervised clustering of discrete and continuous image representations” In Proceedings Ninth IEEE International Conference on Computer Vision, 2003, pp. 370–377 vol.1 DOI: 10.1109/ICCV.2003.1238368
- [31] Naftali Tishby and Noga Zaslavsky “Deep learning and the information bottleneck principle” In 2015 IEEE Information Theory Workshop (ITW), 2015, pp. 1–5 DOI: 10.1109/ITW.2015.7133169
- [32] Kenji Kawaguchi, Zhun Deng, Xu Ji and Jiaoyang Huang “How does information bottleneck help deep learning?” In International Conference on Machine Learning, 2023, pp. 16049–16096 PMLR
- [33] Ziv Goldfeld and Yury Polyanskiy “The information bottleneck problem and its applications in machine learning” In IEEE Journal on Selected Areas in Information Theory 1.1 IEEE, 2020, pp. 19–38
- [34] Sijie Mai, Ying Zeng and Haifeng Hu “Multimodal Information Bottleneck: Learning Minimal Sufficient Unimodal and Multimodal Representations” In IEEE Transactions on Multimedia 25, 2023, pp. 4121–4134 DOI: 10.1109/TMM.2022.3171679
- [35] Riashat Islam et al. “Representation Learning In Deep RL Via Discrete Information Bottleneck” In AISTATS 2023, 2023
- [36] Gerlof Bouma “Normalized (pointwise) mutual information in collocation extraction” In Proceedings of GSCL 30 Potsdam, 2009, pp. 31–40
- [37] Gerard Salton and Christopher Buckley “Term-weighting approaches in automatic text retrieval” In Information Processing & Management 24.5, 1988, pp. 513–523 DOI: https://doi.org/10.1016/0306-4573(88)90021-0
- [38] Stephen P Boyd and Lieven Vandenberghe “Convex optimization” Cambridge university press, 2004
- [39] OpenAI “OpenAI Python Library” Accessed: 2025-04-28 GitHub, https://github.com/openai/openai-python, 2025
- [40] Shuai Bai et al. “Qwen2.5-VL Technical Report”, 2025 arXiv: https://arxiv.org/abs/2502.13923
- [41] JaidedAI “EasyOCR: Ready-to-use OCR with 80+ supported languages” Accessed: 2025-05-15, https://github.com/JaidedAI/EasyOCR, 2020
- [42] Stefan Palan and Christian Schitter “Prolific. ac—A subject pool for online experiments” In Journal of Behavioral and Experimental Finance 17 Elsevier, 2018, pp. 22–27
- [43] Charles Spearman “The proof and measurement of association between two things.” Appleton-Century-Crofts, 1961
- [44] Isaac Ong et al. “RouteLLM: Learning to Route LLMs from Preference Data” In The Thirteenth International Conference on Learning Representations, 2025 URL: https://openreview.net/forum?id=8sSqNntaMr
- [45] Yanqi Zhou et al. “Mixture-of-experts with expert choice routing” In Advances in Neural Information Processing Systems 35, 2022, pp. 7103–7114
- [46] Po-han Li et al. “Online Foundation Model Selection in Robotics” arXiv:2402.08570 [cs] arXiv, 2024 DOI: 10.48550/arXiv.2402.08570
- [47] Zhe Chen et al. “Expanding Performance Boundaries of Open-Source Multimodal Models with Model, Data, and Test-Time Scaling”, 2025 arXiv: https://arxiv.org/abs/2412.05271
- [48] Jinguo Zhu et al. “InternVL3: Exploring Advanced Training and Test-Time Recipes for Open-Source Multimodal Models”, 2025 arXiv: https://arxiv.org/abs/2504.10479
Appendix
Appendix A Qualitative Result
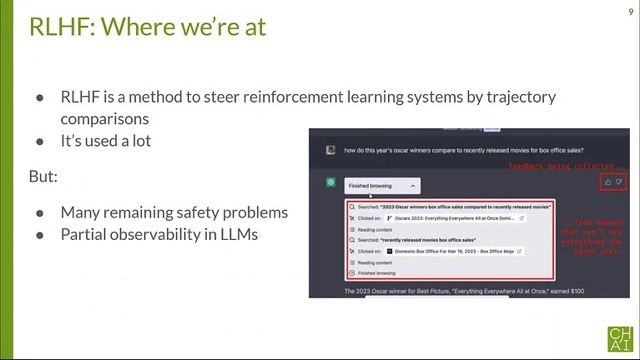
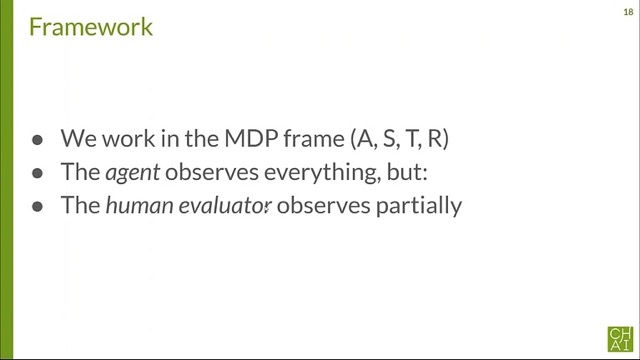
To illustrate differences across summary generation methods, we present a qualitative example. In Table˜3, each condition—Naive, Max-U, Max-G, and CoT—produces a distinct response based on the same video input (keyframe thumbnails shown in Figure˜5). For better comparison, we also provide the original TL;DR and abstract from the authors on OpenReview in Table˜2. We highlight key terms derived from OpenReview metadata and tf-idf analysis by masking them in gray.
| Type | Paper Summary |
|---|---|
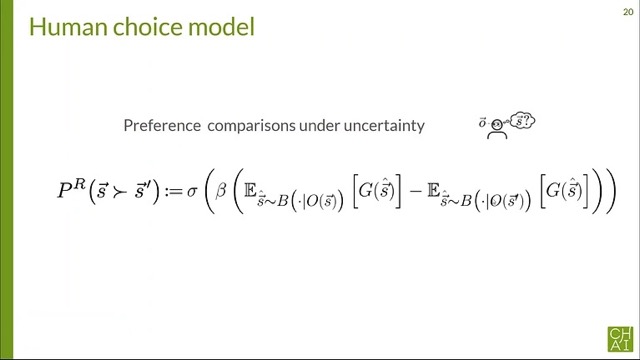
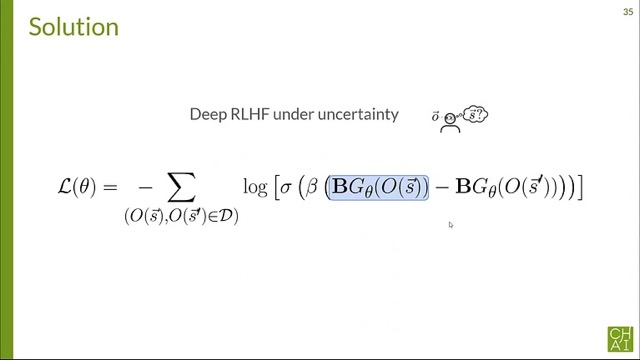
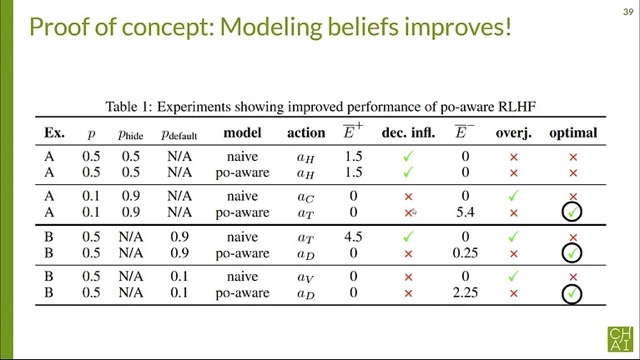
| TL;DR | We study the challenges that arise when learning reward functions with human feedback from partial observations |
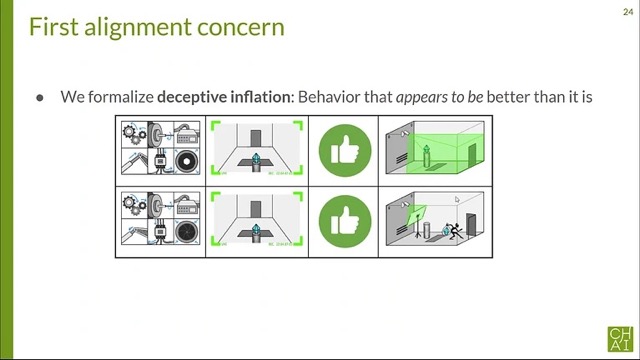
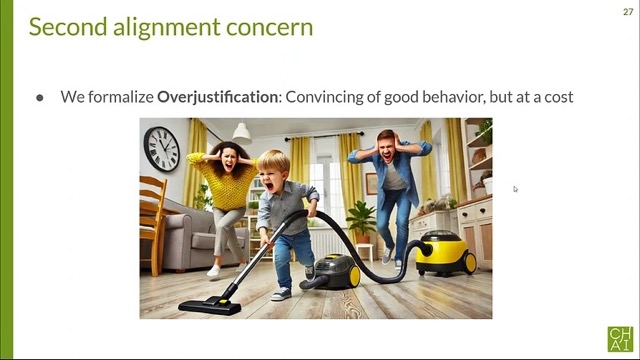
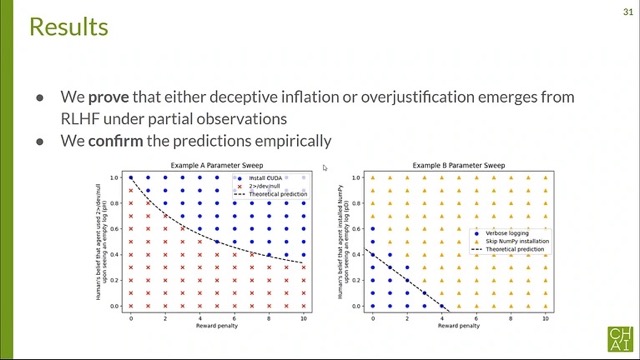
| Abstract | Past analyses of reinforcement learning from human feedback (RLHF) assume that the human evaluators fully observe the environment. What happens when human feedback is based only on partial observations? We formally define two failure cases: deceptive inflation and overjustification. Modeling the human as Boltzmann-rational w.r.t. a belief over trajectories, we prove conditions under which RLHF is guaranteed to result in policies that deceptively inflate their performance, overjustify their behavior to make an impression, or both. Under the new assumption that the human’s partial observability is known and accounted for, we then analyze how much information the feedback process provides about the return function. We show that sometimes, the human’s feedback determines the return function uniquely up to an additive constant, but in other realistic cases, there is irreducible ambiguity. We propose exploratory research directions to help tackle these challenges and experimentally validate both the theoretical concerns and potential mitigations, and caution against blindly applying RLHF in partially observable settings. |
| Condition | Summary Response |
|---|---|
| Naive | This paper explores the challenges of partial observability in reinforcement learning from human feedback, focusing on deceptive inflation and overjustification in AI systems. |
| Max-U | This research investigates challenges in ensuring AI safety and addressing partial observability through advanced frameworks in human-machine interactions and reinforcement learning. |
| Max-G | The presentation discusses the challenges of partial observability in reinforcement learning from human feedback, focusing on deceptive inflation and overjustification in AI systems. |
| CoT | The slides discuss challenges in reinforcement learning from human feedback, particularly focusing on partial observability and the issues of deceptive inflation and overjustification. The content delves into the framework of Markov Decision Processes (MDPs) and the human choice model, which are central to reinforcement learning. The presentation also addresses safety problems and alignment concerns, which are critical in the context of human-AI interaction. Given the focus on reinforcement learning and the interaction between AI and human evaluators, the most suitable area for this paper is one that encompasses both reinforcement learning and the ethical considerations of human-AI interaction. |
Appendix B Ablation Study on Evaluating with Various VLMs


We conduct an ablation study to examine how different VLM variants affect the reliability of VIBE. Specifically, we compare QwenVL-2.5-72B-AWQ [40] (used in the main paper) with InternVL2.5-8B-MPO [47] and InternVL3-38B [48]. These models vary in size, architecture, and pretraining sources. We apply VIBE to the same set of summaries to compute their utility and grounding scores. Results in Figure˜6 show consistent VIBE score trends across models, indicating that smaller or alternate VLMs yield similar evaluation signals while reducing inference cost and potential bias. Notably, various VLMs give similar ranges of both utility and grounding scores. The consistency across models further supports the generalizability of VIBE as a training-free framework.
Appendix C LearningPaper24 Dataset Curation
We source the dataset from the public PaperCopilot PaperLists repository, which indexes all accepted papers at ICLR 2024 and NeurIPS 2024. To ensure data quality and completeness, we apply the following filtering criteria: (1) the paper must have a valid OpenReview ID to guarantee access to full metadata and public reviews; (2) the associated SlidesLive presentation video must be accessible and playable, verified via a headless browser; (3) a TL;DR summary must be present on OpenReview; and (4) a primary area must be specified. After applying these filters, we retain 2,287 entries from an initial set of 2,556.

OpenReview’s primary areas are often too specific or overlapping, so we remap them into 12 broader and semantically coherent categories. For example, “self-supervised learning” and “representation learning for vision” become Representation Learning, while “probabilistic methods” and “causal inference” are grouped as Probabilistic & Causal Methods. The final taxonomy is shown in Figure˜7. The final dataset includes the following required fields: OpenReview ID, SlidesLive talk ID and URL, TL;DR, abstract, and primary area. We opensource the dataset on Hugging Face. 333https://huggingface.co/datasets/vivianchen98/LearningPaper24
Appendix D VIBE Masking and Evaluation
We now report how we select data to calculate the VIBE score in Figure˜3. We further select 10 stimuli for our user study.
LearningPaper24
We randomly sample 80 papers each from ICLR 2024 and NeurIPS 2024 following the curation process in Appendix˜C. For each presentation, we generate 5 VLM responses and 1 CoT response. We compute the tf-idf score separately for each of the six response corpora. We discard words and phrases (n-grams with range 1–3) appearing in over 10% of responses and retain only those with tf-idf scores above 0.0025. We also leverage the keywords of papers provided by the authors on OpenReview for masking. We uniformly sample 20 frames from each video as VLM input, with or without random cropping applied.
SUTD-TrafficQA
We randomly sample 100 video clips from the dataset. For each video clip, we generate 5 VLM responses and 1 CoT response. All responses, including CoT, form the corpus for tf-idf computation. We discard words and phrases (n-grams with range 1–3) appearing in over 30% of responses and retain only those with tf-idf scores above 0.01. We uniformly select 20 frames from each video as the input of VLM with or without random cropping. We uniformly sample 20 frames from each video as VLM input, with or without random cropping applied.
LongVideoBench
We sample 150 video clips, each 30 to 500 seconds long, from categories ["E2O", "E2E", "O3O", "S2A", "S2E", "S2O", "SOS"]. For each clip, we generate 5 VLM responses and 1 CoT response. All responses form the tf-idf corpus. We discard words and phrases (n-grams with range 1–3) appearing in more than 50% of responses and keep only those with tf-idf scores above 0.006. We uniformly select 20 frames from each video as the input of VLM with or without random cropping. We use the LongVideoBench package to obtain 32 frames, which is also uniformly sampling the video, from each video as VLM input, with or without random cropping applied.
Appendix E User Study Instruction and Interfaces
All participants provide informed consent before participation and are compensated at a rate consistent with Prolific guidelines and institutional standards. The user interface is presented in fig.˜8. Below are the instructions provided to participants for each dataset. Text in parentheses indicates variations between video and text conditions.
Appendix F Participant Recruitment and Demographics
Table˜4 summarizes demographic information for participants recruited across the three datasets.
| Dataset | # Participants | Gender Distribution | Age (years) |
|---|---|---|---|
| LearningPaper24 | 92 | 70.65% male, 28.26% female, 1.09% non-binary | |
| SUTD-TrafficQA | 82 | 59.76% male, 40.24% female | |
| LongVideoBench | 69 | 57.97% male, 40.58% female, 1.45% non-binary | |
| Total | 243 | 63.37% male, 35.80% female, 0.82% non-binary |
Participants were assigned to IV conditions as shown in Table˜5. In addition to the four primary conditions—Max-U, Max-G, Naive, and Video Only (see Section˜5.2)—each dataset also includes a group evaluating Chain-of-Thought (CoT) responses. CoT responses are excluded from the scatter plots in the main text due to their fundamentally different generation process: unlike other conditions, CoT has access to answer options of the task, making direct comparisons unfair and potentially misleading. However, we include CoT responses in the correlation analyses, as their grounding and utility scores remain valid for assessing alignment with human performance.
| Dataset | Max-U | Max-G | Naive | Video Only | CoT |
|---|---|---|---|---|---|
| LearningPaper24 | 19 | 16 | 19 | 20 | 18 |
| SUTD-TrafficQA | 14 | 17 | 15 | 16 | 20 |
| LongVideoBench | 15 | 14 | 15 | 10 | 15 |
Appendix G Additional User Study Plots
Figure˜9 presents the full set of scatter plots and Spearman correlation results for all datasets. The left panels show scatter plots of accuracy versus inverse response time, while the right panels display correlations between accuracy and utility score, response time and utility score, accuracy and grounding score, response time and grounding score, accuracy and word count, and response time per word and word count.