Meta-Calibration of the Cosmic Magnification Coefficient: Toward Unbiased Weak Lensing Reconstruction by Counting Galaxies
Abstract
Weak lensing alters galaxy sizes and fluxes, influencing the clustering patterns of galaxies through cosmic magnification. This effect enables the reconstruction of weak lensing convergence maps for DES and DECaLS by linearly combining galaxy overdensities across magnitude bins in the , , and photometry bands (Qin et al., 2023, 2024). In this study, we enhance the lensing reconstruction method by addressing biases in the magnification coefficient estimation, which arise from incomplete consideration of selection effects, especially those induced by photometric redshift (photo-) selection. Using a Random Forest-based photo- estimation for DECaLS and DES galaxies, we quantify the impact of photo- induced selection on magnification coefficient estimation. Our results show that neglecting photo- selection introduces significant biases in the magnification coefficient, leading to deviations in the reconstructed convergence map amplitude , with values ranging from 0.4 to 3.5 depending on the survey, redshift, and magnitude cuts. By incorporating an improved magnification coefficient estimation that accounts for photo- selection, these biases are significantly reduced, with converging to as the magnitude cuts approach optimal values. This improvement is consistently observed across DES and DECaLS datasets and redshift bins, despite differences in survey strategies and depths. Our findings highlight the importance of addressing photo- induced selection to achieve unbiased weak lensing reconstructions and accurate cosmic magnification measurements.
I Introduction
Weak gravitational lensing is a powerful observational tool in cosmology that measures the subtle distortions of galaxy images (cosmic shear) or galaxy number densities (cosmic magnification). This phenomenon occurs due to the bending of light rays as they pass through gravitational field of foreground mass distributions. Weak lensing studies have provided valuable insights into the large-scale structure of the universe, the nature of dark matter, and the properties of dark energy (Bartelmann and Schneider, 2001; Kilbinger, 2015). Cosmic shear are now contributing significantly to precision cosmology (e.g., Hamana et al., 2020; Asgari et al., 2021; Giblin et al., 2021; Loureiro et al., 2022; Amon et al., 2022; Secco et al., 2022; Li et al., 2023), under ongoing surveys such as the Dark Energy Survey (DES, Dark Energy Survey Collaboration et al., 2016), the Kilo-Degree Survey (KiDS, de Jong et al., 2013), the Hyper Suprime-Cam Subaru Strategic Program survey (HSC-SSP, Aihara et al., 2018), Vera C. Rubin Observatory’s Legacy Survey of Space and Time (LSST, LSST Science Collaboration et al., 2009), Euclid (Laureijs et al., 2011), and the China Space Station Telescope (CSST) (Gong et al., 2019; Yao et al., 2024). Cosmic magnification, with improved observations, also shows great potential in weak lensing studies.
One key advantage of cosmic magnification is that it directly affects the number density of galaxies, making it straightforward to measure compared to the subtle distortions in galaxy shapes. Therefore, a larger sample of galaxies can be used. For the same reason, cosmic magnification can be detected even at very high redshifts where shape measurements become challenging. Additionally, cosmic magnification is less sensitive to systematic errors related to the point spread function (PSF) and intrinsic alignments of galaxies, which are significant challenges in cosmic shear measurements. Combining the two measurements also allows for independent cross-checks of the results.
In observations, cosmic magnification is typically detected through cross-correlations of two samples within the same sky area but at significantly different redshifts. Low-redshift lenses include luminous red galaxies (LRGs) and clusters (e.g., Bauer et al., 2014; Bellagamba et al., 2019; Chiu et al., 2016, 2020). High-redshift sources include quasars (Scranton et al., 2005; Bauer et al., 2012), Lyman break galaxies (Morrison et al., 2012; Tudorica et al., 2017), and submillimetre galaxies (Bonavera et al., 2021; Crespo et al., 2022). However, these measurements of cosmic magnification are indirect, relying on cross-correlation. Alternatively, it is also feasible to directly extract the magnification signal from multiple galaxy overdensity maps of different brightness (Zhang and Pen, 2005; Yang and Zhang, 2011; Zhang et al., 2019; Yang et al., 2015, 2017; Zhang et al., 2018; Hou et al., 2021; Ma et al., 2024). The key aspect here to consider is the flux dependence characteristic of magnification bias. The main contamination to address is galaxy intrinsic clustering. Although galaxy bias is complex (e.g., Bonoli and Pen, 2009; Hamaus et al., 2010; Baldauf et al., 2010), the primary component to eliminate is the deterministic bias. Ref. Hou et al. (2021) introduced a modified internal linear combination (ILC) method that can remove the average galaxy bias in a model-independent way.
In our recent studies (Qin et al., 2023, 2024), we applied the reconstruction method to the Dark Energy Survey (DES) and the Dark Energy Camera Legacy Survey (DECaLS). These efforts successfully suppressed galaxy intrinsic clustering to levels ranging from to , achieving convergence-shear cross-correlation detections with signal-to-noise ratios of . The magnification coefficient was estimated under the assumption of a flux-limited condition. However, the survey selection functions often deviate from an ideal flux-limited condition, leading to biases in the reconstructed convergence map amplitudes.
To address the biases in the magnification coefficient estimation, we need to comprehensively consider the real selection functions in the weak lensing analysis. These selection functions are influenced by various factors, including imaging quality, environmental and morphological selection, as well as instrumental and redshift failures. Previous studies (e.g., von Wietersheim Kramsta et al., 2021; Elvin-Poole et al., 2023; Wenzl et al., 2024) have explored these challenges in detail. For instance, (Elvin-Poole et al., 2023) used imaging simulations to demonstrate that the flux-limited approximation is insufficient for accurate magnification coefficient estimation, resulting in biases ranging from to , aligned with the biases observed in our DECaLS and DES cases.
In this study, we focus on the photo- induced selection effects in DECaLS and DES galaxy samples. Using a Random Forest algorithm, we estimate the photo- values of these galaxies, accounting for their sensitivity to galaxy flux and the influence by weak lensing magnification. By analyzing this effect and quantifying its impact on the estimation of the magnification coefficient, we propose an improved magnification coefficient estimation method that accounts for the photo- induced selection. Our results demonstrate the effectiveness of this approach in achieving unbiased weak lensing reconstructions by counting galaxies.
The paper is structured as follows. Section II introduces the RF photo- algorithm, explores the photo- induced selection effects, and evaluates their influence on the magnification coefficient estimation. Section III details the lensing reconstruction process, incorporating the improved magnification coefficient estimation, and validates the reconstruction methodology. Section IV presents the results, highlighting the improvements in the reconstructed lensing convergence maps for DECaLS and DES galaxies. Finally, Section V summarizes the findings and discusses potential future research directions.
II Methodology
II.1 Photometric redshift estimation
Following Zhou et al. (2021), we use the Random Forest (RF) algorithm to estimate the photo-. We use the same training set as in Zhou et al. (2021), which consists of various redshift surveys overlapping with the DR9 south (DECaLS and DES) footprint, where they compile a redshift truth dataset using spectroscopic and many-band photometric redshifts from ten different surveys (see Zhou et al. (2021) for details). We randomly select 90% of the truth dataset for training and reserve the other 10% for testing purposes. We include the -band magnitude as well as , , , and colors as inputs. To estimate the photo- error for each object, we perturb the photometry by adding to the observed flux in each band a random value from a Gaussian distribution whose standard deviation is set by the photometric error. In Zhou et al. (2021), morphological information (i.e., half-light radius, axis ratio, and shape probability) is also included as input, which was found to reduce the photo- scatter by 10% to 20%. Our estimation of photo- is primarily utilized to investigate the photo- induced selection and understand how the RF predicted photo- of each galaxy is affected by weak lensing magnification. Specifically, we need to compare the photo- values of each galaxy with and without magnification. However, the impact of magnification on the morphological information is not available in the current dataset. As a result, these features are not included in our photo- estimation, which slightly reduces the accuracy of the photo- predictions.
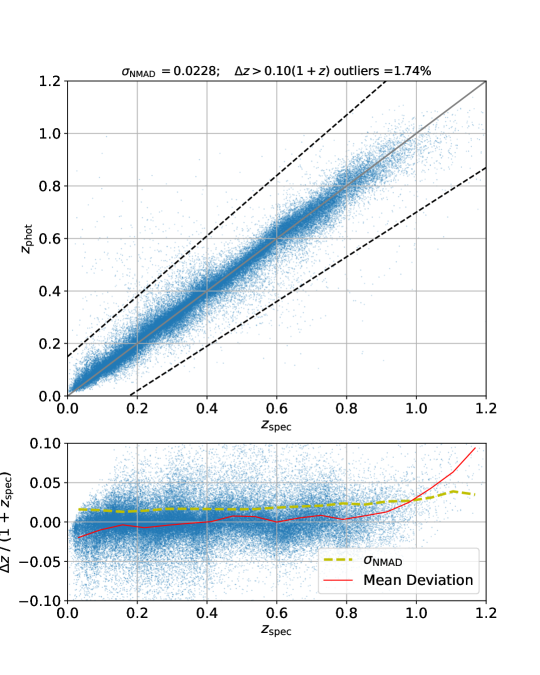
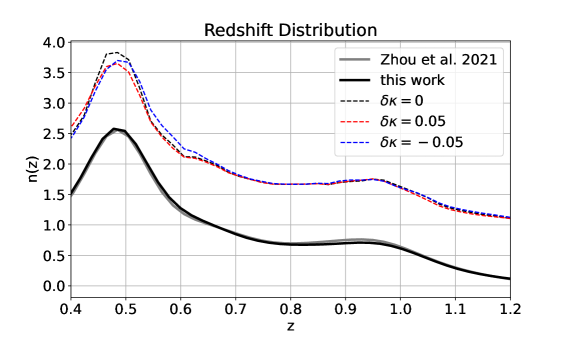
Fig. 1 shows the relationship between photo- and spec- for objects in the truth catalog in the DR9 South region. The photo- scatter, quantified as , is 0.023. The outlier rate, defined as the fraction of objects with , is 1.74%. These values are comparable to the photo- estimation results for galaxies of the DR8 South (DECaLS region) from Zhou et al. (2021), which are 0.013 and 1.5%, respectively. Fig. 2 compares the redshift distributions for or or galaxies (corresponding to the faintest magnitude cuts for our lensing reconstruction, see Table 1). For consistency, we use our photo- for the redshift distribution estimation throughout this work. We have also conducted tests and verified that using either redshift distribution yields negligible differences in the results.
| Photo- Bin | Magnitude Cut in | |
| DECaLS | (0.5, 0.8) | 22.5/22.0/21.5 |
| (0.8, 1.2) | 23.5/22.5/22.5 | |
| (0.4, 0.6) | 22.5/22.0/21.5 | |
| DES | (0.6, 0.8) | 23.0/22.5/22.0 |
| (0.8, 1.0) | 24.0/23.0/22.5 |
II.2 Photo- induced selection
First, we recall how the magnification coefficient estimation is related to the survey selection function. The overdensity due to convergence at position on the sky can be written in terms of the observed number of galaxies, , and the same quantity at (e.g., Joachimi and Bridle, 2010; Bernstein, 2009):
Here, the superscript ’sel’ indicates that a selection has been applied using thresholds on various observed properties of the galaxies, denote by . is the sample selection function, which operates on galaxy properties . Magnification alters galaxy properties , such as flux and size. Taylor expanding around and keeping the first-order terms yields (e.g., Elvin-Poole et al., 2023):
| (1) | ||||
Here, the ’-2’ term accounts for the change in the area element due to magnification, while the other term represents the response of the number of selected samples to a change in .
Real galaxy samples are selected based on a variety of properties, including flux, color, shape, position, and redshift. In this work, we focus on the selection based on photo-. The selection operation on photo-, , typically involves binning galaxies within a certain photo- range. This selection will not affect the estimation of if cosmic magnification does not influence the photo- estimation, i.e., in Eq. (1). However, photo- estimation is usually sensitive to galaxy flux, which is magnified by convergence , making .
To illustrate this, we rerun the photo- estimation for the DR9 South galaxies with a constant magnification applied to each input galaxy. The comparison of the photo- distributions between the lensed and unlensed cases for the same input galaxies is shown in Fig. 2. The differences in the distributions indicate the selection induced by photo-, which contributes to the magnification coefficient estimation.
II.3 Improved magnification coefficient estimation
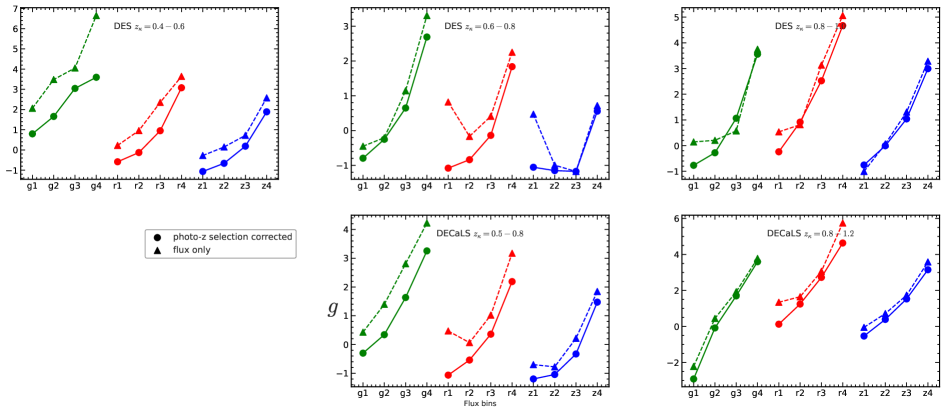
In our lensing reconstruction method (Qin et al., 2023, 2024), galaxies are divided into flux and photo- bins. The faintest magnitude cuts in the , , and bands, along with the photo- bins, are summarized in Table 1. For each photometric band, galaxies are equally divided into four flux bins. These binning induces two selections: .
In Fig. 3, we compare the magnification coefficient estimated considering against the estimation using the flux-only selection . The latter approach was employed in our previous work (Qin et al., 2023, 2024), but it is only unbiased under the flux-limited condition. The discrepancy between the two estimations of highlights the bias introduced by the flux-only estimation. This bias directly propagates to the amplitude of the reconstructed lensing convergence map.
III lensing reconstruction
We enhance the lensing reconstruction for the DECaLS and DES galaxies using the improved magnification coefficient estimation. The details of the lensing reconstruction, data processing, imaging systematics mitigation, and convergence-shear cross-correlation analysis are described in (Qin et al., 2023, 2024). Here, we summarize the key points.
The linear estimator for the convergence is expressed as (Hou et al., 2021):
| (2) |
The weights are determined by satisfying three conditions:
| (3) |
| (4) |
| (5) |
Here, is the observed galaxy overdensity map in the -th flux bin, and is the mean number density between flux bins and . The magnification coefficient now accounts for both flux and photo- induced selection.
To characterize potential biases in the reconstructed , we introduce parameters and :
| (6) |
Here, represents the residual intrinsic clustering of galaxies, while accounts for any potential multiplicative error in the overall amplitude of , which can arise from biases in .
We then cross-correlate the reconstructed with cosmic shears:
| (7) |
and compare the results with the theoretical models and derived from the Planck 2018 cosmology. This comparison allows us to constrain the parameters and .
IV Results
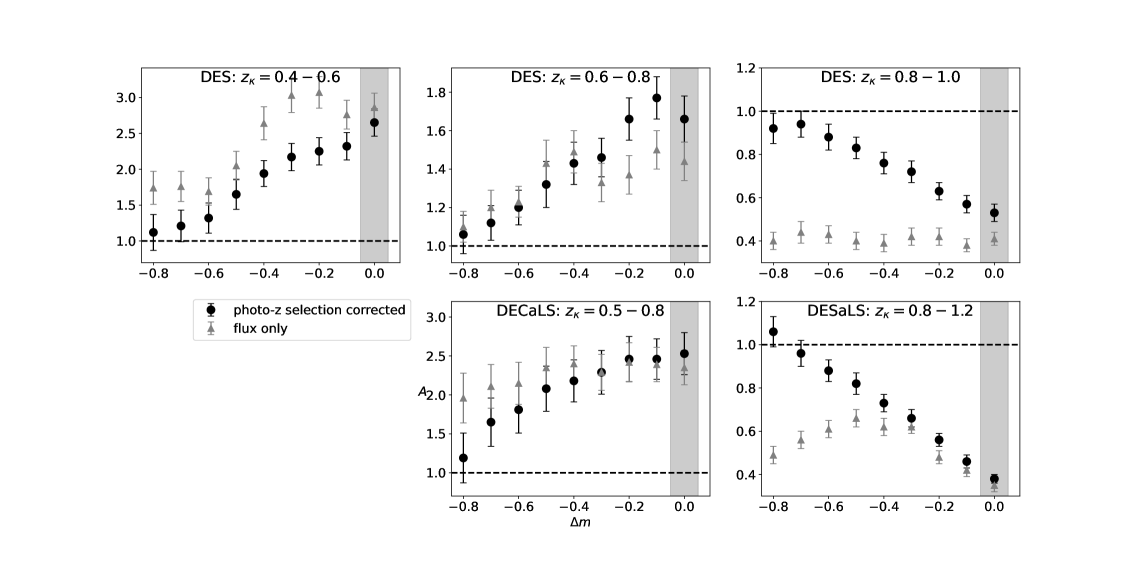
The constraints on for the DECaLS and DES maps, using the flux-only estimation of the magnification coefficient, exhibit significant biases ranging from to , depending on the redshift, as reported in (Qin et al., 2023, 2024). With the improved magnification coefficient estimation, the results, shown in Fig. 4, demonstrate a noticeable reduction in these biases. For reconstructions using the default magnitude cuts (determined by the peak of the luminosity function, as listed in Table 1), the biases are moderately reduced. The improvement is particularly pronounced for in DES. However, despite these improvement, significant biases persist across all cases.
To better approximate the true selection function, we explore brighter magnitude cuts by shifting the default values to , where ranges from to . Fig. 4 shows the constraints on for these shifted flux cuts. With the improved magnification coefficient estimation, the biases in are significantly reduced as the magnitude cut becomes brighter. Notably, converges to as the magnitude cut approaches the brightest end (), consistent across DES, DECaLS, and all redshift bins. In contrast, the flux-only estimation retains significant biases, even at .
Tables 2 and 3 present detailed constraints on and across various redshift bins and values, showcasing robust goodness-of-fit () and effective suppression of intrinsic clustering (). We conclude that the improved magnification coefficient estimation leads toward an unbiased weak lensing reconstruction by counting galaxies. The results also indicate that simply shifting the magnitude cuts to brighter values is unable to approximate the true flux-limited condition. Addressing the photo- induced selection is a critical step toward achieving an unbiased estimation.
For fainter magnitude cuts (), residual biases persist even with the improved magnification coefficient estimation. This suggests that photo- induced selection is not the only source of bias in these cases. Other factors, such as galaxy size, shape, imaging quality, and instrument or redshift failures, may contribute to additional selection effects. Addressing these issues requires a comprehensive analysis of all potential selection functions, encompassing the entire pipeline from initial imaging to the final galaxy catalog construction. We leave this detailed investigation for future work.
| 1.120.25(1.740.23) | 0.010.02(-0.030.02) | 1.0(1.2) | 8.6(10.9) | 4.5(7.6) | ||
| -0.7 | 1.210.22(1.760.21) | -0.010.01(-0.050.01) | 0.9(1.0) | 9.2(11.1) | 5.5(8.4) | |
| -0.6 | 1.320.21(1.690.19) | -0.010.01(-0.050.01) | 0.8(0.9) | 9.4(11.3) | 6.3(8.9) | |
| -0.5 | 1.650.21(2.050.20) | -0.040.01(-0.070.01) | 0.9(1.0) | 10.1(12.0) | 7.9(10.2) | |
| -0.4 | 1.940.18(2.640.23) | -0.050.01(-0.090.01) | 1.1(1.3) | 13.1(13.3) | 10.8(11.5) | 0.4-0.6 |
| -0.3 | 2.170.19(3.030.24) | -0.070.01(-0.110.02) | 1.1(1.3) | 13.6(14.3) | 11.4(12.6) | |
| -0.2 | 2.250.19(3.070.22) | -0.080.01(-0.120.01) | 1.4(1.7) | 13.4(15.3) | 11.8(13.9) | |
| -0.1 | 2.320.19(2.760.20) | -0.080.01(-0.110.01) | 1.3(1.8) | 14.3(15.7) | 12.2(13.8) | |
| 0.0 | 2.650.19(2.860.20) | -0.100.01(-0.120.01) | 1.5(1.8) | 15.5(15.3) | 13.9(14.3) | |
| 1.060.10(1.100.08) | 0.020.02(-0.000.01) | 1.0(0.9) | 17.9(20.1) | 10.6(13.8) | ||
| -0.7 | 1.120.09(1.200.09) | 0.010.02(-0.020.01) | 1.1(0.8) | 19.0(20.0) | 12.4(13.3) | |
| -0.6 | 1.200.09(1.230.08) | -0.010.01(-0.030.01) | 1.0(0.9) | 20.0(20.6) | 13.3(15.4) | |
| -0.5 | 1.320.12(1.430.12) | -0.010.02(-0.040.02) | 1.0(0.8) | 16.4(16.7) | 11.0(11.9) | |
| -0.4 | 1.430.11(1.490.11) | -0.020.02(-0.050.02) | 0.8(0.7) | 18.8(17.8) | 13.0(13.6) | 0.6-0.8 |
| -0.3 | 1.460.10(1.330.10) | -0.030.02(-0.050.01) | 0.7(0.5) | 18.7(17.4) | 14.6(13.3) | |
| -0.2 | 1.660.11(1.370.10) | -0.060.02(-0.050.01) | 1.0(0.6) | 18.9(18.4) | 15.1(13.7) | |
| -0.1 | 1.770.11(1.500.10) | -0.070.02(-0.060.02) | 1.1(0.8) | 19.2(18.9) | 16.1(15.0) | |
| 0.0 | 1.660.12(1.440.10) | -0.060.02(-0.050.02) | 0.9(0.8) | 18.3(18.3) | 13.8(14.4) | |
| 0.920.07(0.400.04) | -0.040.05(0.020.04) | 1.2(1.2) | 16.2(11.6) | 13.1(10.0) | ||
| -0.7 | 0.940.06(0.440.05) | -0.040.05(0.010.04) | 1.1(1.2) | 18.5(12.0) | 15.7(8.8) | |
| -0.6 | 0.880.06(0.430.04) | -0.040.04(0.020.04) | 0.9(1.1) | 19.2(12.4) | 14.7(10.8) | |
| -0.5 | 0.830.05(0.400.04) | -0.020.04(0.030.03) | 0.8(1.2) | 19.6(12.6) | 16.6(10.0) | |
| -0.4 | 0.760.05(0.390.04) | -0.010.04(0.040.03) | 0.7(1.4) | 19.7(12.9) | 15.2(9.8) | 0.8-1.0 |
| -0.3 | 0.720.05(0.420.04) | -0.020.04(0.030.03) | 1.0(1.5) | 19.2(14.6) | 14.4(10.5) | |
| -0.2 | 0.630.04(0.420.04) | -0.010.04(0.010.03) | 0.9(1.5) | 18.4(14.6) | 15.8(10.5) | |
| -0.1 | 0.570.04(0.380.03) | 0.010.03(0.020.03) | 0.9(1.2) | 18.7(15.5) | 14.2(12.7) | |
| 0.0 | 0.530.04(0.410.03) | -0.010.03(0.020.02) | 0.9(1.4) | 18.0(18.0) | 13.2(13.7) |
| 1.190.32(1.960.32) | 0.110.03(0.090.03) | 0.8(0.8) | 12.2(15.2) | 3.7(6.1) | ||
| -0.7 | 1.650.31(2.110.28) | 0.110.03(0.060.03) | 1.1(0.9) | 15.7(17.0) | 5.3(7.5) | |
| -0.6 | 1.810.30(2.150.27) | 0.100.03(0.050.02) | 1.0(0.9) | 17.9(18.7) | 6.0(8.0) | |
| -0.5 | 2.080.29(2.350.26) | 0.070.03(0.040.02) | 0.8(0.9) | 17.9(19.6) | 7.2(9.0) | |
| -0.4 | 2.180.27(2.400.23) | 0.060.03(0.030.02) | 0.9(1.0) | 18.1(20.5) | 8.1(10.4) | 0.5-0.8 |
| -0.3 | 2.290.28(2.290.23) | 0.050.03(0.030.02) | 0.8(1.1) | 18.0(20.3) | 8.2(10.0) | |
| -0.2 | 2.460.29(2.420.25) | 0.030.03(0.010.02) | 0.7(1.2) | 16.9(18.7) | 8.5(9.7) | |
| -0.1 | 2.460.26(2.390.22) | 0.030.03(0.010.02) | 0.7(1.4) | 18.8(21.4) | 9.5(10.9) | |
| 0.0 | 2.530.27(2.350.22) | 0.020.03(0.010.02) | 0.7(1.4) | 19.0(21.4) | 9.4(10.7) | |
| 1.060.07(0.490.04) | -0.120.07(0.000.04) | 1.3(1.2) | 18.8(15.8) | 15.1(12.2) | ||
| -0.7 | 0.960.06(0.560.04) | -0.040.07(-0.010.04) | 1.0(1.1) | 19.7(18.1) | 16.0(14.0) | |
| -0.6 | 0.880.05(0.610.04) | -0.070.05(-0.000.04) | 1.3(1.3) | 20.8(20.6) | 17.6(15.2) | |
| -0.5 | 0.820.05(0.660.04) | -0.020.05(0.010.04) | 1.3(1.2) | 21.0(21.7) | 16.4(16.5) | |
| -0.4 | 0.730.04(0.620.04) | -0.010.05(0.020.04) | 1.2(1.4) | 22.0(21.9) | 18.2(15.5) | 0.8-1.2 |
| -0.3 | 0.660.04(0.620.03) | -0.040.04(-0.030.04) | 1.2(1.3) | 21.9(22.7) | 16.5(20.7) | |
| -0.2 | 0.560.03(0.480.03) | -0.060.04(0.020.03) | 1.3(1.4) | 20.3(20.1) | 18.7(16.0) | |
| -0.1 | 0.460.03(0.420.03) | -0.040.03(-0.010.03) | 1.7(1.9) | 19.0(17.5) | 15.3(14.0) | |
| 0.0 | 0.380.02(0.350.03) | -0.040.03(0.010.04) | 3.2(3.4) | 18.4(15.8) | 19.0(11.7) |
V Summary
This study investigates the impact of photo- induced selection on the estimation of the magnification coefficient using a Random Forest-based algorithm. Since photo- estimation is sensitive to galaxy flux, which is influenced by cosmic magnification, it introduces an additional selection effect beyond the flux-limited condition. Neglecting this effect leads to biases in the magnification coefficient estimation and the reconstructed lensing convergence maps.
By incorporating the photo- induced selection, we improved the magnification coefficient estimation, which significantly reduced the multiplicative biases in the reconstructed convergence maps for both DECaLS and DES. The improvement is particularly significant with brighter magnitude cuts, achieving nearly unbiased results when the cuts are shifted 0.8 magnitudes brighter than the luminosity function peak.
This work primarily addresses photo- induced selection. Future research should aim to account for the complete selection function, which can be derived from the entire pipeline of galaxy catalog construction. As a next step, we plan to investigate this using image simulations, such as the Balrog (e.g., Everett et al., 2022) simulations developed for DES, as well as simulations currently under preparation for CSST.
Our method is not limited to the Random Forest-derived photo-; instead, it represents a general approach applicable to any photo- algorithm. Incorporating more comprehensive photo- estimations, such as those including additional features like size and morphology, will achieve better photo- accuracy and lower outlier rate. These features introduce additional selection effects that must be accounted for in the estimation of magnification coefficient.
Acknowledgements
This work is supported the National Key R&D Program of China (2023YFA1607800, 2023YFA1607801, 2023YFA1607802, 2020YFC2201602), the China Manned Space Project (#CMS-CSST-2021-A02), and the Fundamental Research Funds for the Central Universities.
References
- Qin et al. (2023) J. Qin, P. Zhang, H. Xu, Y. Yu, J. Yao, R. Ma, and H. Shan, arXiv e-prints arXiv:2310.15053 (2023), eprint 2310.15053.
- Qin et al. (2024) J. Qin, P. Zhang, Y. Yu, H. Xu, J. Yao, Y. Shi, and H. Shan, arXiv e-prints arXiv:2412.00829 (2024), eprint 2412.00829.
- Bartelmann and Schneider (2001) M. Bartelmann and P. Schneider, Phys. Rep. 340, 291 (2001), eprint astro-ph/9912508.
- Kilbinger (2015) M. Kilbinger, Reports on Progress in Physics 78, 086901 (2015), eprint 1411.0115.
- Hamana et al. (2020) T. Hamana, M. Shirasaki, S. Miyazaki, C. Hikage, M. Oguri, S. More, R. Armstrong, A. Leauthaud, R. Mandelbaum, H. Miyatake, et al., PASJ 72, 16 (2020), eprint 1906.06041.
- Asgari et al. (2021) M. Asgari, C.-A. Lin, B. Joachimi, B. Giblin, C. Heymans, H. Hildebrandt, A. Kannawadi, B. Stölzner, T. Tröster, J. L. van den Busch, et al., A&A 645, A104 (2021), eprint 2007.15633.
- Giblin et al. (2021) B. Giblin, C. Heymans, M. Asgari, H. Hildebrandt, H. Hoekstra, B. Joachimi, A. Kannawadi, K. Kuijken, C.-A. Lin, L. Miller, et al., A&A 645, A105 (2021), eprint 2007.01845.
- Loureiro et al. (2022) A. Loureiro, L. Whittaker, A. Spurio Mancini, B. Joachimi, A. Cuceu, M. Asgari, B. Stölzner, T. Tröster, A. H. Wright, M. Bilicki, et al., A&A 665, A56 (2022), eprint 2110.06947.
- Amon et al. (2022) A. Amon, D. Gruen, M. A. Troxel, N. MacCrann, S. Dodelson, A. Choi, C. Doux, L. F. Secco, S. Samuroff, E. Krause, et al. (DES Collaboration), Phys. Rev. D 105, 023514 (2022), URL https://link.aps.org/doi/10.1103/PhysRevD.105.023514.
- Secco et al. (2022) L. F. Secco, S. Samuroff, E. Krause, B. Jain, J. Blazek, M. Raveri, A. Campos, A. Amon, A. Chen, C. Doux, et al. (DES Collaboration), Phys. Rev. D 105, 023515 (2022), URL https://link.aps.org/doi/10.1103/PhysRevD.105.023515.
- Li et al. (2023) X. Li, T. Zhang, S. Sugiyama, R. Dalal, M. M. Rau, R. Mandelbaum, M. Takada, S. More, M. A. Strauss, H. Miyatake, et al., arXiv e-prints arXiv:2304.00702 (2023), eprint 2304.00702.
- Dark Energy Survey Collaboration et al. (2016) Dark Energy Survey Collaboration, T. Abbott, F. B. Abdalla, J. Aleksić, S. Allam, A. Amara, D. Bacon, E. Balbinot, M. Banerji, K. Bechtol, et al., MNRAS 460, 1270 (2016), eprint 1601.00329.
- de Jong et al. (2013) J. T. A. de Jong, G. A. Verdoes Kleijn, K. H. Kuijken, and E. A. Valentijn, Experimental Astronomy 35, 25 (2013), eprint 1206.1254.
- Aihara et al. (2018) H. Aihara, N. Arimoto, R. Armstrong, S. Arnouts, N. A. Bahcall, S. Bickerton, J. Bosch, K. Bundy, P. L. Capak, J. H. H. Chan, et al., PASJ 70, S4 (2018), eprint 1704.05858.
- LSST Science Collaboration et al. (2009) LSST Science Collaboration, P. A. Abell, J. Allison, S. F. Anderson, J. R. Andrew, J. R. P. Angel, L. Armus, D. Arnett, S. J. Asztalos, T. S. Axelrod, et al., arXiv e-prints arXiv:0912.0201 (2009), eprint 0912.0201.
- Laureijs et al. (2011) R. Laureijs, J. Amiaux, S. Arduini, J. L. Auguères, J. Brinchmann, R. Cole, M. Cropper, C. Dabin, L. Duvet, A. Ealet, et al., arXiv e-prints arXiv:1110.3193 (2011), eprint 1110.3193.
- Gong et al. (2019) Y. Gong, X. Liu, Y. Cao, X. Chen, Z. Fan, R. Li, X.-D. Li, Z. Li, X. Zhang, and H. Zhan, ApJ 883, 203 (2019), eprint 1901.04634.
- Yao et al. (2024) J. Yao, H. Shan, R. Li, Y. Xu, D. Fan, D. Liu, P. Zhang, Y. Yu, C. Wei, B. Hu, et al., MNRAS 527, 5206 (2024), eprint 2304.04489.
- Bauer et al. (2014) A. H. Bauer, E. Gaztañaga, P. Martí, and R. Miquel, Monthly Notices of the Royal Astronomical Society 440, 3701 (2014), https://academic.oup.com/mnras/article-pdf/440/4/3701/3913172/stu530.pdf, URL https://app.dimensions.ai/details/publication/pub.1059915677.
- Bellagamba et al. (2019) F. Bellagamba, M. Sereno, M. Roncarelli, M. Maturi, M. Radovich, S. Bardelli, E. Puddu, L. Moscardini, F. Getman, H. Hildebrandt, et al., MNRAS 484, 1598 (2019), eprint 1810.02827.
- Chiu et al. (2016) I. Chiu, J. P. Dietrich, J. Mohr, D. E. Applegate, B. A. Benson, L. E. Bleem, M. B. Bayliss, S. Bocquet, J. E. Carlstrom, R. Capasso, et al., MNRAS 457, 3050 (2016), eprint 1510.01745.
- Chiu et al. (2020) I. N. Chiu, K. Umetsu, R. Murata, E. Medezinski, and M. Oguri, MNRAS 495, 428 (2020), eprint 1909.02042.
- Scranton et al. (2005) R. Scranton, B. Ménard, G. T. Richards, R. C. Nichol, A. D. Myers, B. Jain, A. Gray, M. Bartelmann, R. J. Brunner, A. J. Connolly, et al., ApJ 633, 589 (2005), eprint astro-ph/0504510.
- Bauer et al. (2012) A. H. Bauer, C. Baltay, N. Ellman, J. Jerke, D. Rabinowitz, and R. Scalzo, ApJ 749, 56 (2012), eprint 1202.1371.
- Morrison et al. (2012) C. B. Morrison, R. Scranton, B. Ménard, S. J. Schmidt, J. A. Tyson, R. Ryan, A. Choi, and D. M. Wittman, MNRAS 426, 2489 (2012), eprint 1204.2830.
- Tudorica et al. (2017) A. Tudorica, H. Hildebrandt, M. Tewes, H. Hoekstra, C. B. Morrison, A. Muzzin, G. Wilson, H. K. C. Yee, C. Lidman, A. Hicks, et al., A&A 608, A141 (2017), eprint 1710.06431.
- Bonavera et al. (2021) L. Bonavera, M. M. Cueli, J. González-Nuevo, T. Ronconi, M. Migliaccio, A. Lapi, J. M. Casas, and D. Crespo, A&A 656, A99 (2021), eprint 2109.12413.
- Crespo et al. (2022) D. Crespo, J. González-Nuevo, L. Bonavera, M. M. Cueli, J. M. Casas, and E. Goitia, A&A 667, A146 (2022), eprint 2210.17318.
- Zhang and Pen (2005) P. Zhang and U.-L. Pen, Phys. Rev. Lett. 95, 241302 (2005), eprint astro-ph/0506740.
- Yang and Zhang (2011) X. Yang and P. Zhang, MNRAS 415, 3485 (2011), eprint 1105.2385.
- Zhang et al. (2019) P. Zhang, J. Zhang, and L. Zhang, MNRAS 484, 1616 (2019).
- Yang et al. (2015) X. Yang, P. Zhang, J. Zhang, and Y. Yu, MNRAS 447, 345 (2015).
- Yang et al. (2017) X. Yang, J. Zhang, Y. Yu, and P. Zhang, ApJ 845, 174 (2017), eprint 1703.01575.
- Zhang et al. (2018) P. Zhang, X. Yang, J. Zhang, and Y. Yu, ApJ 864, 10 (2018), eprint 1807.00443.
- Hou et al. (2021) S.-T. Hou, Y. Yu, and P.-J. Zhang, Research in Astronomy and Astrophysics 21, 247 (2021), eprint 2106.09970.
- Ma et al. (2024) R. Ma, P. Zhang, Y. Yu, and J. Qin, MNRAS 527, 7547 (2024), eprint 2306.15177.
- Bonoli and Pen (2009) S. Bonoli and U. L. Pen, MNRAS 396, 1610 (2009), eprint 0810.0273.
- Hamaus et al. (2010) N. Hamaus, U. Seljak, V. Desjacques, R. E. Smith, and T. Baldauf, Phys. Rev. D 82, 043515 (2010), eprint 1004.5377.
- Baldauf et al. (2010) T. Baldauf, R. E. Smith, U. Seljak, and R. Mandelbaum, Phys. Rev. D 81, 063531 (2010), eprint 0911.4973.
- von Wietersheim Kramsta et al. (2021) M. von Wietersheim Kramsta, B. Joachimi, J. L. van den Busch, C. Heymans, H. Hildebrandt, M. Asgari, T. Tr’oster, S. Unruh, and A. H. Wright, Monthly Notices of the Royal Astronomical Society 504, 1452–1465 (2021), URL http://dx.doi.org/10.1093/mnras/stab1000.
- Elvin-Poole et al. (2023) J. Elvin-Poole, N. MacCrann, S. Everett, J. Prat, E. S. Rykoff, J. De Vicente, B. Yanny, K. Herner, A. Ferté, E. D. Valentino, et al., Monthly Notices of the Royal Astronomical Society 523, 3649 (2023), ISSN 0035-8711, eprint https://academic.oup.com/mnras/article-pdf/523/3/3649/50596748/stad1594.pdf, URL https://doi.org/10.1093/mnras/stad1594.
- Wenzl et al. (2024) L. Wenzl, S.-F. Chen, and R. Bean, MNRAS 527, 1760 (2024), eprint 2308.05892.
- Zhou et al. (2021) R. Zhou, J. A. Newman, Y.-Y. Mao, A. Meisner, J. Moustakas, A. D. Myers, A. Prakash, A. R. Zentner, D. Brooks, Y. Duan, et al., Monthly Notices of the Royal Astronomical Society 501, 3309 (2021).
- Joachimi and Bridle (2010) B. Joachimi and S. L. Bridle, A&A 523, A1 (2010), eprint 0911.2454.
- Bernstein (2009) G. M. Bernstein, ApJ 695, 652 (2009), eprint 0808.3400.
- Elvin-Poole et al. (2023) J. Elvin-Poole, N. MacCrann, S. Everett, J. Prat, E. S. Rykoff, J. De Vicente, B. Yanny, K. Herner, A. Ferté, E. Di Valentino, et al., MNRAS 523, 3649 (2023), eprint 2209.09782.
- Everett et al. (2022) S. Everett, B. Yanny, N. Kuropatkin, E. M. Huff, Y. Zhang, J. Myles, A. Masegian, J. Elvin-Poole, S. Allam, G. M. Bernstein, et al., ApJS 258, 15 (2022), eprint 2012.12825.