Observing dynamics of distinct structural transitions in trapped-ion clusters
Abstract
Interacting many-particle systems can self-organize into a rich variety of crystalline structures. While symmetry provides a powerful framework for predicting whether structural transitions between crystal states are continuous or discontinuous, collective lattice dynamics offer complementary insights into the microscopic mechanisms that drive these transitions. Trapped laser-cooled ions present a pristine and highly controllable few-body system for studying this interplay of symmetry and dynamics. Here, we use real-time fluorescence imaging while deforming the trap potential to observe a variety of structural transitions in three-dimensional unit-cell-sized ion clusters. We probe their distinct dynamical signatures: mode softening indicating a structural instability at a symmetry-breaking continuous transition, stochastic switching between stable structures at a discontinuous transition, and hysteresis near a spinodal point. We also observe a remarkable triple point-like feature where a discontinuous symmetry-changing transition and a continuous symmetry-breaking transition occur simultaneously. Analytical calculations based on symmetry considerations and numerical analysis of collective modes provide a comprehensive understanding of the observed dynamics. Our results demonstrate that tunable Coulomb clusters serve as a versatile platform to elucidate the interplay between symmetry, energy landscapes, and dynamical pathways in structural transitions.
I Introduction
Phase transitions are ubiquitous in nature, occurring at energy scales ranging from those relevant to solids [1] and biological systems [2] to the extreme conditions found in particle colliders and the early universe [3]. Our understanding of equilibrium phase transitions rests on the foundational framework of Landau theory [4], where symmetry plays a key role in sculpting the free-energy landscape, which dictates the nature of the transition. On the other hand, the real-time transformation from one state to another is governed by dynamical pathways through this complex landscape, which can be strikingly different for continuous and first-order transitions. Experimental advances in ultrafast diffraction and engineered light-matter interactions have begun to provide unprecedented insights into transition pathways in dynamics of chemical reactions [5], atomically resolved crystal dynamics in solid-state materials [6, 7, 8], and self-organization in atom-cavity systems [9]. Understanding these mechanisms in relation to the underlying symmetry transformations is important to dynamically control and switch properties of quantum materials [7, 8].
The rich interplay of symmetry and dynamics is exemplified by two different kinds of structural transitions between crystalline states of a solid. Small atomic displacements can trigger a continuous transition to a lower-symmetry configuration, called displacive transitions [10]. These are dynamically signaled by the softening of an optical phonon mode, as first observed for the - transition in quartz [11] and later in ferroelectrics [12, 13]. In contrast, crystals can also undergo a discontinuous transition to a state with a different point-group symmetry, accompanied by complex atomic rearrangements [14]. The dynamics near such reconstructive transitions are characterized by metastability and hysteresis [15, 16] due to large barriers [17] in the free-energy landscape. A single tunable system that can realize a variety of crystalline states with diverse symmetries would provide a valuable, unified platform to study and compare the dynamics of different types of structural transitions.
Trapped-ion Coulomb crystals offer such a versatile and tunable platform [18, 19, 20, 21] for experimental investigations of structural phase transitions from few-body clusters [22, 23, 24, 25] to mesoscopic ensembles [26, 27, 28, 29]. The ions can self-organize into a multitude of crystalline orders depending on the competition between the external confinement and Coulomb repulsion. Fluorescence from Doppler-cooling lasers enables spatially resolved imaging of individual ions and permits the tracking of the real-time crystal configuration. Moreover, the ability to excite and probe collective vibrational modes [30, 31] enables the investigation of crystal dynamics near structural transitions, which was used to study displacive transitions in ion chains [31, 32, 33].
Here, we employ these unique capabilities of trapped ions to experimentally probe distinct dynamical signatures associated with different classes of structural transitions within three-dimensional (3D) unit-cell-sized clusters. We directly observe mode softening at a continuous transition, stochastic switching at a purely discontinuous transition, and hysteresis associated with a spinodal point where a metastable minimum disappears. In addition, we show that a -ion cluster can be tuned to a triple point, where a displacive transition and a reconstructive transition occur simultaneously. Combining our experimental observations with analytical calculations and numerical analysis of collective modes, we demonstrate that these small, highly controllable ion clusters reveal the fundamental interplay of symmetry and dynamics in structural transitions.
II Structural transitions
We trap clusters of laser-cooled ions [34] in an end-cap type radio-frequency (rf) trap [35] (see supplementary discussion I for details). The trap provides an effective harmonic confinement in 3D with cylindrical symmetry. In small clusters, the competition between Coulomb potential energy and the harmonic confinement determines the equilibrium Configuration(s) of Minimum Energy (CME(s)) [36], which minimize
| (1) |
where , , are the co-ordinates of the ions with mass m, is the Coulomb constant, e is the elementary charge, and are the secular frequencies along azimuthal and axial directions, respectively, and is the aspect ratio of the 3D potential. In the experiment, we tune by changing a DC voltage, and capture the transition sequences of -, -, and -ion clusters via fluorescence imaging, as shown in Fig. 1. For , the ions assume two-dimensional (2D) configurations in the x-y plane. By decreasing , transitions to various 3D structures are observed, and the clusters eventually form a linear chain along z-axis for . For , the trapping potential becomes isotropic, and we image 2D projections of spherical clusters undergoing free rotation due to photon kicks from the Doppler cooling laser.
To understand the collective behavior of the ions close to the transition points, the normal-mode frequencies of the CMEs are numerically computed at the theoretical limit of zero temperature (). The CME at a given is obtained by randomizing the ions’ positions and steering them to a local minimum in the total potential energy (eq. 1). This is repeated several times to identify the global minimum. The collective-mode eigenvectors () and their corresponding frequencies () are obtained from the Hessian matrix
| (2) |
where are the components of the vector and is the CME coordinate.
The -, -, and -ion CMEs and their corresponding mode spectra obtained numerically are shown in the supplementary material (Figures SF4, SF5, and SF6). We capture all the predicted structures in the experiment (Fig. 1). Most transitions show a displacive nature, where a collective mode softens (i.e., ) on both sides of the transition boundary. However, a few transitions show discontinuous mode spectra, indicating the metastability of the associated CMEs around such transition points. We observe experimental signatures corresponding to all the distinct types of transitions identified: 1) symmetry-breaking transition with mode instability on both sides, 2) discontinuous transition where both CMEs are stable around the transition point, and 3) coincidence of a symmetry-breaking transition with a discontinuous transition to a CME of different symmetry.
III Dynamical signatures
III.1 Mode softening
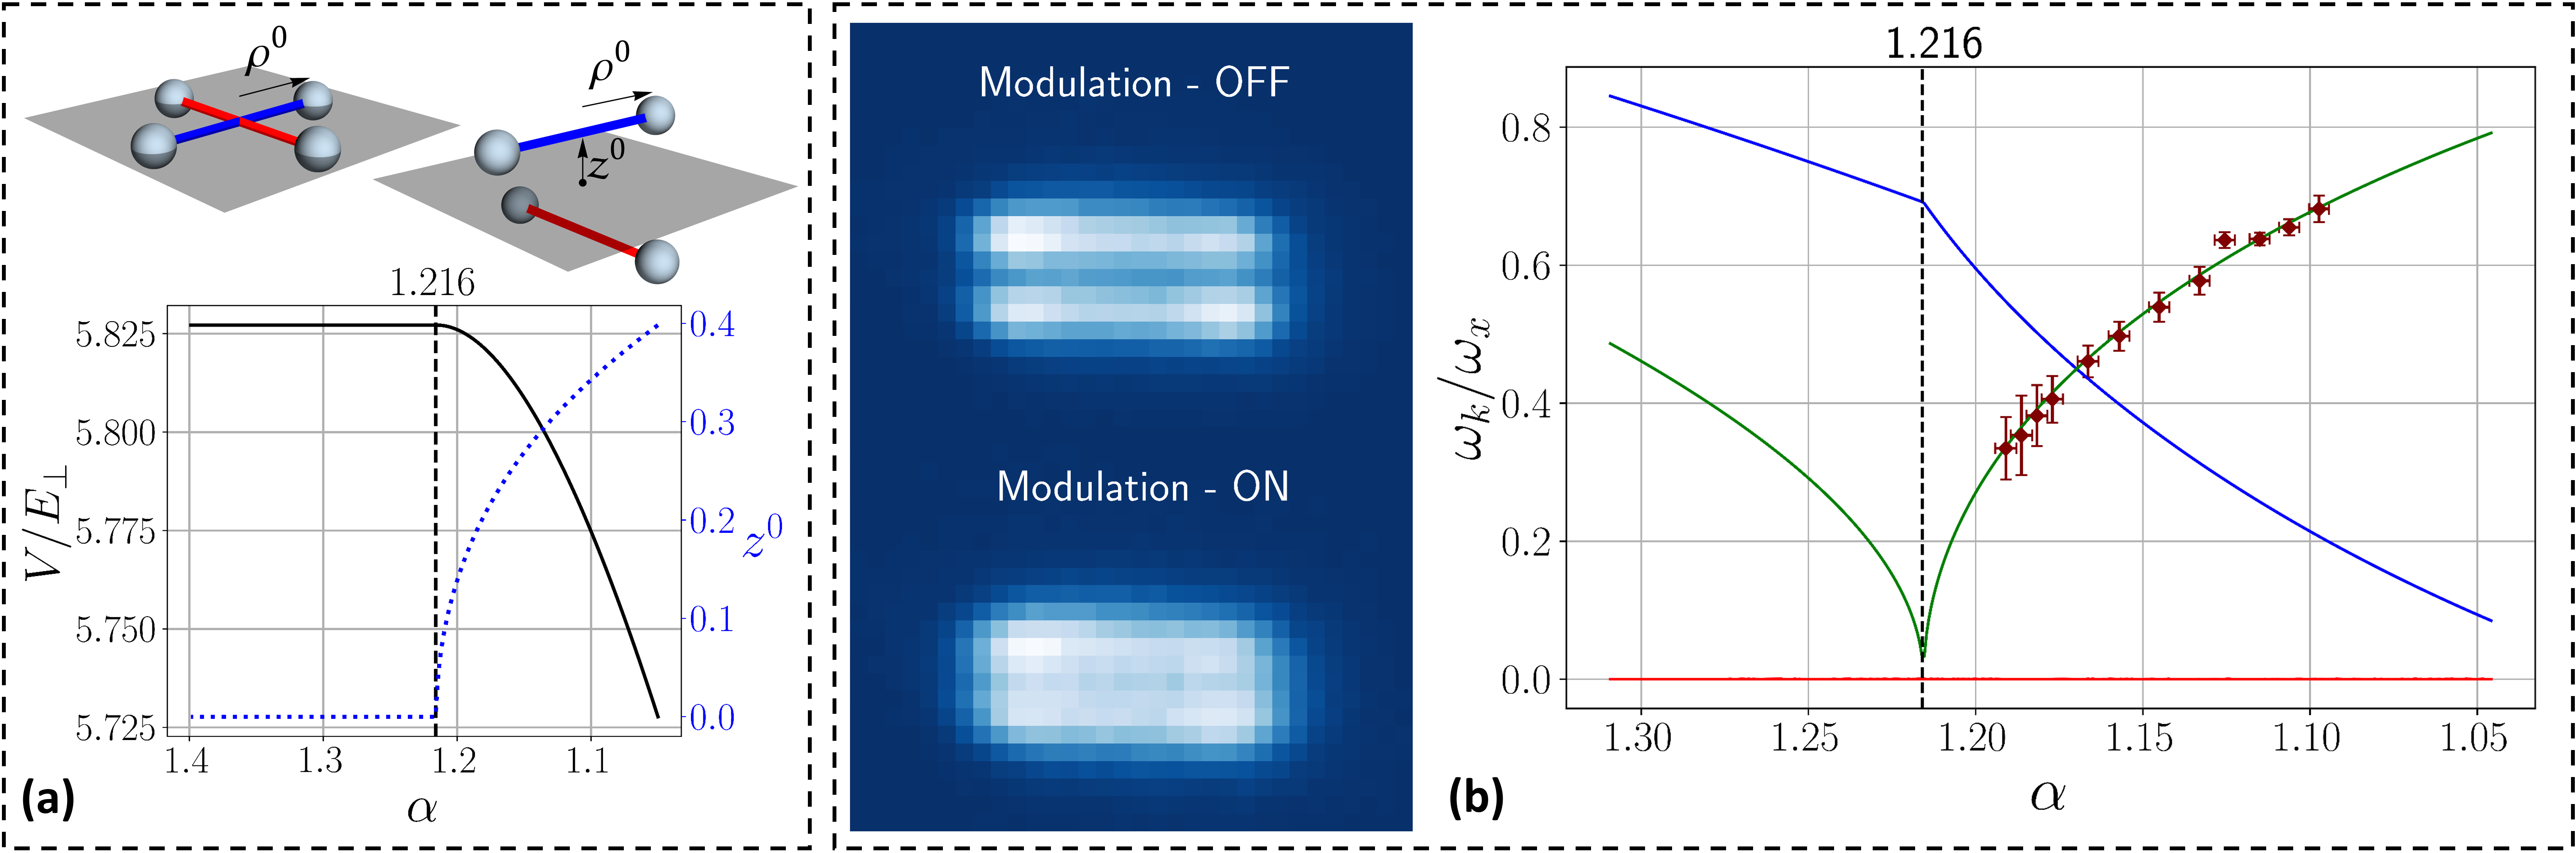
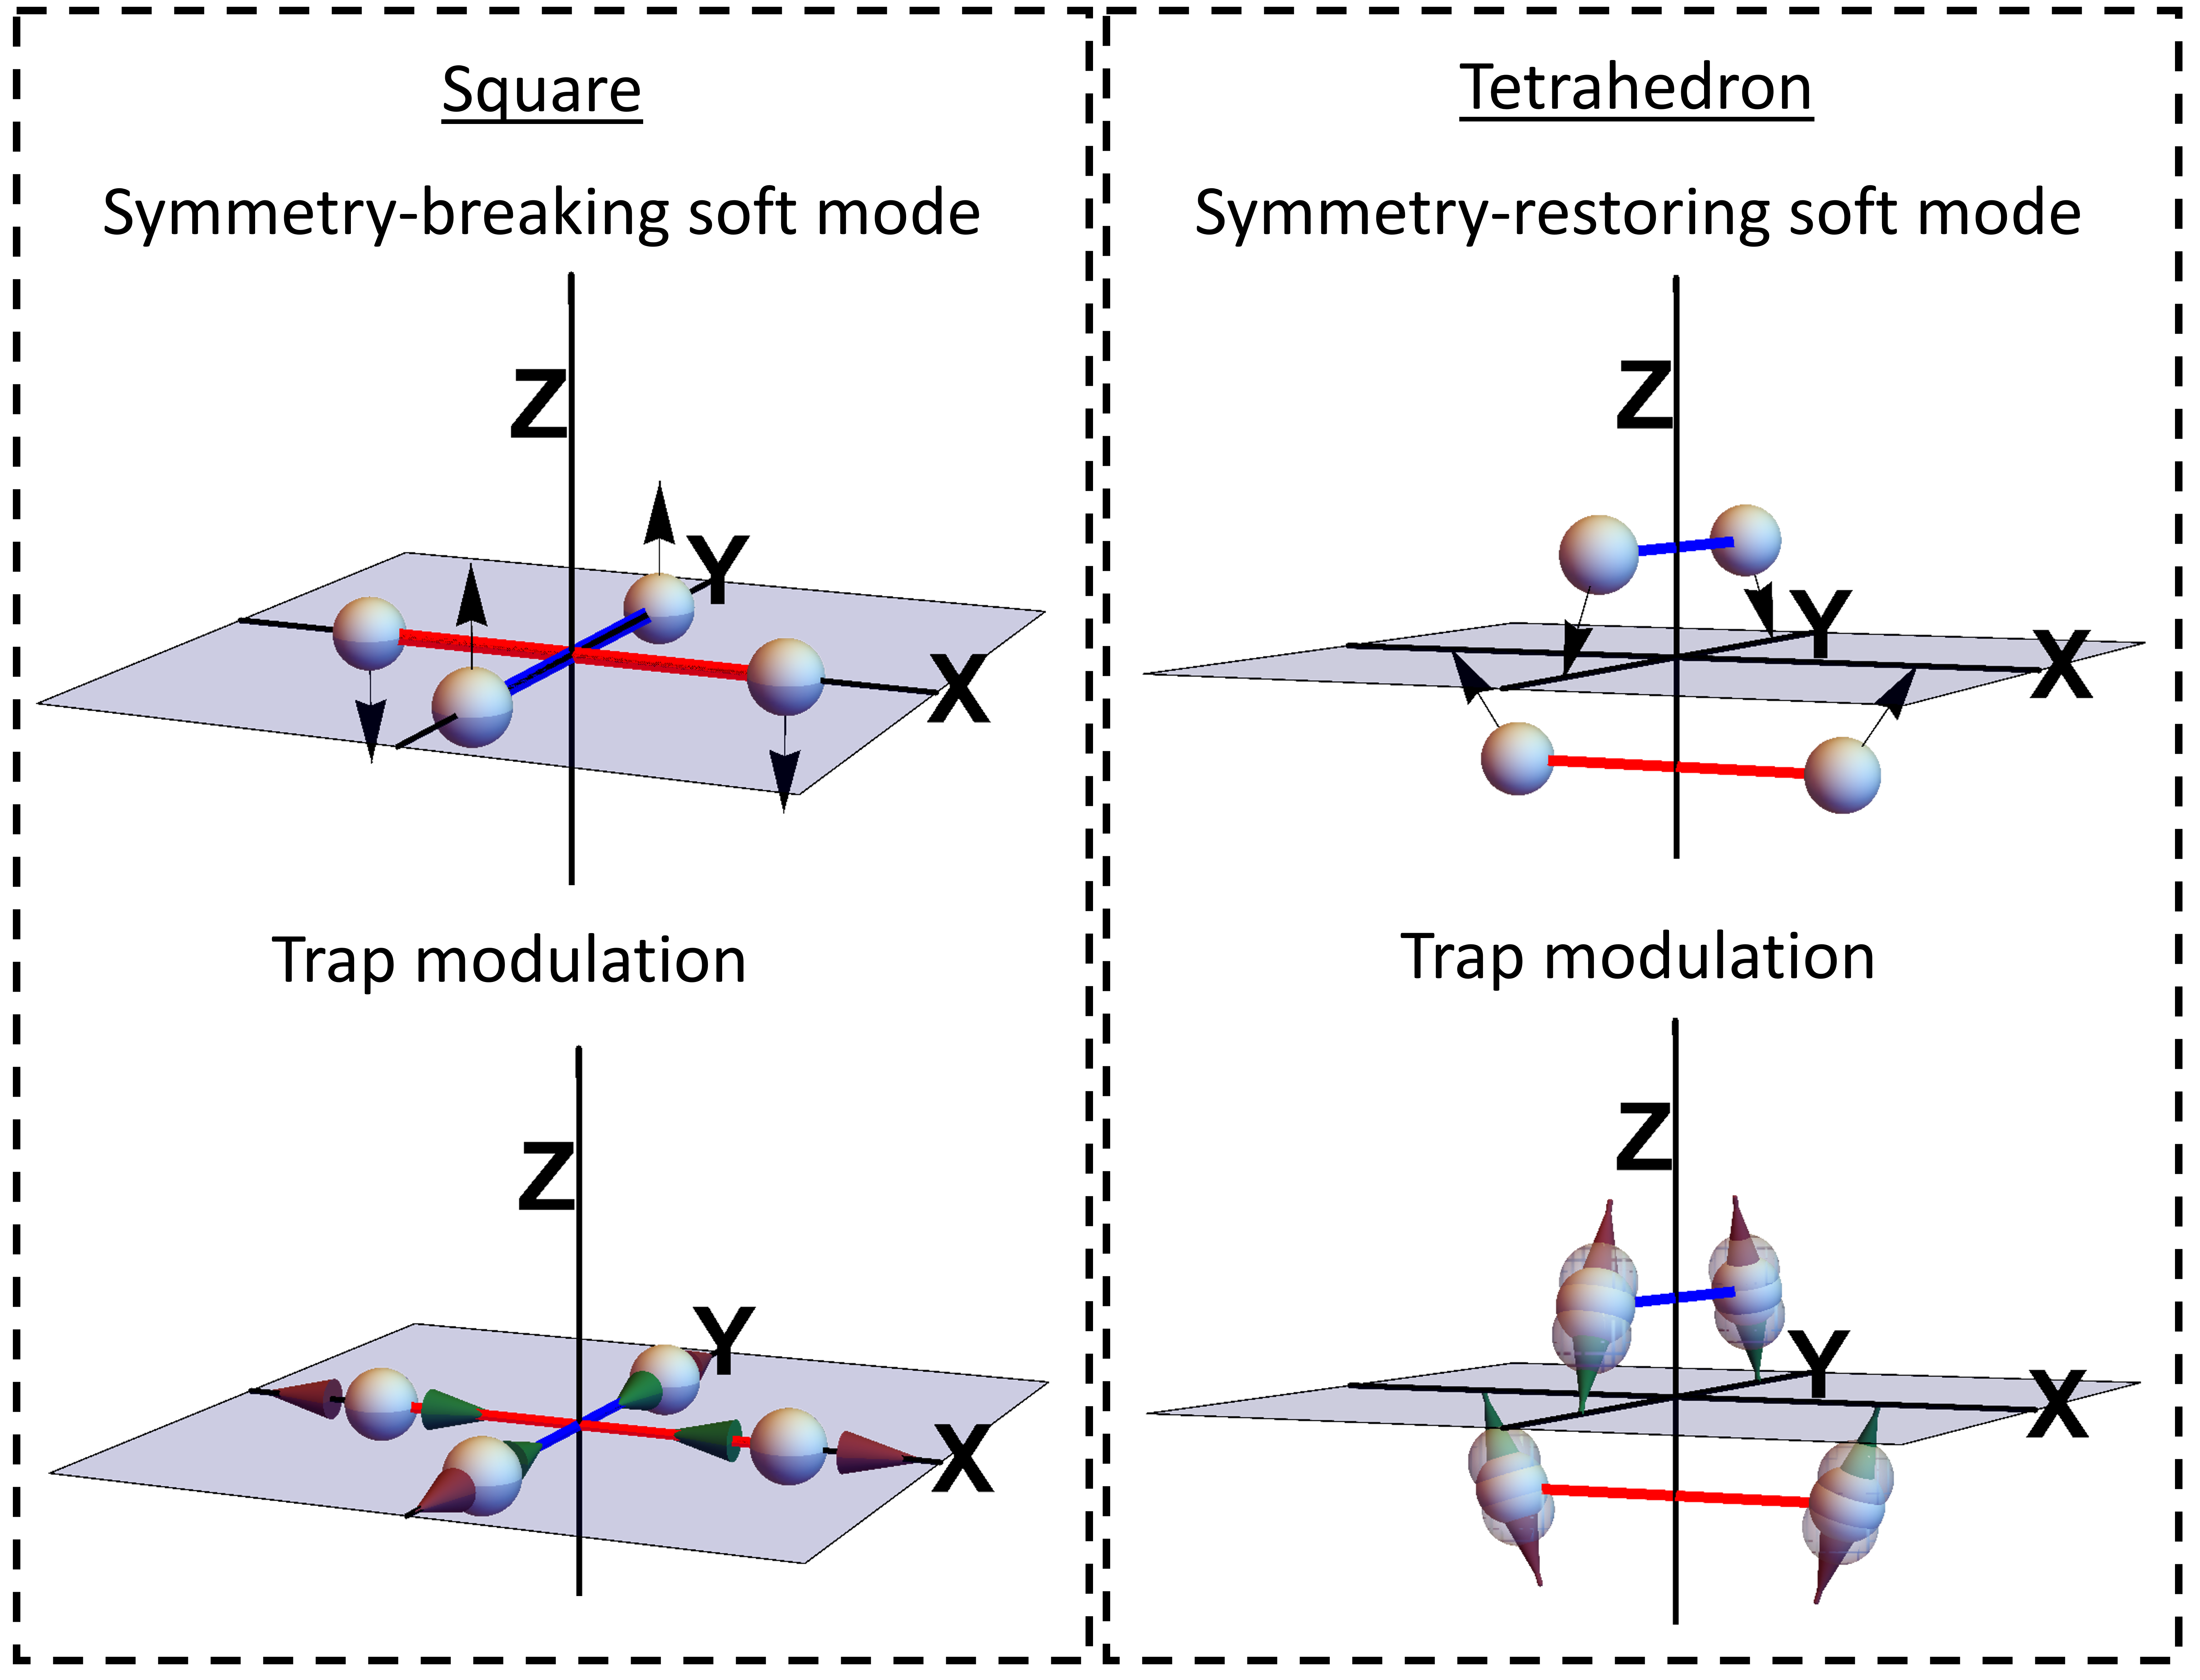
For , four ions self-organize at the corners of a square in the x-y plane. As the cluster is decompressed axially, the square transitions to a tetrahedral arrangement, where the two diagonals of the square move apart in the axial direction by , breaking reflection symmetry about x-y plane, as shown in Fig. 2(a). By scaling the energy and length into dimensionless units as and , where
| (3) |
the transition point can be analytically found by writing the potential energy of a tetrahedral configuration as
| (4) |
where the coordinates , are depicted in Fig. 2. Simultaneously solving and for the equilibrium positions , we obtain
| (5) |
where is the critical point where becomes non-zero, breaking reflection symmetry about x-y plane. The minimum energy is plotted in Fig. 2(a). While the first derivative is continuous at , the second derivative is discontinuous. The scaled energy is analogous to Landau free energy for a second-order transition, and (Fig. 2(a)) is analogous to the order parameter.
The numerically computed lowest normal-mode frequencies around this continuous transition, plotted in Fig. 2(b), exhibit a mode softening of both structures at . In the experiment, we excite the symmetry-restoring soft mode of the tetrahedron via rf-voltage modulation (as detailed in supplementary discussion II). We can directly capture the response via fluorescence imaging as shown in Fig. 2(b). We find that the maximum response at different values of occurs at a frequency that agrees well with the numerically computed soft-mode spectrum [Fig. 2(b)]. However, the experimentally accessible range for this excitation protocol is limited since the separation between the tetrahedron’s arms () reduces and the driven motion becomes indistinguishable from the reference image as approaches . Moreover, we cannot excite the soft mode of the square with the trap voltage modulation, as the drive predominantly couples to an in-plane vibrational mode with a higher frequency (see supplementary discussion II).
III.2 Stochastic switching
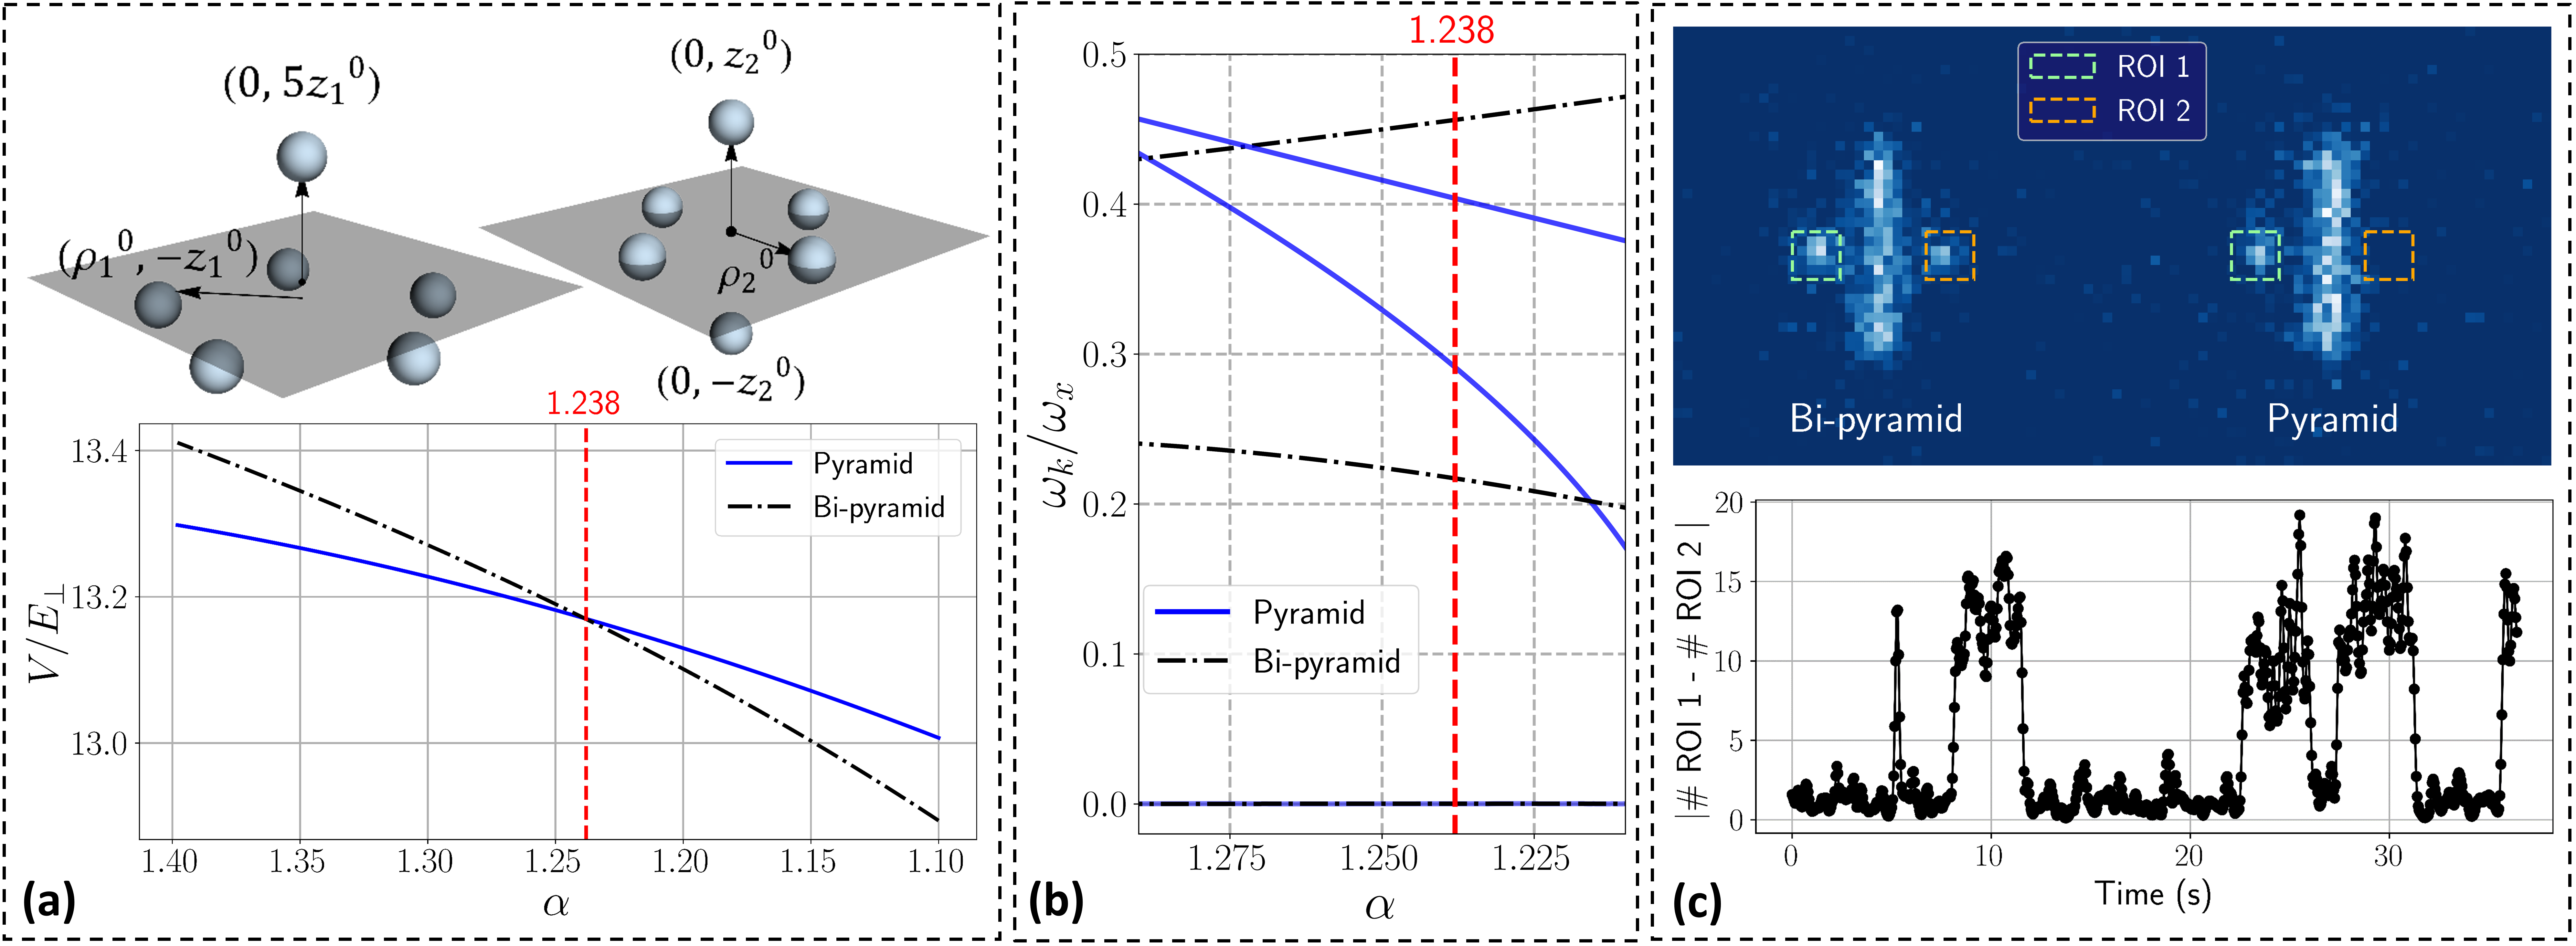
In the -ion cluster, a discontinuous transition is observed between two 3D structures with different symmetry groups: A pentagonal pyramid transitions to an octahedron or square bipyramid with the two apex ions along the trap axis, as shown in Fig. 3(a). The scaled potential energies of both configurations are, respectively,
| (6) | ||||
| (7) |
where the superscript (N) represents the N-fold rotational symmetry about z-axis, and the coordinates (, ) and (, ) are depicted in Fig. 3(a).
The minima of these functions cross at , as shown in Fig. 3(a). The collective modes of both configurations are stable across this transition point (Fig. 3(b)). Due to the coexistence of both minima over an extended region, we observe stochastic switching between the two symmetries, as presented in Fig. 3(c). The time trace is obtained in the experiment by setting . The real-time video corresponding to the time trace is provided as supplementary material.
III.3 Hysteresis and a triple point
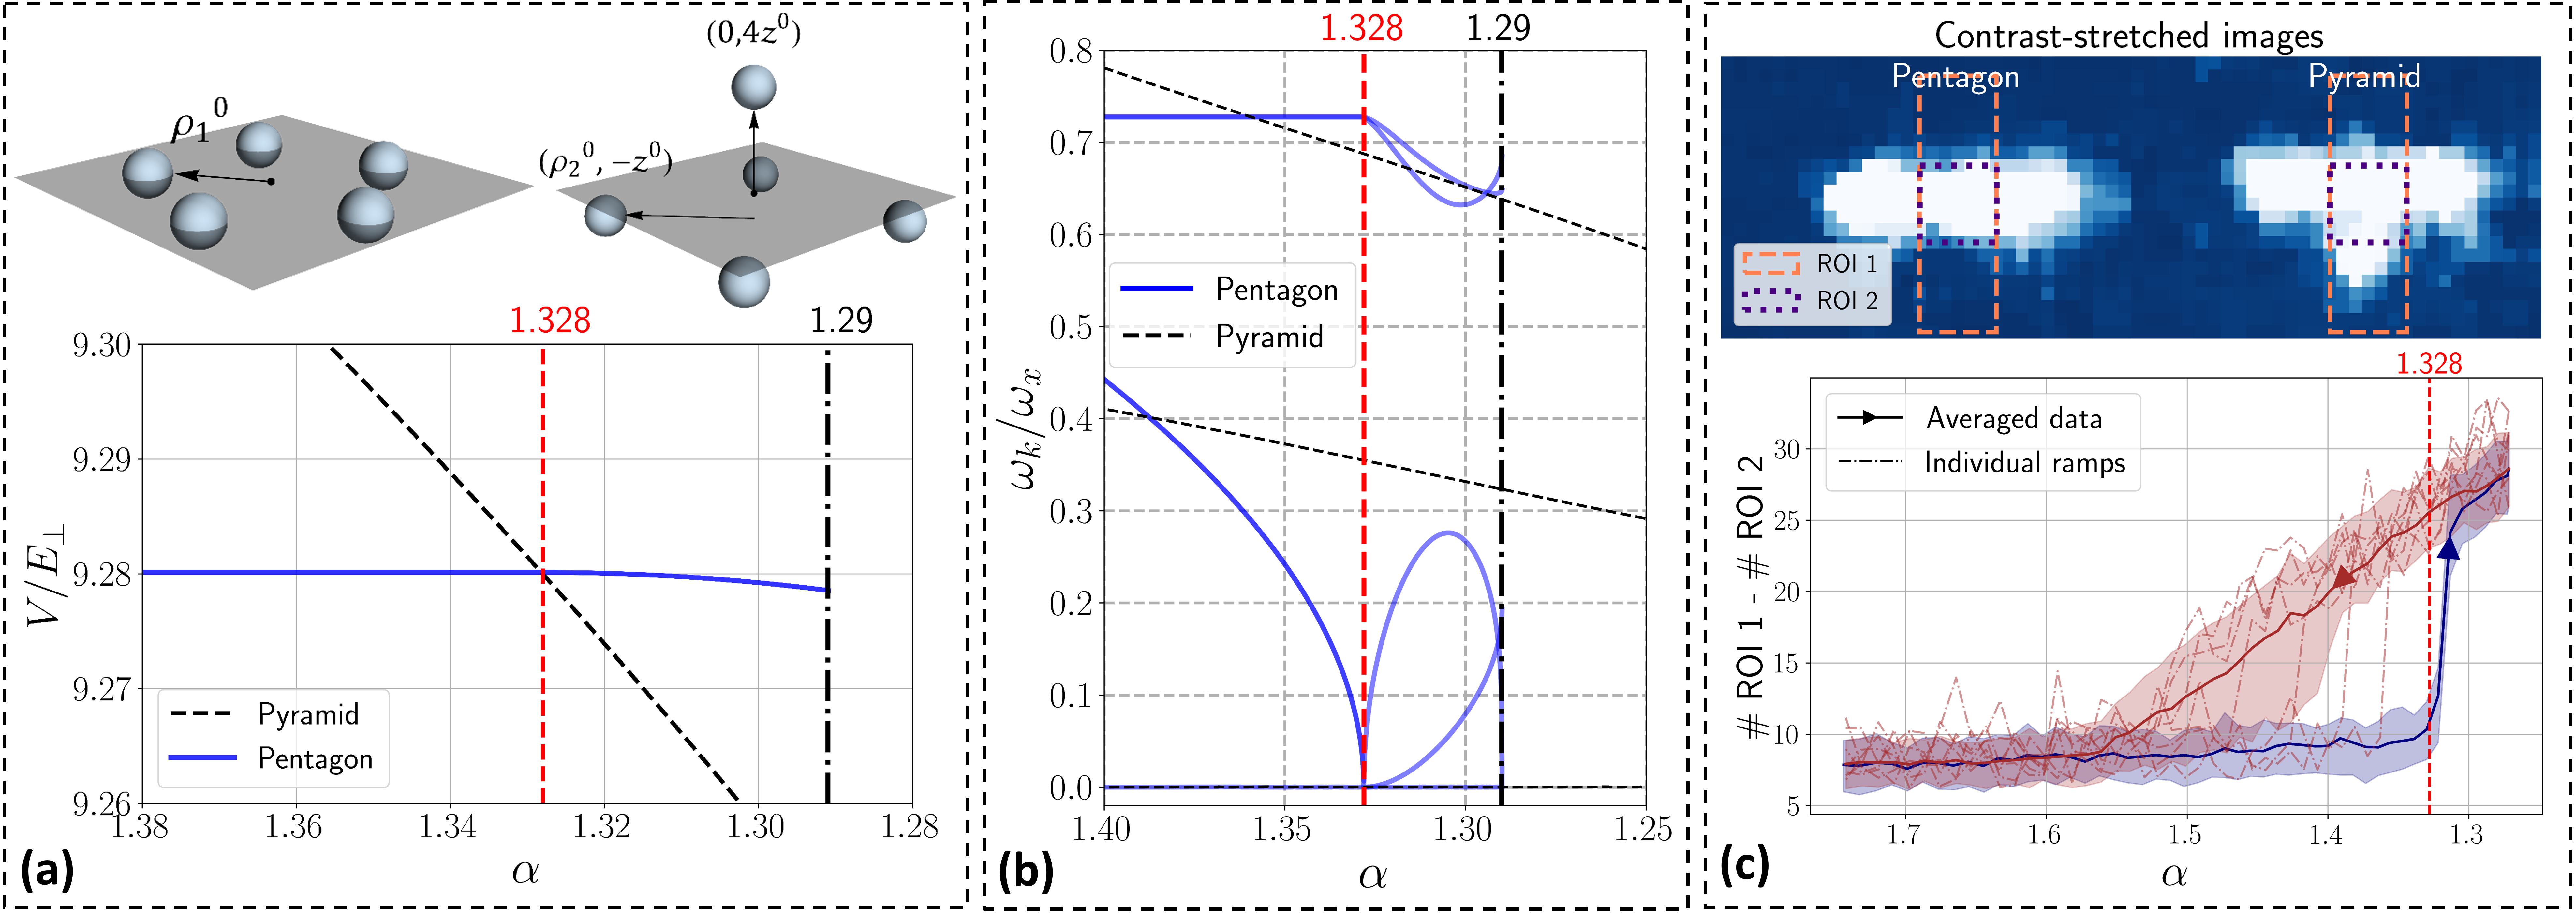
The planar CME of the -ion cluster for is a pentagonal arrangement in the x-y plane. As is reduced, the pentagon transitions to a pyramidal arrangement with the apex ion on z-axis and a square base, as shown in the fluorescence images in Fig. 1 and illustrated in Fig. 4(a). The transition point is obtained from the scaled potential energy of both structures, given by
| (8) | ||||
| (9) |
where the coordinates , , and are depicted in Fig. 4(a). Solving for the equilibrium configurations and , respectively, the minimum energy of the pentagon is obtained as , while the minimum energy of the square-pyramid decreases with , intersecting at [Fig. 4(a)].
For the stability analysis of both CMEs, we compute the collective-mode frequencies of the two structures around the transition point. As shown in Fig. 4(b), we find that two out-of-plane vibrational modes of the pentagon soften close to , whereas all the modes of the square pyramid remain stable across the boundary. We obtain this point of instability analytically (supplementary discussion III), which matches with the pentagon-to-pyramid crossing, . This results in a triple point [37] where a symmetry-changing transition from pentagon to pyramid occurs simultaneously with the symmetry-breaking transition of the pentagon. In addition, the two degenerate, deformed pentagons survive as local minima over a small window, becoming unstable beyond a spinodal point at , as shown in Fig. 4(b). By contrast, the pyramid remains stable throughout.
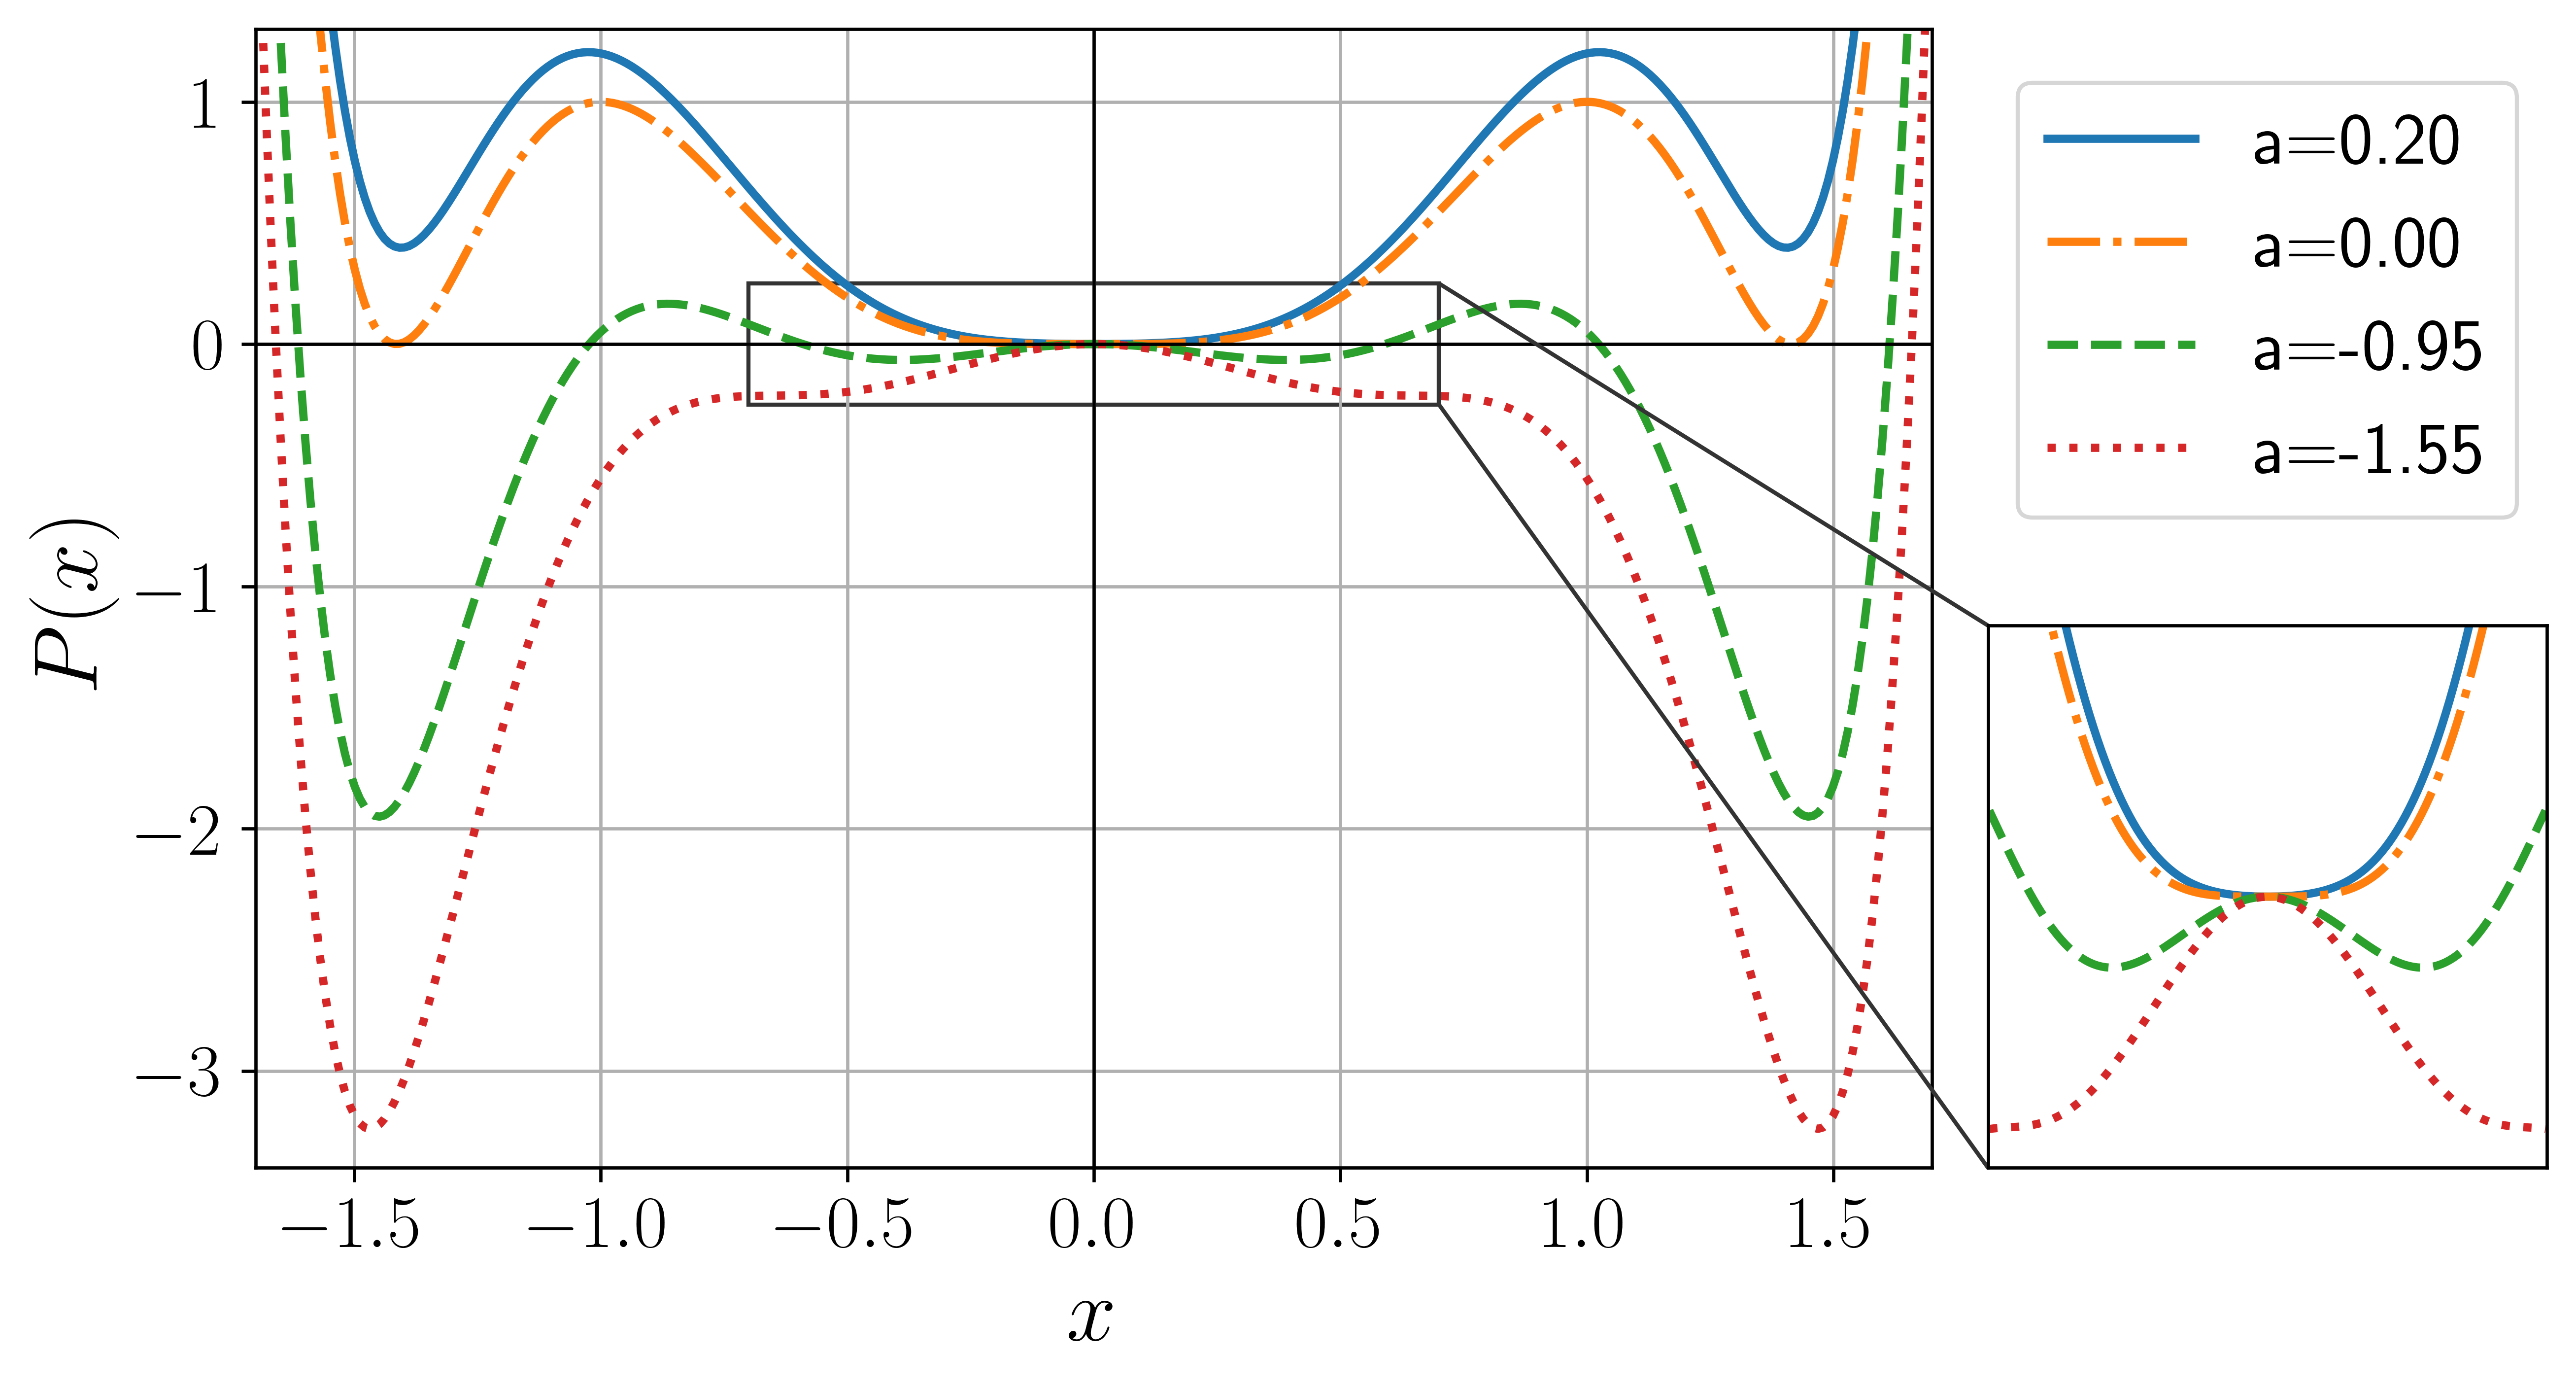
A simple one-dimensional (1D) potential that captures the simultaneous occurrence of a first-order and second-order transition, with four minima, is an 8th-order polynomial [38, 17]. Fig. 5 shows the potential landscape for different values of a. For (), the minimum at is analogous to the pentagon, while the minima at are analogous to the two metastable pyramids. At , a first-order transition occurs, where the global minimum shifts from to , analogous to the pentagon to pyramid transformation. Simultaneously, a symmetry-breaking transition of the minimum at occurs (symmetry-breaking transition of the pentagon). Moreover, the inner, symmetry-broken minima become unstable for , which is similar to the deformed pentagons turning unstable for .
The vastly unequal regions of stability of the two configurations (pentagon vs pyramid) lead to a hysteresis when is tuned back and forth across the transition point, particularly beyond the spinodal point at . We apply triangular voltage ramps for (see Fig. 1) to observe this effect in the experiment. As shown in Fig. 4(c), the pentagon sharply transitions to a square pyramid close to during the axial decompression phase. However, when the cluster is axially compressed by increasing , the system gets trapped in the local minimum, and the pyramidal arrangement remains intact beyond the transition point. The transition back to the pentagon configuration occurs significantly beyond . This phenomenon is analogous to the well-known example of metastable super-cooled water, which freezes via nucleation or an external disturbance (in this case, a photon kick or background collision). A few ramps during the compression phase are shown to demonstrate this nucleation effect in the transition back to the pentagon, which occurs over a large range of . Two real-time experimental videos demonstrating fast and slow nucleation are provided as supplementary material.
IV Discussion and Conclusion
We directly observe dynamical signatures of distinct classes of structural transitions in a unit-cell-sized Coulomb cluster of laser-cooled ions in an rf trap. The excellent agreement between the experimentally observed dynamics, analytical calculations based on symmetry of the configurations, and numerically computed collective-mode spectra provides a comprehensive picture of different transition mechanisms. Continuous transitions exhibit mode softening, where the frequency of the symmetry-breaking mode vanishes at the transition point. This effect is visualized by measuring the response of a -ion cluster to a controlled trap modulation. Second, a triple point-like feature is observed in a -ion cluster, where a pentagonal ground state undergoes a symmetry-breaking transition at the same point where the global minimum jumps from the pentagon to a pyramid with a different symmetry. We observe hysteresis by cyclically tuning the confinement and tracking the structural memory of the -ion cluster. Finally, at a discontinuous transition in a -ion cluster, the configuration switches stochastically between two distinct symmetry groups.
Previously, such switching behavior was observed in ion chains in a regime where background gas collisions are the dominant mechanism, enabling the characterization of ultra-high vacuum pressures [39, 40]. The ability to realize and monitor such transitions in a 3D unit cell with tunable energy barrier will enable the study of thermal activation processes due to photon kicks from the Doppler-cooling laser. Furthermore, cooling the crystal to its motional ground state would enable studies of the structural transitions in the quantum regime [41, 42, 33]. One can also employ such finite, self-organized clusters to investigate thermalization and heat transport [43, 44], pattern formation [45], crystals with impurities and defects [46, 47, 48, 49, 50] and Floquet engineering [51] in a controlled, strongly-correlated environment, broadening our understanding of collective phenomena in the presence of long-range interactions.
Acknowledgements.
We thank Arun Roy for comments on manuscript. The authors acknowledge support from Department of Science and Technology and Ministry of Electronics and Information Technology (MeitY), Government of India, under the “Centre for Excellence in Quantum Technologies” grant with Ref. No. 4(7)/2020-ITEA. A. Paramekanti acknowledges funding from the Natural Sciences and Engineering Research Council (NSERC) of Canada.References
- Kivelson et al. [2024] S. A. Kivelson, J. M. Jiang, and J. Chang, Statistical Mechanics of Phases and Phase Transitions, 1st ed. (Princeton University Press, 2024).
- Lenne and Trivedi [2022] P.-F. Lenne and V. Trivedi, Sculpting tissues by phase transitions, Nature Communications 13, 664 (2022).
- Boyanovsky et al. [2006] D. Boyanovsky, H. de Vega, and D. Schwarz, Phase transitions in the early and present universe, Annual Review of Nuclear and Particle Science 56, 441 (2006).
- Landau [1937] L. D. Landau, On the theory of phase transitions, Zh. Eksp. Teor. Fiz. 7, 19 (1937).
- Miller [2014] R. J. D. Miller, Femtosecond crystallography with ultrabright electrons and x-rays: Capturing chemistry in action, Science 343, 1108 (2014).
- Cavalleri et al. [2006] A. Cavalleri, S. Wall, C. Simpson, E. Statz, D. W. Ward, K. A. Nelson, M. Rini, and R. W. Schoenlein, Tracking the motion of charges in a terahertz light field by femtosecond x-ray diffraction, Nature 442, 664 (2006).
- Sie et al. [2019] E. J. Sie et al., An ultrafast symmetry switch in a weyl semimetal, Nature 565, 61 (2019).
- de la Torre et al. [2021] A. de la Torre, D. M. Kennes, M. Claassen, S. Gerber, J. W. McIver, and M. A. Sentef, Colloquium: Nonthermal pathways to ultrafast control in quantum materials, Rev. Mod. Phys. 93, 041002 (2021).
- Ho et al. [2025] J. Ho et al., Optomechanical self-organization in a mesoscopic atom array, Nat. Phys. , 1 (2025).
- Cochran [1973] W. Cochran, The Dynamics of Atoms in Crystals (Edward Arnold Limited, Great Britain, 1973).
- Raman and Nedungadi [1940] C. V. Raman and T. M. K. Nedungadi, The Transformation of Quartz, Nature 145, 147 (1940).
- Cochran [1959] W. Cochran, Crystal Stability and the Theory of Ferroelectricity, Phys. Rev. Lett. 3, 412 (1959).
- Anderson [1960] P. W. Anderson, Qualitative description of the phase transition in batio3-type ferroelectrics, Fizika Dielectrikov (1960).
- Tolédano and Dmitriev [1996] P. Tolédano and V. Dmitriev, Reconstructive Phase Transitions: In Crystals and Quasicrystals (WORLD SCIENTIFIC, 1996).
- Yan et al. [2017] X.-J. Yan et al., Investigation on the phase-transition-induced hysteresis in the thermal transport along the c-axis of mote2, npj Quantum Materials 2, 31 (2017).
- Akhanda et al. [2022] M. S. Akhanda et al., Phase-transition-induced thermal hysteresis in type-ii weyl semimetals mote2 and mo1-xwxte2, Materials Today Physics 29, 100918 (2022).
- Tolédano and Tolédano [1987] J. C. Tolédano and P. Tolédano, The Landau Theory of Phase Transitions: Application to Structural, Incommensurate, Magnetic and Liquid Crystal Systems (WORLD SCIENTIFIC, 1987).
- Blatt and Roos [2012] R. Blatt and C. F. Roos, Quantum simulations with trapped ions, Nature Physics 8, 277 (2012).
- Drewsen [2015] M. Drewsen, Ion Coulomb crystals, Physica B: Condensed Matter 460, 105 (2015).
- Monroe et al. [2021] C. Monroe et al., Programmable quantum simulations of spin systems with trapped ions, Rev. Mod. Phys. 93, 025001 (2021).
- Sun et al. [2024] Z. Sun, Y. H. Teoh, F. Rajabi, and R. Islam, Two-dimensional ion crystals in a hybrid optical cavity trap for quantum information processing, Phys. Rev. A 109, 032426 (2024).
- Wineland et al. [1987] D. J. Wineland, J. C. Bergquist, W. M. Itano, J. J. Bollinger, and C. H. Manney, Atomic-Ion Coulomb Clusters in an Ion Trap, Phys. Rev. Lett. 59, 2935 (1987).
- Dubin [1993] D. H. E. Dubin, Theory of structural phase transitions in a trapped Coulomb crystal, Phys. Rev. Lett. 71, 2753 (1993).
- Schiffer [1993] J. P. Schiffer, Phase transitions in anisotropically confined ionic crystals, Phys. Rev. Lett. 70, 818 (1993).
- Mitchell et al. [1998] T. B. Mitchell et al., Direct Observations of Structural Phase Transitions in Planar Crystallized Ion Plasmas, Science 282, 1290 (1998).
- Gilbert et al. [1988] S. L. Gilbert, J. J. Bollinger, and D. J. Wineland, Shell-Structure Phase of Magnetically Confined Strongly Coupled Plasmas, Phys. Rev. Lett. 60, 2022 (1988).
- Tan et al. [1995] J. N. Tan, J. J. Bollinger, B. Jelenkovic, and D. J. Wineland, Long-Range Order in Laser-Cooled, Atomic-Ion Wigner Crystals Observed by Bragg Scattering, Phys. Rev. Lett. 75, 4198 (1995).
- Drewsen et al. [1998] M. Drewsen, C. Brodersen, L. Hornekær, J. S. Hangst, and J. P. Schifffer, Large Ion Crystals in a Linear Paul Trap, Phys. Rev. Lett. 81, 2878 (1998).
- Mortensen et al. [2006] A. Mortensen, E. Nielsen, T. Matthey, and M. Drewsen, Observation of Three-Dimensional Long-Range Order in Small Ion Coulomb Crystals in an rf Trap, Phys. Rev. Lett. 96, 103001 (2006).
- Ibaraki et al. [2011] Y. Ibaraki, U. Tanaka, and S. Urabe, Detection of parametric resonance of trapped ions for micromotion compensation, Appl. Phys. B 105, 219 (2011).
- Kiethe et al. [2021] J. Kiethe et al., Finite-temperature spectrum at the symmetry-breaking linear to zigzag transition, Phys. Rev. B 103, 104106 (2021).
- Kiethe et al. [2017] J. Kiethe, R. Nigmatullin, D. Kalincev, T. Schmirander, and T. E. Mehlstäubler, Probing nanofriction and aubry-type signatures in a finite self-organized system, Nat. Commun. 8, 15364 (2017).
- Zhang et al. [2023] J. Zhang et al., Spectroscopic characterization of the quantum linear-zigzag transition in trapped ions, npj Quantum Inf 9, 68 (2023).
- Prakash et al. [2024] A. Prakash, A. Ayyadevara, E. Krishnakumar, and S. A. Rangwala, Low divergence cold-wall oven for loading ion traps, Review of Scientific Instruments 95, 033202 (2024).
- Schrama et al. [1993] C. Schrama, E. Peik, W. Smith, and H. Walther, Novel miniature ion traps, Optics Communications 101, 32 (1993).
- Dubin and O’Neil [1999] D. H. E. Dubin and T. M. O’Neil, Trapped nonneutral plasmas, liquids, and crystals (the thermal equilibrium states), Rev. Mod. Phys. 71, 87 (1999).
- Jackson et al. [1978] S. A. Jackson, P. A. Lee, and T. M. Rice, Triple point of the lock-in and onset transitions of charge-density waves, Phys. Rev. B 17, 3611 (1978).
- Gufan and Larin [1978] Y. M. Gufan and E. Larin, Phenomenological consideration of the isostructural phase transition, Dokl. Akad. Nauk SSSR 242, 1311 (1978).
- Pagano et al. [2018] G. Pagano et al., Cryogenic trapped-ion system for large scale quantum simulation, Quantum Science and Technology 4, 014004 (2018).
- Aikyo et al. [2020] Y. Aikyo et al., Vacuum characterization of a compact room-temperature trapped ion system, Appl. Phys. Lett. 117, 234002 (2020).
- Retzker et al. [2008] A. Retzker, R. C. Thompson, D. M. Segal, and M. B. Plenio, Double Well Potentials and Quantum Phase Transitions in Ion Traps, Phys. Rev. Lett. 101, 260504 (2008).
- Shimshoni et al. [2011] E. Shimshoni, G. Morigi, and S. Fishman, Quantum Zigzag Transition in Ion Chains, Phys. Rev. Lett. 106, 010401 (2011).
- Freitas et al. [2016] N. Freitas, E. A. Martinez, and J. P. Paz, Heat transport through ion crystals, Phys. Scr. 91, 013007 (2016).
- Timm et al. [2023] L. Timm, H. Weimer, L. Santos, and T. E. Mehlstäubler, Heat transport in an ion Coulomb crystal with a topological defect, Phys. Rev. B 108, 134302 (2023).
- Lee and Cross [2011] T. E. Lee and M. C. Cross, Pattern formation with trapped ions, Phys. Rev. Lett. 106, 143001 (2011).
- Del Campo et al. [2010] A. Del Campo, G. De Chiara, G. Morigi, M. B. Plenio, and A. Retzker, Structural Defects in Ion Chains by Quenching the External Potential: The Inhomogeneous Kibble-Zurek Mechanism, Phys. Rev. Lett. 105, 075701 (2010).
- Ulm et al. [2013] S. Ulm et al., Observation of the Kibble–Zurek scaling law for defect formation in ion crystals, Nat Commun 4, 2290 (2013).
- Pyka et al. [2013] K. Pyka et al., Topological defect formation and spontaneous symmetry breaking in ion Coulomb crystals, Nat Commun 4, 2291 (2013).
- Arnold and Nigmatullin [2022] M. Arnold and R. Nigmatullin, Dynamics of vortex defect formation in two-dimensional coulomb crystals, Phys. Rev. B 106, 104106 (2022).
- Duca et al. [2023] L. Duca et al., Orientational melting in a mesoscopic system of charged particles, Phys. Rev. Lett. 131, 083602 (2023).
- Kiefer et al. [2019] P. Kiefer et al., Floquet-engineered vibrational dynamics in a two-dimensional array of trapped ions, Phys. Rev. Lett. 123, 213605 (2019).
Supplementary discussion
I End-cap Trap
The time-varying potential generated by the trap is of the form:
| (S1) |
where is half the distance between rf-electrodes and is the quadrupole efficiency of the trap geometry [1, 2]. The dc () and rf () voltages are set to operate the trap within the first Mathieu stability region [3], represented in the rescaled Mathieu a () and q () parameter space. Under the adiabatic approximation - [4] , the angular frequencies of the time-averaged harmonic potential are related to the Mathieu parameters as:
| (S2) |
where , , Q is the charge of the trapped particles ( for singly ionized Calcium), and MHz is the drive frequency of the trap. By fixing V and varying V to V, can be continuously tuned from to . The fluorescence images of the clusters are imaged onto an EMCCD camera using a custom-made objective with 22 magnification.
II Exciting the soft mode of the 4-ion tetrahedron
The motion of trapped ions in our experiment is excited via two different methods. The first method is forced oscillation of the trap center, where one of the conical DC electrodes is given a small sinusoidal voltage, which results in the center-of-mass (c.o.m.) of the cluster oscillating about the trap center. When this frequency matches the c.o.m. mode’s frequency, the increase in the oscillation amplitude of the ions is seen on EMCCD. Any slight misalignment of the conical electrode that is inadvertent leads to an oscillatory gradient field along both the radial and axial directions, enabling the excitation of both c.o.m. modes on resonance with this scheme. We directly measure at different values by exciting a single ion’s radial and axial motion.
The second method is the amplitude modulation of rf-voltage () at a frequency . This leads to an oscillatory Mathieu parameter, effectively modulating the elastic constants of the time-averaged harmonic potential, and . This leads to a parametric excitation of the c.o.m. motion for [5]. In the case of a multi-ion cluster, the modulation of trap curvatures will also drive the ions about the mean CME coordinate along the unit vector .
To obtain this unit vector at a set of (, ) values, the CME coordinates corresponding to small perturbation in rf-voltage are computed. For small values of , we obtain
| (S3) |
the unit vector along the driven motion about . The collective modes that can couple to the drive can be obtained from the projections , where are the normal-mode eigen vectors.
| Normal-mode | Square | Tetrahedron | ||
| () | () | |||
| Vibrational-mode 1 | 1.73 | 1 | 1.76 | 0.09 |
| Vibrational-mode 2 | 1.49 | 0 | 1.37 | 0 |
| Vibrational-mode 3 | 1.32 | 0 | 1.35 | 0 |
| Vibrational-mode 4 | 1.32 | 0 | 1.35 | 0 |
| c.o.m. - Z | 1.254 | 0 | 1.186 | 0 |
| c.o.m. - X | 1 | 0 | 1 | 0 |
| c.o.m. - Y | 1 | 0 | 1 | 0 |
| Vibrational-mode 5 | 0.88 | 0 | 0.94 | 0 |
| X - rotation | 0.76 | 0 | 0.52 | 0 |
| Y - rotation | 0.76 | 0 | 0.52 | 0 |
| soft mode | 0.3 | 0 | 0.37 | 0.996 |
| Z - rotation | 0 | 0 | 0 | 0 |
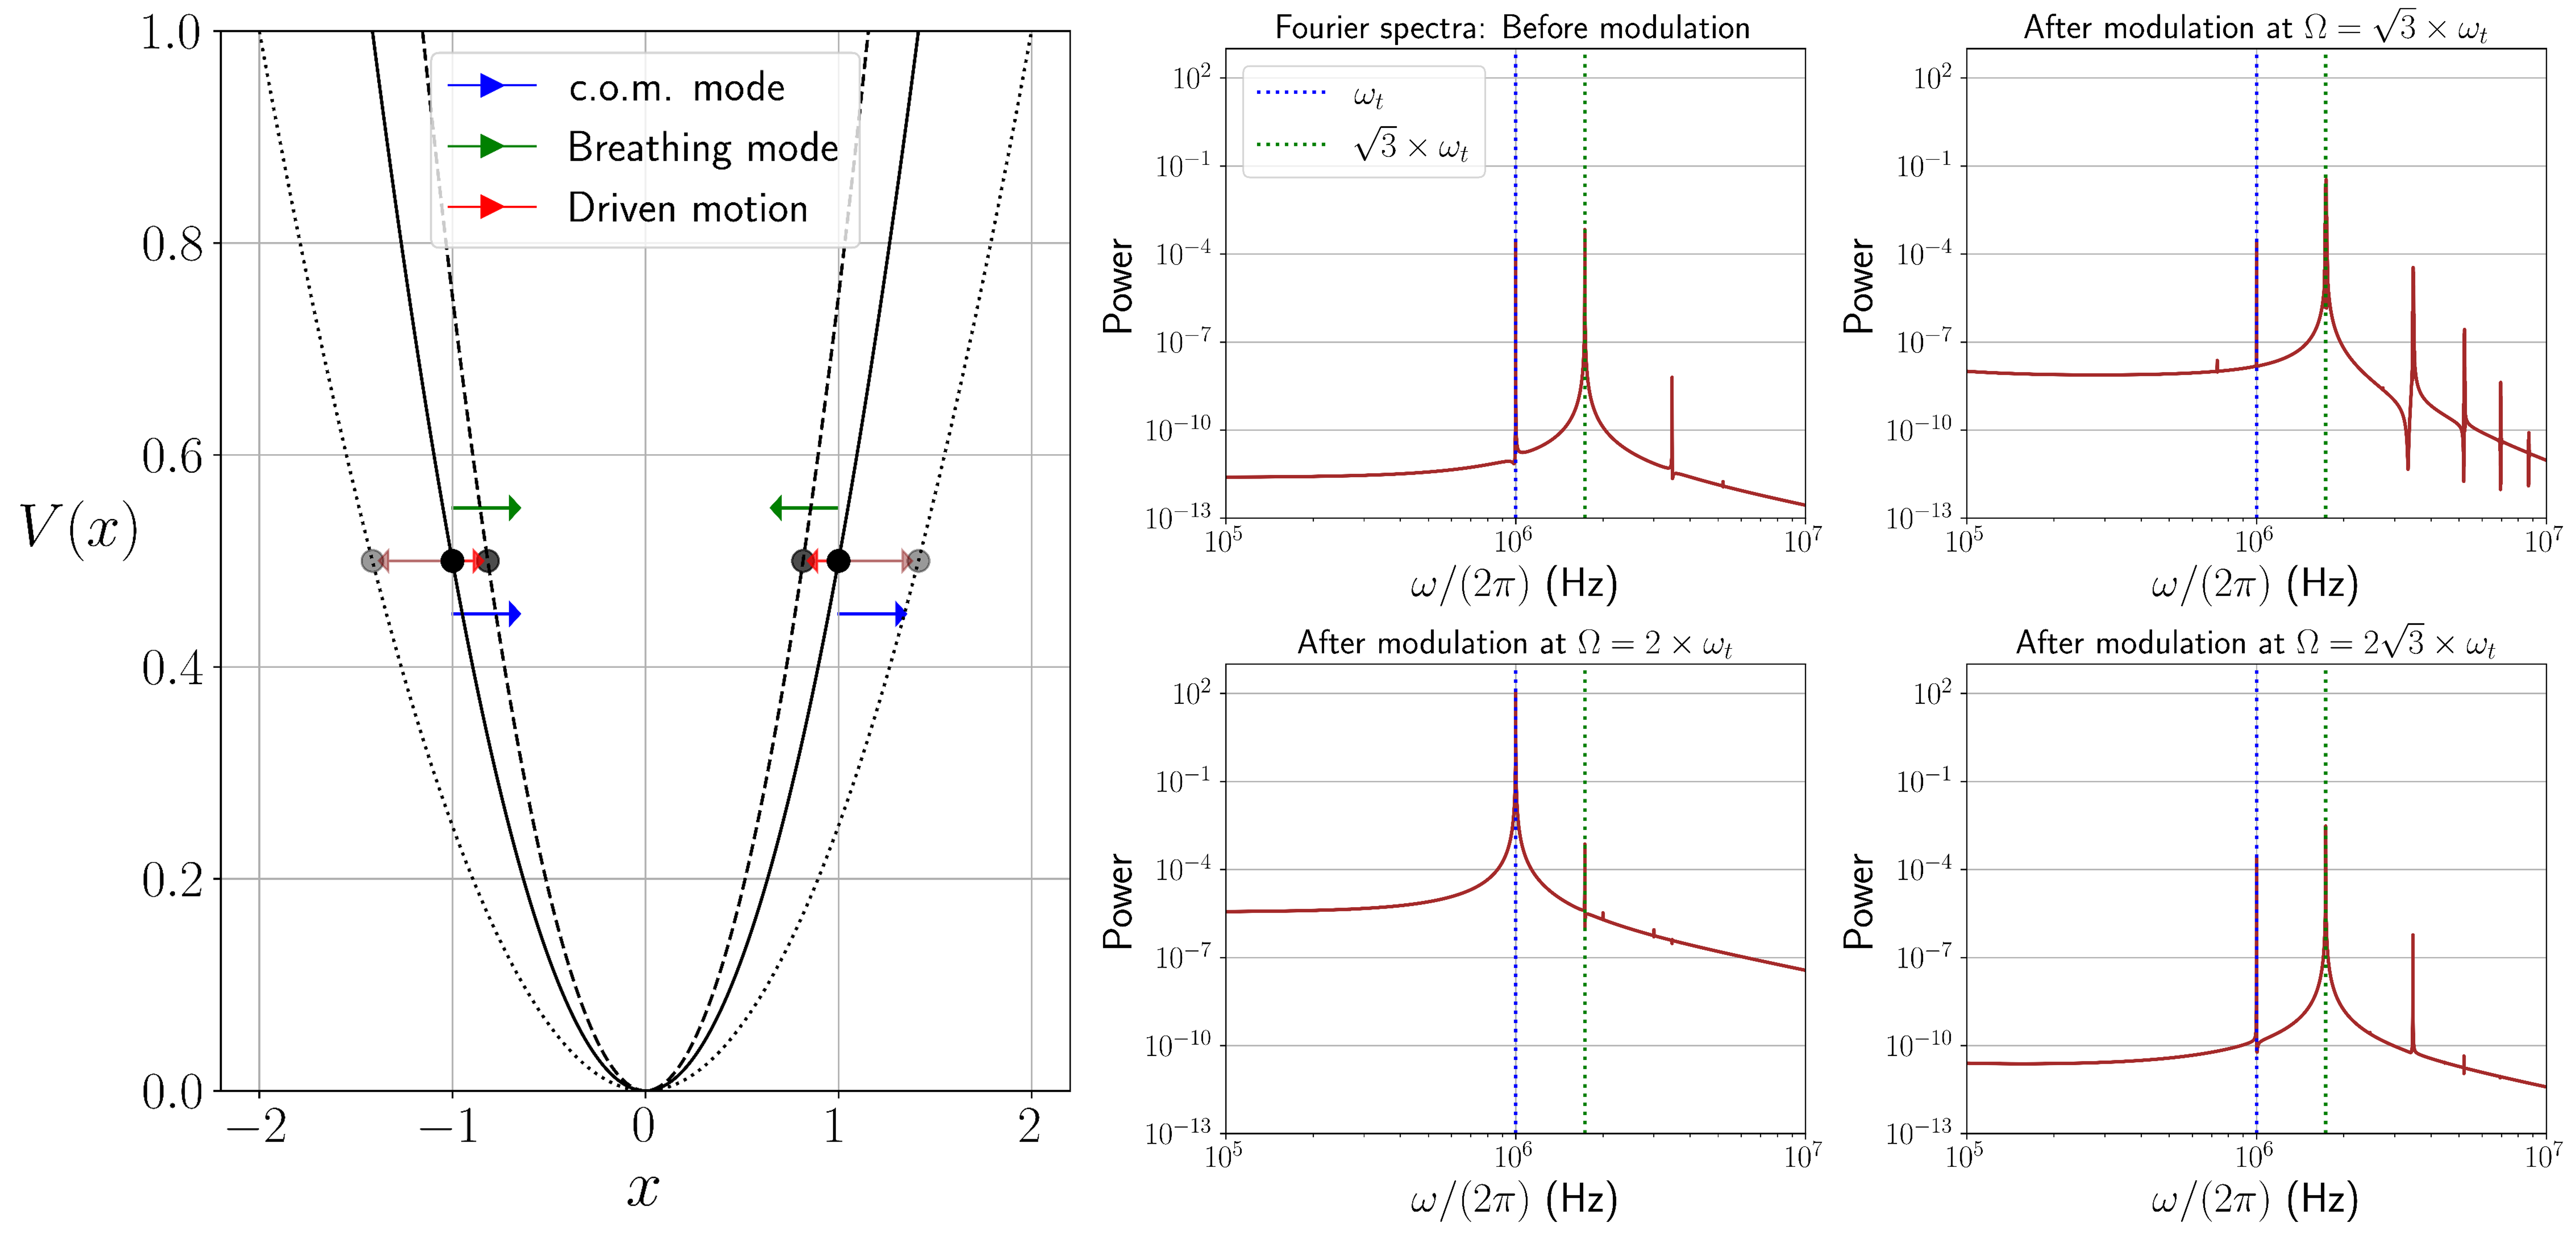
To illustrate the resonant excitation of a collective mode via trap curvature modulation, consider a toy problem of two like charges with mass m, co-trapped in a 1D harmonic potential of frequency MHz. The two normal modes are shown in Fig. SF1: c.o.m. mode with frequency and breathing mode with frequency . The motion of the charges is first damped to equilibrium positions, and the spring constant is then modulated at , i.e., . In Fig. SF1, the power spectrum of the ions’ motion after the damping period is compared with the power spectra after the modulation at different frequencies. For a modulation strength , the c.o.m. mode shows parametric excitation at , while the breathing mode shows resonant excitation for . In this case, it is trivial to see that the unit vector along the driven motion is exactly the breathing mode (Fig. SF1).
Let us look at the collective modes of the -ion cluster near the square to tetrahedron transition. The projections of all the eigenvectors along the drive are tabulated in Table 1. The symmetry-restoring soft mode of the tetrahedron (shown in Fig. SF2) has a projection , enabling the resonant excitation of this mode experimentally. However, the same technique excites a high-frequency in-plane mode of the square shown in Fig. SF2, and cannot be used to observe the softening of the square’s symmetry-breaking mode.
III Mode softening of the 5-ion pentagon
III.1 Out-of-plane normal modes
In the pentagonal configuration, the ion positions are given by , where is the circum-radius of the pentagon. The total potential energy of the pentagonal configuration is:
where . The equilibrium radius is found by minimizing with respect to , which gives
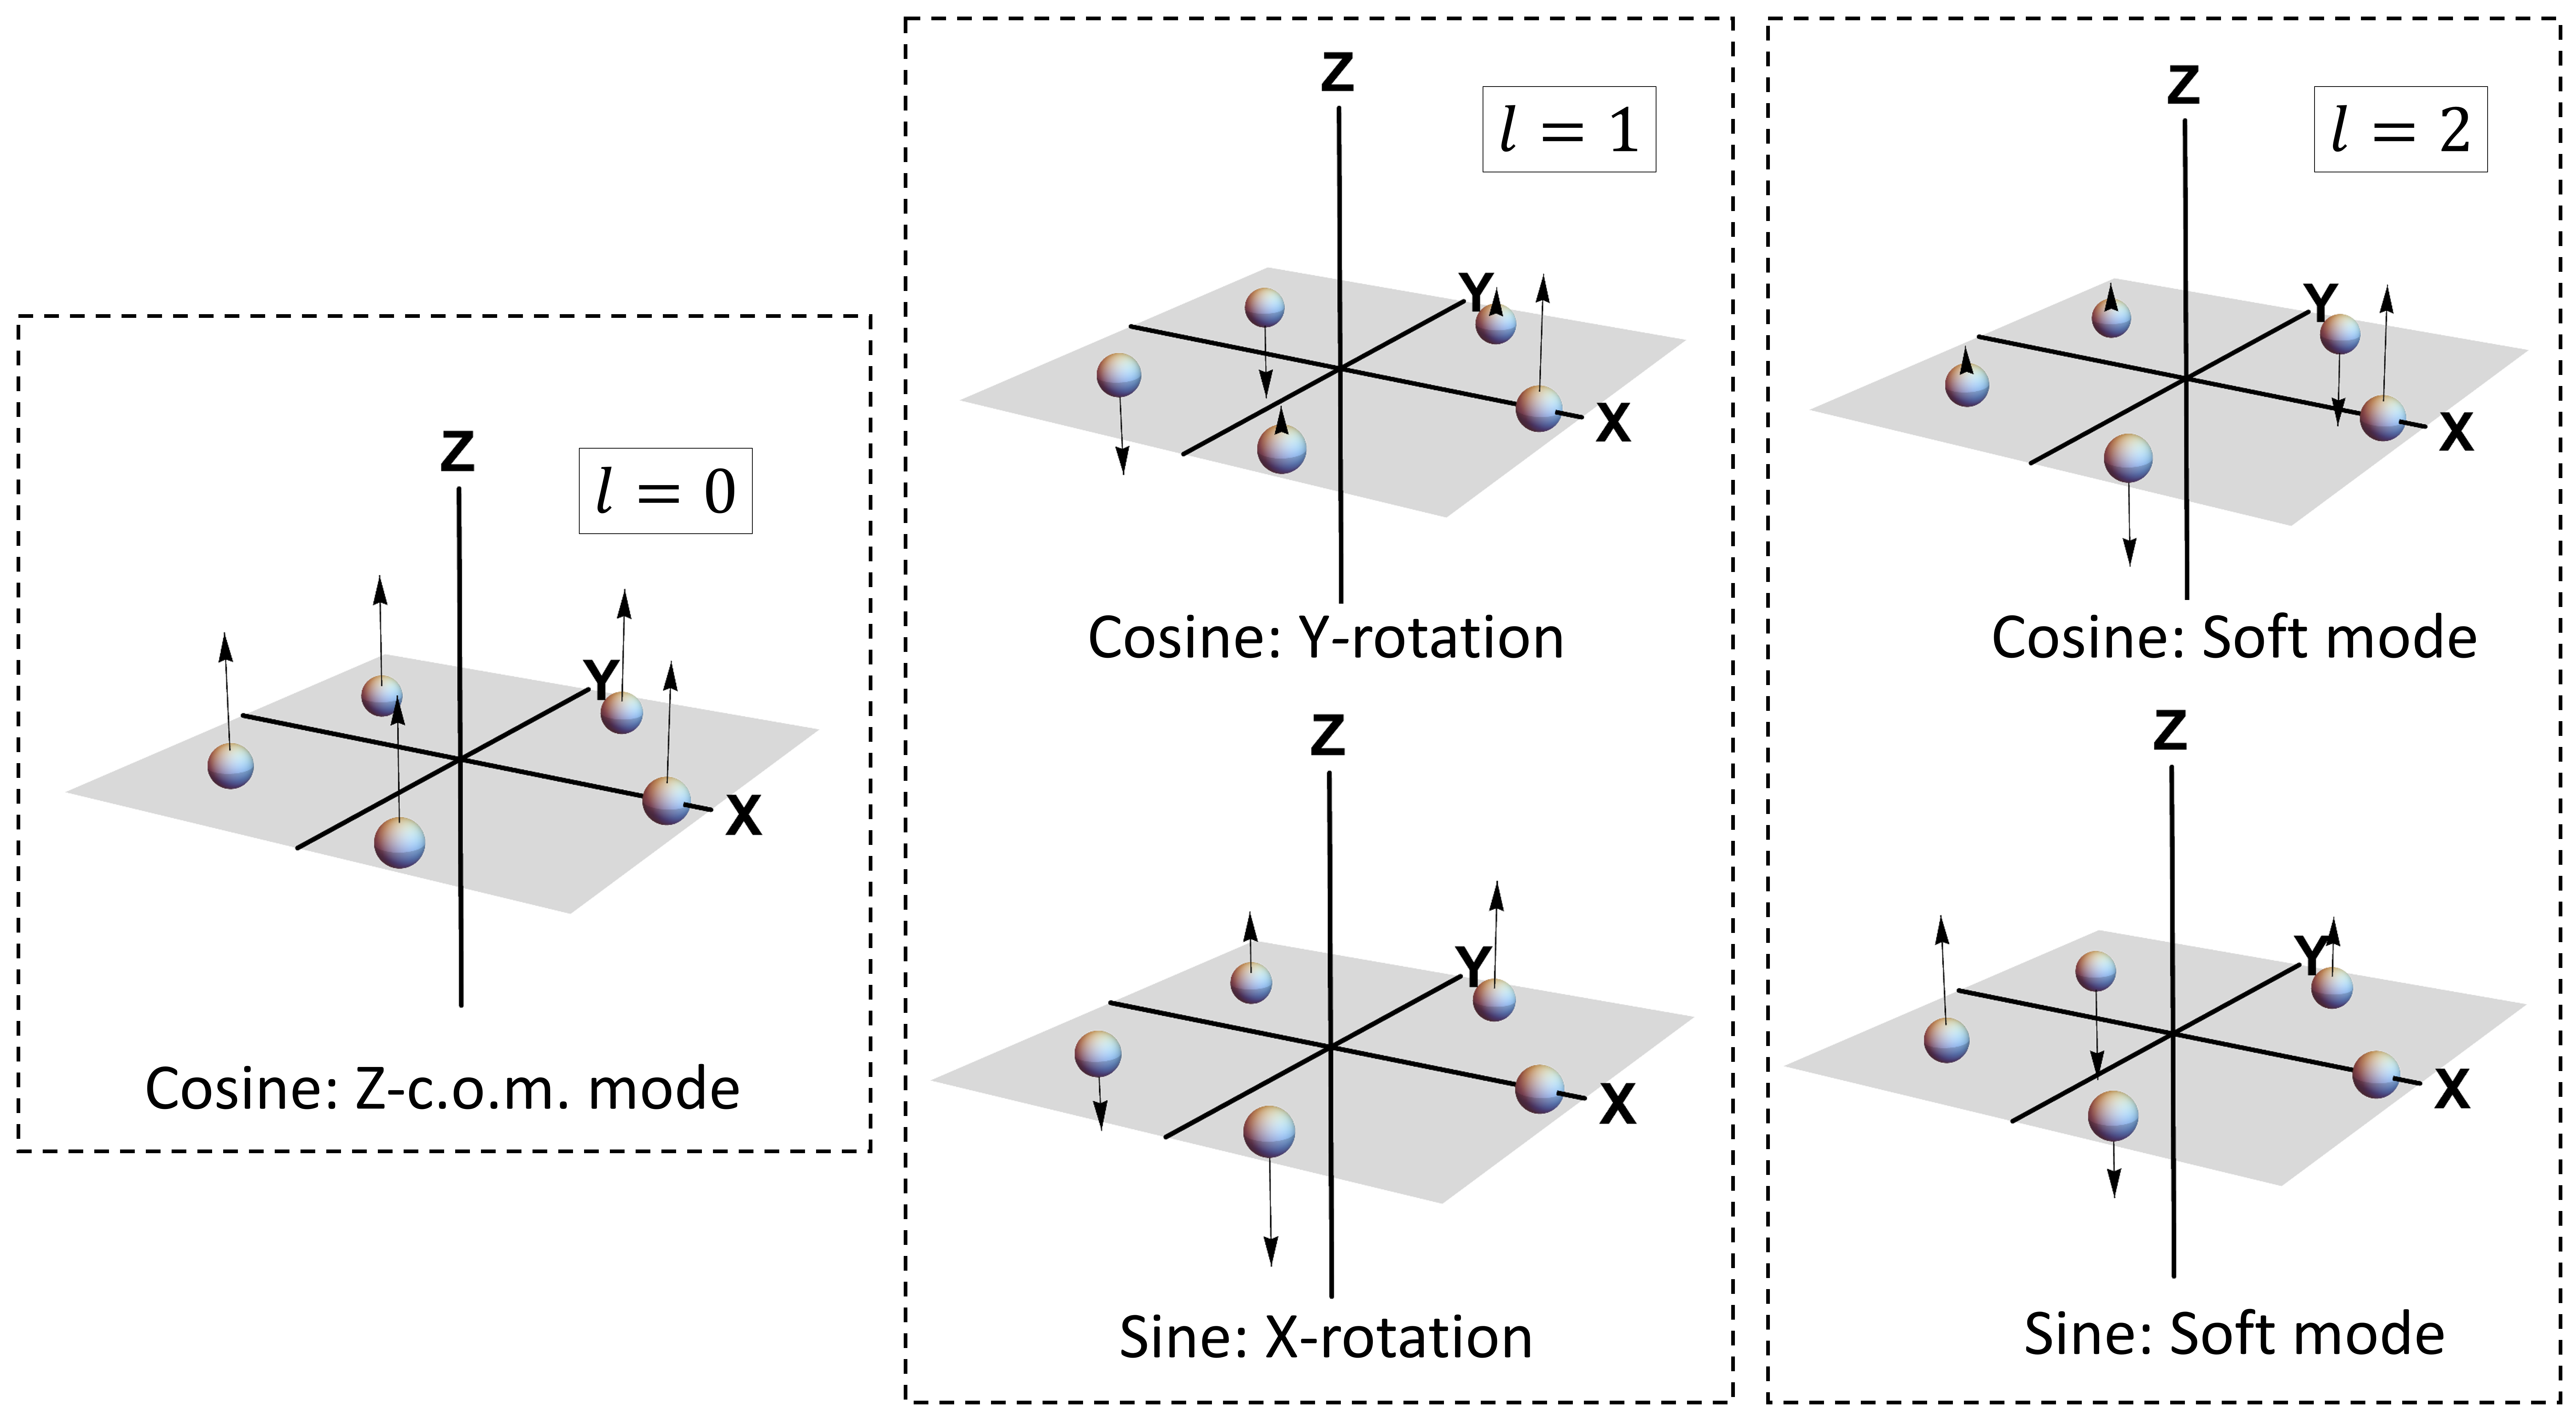
The -displacements of the ions for the fundamental out-of-plane modes [6] can be described by sinusoidal functions of the ion index n (where ):
| (S4) |
where is an integer characterizing the angular dependence. These modes are sketched in Fig. SF3: c.o.m. Z-Motion for Cosine l=0 mode, rigid tilt/rotation about Y-axis for Cosine l=1 mode, rigid tilt/rotation about X-axis for Sine l=1 mode, and two buckling modes for Cosine and Sine l=2.
III.2 Buckling critical point
The ion positions are slightly perturbed along the sine buckling mode:
We now calculate the change in total potential energy to order . The change in harmonic potential energy is positive, given by
The distance between ions and is , where the in-plane distance at the equilibrium configuration is . For small , we expand the inverse distance:
| (S5) | ||||
| (S6) |
The change in Coulomb energy is
Let us define the dimensionless structural sum as .
So the change in Coulomb energy is
| (S7) |
For the cosine mode, a similar analysis can be performed, which leads to the dimensionless structural sum in the Coulomb energy term:
| (S8) |
To show
Since , the total change in potential energy to order for both modes is
The critical point occurs when the coefficient is zero:
Solving for and substituting :
We find:
| (S9) |
References
- [1] P. B. R. Nisbet-Jones et al., “A single-ion trap with minimized ion–environment interactions,” Appl. Phys. B, vol. 122, no. 3, p. 57, Mar. 2016. doi: 10.1007/s00340-016-6327-x.
- [2] T. Lindvall, K. J. Hanhijärvi, T. Fordell, and A. E. Wallin, “High-accuracy determination of Paul-trap stability parameters for electric-quadrupole-shift prediction,” J. Appl. Phys., vol. 132, no. 12, p. 124401, Sep. 2022. doi: 10.1063/5.0106633.
- [3] F. G. Major, V. N. Gheorghe, and G. Werth, Charged Particle Traps. Berlin/Heidelberg: Springer-Verlag, 2005. doi: 10.1007/b137836.
- [4] D. Leibfried, R. Blatt, C. Monroe, and D. Wineland, “Quantum dynamics of single trapped ions,” Rev. Mod. Phys., vol. 75, no. 1, pp. 281–324, Mar. 2003. doi: 10.1103/RevModPhys.75.281.
- [5] J. Schmidt et al., “Mass-selective removal of ions from Paul traps using parametric excitation,” Appl. Phys. B, vol. 126, p. 176, 2020. doi: 10.1007/s00340-020-07491-8.
- [6] D. Podolsky, E. Shimshoni, G. Morigi, and S. Fishman, “Buckling transitions and clock order of two-dimensional Coulomb crystals,” Phys. Rev. X, vol. 6, p. 031025, 2016. doi: 10.1103/PhysRevX.6.031025.
Supplementary video 1: five_ions_hysteresis.mp4
This is a real-time video of the 5-ion cluster, capturing the full range of hysteresis in a single voltage ramp. During the upward ramp, the apex pyramidal ion pops out of the plane at . During the downward ramp, it goes back into the plane at a much higher value of .
Supplementary video 2: five_ions_nucleation.mp4
This is a real-time video of the 5-ion cluster, capturing a fast nucleation event from the metastable pyramid to the stable pentagon. During the upward ramp, the apex pyramidal ion pops out of the plane at . During the downward ramp, it goes back into the plane at .
Supplementary video 3: six_ions_switch.mp4
This is a real-time video of the 6-ion cluster switching between pyramidal and bi-pyramidal configurations. The plot in Fig. 3 is obtained from this video.