Discovery and characterization of 25 new quasars at from wide-field multi-band surveys
Luminous quasars at provide key insights into the early Universe. Their rarity necessitates wide-field multi-band surveys to efficiently separate them from the main astrophysical contaminants (i.e., ultracool dwarfs). To expand the sample of high- quasars, we conducted targeted selections using optical, infrared, and radio surveys, complemented by literature-based quasar candidate catalogs. In this paper, we report the discovery of 25 new quasars at (six at ), with between 25.4 and 27.0. We also present new spectra of six quasars we selected, but whose independent discovery has already been published in the literature. Three of the newly discovered quasars are strong radio emitters (L1034 erg s-1 Hz-1). Among them, one source at exhibits typical blazar-like properties, including a flat radio spectrum, radio-loudness 1000, and multi-frequency variability. It is also detected by SRG/eROSITA X-ray telescope (f erg s-1 cm-2). In addition, for seven quasars we present near-infrared spectroscopy and estimate the central black hole mass from their C and Mg broad emission lines. Their masses (log[MBH,MgII]) and Eddington ratios () are consistent with other z6 quasars reported in the literature. A quasar exhibits a velocity difference of approximately km s-1 between the C and Mg emission lines, making it one of the most extreme C outflows currently known. Additionally, the sample includes three high-ionization broad absorption line quasars. One of these quasars shows potential evidence of an extremely fast outflow feature, reaching km s-1.
Key Words.:
galaxies:active – galaxies:high-redshift – galaxies:jets – quasars:supermassive black holes1 Introduction
Quasars are among the most luminous, non-transient sources in the sky.
They can be studied at large cosmological look-back times across the entire electromagnetic spectrum—with the current records at (0.7 Gyr after the Big Bang, e.g., Bañados et al. 2018; Yang et al. 2020a; Wang et al. 2021b).
The evolution of the quasar population across cosmic time provides critical insights into the co-evolution of supermassive black holes (SMBHs) and their host galaxies.
In particular, high- quasars reveal both the rapid growth mechanisms of the first SMBHs (e.g., Wang et al. 2021b) and the early development of their galactic hosts (e.g., Neeleman et al. 2021; Wang et al. 2024).
Moreover, they provide key information on the chemical composition and metal enrichment of the intergalactic medium through intervening absorbers (e.g., Becker et al. 2015; Davies et al. 2023), while also highlighting the densest cosmic environments (e.g., Mignoli et al. 2020; Pudoka et al. 2024; Lambert et al. 2024) and they play a crucial role in our understanding of how active galaxies drive the cosmic re-ionization process (e.g., Fan et al. 2023, for a recent review).
In the past two decades, the exploitation of several optical and near-infrared (NIR) wide-area surveys, mostly covering the northern hemisphere, such as the Sloan Digital Sky Survey (SDSS, York et al. 2000) and the Panoramic Survey Telescope and Rapid Response System (Pan-STARRS1, PS1, Chambers et al. 2016) have enabled a drastic increase in the number of quasars discovered at (e.g., Shen et al. 2011; Bañados et al. 2016, 2023; Jiang et al. 2016; Wang et al. 2016; Caccianiga et al. 2019; Gloudemans et al. 2022; Belladitta et al. 2020, 2023).
The availability of recently released large-area sky surveys covering large fractions of the southern sky, such as the Dark Energy Survey (DES, Flaugher 2005; Abbott et al. 2018), the DESI Legacy Survey (DELS; Dey et al. 2019) and the SkyMapper (Keller et al. 2007) has made the discovery of high- quasars in the southern hemisphere possible (e.g., Reed et al. 2017; Pons et al. 2019; Belladitta et al. 2019; Wolf et al. 2020; Onken et al. 2022; Yang et al. 2023; Ighina et al. 2023).
The two most luminous high- quasars discovered so far have been identified in the southern sky.
These are SMSS J215728.21360215.1 at =4.75 (Wolf et al. 2018) and SMSS J052915.80435152.0, at =3.98 (Wolf C. et al. 2024).
They have bolometric luminosities greater than 1048 erg s-1 and -band magnitudes (AB system) in the Skymapper database of 17.11 and 16.04, respectively.
Most of the high- quasars discovered so far were selected using the Lyman-break technique (i.e., the dropout method, Steidel et al. 1996).
Indeed, color-color selection techniques, which rely on multiwavelength broadband observations, are among the most commonly used methods to find high- quasars.
The quasar flux at wavelengths shorter than the Ly emission line (at rest-frame = 1215.67 Å) is absorbed by the intervening neutral medium, causing an extremely red or color if the source is at 5 (-dropouts) or at 6 (-dropouts), respectively.
Recently, however, new selection methods based on machine learning techniques have led to the discovery of new high- quasars even in surveys that have been widely explored in the past (e.g., Wenzl et al. 2021; Yang et al. 2024; Byrne et al. 2024, see also Calderone et al. 2024 for machine learning quasars selection at ).
Main results emerging from the discovery of all these high- quasars include: i) extremely massive black holes (108-9M⊙) are observed in their centers (e.g., Farina et al. 2022; Mazzucchelli et al. 2023), comparable to the most massive black holes at any redshift, placing important constraints on the nature and growth of primordial black hole seeds (e.g., Inayoshi et al. 2020); ii) they are found in gas-rich, massive, and highly star-forming host galaxies (e.g., Decarli et al. 2018; Neeleman et al. 2021; Wang et al. 2024); iii) no significant redshift evolution for either broad UV emission lines or quasar continuum has been found (e.g., Shen et al. 2019; Schindler et al. 2020; Yang et al. 2021; Jiang et al. 2024; D’Odorico et al. 2023);
however, notable blueshifts have been identified in the C1549 broad emission line (BEL), with shifts reaching up to 5000 km s-1. These blueshifts are significantly larger than those observed in lower redshift quasars, suggesting an evolution in quasar outflow properties over cosmic time (e.g., Meyer et al. 2019).
iv) 10-15% of these sources show a strong radio emission (e.g., Bañados et al. 2015; Liu et al. 2021; Gloudemans et al. 2021; Keller et al. 2024), i.e., they are classified as radio-loud (or jetted) Active Galactic Nuclei (AGN)111A source is considered to be radio-loud when the radio loudness (R) is 10, with R defined as the ratio of the 5 GHz and 4400Å rest-frame flux densities: (Kellermann et al. 1989). The origin of the radio emission in radio-loud quasars is synchrotron radiation, which is produced by charged particles accelerated and collimated relativistically in a strong magnetic field, mostly along bipolar jets emitted from the central SMBH (e.g., Bridle & Perley 1984; Zensus 1997)..
High- radio-loud quasars are indispensable tools for studying the early evolutionary stage of the first jetted SMBHs (e.g., Momjian et al. 2021), their feedback on the host galaxy and the environment (e.g., Hardcastle & Croston 2020; Khusanova et al. 2022; Mazzucchelli et al. 2025), and their contribution to the reionization epoch (e.g., Torres-Albà et al. 2020).
Although the James Webb Space Telescope (JWST) has now spectroscopically confirmed more than 2000 galaxies (e.g., Curtis-Lake et al. 2023; Roberts-Borsani et al. 2024; Heintz et al. 2025; D’Eugenio et al. 2025) and more than 100 UV-faint AGN (with bolometric luminosity around 1041-44 erg s-1) at (e.g., Harikane et al. 2023; Greene et al. 2024; Maiolino et al. 2024a, b; Taylor et al. 2024), high redshifts quasars–being significantly more luminous than typical galaxies–serve as unparalleled tools for probing key properties of the Universe within its first billion years (e.g., Fan et al. 2023).
To expand the population of high- quasars, we combine optical, infrared (IR), and radio photometric data sets to identify them throughout the sky.
In addition, we present spectroscopic follow-up observations of high- quasar candidates available in published catalogs.
The paper is structured as follows: in Sect. 2, we describe the several selections performed to identify high- radio-loud and radio-quiet quasar candidates; in Sect. 3, we present the spectroscopic and photometric follow-up campaigns together with information about the data reduction.
Results from these campaigns are described in Sec. 4, while in Sect. 4.1, we provide details and properties of some of the quasars presented in this work.
Black hole mass estimates for a sub-sample of the quasars are reported in Sect. 5.2.
Finally, we summarize the work in Sect. 6.
The magnitudes reported in this work are all in the AB system (unless otherwise specified) and, when listed in the tables of the manuscript, have also been corrected for Galactic extinction using the extinction law provided by Fitzpatrick (1999), with RV = 3.1.
We used a flat cold dark matter (CDM) cosmology with H0 = 70 km s-1 Mpc-1, , and .
Radio spectral indices are given assuming S.
All uncertainties are reported at 1.
2 Candidates selection
We identified the quasar candidates for further spectroscopic follow-up campaigns using several selection methods, as described below.
2.1 [RPS1AW] Radio/PS1/AllWISE selection of Belladitta et al. (2023)
The target PSO J20013 was selected as an -dropout blazar candidate following the selection of Belladitta et al. (2023). We refer to this selection with the acronym RPS1AW. For completeness, here we report a brief summary of the selection steps. We require detections in the NRAO VLA Sky Survey (NVSS, Condon et al. 1998) in the radio, PS1 in the optical, and the AllWISE Source Catalog (Wright et al. 2010; Mainzer et al. 2011) in the mid-infrared (MIR). From the entire NVSS catalog, we selected bright (S1.4GHz 30 mJy) and compact objects to ensure a radio position accuracy better than . We then cross-matched these sources with the PS1 catalog using a maximum separation equal to . This impact parameter guarantees the recovery of more than 90% of the real optical counterparts (Condon et al. 1998). We selected sources with outside the Galactic plane (—b— 20∘) to minimize contamination from stars, and at Dec to exclude optical false objects close to the declination limit of the Pan-STARRS survey. We additionally imposed the following criteria: (i) no detection in -band; ii) drop-out: 1.2; iii) blue continuum: 0.5; iv) point-like sources: 0.05; and v) no detection in WISE (W2) or - 5. This last constraint has been placed to minimize the contamination by dust-reddened AGN at (e.g., Caccianiga et al. 2019; Carnall et al. 2015). After applying these filters, 14 candidates remained; 5 of them are known radio quasars at (Belladitta et al. 2023 and reference therein). PSO J20013 was prioritized for spectroscopic follow-up, given its large 1.6 color and strong radio emission (S 35 mJy). PS1 and WISE magnitudes of this object are reported in Table 7, together with NIR detections found in the VISTA Hemisphere Survey (VHS, McMahon et al. 2013) DR6 catalog.
2.2 [PS1B23] PS1 -dropout selection of Bañados et al. (2023)
The quasars PSO J14321 and PSO J27338 were recovered from the PS1 dropout selection described in Bañados et al. (2023), requiring (see their Section 2.1). We use PS1B23 to allude to this selection.
The main selection criteria are summarized here.
We selected compact sources by requiring an absolute difference between the aperture and PSF magnitudes to be less than 0.3 in the or bands. Furthermore, we requested i) no detection in , i.e., S/N; ii) drop-out: 2.0 or 2.0, where is the limiting magnitude for sources undetected in the band; iii) S/N(), S/N() and S/N() or .
We then performed our own forced photometry in both the stacked and single-epoch PS1 images (see Sections 2.2 and 2.3 in Bañados et al. 2014), and we finally visually inspected the stacked and single-epoch images to remove remaining obviously poor candidates and artifacts.
The PS1 magnitudes for PSO J14321 and PSO J273+38 are shown in Table 7.
For PSO J14321 we also list the and band measurements from VHS DR6.
For PSO J273+38 we report the and band magnitudes from the UKIRT Hemisphere Survey (UHS, Dye et al. 2018) DR2, together with CatWISE2020 (Eisenhardt et al. 2020; Marocco et al. 2021) W1 and W2 magnitudes.
2.3 [DELS+PS1] quasar candidates from DELS and PS1
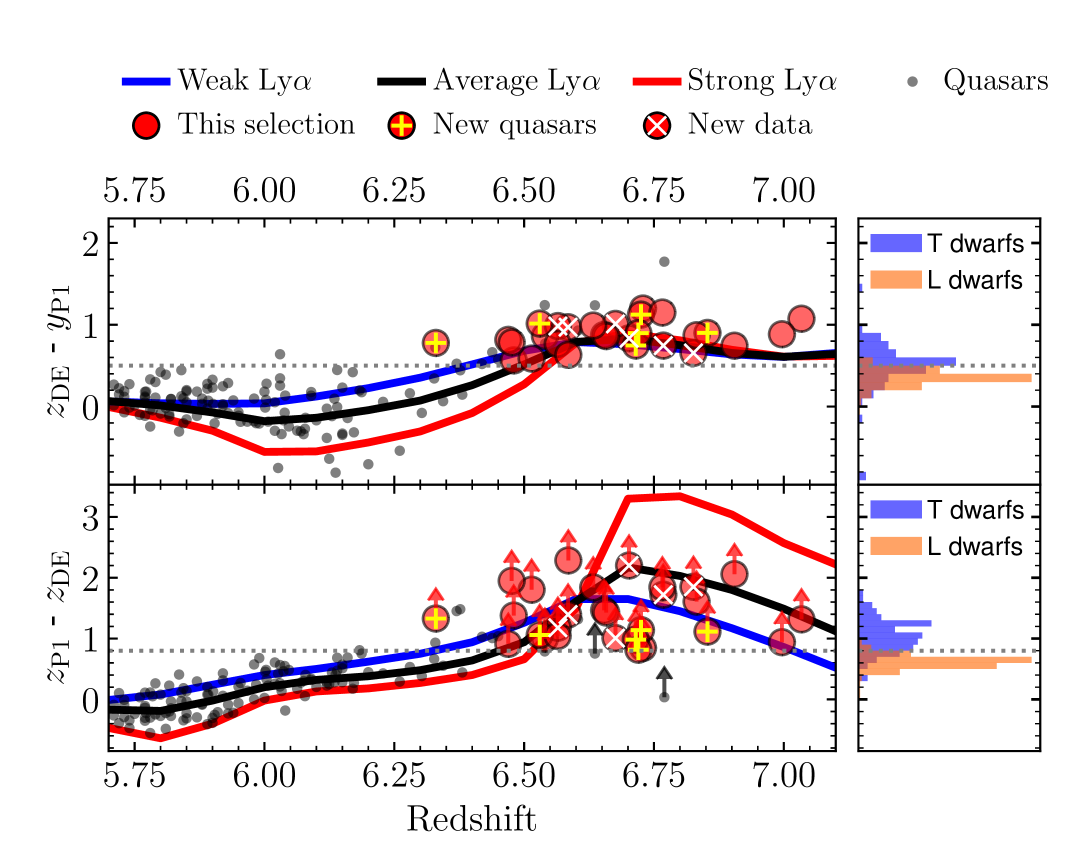
We developed a selection aiming at quasars combining PS1 and DELS, taking advantage of the different transmission of the and filters.
Given the sharp break in flux at Å for quasars, which is caused by absorption from intervening neutral Hydrogen, these quasars are largely undetected in the -band. However, they are still strongly detected in the -band and filters.
Fig. 1 shows how effective the and colors can identify quasars, and at slightly lower redshifts if they have weak emission lines.
On the other hand, given the smoother decline in the flux of L/T dwarfs (i.e., the main astrophysical contaminants in quasar candidates selection), they are much more likely to be detected in the -band.
We excluded sources with bad or low-quality detections in the band using the same quality flags described in Table 6 of Bañados et al. (2014). We also excluded objects flagged in the band (anymask and allmask not equal to 0).
We did not consider sources with high Galactic extinction .
We required S/N in both and bands and non-detections (S/N) in all the other filters from both PS1 and DELS. Then, the color criteria are i) and ii) (Fig. 1). We crossmatched the L and T dwarfs compiled in Bañados et al. (2016) with DELS within s 2″ radius, and show their colors in the right panels of Fig. 1. After applying the two color criteria from this selection, we remove 96% of the L dwarfs and 91% of the T dwarfs.
When we started this selection process, only a handful of quasars were known to meet our criteria (e.g., Venemans et al. 2015; Mazzucchelli et al. 2017). In addition, some of our candidates were independently identified by other works (e.g., Pons et al. 2019; Wang et al. 2019).
Here we present the discovery of six new quasars from our selection: PSO J01606, PSO J03708, PSO J04106, PSO J06714, PSO J21704 and PSO J28950. These quasars have redshifts ranging from 6.3 to 6.9.
Additionally, 22 other quasars that meet our criteria have been published in the literature, with redshifts between 6.4 and 7.0 (Venemans et al. 2015; Mazzucchelli et al. 2017; Wang et al. 2017, 2018, 2019; Pons et al. 2019; Bañados et al. 2021, 2025; Yang et al. 2021).
We present either independent discoveries or follow-up near-infrared (NIR) spectra (and, in two cases, follow-up NIR photometry) for six quasars already published in the literature:
PSO J06209,
PSO J12741, PSO J12949,
PSO J16429, PSO J16201, and PSO J35421.
The coordinates and photometry of the six new quasars presented in this work, along with the six previously known quasars that have new spectra, are reported in Table 8.
In Fig. 1, the new quasars are indicated by red circles with crosses, while the known quasars are shown with red circles featuring an “x.”
Additionally, 16 other quasars meet our selection criteria (red circles in Fig. 1); their coordinates and photometry are provided in Table 9.
2.4 [PS1/AllWISE] quasar candidates from PS1 and AllWISE
PSO J33515 was selected from the Pan-STARRS1 and ALLWISE catalogs. The main steps are as follows: S/N()7 and S/N()3 or S/N()3; compactness: requiring the absolute difference between the aperture and PSF magnitudes in band to be less than 0.3; dropout: 1.5 and S/N()3 or S/N()5. Then, forced photometry was performed on the PS1 five-band images with SExtractor (Bertin & Arnouts 1996) and required that the forced magnitudes also satisfy the aforementioned criteria. We then performed an SED fitting analysis of the initially selected -dropout quasar candidates using optical, NIR, and ALLWISE photometry. The quasar SED models have a single power-law shape with broad emission lines. The slope index and emission line equivalent widths are based on a composite spectrum of low-redshift quasars (Vanden Berk et al. 2001; Selsing et al. 2016) with some scatter. These templates are redshifted with a step of from =5 to 8 with IGM absorption taken into account at each redshift (Madau 1995). The brown dwarf SED templates are based on BT-Settl model (Allard et al. 2012), for which we only consider their Solar metallicity models with effective temperatures 400 K to 6000 K. We apply these quasar and brown dwarf SED templates to find the best-fit SED solutions based on chi-square minimization to rank the candidates for follow-up spectroscopy. As a final step, we did a visual inspection of all the targets to remove artifacts. PSO J33515 has a red color without significant detection in bluer PS1 filters. Moreover, the public VHS J-band photometry implies a flat color, which is consistent with a quasar SED model at .
2.5 [DVCW] DES/VHS/CatWISE2020 -dropout selection of Wolf J. et al. (2024)
The target PSO J06065 has been selected combining optical data from DES, NIR, MIR photometry from the VHS DR5 and CatWISE2020 (DVCW acronym in the last column of Table 2). The selection steps are described in details in Wolf J. et al. (2024). Here, we summarize the main steps. First, a series of photometric cuts were imposed on the g,r,i,z,y Kron magnitude (mag_auto) of the catalog: S/N()10, S/N()5 and S/N()3; mag_auto_i mag_auto_z 0.8 and mag_auto_z mag_auto_y 0.12 and mag_auto_r 22.5 or mag_auto_i mag_auto_z 2.2 and magerr_auto_r 0.36. Then we adopted as a main filtering step a SED template fitting and photometric redshift computation using the code Le PHARE (v2.2, Arnouts & Ilbert 2011), supplemented with a custom template library for AGN and galaxies (see Sect. 2.1.2 of Wolf J. et al. (2024)). Then, we further extracted forced photometry on optical DES images of the candidates to identify artifacts and problematic blue-band PSF-matched photometry. We discarded candidates for which we measure a significant aperture flux in the -band (i.e., with errors on -band aperture magnitudes ap_magerr_g ¿ 0.36 when a positive g-band flux is measured). PSO J06065 and other 5 sources, published in Wolf J. et al. (2024), resulted to be among the best candidates from this selection. PSO J06065 photometric properties are reported in Table 7.
2.6 [MQC] Radio candidates from the Million Quasar catalog of Flesch (2023)
The Million Quasars Catalogue (MQC222http://quasars.org/milliquas.htm) has been available since its inception in 2009.
It has collected the discoveries of quasars at all redshifts published in the literature over the years.
In addition, the catalog also provides radio and X-ray information on the included sources (Flesch 2023).
Approximately 76% of the objects have spectroscopic redshifts, and their spectra can be found in the literature.
However, only photometric redshifts are available for the remaining sources. Thus, a spectroscopic follow-up is necessary to determine the true nature of these objects.
From MQC v8 (Flesch 2023), we selected only objects with radio detection and with a photometric redshift larger than 4, resulting in 218 objects.
We specifically focused on radio-detected targets to reduce contamination from ultracool dwarfs.
We removed 10 candidates (see Table 10) based on a cross-match with SIMBAD333http://simbad.cds.unistra.fr/simbad/ and with SDSS DR18 (Almeida et al. 2023).
We conducted a visual inspection using optical PS1 images and NIR images from VHS, UHS and the VISTA Kilo-Degree Infrared Galaxy Survey (VIKING, Edge et al. 2013). We discarded 114 sources detected in the band, which are likely at a lower redshift.
The remaining 97 catalog objects are good dropout (at ) and dropout (with redshift between 4.5 and 5.5) candidates.
In this paper, we present the spectroscopic confirmation of two quasars from this catalog: MQC J02119 and MQC J13302, indicated as MQC in Table 2).
Their photometry is reported in Table 7.
2.7 [YS23] Candidates from the DES survey of Yang & Shen (2023)
Yang & Shen (2023, hereafter YS23) provide a catalog of 1.4 million photometrically selected quasar candidates from DES, cross-matched with available NIR and unWISE MIR photometry (Schlafly et al. 2019).
From the YS23 catalog, we selected only objects with a probability of being a quasar larger than 98% and a photometric redshift greater than 5.
This resulted in a list of 134 sources.
After a visual inspection of all optical images from DES and DELS, and NIR images from VHS, we discarded five sources (see Table 11).
Then, we cross-matched the list of targets with the literature and we found 27 objects already published as high- quasars (McGreer et al. 2013; Venemans et al. 2013; Reed et al. 2015; Menzel et al. 2016; Wang et al. 2016; Yang et al. 2016; Reed et al. 2017; Bañados et al. 2014, 2016, 2023; Ighina et al. 2023; Yang et al. 2024).
Thus, the remaining quasar candidates are 102.
In this paper we report the spectroscopic confirmation of twelve new quasars from this list of candidates, they are marked as YS23 in the last column of Table 2.
Their photometric properties are detailed in Table 7. Additionally, we provide information about these twelve quasars directly from the YS23 catalog, including their ID, photometric redshift, and quasar probability.
3 Follow-up observations
In this section we describe both the dedicated NIR photometric observations and the spectroscopic campaign for all the sources listed in Tables 7 and 8.
3.1 NIR Photometry
We obtained NIR follow-up images of all six new quasars discovered by the DELS+PS1 selection, and for the quasars PSO J06209, PSO J16201, and PSO J35421 (see Table 8 and Sect. 2.3). We also obtained NIR observations for the new quasar PSO J33515 from the PS1/ALLWISE selection (see Table 7 and Sect. 2.4). The imaging follow-up was performed ouwith the , and filters. The observations have been carried out with the Son OF ISAAC (SofI, Moorwood et al. 1998) instrument mounted on the NTT at La Silla Observatory and the Nordic Optical Telescope near-infrared Camera (NOTCam444https://www.not.iac.es/instruments/notcam/) mounted on the Nordic Optical Telescope at the Roque de Los Muchachos Observatory. A summary of these NIR observations is reported in Table 1. A standard data reduction was performed with IRAF (Image Reduction and Analysis Facility, Tody 1993). We obtained the zero points following standard procedures (e.g., see Section 2.6 in Bañados et al. 2014 or Section 3.3 in D’Odorico et al. 2023). We also list photometry of the NIR surveys VHS, UHS, and VIKING in Tables 7 and 8.
| Quasar name | Telescope/ Instrument | Filter | Obs. date | Texp |
|---|---|---|---|---|
| (1) | (2) | (3) | (4) | (5) |
| PSO J01606 | NTT/SofI | 2018 Dec. 23 | 5 | |
| NTT/SofI | 2020 Nov. 18 | 15 | ||
| NTT/SofI | 2020 Nov. 18 | 15 | ||
| PSO J03708 | NTT/SofI | 2021 July 27 | 15 | |
| PSO J04106 | NTT/SofI | 2020 Nov. 20 | 15 | |
| PSO J06209 | NTT/SofI | 2021 July 27 | 30 | |
| PSO J06714 | NTT/SofI | 2021 July 27 | 15 | |
| NTT/SofI | 2023 Jan. 04 | 16 | ||
| NTT/SofI | 2023 Jan. 04 | 10 | ||
| PSO J16201 | NTT/SofI | 2021 July 27 | 15 | |
| NTT/SofI | 2019 Dec. 15 | 15 | ||
| PSO J21704 | NTT/SofI | 2020 Feb. 06 | 30 | |
| PSO J28950 | NOT/NOTCam | 2020 July 10 | 27 | |
| NOT/NOTCam | 2020 July 10 | 18 | ||
| PSO J33515 | NTT/SofI | 2021 July 28 | 5 | |
| PSO J35421 | NOT/NOTCam | 2019 May 19 | 27 | |
| NOT/NOTCam | 2019 May 19 | 18 |
3.2 Spectroscopy
The spectroscopic follow-up was carried out over different observing runs and different instruments: EFOSC2 (Buzzoni et al. 1984) at the New Technology Telescope (NTT) located at the Observatory of La Silla, the Folded-port Infrared Echellete (FIRE; Simcoe et al. 2008, 2013) spectrometer at the Magellan/Baade telescope and the Low Dispersion Survey Spectrograph (LDSS3, Boutsia et al. 2017) at the Magellan/Clay telescope both
at Las Campanas Observatory, the near-infrared spectrograph at Gemini North (GNIRS; Elias et al. 2006b, a), the Multi-object Double Spectrograph (MODS; Pogge et al. 2010) and the LBT Utility Camera in the Infrared (LUCI; Seifert et al. 2003) at the Large Binocular Telescope (LBT), the FOcal Reducer/low dispersion Spectrograph 2 (FORS2;
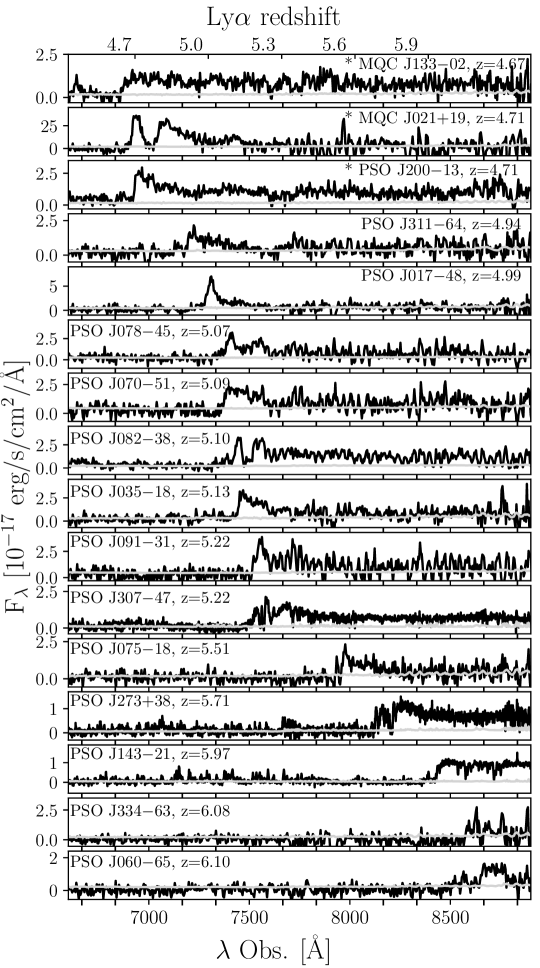
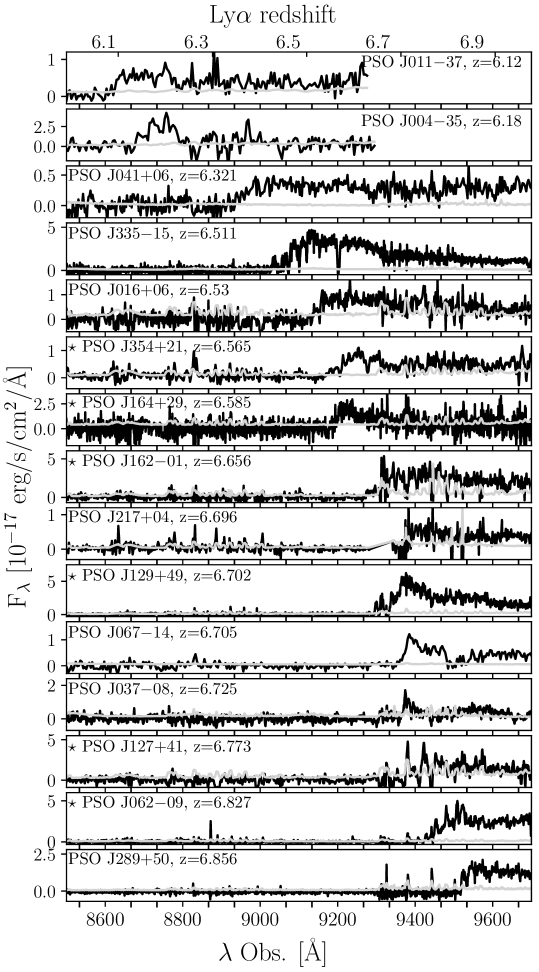
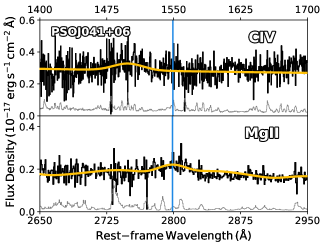
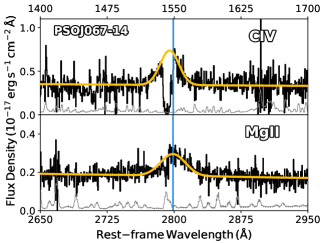
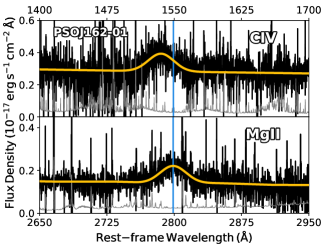
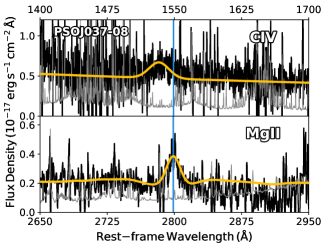
Appenzeller & Rupprecht 1992) at the Very Large Telescope (VLT) and the Near-Infrared Echellette Spectrometer (NIRES; Wilson et al. 2004) mounted on the Keck 2 telescope located at W. M. Keck Observatory. The details of the spectroscopic observations are summarized in Table 2 , while spectra covering the Lyman-alpha break are shown in Fig. 2.
In Fig. 3 we plot the NIR spectra obtained for a subsample of sources.
Both LBT/MODS and LBT/LUCI observations have been carried out in binocular mode (red grating for MODS and G200 grating coupled with + filters for LUCI), except for PSO J12741 that was observed in monocular mode.
All NTT/EFOSC2 observations were conducted using Grism (5200–9350), except for quasars PSO J00435, PSO J01137, PSO J33463 for which Grism (6015–10320) was used.
However, the resulting spectra taken with Grism of PSO J01748, PSO J03518 and PSO J07518 showed wiggles in the flux, due to fringing effects in the red part of the EFOSC2 detector combined with the Grism .
Therefore, these three objects were observed again with Grism , and the spectra shown in Fig. 2 are the ones resulting from this last data analysis.
The targets PSO J14321 and PSO J30747 were recently re-observed with Magellan/LDSS3 because their NTT/EFOSC2 spectra was very noisy.
Both observations are reported in the Table 2, but we highlight that the redshift is derived only from the best spectrum (Magellan/LDSS3)666The redshift obtained from the fit of the Magellan/LDSS3 spectra are consistent with the measurement previously obtained from the NTT/EFOSC2 spectra. and that only the latter is shown in Figure 2.
All the spectra were reduced using standard routines, including bias subtraction, flat fielding, sky subtraction, wavelength calibration using exposures of arc lamps and flux calibration using exposures of spectrophotometric standard stars.
The spectra were absolute flux calibrated to match the band (for all the sources at 6) or one of the NIR magnitudes (mostly band) depending on their redshift.
We used the following reduction pipelines: FIREHOSE777https://wikis.mit.edu/confluence/display/FIRE/FIRE+Data+Reduction, PypeIt888https://pypeit.readthedocs.io (Prochaska et al. 2020) and SIPGI999https://pandora.lambrate.inaf.it/sipgi/ (Gargiulo et al. 2022).
Section 2.4 in Onorato et al. (2025) describes the coadding procedure of the LBT/MODS and Keck/NIRES spectra of PSO J28950 and of the LBT/MODS+LUCI spectra of PSO J21704.
The coadd is done after the flux calibration procedure using directly the multi_combspec routine of PypeIt, to get a final spectrum covering [8000, 24700]Å / [8000,23900]Å with pixel size of 40 km s-1 / 58 km s-1 for PSO J28950 and PSO J21704, respectively.
For PSO J06209, PSO J12741, PSO J12949, PSO J16201 and PSO J35421 we report for the first time unpublished spectra obtained at Magellan, LBT and VLT.
The details on these observations are listed in Table 2 and the spectra are shown in Fig. 2.
In Fig. 3 we also report the Magellan/FIRE unpublished NIR follow-up of PSO J16201.
| Quasar | Telescope/ | Obs. Date | Exp | Selection | -method | |||
| Name | Instrument | Time (s) | ||||||
| (1) | (2) | (3) | (4) | (5) | (6) | (7) | (8) | (9) |
| New discoveries | ||||||||
| PSO J00435 | NTT/EFOSC2 | 2024/10/26 | 4200 | YS23 | 6.18 | template (on25) | 20.99 | 25.74 |
| PSO J01137 | NTT/EFOSC2 | 2024/10/26 | 4200 | YS23 | 6.12 | template (xqr-30) | 20.72 | 26.01 |
| PSO J01606 | VLT/FORS2 | 2020/11/09 | 1800 | DELSPS1 | 6.53 | template (xqr-30) | 20.98 | 25.89 |
| PSO J01748 | NTT/EFOSC2 | 2024/01/25 2024/10/27 | 3600 3600 | YS23 | 4.99 | template (on25) | 20.70 | 25.69 |
| MQC J02119r | NTT/EFOSC2 | 2023/11/30 | 3600 | MQC | 4.71 | template (strong-Ly) | 20.24 | 26.05 |
| PSO J03518 | NTT/EFOSC2 | 2024/01/26 2024/10/27 | 3600 5400 | YS23 | 5.13 | template (weak-Ly) | 20.41 | 26.02 |
| PSO J03708 | Magellan/FIRE | 2018/12/31 2019/01/13 | 700 7200 | DELSPS1 | 6.7250.002 | Mg | 20.61 | 26.26 |
| PSO J04106 | Gemini/GNIRS | 2019/01/12 | 8400 | DELSPS1 | 6.3210.002 | Mg | 20.87 | 25.91 |
| PSO J06065 | NTT/EFOSC2 | 2024/01/24 | 3600 | DVCW | 6.10 | template (xqr-30) | 20.71 | 26.01 |
| PSO J06714 | Gemini/GNIRS | 2019/01/12 + /02/03-06-09 | 12000 | DELSPS1 | 6.7050.002 | Mg | 20.89 | 25.99 |
| PSO J07051 | NTT/EFOSC2 | 2023/12/01 | 7200 | YS23 | 5.09 | template (xqr-30) | 20.55 | 25.87 |
| PSO J07518 | NTT/EFOSC2 | 2023/11/29 2024/10/27 | 5400 1800 | YS23 | 5.51 | template (weak-Ly) | 20.97 | 25.58 |
| PSO J07845 | NTT/EFOSC2 | 2023/11/30 | 3600 | YS23 | 5.08 | template (on25) | 20.86 | 25.56 |
| PSO J08238 | NTT/EFOSC2 | 2023/11/29 | 3600 | YS23 | 5.10 | template (xqr-30) | 20.12 | 26.30 |
| PSO J09131 | NTT/EFOSC2 | 2023/11/29 | 3600 | YS23 | 5.22 | template (strong-Ly) | 20.41 | 26.06 |
| MQC J13302r | NTT/EFOSC2 | 2022/12/27 | 5400 | MQC | 4.67 | template (on25) | 20.80 | 25.48 |
| PSO J14321 | NTT/EFOSC2 | 2022/12/26 | 3600 | PS1B23 | 5.97 | template (xqr-30) | 20.55 | 26.13 |
| Magellan/LDSS3 | 2025/05/01 | 1800 | ||||||
| PSO J20013r | NTT/EFOSC2 | 2022/02/05 | 4300 | RPS1AW | 4.71 | template (xqr-30) | 20.48 | 25.82 |
| PSO J21704 | Magellan/FIRE | 2023/05/19 | 900 | DELSPS1 | 6.6960.002 | Mg | 21.11 | 25.76 |
| LBT/MODSLUCI | 2023/06/07 + /06/13 | 7200 13800 | ||||||
| PSO J27338 | LBT/MODS | 2023/06/10 | 1200 | PS1B23 | 5.71 | template (xqr-30) | 20.87 | 25.73 |
| PSO J28950 | LBT/MODS | 2019/10/07 | 4800 | DELSPS1 | 6.8560.002 | Mg | 20.70 | 26.21 |
| Keck/NIRES | 2020/09/07 | 11520 | ||||||
| PSO J30747 | NTT/EFOSC2 | 2024/10/28 | 4200 | YS23 | 5.22 | template (on25) | 20.92 | 25.54 |
| Magellan/LDSS3 | 2025/05/01 | 1200 | ||||||
| PSO J31164 | NTT/EFOSC2 | 2024/10/27 | 3600 | YS23 | 4.94 | template (xqr-30) | 21.01 | 25.37 |
| PSO J33463 | NTT/EFOSC2 | 2024/10/27 | 5400 | YS23 | 6.08 | template (xqr-30) | 20.89 | 25.82 |
| PSO J33515 | Magellan/FIRE | 2019/05/09 | 18000 | PS1/AllWISE | 6.5110.001 | Mg | 19.85 | 26.98 |
| New spectra publication | ||||||||
| PSO J06209 | Magellan/LDSS3 | 2018/11/13 | 1200 | DELSPS1 | 6.8270.006 | Mg | 20.28 | 26.62 |
| PSO J12741 | LBT/MODS | 2018/10/05 | 3600 | DELSPS1 | 6.7730.007 | Mg | 20.52 | 26.36 |
| PSO J12949 | LBT/MODS | 2017/04/23 | 2040 | DELSPS1 | 6.7020.001 | Mg | 20.24 | 26.63 |
| PSO J16201 | VLT/FORS2 | 2016/02/16 | 5260 | DELSPS1 | 6.6560.001 | Mg | 21.03 | 25.83 |
| Magellan/FIRE | 2015/03/12 | 19508 | ||||||
| PSO J16429 | LBT/MODS | 2019/03/18 | 7200 | DELSPS1 | 6.5850.005 | Mg | 21.16 | 25.68 |
| PSO J35421 | LBT/MODS | 2020/10/23 | 1800 | DELSPS1 | 6.5650.009 | Mg | 21.18 | 25.66 |
4 New quasars at
We present the discovery of 25 new quasars111111In Appendix C.2, we report the objects that turned out to be not high- quasars after spectroscopic follow-up campaigns (73 in total). at ; three are radio-loud. To estimate the redshifts, we followed the procedure of Bañados et al. (2023): we fit the spectra of the quasars with different quasar templates, to account for differences in the emission lines properties, especially Ly. We use the following four templates:
-
1.
strong-Ly, which is the median of the 10% of the PS1 quasars spectra with the largest rest-frame equivalent width for the Ly+N emission line, from Bañados et al. (2016).
-
2.
weak-Ly, which is the median of the 10% of the PS1 quasars spectra with the smallest rest-frame equivalent width for Ly+N, from Bañados et al. (2016).
-
3.
xqr-30, which is the median of 42 high quality quasars spectra observed with X-Shooter and reported in D’Odorico et al. (2023).
-
4.
on25, which is the weighted mean of 33 spectra presented in Onorato et al. (2025).
Then, we choose the best-fitting template with the minimum chi-square in the 1212–1400 Å rest-frame wavelength range.
The results are reported in Table 2.
We consider 0.03 as the mean uncertainty on the redshift computed using the template method (with a maximum uncertainty of 0.05), as reported by Bañados et al. (2016, 2023).
For PSO J03708, PSO J04106, PSO J06714, PSO J33515, and PSO J28950 we use the redshift and the error estimated from the fit of the Mg broad emission line (see Sect. 5.2 for details).
For the already known quasars we listed the Mg-based redshift reported in Yang et al. (2021), while for PSO J16201 we estimate the Mg II redshift from the Magellan/FIRE spectrum published in this study.
The apparent and absolute magnitudes at rest-frame wavelength 1450Å (, ) are quantities commonly used to characterize the UV emission in quasars.
The apparent and absolute magnitude at 1450Å of the quasars PSO J03708, PSO J04106, PSO J06714, PSO J16201, PSO J21704,
PSO J28950 and PSO J33515 were derived directly from the fit of the spectra (described in Sect. 5).
In order to determine in a consistent way for all the objects with only a visible spectrum available, we followed the approach of, e.g., Bañados et al. (2016) and Mazzucchelli et al. (2017).
We assumed a power-law continuum slope = 0.44 (Vanden Berk et al. 2001).
Then we used the band magnitude ( Å for DES and 8700 Å for PS1) to extrapolate the .
The redshifts and magnitudes at 1450 Å are reported in Table 2.

4.1 Notes on individual sources
Here we present additional notes on selected objects, sorted by right ascension.
4.1.1 MQC J02119,
This quasar was selected from the MQC v8 as a candidate at .
The NTT/EFOSC2 discovery spectrum confirms its high- nature, placing it at a redshift of .
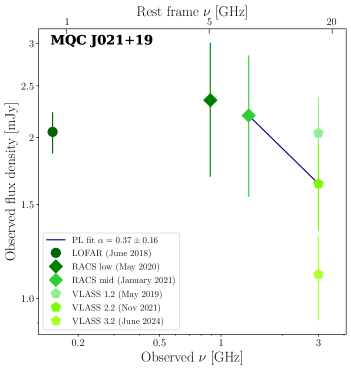
The MQC reports a radio detection in the LOw-Frequency ARray (LOFAR) Two-metre Sky Survey (LoTSS, Shimwell et al. 2022) at 150 MHz, in the Rapid ASKAP Continuum Survey (RACS, McConnell et al. 2020; Hale et al. 2021) at 888 MHz and at 3 GHz in the VLA Sky Survey (VLASS, Lacy et al. 2020).
We also found a detection at 1.37 GHz (RACS-MID) on the CASDA website121212https://data.csiro.au/?searchBy=sci-domain.
In Table 3 we listed the available integrated radio flux densities.
All these measurements have been quantified by performing a single Gaussian fit (since the source is unresolved) on the images, using the task IMFIT of the Common Astronomy Software Applications package (CASA, McMullin et al. 2007).
The source does not show clear signs of variability: the flux densities are all consistent within 1 and 2.
However, there may be a decrease in VLASS flux density at 3 GHz from 2019 and 2024.
Taking this potential decrease into account, to minimize possible variability issues, we used the radio data closest in time to compute the radio spectral index.
These are RACS_mid (1.367 GHz) and VLASS 2.2 (3 GHz).
By assuming a single power-law for the continuum radio emission (Sν ) we obtained = 0.370.16 (see Fig. 4, left panel).
Simultaneous radio data are necessary to assess the real shape of the radio spectral energy distribution.
Then, we computed the value of radio-loudness (R).
Coincidentally, 5 GHz in the rest frame corresponds to an observed frequency of 0.875 GHz, equal to RACS_low.
Therefore we used the RACS flux density and the estimated spectral index to compute the 5 GHz rest frame radio flux density.
The value of the flux density at 4400 Å rest frame was derived from the -band de-reddened PS1 magnitude assuming the optical spectral index of Vanden Berk et al. (2001, = 0.44).
We obtained R = 3818, where the error takes into account the uncertainties on the flux densities, on the radio spectral index, and on the redshift of the source.
From the NTT/EFOSC2 spectrum shown in Fig. 2 it is clear that there is an absorption blue-ward the N line.
This feature has a width of km s-1 and is likely associated with a N Broad Absorption Line (BAL, Weymann et al. 1991) outflow with a maximum velocity of km s-1.
A high S/N spectrum covering NIR wavelengths could confirm the presence of such an outflow in other atomic species (e.g., C, Si, Mg).
| Obs. Freq. | Sν | Survey | Resolution | Obs. date |
|---|---|---|---|---|
| (GHz) | (mJy) | (arcsec) | ||
| (1) | (2) | (3) | (4) | (5) |
| 0.150 | 2.050.18 | LOFAR | 6 | 2018-06-12 |
| 0.8875 | 2.350.66 | RACS low | 25 | 2020-05-02 |
| 1.3675 | 2.200.65 | RACS mid | 169 | 2021-01-01 |
| 3.0 | 2.040.34 | VLASS 1.2 | 2.5 | 2019-05-05 |
| 3.0 | 1.630.30 | VLASS 2.2 | 2.5 | 2021-11-07 |
| 3.0 | 1.100.20 | VLASS 3.2 | 2.5 | 2024-06-28 |
4.1.2 PSO J03708,
This quasar was discovered with a 700s spectrum with FIRE in longslit mode on Dec. 2018 and then a follow-up for 2 hours with FIRE in Echelle mode in Jan. 2019 (Table 2).
Here we only show the higher S/N and resolution Echelle spectrum in both Fig. 2 and 3.
The -band magnitude estimate from our follow-up with NTT/SofI (see Table 8) is consistent with the detection in the VHS DR6: 0.14.
We note that this quasar is part of the JWST ASPIRE program (Wang et al. 2021a) and its [CII] properties have been reported in Wang et al. (2024).
We used the Mg BEL to estimate its redshift: (see Table 2), which is consistent with the systemic redshift measured from the [CII] line (, Wang et al. 2024).
The difference between the two redshift values is
.
4.1.3 PSO J04106,
Figure 3 shows the Gemini/GNIRS spectrum of this source, covering from the Lyman break to the Mg broad emission line. The Mg is clearly detected and sets the redshift of this quasar at (see Table 2). This is the lowest redshift quasar confirmed from the selection presented in Sect. 2.3. Such a low redshift can be explained by a very weak Ly line (see Fig. 1), which could be intrinsic or due to a proximate absorber truncating the emission (e.g., Bañados et al. 2019). Conversely, the C is very weak, with an Equivalent Width (EW) (see more details in Sect. 5), making PSO J04106 a weak emission line quasar (WLQ; Fan et al. 1999; Diamond-Stanic et al. 2009). Furthermore, the C is blueshifted with respect to Mg, by 9000 km s-1, the largest ever measured in the early Universe (see Sect. 5.1 for caveats and discussion).
4.1.4 PSO J06714,
Similarly to PSO J03708, this quasar is part of the JWST ASPIRE program (Wang et al. 2021a) and
Wang et al. (2024) report the [CII] detection of PSO J06714, finding a redshift of .
The difference in km s-1 between the [CII]-based redshift and the one computed in this work from the Mg line (6.7050.002, see Table 2) is , which is in line with values estimated in quasars at similar redshift (e.g., Schindler et al. 2020; Yang et al. 2021).
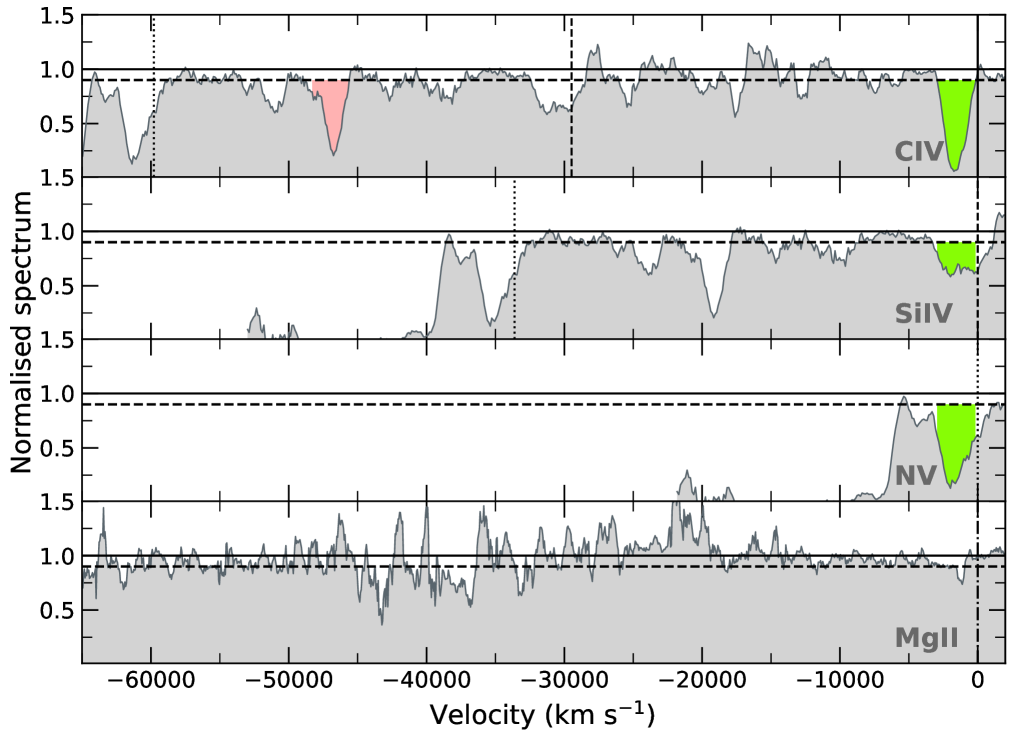
As several absorption features are clearly visible in the spectrum, we used the method adopted in Bischetti et al. (2022, 2023) to detect and characterize possible BAL outflows in this quasar.
The main steps include modeling the intrinsic quasar emission using a composite template spectrum that matches the continuum slope and equivalent width of the C emission line in PSO J06714.
The composite template is normalized to the median continuum flux in the wavelength range rest-frame 1650–1750 Å (according to the Mg redshift).
A normalized spectrum is obtained by dividing the spectrum of PSO J06714 by the composite template, as shown in Figure 5.
We detected an absorption feature blue-ward of C, tracing a BAL outflow with a width of km s-1, a maximum velocity of km s-1 and a balnicity index BI1600 km s-1, that is a modified equivalent width of the BAL absorption, calculated according to Eq. (1) in Bischetti et al. (2023), which follow the traditional BI definition of Weymann et al. (1991).
We consider that C optical depth is usually similar or larger than the Si depth in BAL quasars (e.g. Gibson et al. 2009; Dunn et al. 2012).
This allows us to use the velocity range of the C BAL troughs to identify absorption associated with Si and N as it has been done in the literature (e.g., Bruni et al. 2019; Bischetti et al. 2023). Indeed, we identify an associated Si and N absorption as highlighted in Figure 5.
We note an additional absorption feature at 1300 Å that might be interpreted as related to the CII Å transition, which would make PSO J as the second low-ionization broad absorption line (Lo-BAL) quasar identified at (Bischetti et al. 2023, 2024).
However, the lack of strong Mg absorption questions the above interpretation (see last panel of Fig. 5).
Alternatively, the 1300Å absorption feature might be associated with an extremely high-velocity ( km s-1, red line in Figure 5) C BAL outflow.
Similar velocities have been observed in other three quasars by Bischetti et al. (2022) and Wang et al. (2021b), but are rare (a few %) in SDSS BAL quasars at (e.g., Rodr´ıguez Hidalgo et al. 2020).
Finally, the spectrum of PSO J06714 reveals the presence of an absorption system at , traced by both the Mg and Fe transitions at 2374Å and 2382Å.
4.1.5 PSO J08238,
Similarly to MQC J02119, this spectrum shows potential evidence of absorption blue-ward of N. As this absorption has a width of km s-1, PSO J08238 likely hosts a N BAL outflow with a maximum velocity of 4200 km s-1. A higher S/N spectrum, also covering redder wavelengths, is necessary to confirm and properly characterize the BAL features also from other atomic species.
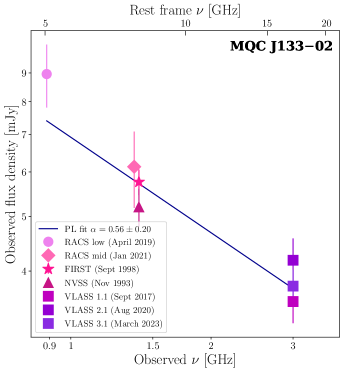
4.1.6 MQC J13302,
This source is reported in the MQC with a z.
However, given its detection in band, we considered that the photo- was overestimated.
Indeed, we measured from the NTT/EFOSC2 spectrum.
According to the MQC, MQC J13302 has a radio detection at 0.887 GHz in RACS and at 1.4 GHz in the Faint Images of the Radio Sky at Twenty-cm (FIRST, Becker et al. 1994) and in the NVSS.
We also retrieved the RACS-MID image at 1.37 GHz from CASDA.
On the RACS-MID image, we performed a single Gaussian fit using the CASA task IMFIT to quantify the flux density.
MQC J13302 is clearly detected at 3 GHz in the VLASS 1.1, 2.1 and 3.1 epoch images.
From a Gaussian fit performed in CASA we estimated the three radio flux densities.
MQC J13302 is also marginally detected (3) in the TIFR GMRT Sky Survey (TGSS, Intema et al. 2017) at 150 MHz, with a peak flux density of 11 mJy.
Table 4 summarizes the radio detections available for this quasar, while Figure 4 (central panel) shows the radio spectral energy distribution.
No significant variability is detected between FIRST and NVSS at 1.4 GHz and between the three VLASS epochs (all measurements are consistent within 1).
By assuming a single power-law for the continuum radio emission, we obtained a radio spectral index () between 0.8875 and 3.0 GHz of 0.560.20.
Then, we computed the values of radio-loudness as already done for MQC J02119.
Given that 5 GHz in the rest frame corresponds to a frequency of 0.880 GHz, we used the RACS flux density and the estimated spectral index to compute the 5 GHz rest frame radio flux density.
The value of the flux density at 4400 Å rest frame was derived from the -band de-reddened PS1 magnitude assuming the optical spectral index of Vanden Berk et al. (2001, = 0.44).
We obtained R = 280130, where the error takes into account the uncertainties on the flux densities, on the radio spectral index, and on the redshift of the source.
| Obs. Freq. | Sν | Survey | Resolution | Obs. date |
|---|---|---|---|---|
| (GHz) | (mJy) | (arcsec) | ||
| (1) | (2) | (3) | (4) | (5) |
| 0.150 | 11a | TGSS | 25 | 2016-03-15 |
| 0.8875 | 8.961.13 | RACS | 25 | 2019-04-29 |
| 1.3675 | 6.130.93 | RACS | 25 | 2021-01-18 |
| 1.4 | 5.20.4 | NVSS | 45 | 1993-11-15 |
| 1.4 | 5.760.30 | FIRST | 5 | Sept. 1998 |
| 3.0 | 3.530.30 | VLASS 1.1 | 2.5 | 2017-09-30 |
| 3.0 | 4.180.39 | VLASS 2.1 | 2.5 | 2020-08-16 |
| 3.0 | 3.760.26 | VLASS 3.1 | 2.5 | 2023-03-05 |
4.1.7 PSO J14321,
PSO J14321 was part of the candidates selected by Bañados et al. (2023), but its spectroscopic confirmation occurred after that publication was completed.
Therefore, it satisfied all the selection criteria reported in Sect. 2.2 of Bañados et al. (2023).
However, its color in the latest version of PS1 data release (DR2) is , and would not have been selected.
The analysis of the new spectrum obtained recently with Magellan/LDSS3 show three distinct absorption systems, identified by the Mg doublet and Fe transitions at 2586Å/2600Å. These systems are located at redshifts z, 2.6584 and 2.4650 respectively.
4.1.8 PSO J16201,
The discovery of this quasar has been already reported by Wang et al. (2017).
In this work we show unpublished spectra, taken with VLT/FORS2 and Magellan/FIRE (see Table 2 for details).
The Mg-based redshift estimated by our analysis (, see Table 2) is consistent within 2 with the one reported in Farina et al. (2022) (6.640).
This quasar is detected in the bands of VIKING DR5: 0.10, 0.12, 0.11, 0.12.
These values are consistent with the photometry reported for this source in Table 8.
Finally, the Magellan/FIRE spectrum reveals the presence of two absorption systems traced by both the Mg doublet and Fe transitions at 2586Å/2600Å: z and 3.746, respectively.
4.1.9 PSO J16429,
At the optical coordinates of this quasar we found a 4.5 radio detection in the LOFAR LoTSS survey (144 MHz). The quasar is not detected in any other radio survey that covers this part of the sky (e.g., RACS, FIRST, NVSS, VLASS). We measured the flux density directly from the LOFAR LoTSS image by using the CASA software. The source is unresolved, with a peak flux density of Jy. This flux density corresponds to a radio luminosity at 144 MHz equal to 3.20.61041 erg s-1. Then we computed the value of R, by assuming a radio spectral index of 0.29 (typical of high redshift quasars detected in LoTSS, see Gloudemans et al. 2022) and by computing the flux density at 4400 starting from the W1 magnitude (see Table 8, i.e., 4400 rest frame corresponds to 33374 in the observed frame, which matches the W1 filter). We obtained a value of 2110, which allow us to define PSO J16429 as a radio-loud source. Additional radio data are needed to compute the actual radio spectral index of the source and then a more precise value of R.
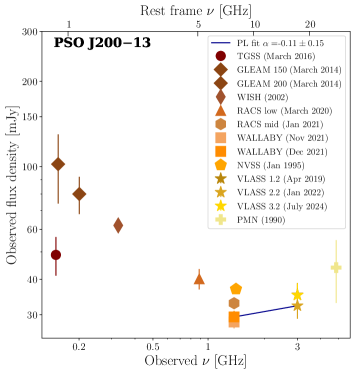
4.1.10 PSO J20013,
PSO J20013151515During the revision process of this work, PSO J20013 was independently reported by Ighina et al. (2025). is a powerful radio source, with a flux density of 361.2 mJy at 1.4 GHz (NVSS). This quasar is also detected in the following radio surveys (see Table 5): TGSS at 150 MHz, the GaLactic and Extragalactic All-sky MWA Survey (GLEAM, Wayth et al. 2015; Hurley-Walker et al. 2017) from 76 to 231 MHz, the Westerbork in the Southern Hemisphere (WISH) Survey (De Breuck et al. 2002) at 325 MHz, RACS at 888 MHz, the Widefield ASKAP L-band Legacy All-sky Blind surveY (WALLABY, Koribalski et al. 2020) at 1.37 GHz, the VLASS at 3 GHz and the Parkes-MIT-NRAO (PMN) survey (Wright et al. 1994) at 4.85 GHz. WALLABY and VLASS flux densities have been computed from a single Gaussian fit (CASA IMFIT) on the images. Massaro et al. (2014) included PSO J20013 in the LOw frequency Radio CATalog of flat spectrum sources (LORCAT), due to the availability of NVSS and WISH flux densities (). Fig. 4 (right panel), shows that PSO J20013 radio emission is characterized by variability on time scales of few years (observed frame, i.e., hundreds of days in the rest frame). Because of the different angular resolutions of the radio surveys in which PSO J20013 is detected, the measured flux difference could also be due to the presence of other nearby sources that, in some cases, are not resolved because of a large radio beam. Therefore, we checked that there were no contaminating sources, and we can confirm that the flux density measured in all radio images is coming from the quasar. To compute the source’s radio spectral index, we use the closest flux densities in time (the WALLABY Dec. 2021 and VLASS2.2 observed in Jan. 2022, see Fig. 4) to minimize variability effects. We obtained a flat spectral index: = 0.11 0.15. Then, we computed the values of radio-loudness, following the same procedure for MQC J02119 and MQC 13302. We started from the -band de-reddened magnitude to compute the value of the flux density at 4400Å rest frame (by assuming again ). Given that 5 GHz in the rest frame corresponds to a frequency of 0.873 GHz, we used the RACS flux density and the estimated spectral index to compute the 5 GHz rest frame radio flux density. We obtained R = 83070. The high value of radio loudness, the flat radio spectral index, and variability indicate that this source could be classified as a blazar, i.e. a radio-loud AGN with the relativistic jet pointed towards the Earth, in agreement with the classification presented in Massaro et al. (2014). Simultaneous radio observations on a wide range of frequencies are necessary to definitively assess the radio spectral shape of this source. Furthermore, PSO J20013 has a clear detection at X-ray frequencies in the eROSITA-DE Data Release 1 (DR1, Merloni et al. 2024). The source is identified as 1eRASS J132206.5-132350, and the separation between optical PS1 and eRASS coordinate is 44 (i.e. well within the 16′′ PSF of eROSITA, Merloni et al. 2024). The net counts in the 0.2-2.3 keV bands are 19.22, with 4.73 expected background counts. The catalog also reported an estimated X-ray flux in the same band of 1.260.3110-13 erg s-1 cm-2 (see Merloni et al. 2024 for more details). More information about the X-ray eROSITA properties of this source will be presented in Hämmerich et al. (in prep.) and Sbarrato et al. (in prep.).
| Obs. Freq. | Sν | Survey | Resolution | Obs. date |
|---|---|---|---|---|
| (GHz) | (mJy) | (arcsec) | ||
| (1) | (2) | (3) | (4) | (5) |
| 0.150 | 48.87.6 | TGSS | 25 | 2016-03-15 |
| 0.1542 | 102.028.0 | GLEAMa | 100 | 2014-03-10 |
| 0.2005 | 98.5910.81 | GLEAMa | 100 | 2014-03-10 |
| 0.325 | 62b | WISH | 54 | 2002 |
| 0.8875 | 40.173.31 | RACS low | 15 | 2020-03-26 |
| 1.3675 | 32.940.57 | RACS mid | 10 | 2021-01-16 |
| 1.3675 | 28.281.43 | WALLABY | 30 | 2021-11-23 |
| 1.3675 | 29.471.48 | WALLABY | 30 | 2021-12-09 |
| 1.4 | 36.960.90 | NVSS | 45 | 1995-01-15 |
| 3.0 | 35.253.54 | VLASS 1.2 | 2.5 | 2019-04-25 |
| 3.0 | 32.283.24 | VLASS 2.2 | 2.5 | 2022-01-31 |
| 3.0 | 35.193.53 | VLASS 3.2 | 2.5 | 2024-07-22 |
| 4.85 | 44.011.0 | PMN | 250 | 1990 |
4.1.11 PSO J21704,
This source was first considered a promising quasar candidate from 900 s Magellan/FIRE longslit observation carried out in May 2023, identified from the 2D spectrum.
However, these data were not of sufficient quality for publication.
Therefore, a follow-up with LBT/MODS (covering the wavelength range from 6000 to 10000) and LBT/LUCI (covering the NIR up to about 24000) was carried a month later (see Table 2).
In this paper we report in Fig. 3 only the coadd of the LBT spectra.
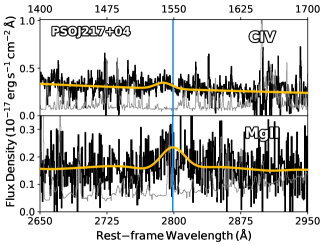
The low value (Å) of C EW (see Table 6) allow us to classify PSO J21704 as a WLQ, similar to PSO J04106.
5 Analysis of the NIR spectra: emission line properties and black hole masses
In this section we report the analysis of the spectra shown in Fig. 3 for the study of the C and Mg BELs and the consequent estimation of black hole masses.
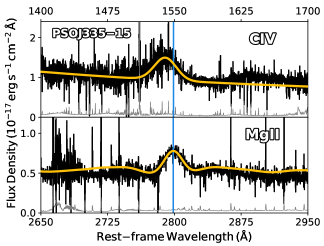
We analyzed the NIR spectra of PSO J03708, PSO J04106, PSO J06714, PSO J16201, PSO J21704, PSO J28950 and PSO J33515 (see Fig. 3) using the Sculptor software171717https://sculptor.readthedocs.io/en/latest/ (Schindler 2022) to derive the properties of these two BELs and compute black hole masses.
We followed an approach used in several studies in the literature (e.g., Mazzucchelli et al. 2017; Vito et al. 2022; Farina et al. 2022).
First, we subtracted the continuum emission – which is described by a power law (), an iron pseudo-continuum template, and a Balmer pseudo-continuum – from the spectra.
We modeled the Fe II contribution with the empirical template of Vestergaard & Wilkes (2001), which is used in the derivation of the scaling relation that we later consider for estimating the black hole mass of the quasars.
To perform the continuum fit, we chose a region of the quasar continuum free of broad emission lines and of strong spikes from residual atmospheric emission.
We then subtracted the entire pseudo-continuum model from the observed spectra, and modeled the two BELs with Gaussian functions.
For PSO J06714 and PSO J28950 we masked the absorption feature in the middle of the C to fit the line properly.
The results of this fitting procedure are shown in Fig. 6 and Table 6.
5.1 The C–Mg velocity shift
Velocity shifts between emission lines in quasars spectra were first identified decades ago (e.g., Gaskell 1982) and remain a widely debated topic for quasars at any cosmic time
(e.g., Shen et al. 2016; Coatman et al. 2017; Ge et al. 2019; Meyer et al. 2019; Schindler et al. 2020; Onoue et al. 2020; Yang et al. 2021; Stepney et al. 2023).
Broad high-ionization lines, such as C and Si, are known to exhibit particularly large blueshifts compared to lower-ionization lines (e.g., Mg).
The origin of these shifts is often attributed to non-gravitational effects, such as radiation-driven outflows, most likely originating in disk winds (e.g., Richards et al. 2011 and reference therein).
Strong C–Mg blueshifts (3000 km s) are commonly observed in a large fraction of quasars (e.g., Mortlock et al. 2011; De Rosa et al. 2014; Mazzucchelli et al. 2017; Bañados et al. 2018; Meyer et al. 2019; Shen et al. 2019) and recent studies pointed out an evolution with redshift (up to 7) of the C–Mg shift (e.g., Meyer et al. 2019; Schindler et al. 2019; Yang et al. 2021), implying a change of quasar-driven winds properties over cosmic time.
Large C blueshifts translate into asymmetrical broad-line profiles,
suggesting that non-virial motions have a significant effect on the observed emission velocity profile.
To date, the strongest C velocity shifts have been observed in the so-called WLQs, which exhibit a rest frame equivalent width (REW) values smaller than 10Å (e.g., Diamond-Stanic et al. 2009).
In this work we measured the C–Mg velocity shift for the quasars reported in Fig. 3.
We computed the C redshift from the peak of the BEL.
Then we computed the velocity shift between C and Mg by using the following equation:
| (1) |
The velocity shift values are reported in Table 6, together with the estimated REW.
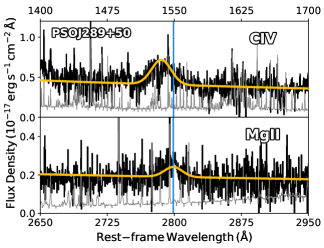
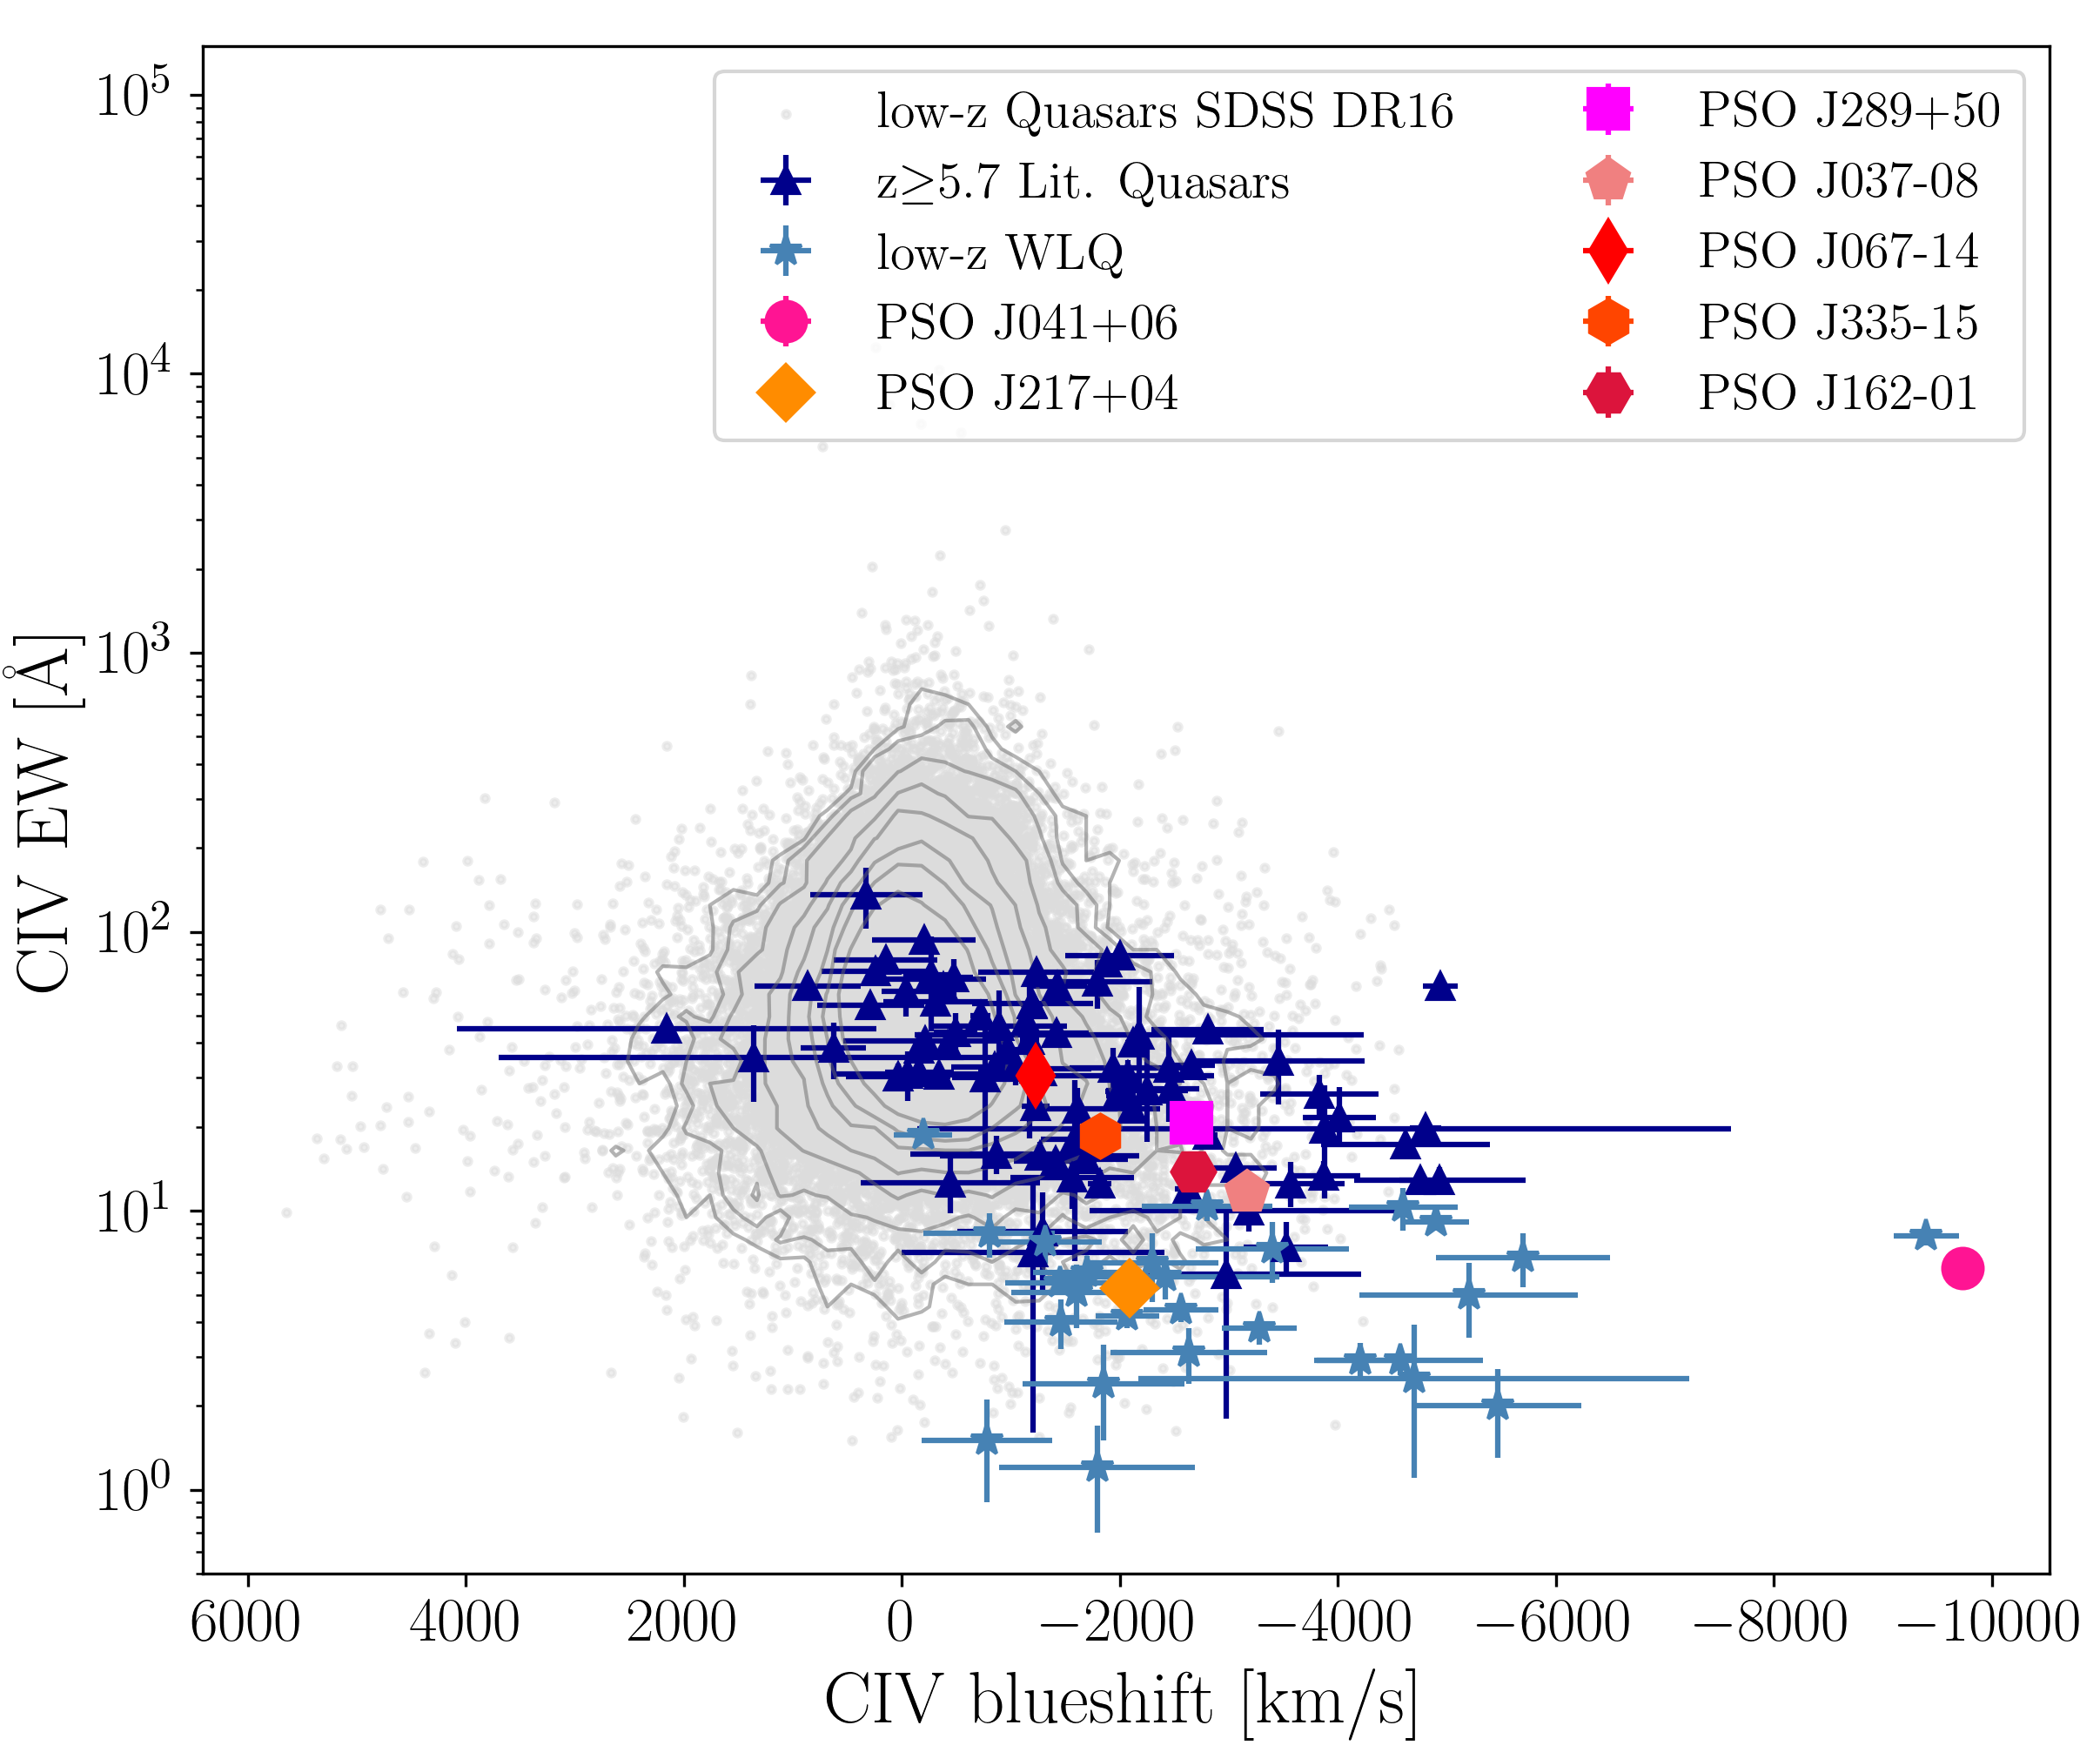
Figure 7 shows our results on the so-called C plane, where we also report the C blueshift and REW of quasars from the literature (Shen et al. 2019; Schindler et al. 2020; Yang et al. 2021) and of low- quasars from the SDSS DR16 (grey dots and contours).
These low- sources have been selected from the catalog of Wu & Shen (2022) to be at 0.352.25 (where the Mg BEL falls in the SDSS wavelength range) and to have a valid measure of the virial black hole mass, bolometric luminosity, Eddington ratio and emission lines properties.
We also display low- WLQs from the works of Wu et al. (2011), Luo et al. (2015), and Plotkin et al. (2015).
As can be noticed from Fig. 7, all the quasars analyzed in this work show a similar shift to that of the bulk of the high- population, except for PSO J04106, which is an outlier in this plot.
In fact, this quasar has a C–Mg shift 9000 km s-1, the highest ever recorded at .
The only low- quasar we could find on a similar C parameter space is J12191244 at , which is an X–ray weak WLQ from the sample of Wu et al. (2011), highlighting the exceptional rarity and uniqueness of such WLQs with wind-dominated Broad Line Regions (BLRs).
While the C line is detected in the spectrum, its derived properties remain uncertain due to the low S/N and resolution of the data.
A higher S/N and resolution spectrum is needed (e.g, with VLT/X-Shooter) to better characterize the C properties.
5.2 Estimates of the black hole mass
For un-obscured, type-1 quasars, the most common technique used to compute the mass of the central black hole is the single epoch (SE) method.
Based on the assumption that the gas in the BLR is virialized, the line-width of BELs is used to trace the velocity distribution of the gas.
When combined with the luminosity of the accretion disk continuum (i.e., a proxy of the distance of the gas from the central SMBH), MBH can be estimated from the virial relation (e.g., Vestergaard & Peterson 2006; Vestergaard & Osmer 2009; Shen et al. 2008, 2011).
This method made it possible to estimate the mass of SMBHs hosted by high- quasars mainly using C and Mg BELs that fall in the wavelength range of most optical/NIR instruments mounted on ground-based telescopes (e.g., Jiang et al. 2007; Wu et al. 2015; Mazzucchelli et al. 2017, 2023; Shen et al. 2019; Onoue et al. 2019; Wang et al. 2021b; Diana et al. 2022; Farina et al. 2022; Vito et al. 2022; Belladitta et al. 2023).
For the Mg line, we used the single epoch scaling relation presented by Vestergaard & Osmer (2009), for a direct comparison with other estimates in the literature:
| (2) |
For the C, we used the scaling relation of Vestergaard & Peterson (2006), which is the most frequently used in the literature:
| (3) |
where FWHM (C IVcorr) is the width of the C line corrected by potential blueshift effects according to Coatman et al. (2017):
| (4) |
In Eq. (2) and Eq. (3) and are the monochromatic luminosity at 3000 Å and 1350 Å derived from the best-fit model of the continuum.
Table 6 reports the estimated values of black hole masses, including only statistical uncertainties.
In addition to this statistical error, we must also consider the intrinsic scatter of the used scaling relation: 0.36-0.43 dex for C from Vestergaard & Peterson (2006) and 0.55 dex for Mg from Vestergaard & Osmer (2009).
The value of the black hole masses allowed us to derive the Eddington ratio, which quantifies how fast the black hole is accreting with respect to the Eddington limit: = Lbol/LEdd.
Here LEdd is the Eddington luminosity, the maximum luminosity beyond which radiation pressure will overcome gravity181818LEdd = 1.26 1038 erg s-1, and Lbol is the bolometric luminosity, which is the total energy produced by the quasar per unit of time-integrated over all wavelengths.
We derived the bolometric luminosity by following the equation in Shen et al. (2008):
| (5) |
The values are reported in Table 6 together with the corresponding values of the Eddington ratio.
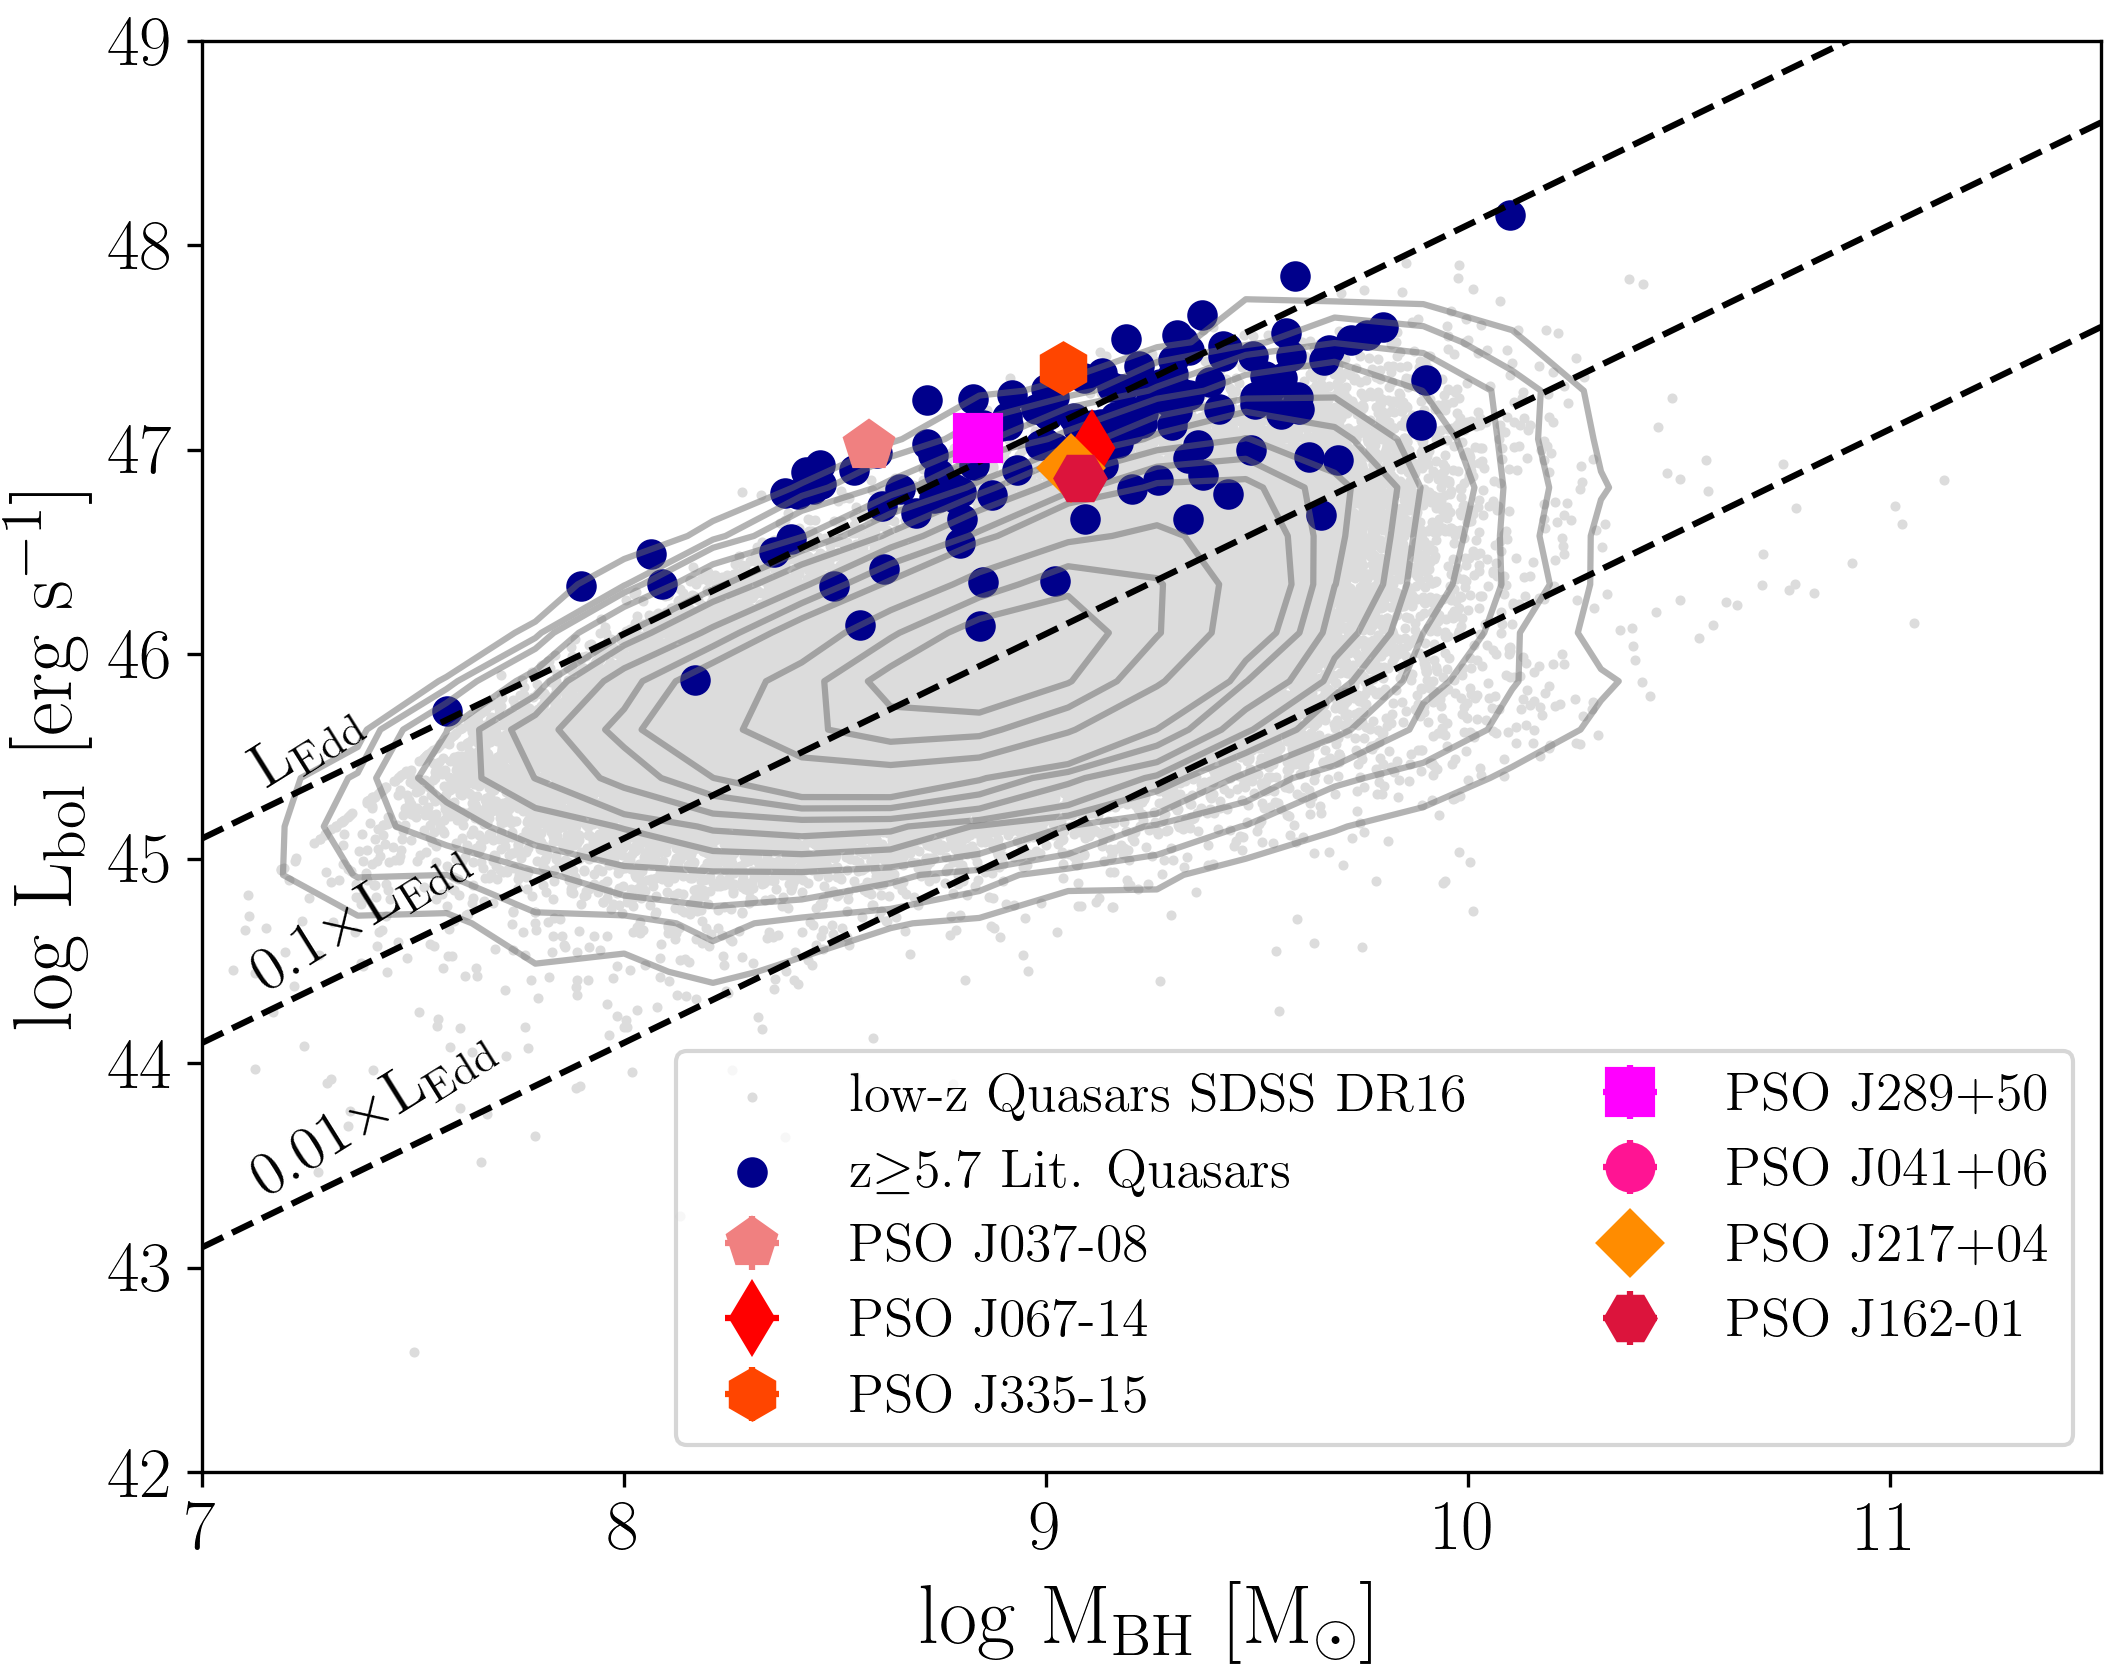
Figure 8 shows that the quasars in our sample are located close to the line of Eddington luminosity, indicating that their central SMBHs are accreting close to the Eddington limit.
The quasar PSO J03708 has an Eddington ratio larger than 2, which suggests a super-Eddington accretion regime.
This is not uncommon at these redshifts, since other few quasars have been reported to be super-Eddington in the literature (see e.g., Bañados et al. 2021; Yang et al. 2021).
The values of MBH and of the newly discovered high- quasars in this work are in line with those derived for quasars already reported in the literature (e.g., Mazzucchelli et al. 2023), as shown in Fig. 8.
These values are also in line with those derived by Hβ for quasars recently observed with JWST (e.g., Loiacono et al. 2024; Eilers et al. 2023).
For comparison, we also show in Fig. 8 the distribution of Lbol and MBH of low- quasars (same sources as Fig. 7).
6 Summary and conclusions
In this work, we reported the discovery of 25 quasars at , with 1450 Å rest-frame absolute magnitudes between 25.4 and 27.0. These objects have been selected from a number of criteria (Sect. 2) and spectroscopically confirmed through dedicated follow-up campaigns at several ground-based facilities (Sect. 3.2). We further presented unpublished spectra of six quasars at already known in the literature.
Three of the new quasars (MQC J02119, MQC J13302 and PSO J20013) show intense radio emission, with a 1.4 GHz luminosity in the range 0.09–1.01034 erg s-1 Hz-1. All of them are classified as radio-loud, with a radio-loudness in the range 30–850. They are compact at all frequencies at the resolution of the available radio images. Overall, the radio properties of these 3 new radio-loud quasars (spectral indices, radio-loudnesses, radio luminosities) are within the range of values of other radio-loud quasars at discovered so far (e.g., Belladitta et al. 2019; Gloudemans et al. 2022; Ighina et al. 2024). The quasar PSO J20013 shows properties that are typical of blazars, i.e. a sub-class of radio-detected quasars with the relativistic jet pointed toward the Earth: flat radio spectrum (=0.11), log(R)2.5 and variability at several radio frequencies at different time scales. It is also detected in the X-ray by the eROSITA-DE DR1 (f erg s-1 cm-2).
We further reported the radio identification of the quasar PSO J16429. It is detected only in the LOFAR LoTSS at 144 MHz, and this makes the measured radio loudness uncertain (R2110), due to a strong dependence on the assumption of the radio spectral index. Additional multi-frequency radio data will be essential to confirm the radio-loud classification of this quasar.
For seven sources, we also reported NIR spectroscopic follow-up to unveil the C and Mg broad emission lines (see Fig. 3) and computed single epoch black hole masses and Eddington ratios. Their values are in agreement with the typical MBH and of the population of high- quasars reported in the literature (e.g., Farina et al. 2022; Mazzucchelli et al. 2023).
The NIR spectral analysis of the quasar PSO J04106, classifies it as a WLQ (with C EW of 6 Å). Moreover, the source shows the largest C-Mg velocity shift ever measured at a : 9000 km s-1, suggesting the presence of strong outflows on the BRL-scale. WLQs with a wind-dominated BLR are rare sources: by exploiting the SDSS DR16 catalog and other works in the literature, we were able to find only one analog at low-.
The quasar PSO J06714 shows strong absorption features in the NIR spectrum blueward the C, the N and the Si emission lines. These features have a maximum velocity of km s-1, which classifies the source as a high ionization BAL (HiBAL) quasar. An additional absorption feature at 1300Å (rest frame) might be associated with an extremely high-velocity (0.16c) C BAL outflows.
Two other quasars (MQC J02119 and PSO J08238) could be classified as HiBALs thanks to the absorption feature blue-ward the N clearly visible in their optical spectra. However, a NIR follow-up is necessary to confirm this classification by detecting the absorption feature in other atomic species. The strong radio emission of MQC J02119 classifies it as a radio-BAL, which are rare sources among the BAL population (%, e.g., Hewett & Foltz 2003; Morabito et al. 2019).
The discovery and characterization of the quasars reported in this work came after extensive spectroscopic follow-up campaigns at several ground-based telescopes. A list of all observed objects that turned out to be non-quasars at high (73 sources) is given in the Appendix. Most of these rejected candidates (51) are ultracool dwarfs, which remain the major source of astrophysical contamination in the search for quasars using primarily color selection and the dropout technique.
Another source of astrophysical contamination is galaxies at low redshift, where the D4000 Å Calcium Break mimics the Lyman- break. This is especially true when selecting quasar candidates from radio surveys (see Table 12). However, ultracool dwarfs can also be contaminants in radio selections (see Table 12), especially if objects with radio flux density at mJy are selected, as also demonstrated by Gloudemans et al. (2023).
The majority of the newly discovered quasars reported in this paper are located in the southern hemisphere. This will provide the ideal ground for follow-up investigations using state-of-the-art (e.g., the Very Large Telescope, the Atacama Large Millimiter Array) and future (e.g., the Extremely Large Telescope, the Square Kilometer Array) ground-based facilities focusing on properties such as the metallicity of the gas surrounding the central SMBHs, intergalactic medium along the line of sight, mass, star formation rate, gas content, and internal dynamics of host galaxies, as well as their large-scale environment.
The discovery and characterization of the quasars reported in this paper came from the in-depth exploration of surveys already widely used in past years, confirming that these data sets can still be exploited for the discovery of quasars in the bright tail of their luminosity function. With the advent of wide surveys, such as the European Space Agency (ESA) Euclid (Euclid Collaboration et al. 2022, 2024) or the Legacy Survey of Space and Time (LSST) by the Vera C. Rubin Observatory (Ivezić et al. 2019), fainter quasars will eventually be discovered (e.g., Euclid Collaboration et al. 2019; Nanni et al. 2022; Tee et al. 2023; Lenz et al. 2024), promising fundamental progress in our knowledge of the faint-end of the quasar luminosity function in the re-ionization epoch.
| Quasar Name | FWHM C | FWHM Mg | C | CIV EW | log | log | log Lbol | log MBH,CIV | log MBH,MgII | |||
|---|---|---|---|---|---|---|---|---|---|---|---|---|
| km s-1 | km s-1 | km s-1 | Å | erg s-1 | erg s-1 | erg s-1 | M⊙ | M⊙ | ||||
| (1) | (2) | (3) | (4) | (5) | (6) | (7) | (8) | (9) | (10) | (11) | (12) | (13) |
| PSO J03708 | 290095 | 192570 | 6.6440.002 | 317040 | 11.50.3 | 46.310.01 | 46.480.01 | 47.020.01 | 8.900.02 | 8.580.02 | 1.050.07 | 2.180.15 |
| PSO J04106 | 190020 | 50135 | 6.0840.003 | 973025 | 6.30.1 | 46.340.02 | 46.090.02 | 46.800.02 | 8.460.03 | 9.310.02 | 1.750.03 | 0.250.02 |
| PSO J06714 | 457010 | 35555 | 6.6850.001 | 12253 | 30.450.05 | 46.300.01 | 46.350.01 | 47.010.01 | 9.220.01 | 9.110.01 | 0.490.01 | 0.630.01 |
| PSO J16201 | 414010 | 37355 | 6.5880.001 | 26733 | 13.790.02 | 46.150.01 | 46.300.01 | 46.860.01 | 9.110.01 | 9.080.01 | 0.450.02 | 0.480.02 |
| PSO J21704 | 313485 | 354670 | 6.6420.002 | 209332 | 5.30.1 | 46.200.01 | 46.280.01 | 46.910.01 | 8.860.03 | 9.060.03 | 0.890.05 | 0.560.02 |
| PSO J28950 | 322035 | 252026 | 6.7860.002 | 265515 | 20.650.14 | 46.350.01 | 46.440.01 | 47.060.01 | 8.970.01 | 8.840.01 | 0.980.02 | 1.330.04 |
| PSO J33515 | 56486 | 26172 | 6.4650.001 | 18194 | 18.610.02 | 46.780.01 | 46.690.01 | 47.400.01 | 9.430.01 | 9.040.01 | 0.740.01 | 1.820.01 |
References
- Abbott et al. (2018) Abbott, T. M. C., Abdalla, F. B., Allam, S., et al. 2018, ApJS, 239, 18
- Ahumada et al. (2020) Ahumada, R., Allende Prieto, C., Almeida, A., et al. 2020, ApJS, 249, 3
- Allard et al. (2012) Allard, F., Homeier, D., & Freytag, B. 2012, Philosophical Transactions of the Royal Society of London Series A, 370, 2765
- Almeida et al. (2023) Almeida, A., Anderson, S. F., Argudo-Fernández, M., et al. 2023, ApJS, 267, 44
- Appenzeller & Rupprecht (1992) Appenzeller, I. & Rupprecht, G. 1992, The Messenger, 67, 18
- Arnouts & Ilbert (2011) Arnouts, S. & Ilbert, O. 2011, LePHARE: Photometric Analysis for Redshift Estimate, Astrophysics Source Code Library, record ascl:1108.009
- Astropy Collaboration et al. (2018) Astropy Collaboration, Price-Whelan, A. M., Sipőcz, B. M., et al. 2018, AJ, 156, 123
- Bañados et al. (2021) Bañados, E., Mazzucchelli, C., Momjian, E., et al. 2021, ApJ, 909, 80
- Bañados et al. (2025) Bañados, E., Momjian, E., Connor, T., et al. 2025, Nature Astronomy, 9, 293
- Bañados et al. (2019) Bañados, E., Rauch, M., Decarli, R., et al. 2019, ApJ, 885, 59
- Bañados et al. (2023) Bañados, E., Schindler, J.-T., Venemans, B. P., et al. 2023, ApJS, 265, 29
- Bañados et al. (2016) Bañados, E., Venemans, B. P., Decarli, R., et al. 2016, ApJS, 227, 11
- Bañados et al. (2018) Bañados, E., Venemans, B. P., Mazzucchelli, C., et al. 2018, Nature, 553, 473
- Bañados et al. (2014) Bañados, E., Venemans, B. P., Morganson, E., et al. 2014, AJ, 148, 14
- Bañados et al. (2015) Bañados, E., Venemans, B. P., Morganson, E., et al. 2015, ApJ, 804, 118
- Becker et al. (2015) Becker, G. D., Bolton, J. S., & Lidz, A. 2015, PASA, 32, e045
- Becker et al. (1994) Becker, R. H., White, R. L., & Helfand, D. J. 1994, in Astronomical Society of the Pacific Conference Series, Vol. 61, Astronomical Data Analysis Software and Systems III, ed. D. R. Crabtree, R. J. Hanisch, & J. Barnes, 165
- Belladitta et al. (2023) Belladitta, S., Moretti, A., Caccianiga, A., et al. 2023, A&A, 669, A134
- Belladitta et al. (2019) Belladitta, S., Moretti, A., Caccianiga, A., et al. 2019, A&A, 629, A68
- Belladitta et al. (2020) Belladitta, S., Moretti, A., Caccianiga, A., et al. 2020, A&A, 635, L7
- Bertin & Arnouts (1996) Bertin, E. & Arnouts, S. 1996, A&AS, 117, 393
- Bischetti et al. (2024) Bischetti, M., Choi, H., Fiore, F., et al. 2024, ApJ, 970, 9
- Bischetti et al. (2022) Bischetti, M., Feruglio, C., D’Odorico, V., et al. 2022, Nature, 605, 244
- Bischetti et al. (2023) Bischetti, M., Fiore, F., Feruglio, C., et al. 2023, ApJ, 952, 44
- Boutsia et al. (2017) Boutsia, K., Osip, D., & Beletsky, Y. 2017, in ESO Calibration Workshop: The Second Generation VLT Instruments and Friends, 4
- Bridle & Perley (1984) Bridle, A. H. & Perley, R. A. 1984, ARA&A, 22, 319
- Bruni et al. (2019) Bruni, G., Piconcelli, E., Misawa, T., et al. 2019, A&A, 630, A111
- Buzzoni et al. (1984) Buzzoni, B., Delabre, B., Dekker, H., et al. 1984, The Messenger, 38, 9
- Byrne et al. (2024) Byrne, X., Meyer, R. A., Farina, E. P., et al. 2024, MNRAS, 530, 870
- Caccianiga et al. (2019) Caccianiga, A., Moretti, A., Belladitta, S., et al. 2019, MNRAS, 484, 204
- Calderone et al. (2024) Calderone, G., Guarneri, F., Porru, M., et al. 2024, A&A, 683, A34
- Carnall et al. (2015) Carnall, A. C., Shanks, T., Chehade, B., et al. 2015, MNRAS, 451, L16
- Chambers et al. (2016) Chambers, K. C., Magnier, E. A., Metcalfe, N., et al. 2016, arXiv e-prints, arXiv:1612.05560
- Coatman et al. (2017) Coatman, L., Hewett, P. C., Banerji, M., et al. 2017, MNRAS, 465, 2120
- Condon et al. (1998) Condon, J. J., Cotton, W. D., Greisen, E. W., et al. 1998, AJ, 115, 1693
- Curtis-Lake et al. (2023) Curtis-Lake, E., Carniani, S., Cameron, A., et al. 2023, Nature Astronomy, 7, 622
- dal Ponte et al. (2023) dal Ponte, M., Santiago, B., Carnero Rosell, A., et al. 2023, MNRAS, 522, 1951
- Davies et al. (2023) Davies, R. L., Ryan-Weber, E., D’Odorico, V., et al. 2023, MNRAS, 521, 289
- De Breuck et al. (2002) De Breuck, C., Tang, Y., de Bruyn, A. G., Röttgering, H., & van Breugel, W. 2002, A&A, 394, 59
- De Rosa et al. (2014) De Rosa, G., Venemans, B. P., Decarli, R., et al. 2014, ApJ, 790, 145
- Decarli et al. (2018) Decarli, R., Walter, F., Venemans, B. P., et al. 2018, ApJ, 854, 97
- Deka et al. (2024) Deka, P. P., Gupta, N., Jagannathan, P., et al. 2024, ApJS, 270, 33
- D’Eugenio et al. (2025) D’Eugenio, F., Cameron, A. J., Scholtz, J., et al. 2025, ApJS, 277, 4
- Dey et al. (2019) Dey, A., Schlegel, D. J., Lang, D., et al. 2019, AJ, 157, 168
- Diamond-Stanic et al. (2009) Diamond-Stanic, A. M., Fan, X., Brandt, W. N., et al. 2009, ApJ, 699, 782
- Diana et al. (2022) Diana, A., Caccianiga, A., Ighina, L., et al. 2022, MNRAS, 511, 5436
- D’Odorico et al. (2023) D’Odorico, V., Bañados, E., Becker, G. D., et al. 2023, MNRAS, 523, 1399
- Dunn et al. (2012) Dunn, J. P., Arav, N., Aoki, K., et al. 2012, ApJ, 750, 143
- Dye et al. (2018) Dye, S., Lawrence, A., Read, M. A., et al. 2018, MNRAS, 473, 5113
- Edge et al. (2013) Edge, A., Sutherland, W., Kuijken, K., et al. 2013, The Messenger, 154, 32
- Eilers et al. (2020) Eilers, A.-C., Hennawi, J. F., Decarli, R., et al. 2020, ApJ, 900, 37
- Eilers et al. (2023) Eilers, A.-C., Simcoe, R. A., Yue, M., et al. 2023, ApJ, 950, 68
- Eisenhardt et al. (2020) Eisenhardt, P. R. M., Marocco, F., Fowler, J. W., et al. 2020, ApJS, 247, 69
- Elias et al. (2006a) Elias, J. H., Joyce, R. R., Liang, M., et al. 2006a, in Society of Photo-Optical Instrumentation Engineers (SPIE) Conference Series, Vol. 6269, Ground-based and Airborne Instrumentation for Astronomy, ed. I. S. McLean & M. Iye, 62694C
- Elias et al. (2006b) Elias, J. H., Rodgers, B., Joyce, R. R., et al. 2006b, in Society of Photo-Optical Instrumentation Engineers (SPIE) Conference Series, Vol. 6269, Ground-based and Airborne Instrumentation for Astronomy, ed. I. S. McLean & M. Iye, 626914
- Euclid Collaboration et al. (2019) Euclid Collaboration, Barnett, R., Warren, S. J., et al. 2019, A&A, 631, A85
- Euclid Collaboration et al. (2024) Euclid Collaboration, Mellier, Y., Abdurro’uf, et al. 2024, arXiv e-prints, arXiv:2405.13491
- Euclid Collaboration et al. (2022) Euclid Collaboration, Scaramella, R., Amiaux, J., et al. 2022, A&A, 662, A112
- Fan et al. (2023) Fan, X., Bañados, E., & Simcoe, R. A. 2023, ARA&A, 61, 373
- Fan et al. (1999) Fan, X., Strauss, M. A., Gunn, J. E., et al. 1999, ApJ, 526, L57
- Farina et al. (2022) Farina, E. P., Schindler, J.-T., Walter, F., et al. 2022, ApJ, 941, 106
- Fitzpatrick (1999) Fitzpatrick, E. L. 1999, PASP, 111, 63
- Flaugher (2005) Flaugher, B. 2005, International Journal of Modern Physics A, 20, 3121
- Flesch (2023) Flesch, E. W. 2023, arXiv e-prints, arXiv:2308.01505
- Gargiulo et al. (2022) Gargiulo, A., Fumana, M., Bisogni, S., et al. 2022, MNRAS, 514, 2902
- Gaskell (1982) Gaskell, C. M. 1982, ApJ, 263, 79
- Ge et al. (2019) Ge, X., Zhao, B.-X., Bian, W.-H., & Frederick, G. R. 2019, AJ, 157, 148
- Gibson et al. (2009) Gibson, R. R., Jiang, L., Brandt, W. N., et al. 2009, ApJ, 692, 758
- Gloudemans et al. (2023) Gloudemans, A. J., Callingham, J. R., Duncan, K. J., et al. 2023, A&A, 678, A161
- Gloudemans et al. (2021) Gloudemans, A. J., Duncan, K. J., Röttgering, H. J. A., et al. 2021, A&A, 656, A137
- Gloudemans et al. (2022) Gloudemans, A. J., Duncan, K. J., Saxena, A., et al. 2022, A&A, 668, A27
- Glowacki et al. (2023) Glowacki, M., Lee-Waddell, K., Deller, A. T., et al. 2023, ApJ, 949, 25
- Greene et al. (2024) Greene, J. E., Labbe, I., Goulding, A. D., et al. 2024, ApJ, 964, 39
- Hale et al. (2021) Hale, C. L., McConnell, D., Thomson, A. J. M., et al. 2021, PASA, 38, e058
- Hambly et al. (2008) Hambly, N. C., Collins, R. S., Cross, N. J. G., et al. 2008, MNRAS, 384, 637
- Hardcastle & Croston (2020) Hardcastle, M. J. & Croston, J. H. 2020, New A Rev., 88, 101539
- Harikane et al. (2023) Harikane, Y., Zhang, Y., Nakajima, K., et al. 2023, ApJ, 959, 39
- Heintz et al. (2025) Heintz, K. E., Brammer, G. B., Watson, D., et al. 2025, A&A, 693, A60
- Hewett & Foltz (2003) Hewett, P. C. & Foltz, C. B. 2003, AJ, 125, 1784
- Hurley-Walker et al. (2017) Hurley-Walker, N., Callingham, J. R., Hancock, P. J., et al. 2017, MNRAS, 464, 1146
- Ighina et al. (2023) Ighina, L., Caccianiga, A., Moretti, A., et al. 2023, MNRAS, 519, 2060
- Ighina et al. (2024) Ighina, L., Caccianiga, A., Moretti, A., et al. 2024, A&A, 692, A241
- Ighina et al. (2025) Ighina, L., Caccianiga, A., Moretti, A., et al. 2025, arXiv e-prints, arXiv:2504.10573
- Inayoshi et al. (2020) Inayoshi, K., Visbal, E., & Haiman, Z. 2020, ARA&A, 58, 27
- Intema et al. (2017) Intema, H. T., Jagannathan, P., Mooley, K. P., & Frail, D. A. 2017, A&A, 598, A78
- Irwin et al. (2004) Irwin, M. J., Lewis, J., Hodgkin, S., et al. 2004, in Society of Photo-Optical Instrumentation Engineers (SPIE) Conference Series, Vol. 5493, Optimizing Scientific Return for Astronomy through Information Technologies, ed. P. J. Quinn & A. Bridger, 411–422
- Ivezić et al. (2019) Ivezić, Ž., Kahn, S. M., Tyson, J. A., et al. 2019, ApJ, 873, 111
- Jiang et al. (2024) Jiang, D., Onoue, M., Jiang, L., et al. 2024, arXiv e-prints, arXiv:2409.06174
- Jiang et al. (2007) Jiang, L., Fan, X., Ivezić, Ž., et al. 2007, ApJ, 656, 680
- Jiang et al. (2016) Jiang, L., McGreer, I. D., Fan, X., et al. 2016, ApJ, 833, 222
- Keller et al. (2024) Keller, P. M., Thyagarajan, N., Kumar, A., Kanekar, N., & Bernardi, G. 2024, MNRAS, 528, 5692
- Keller et al. (2007) Keller, S. C., Schmidt, B. P., Bessell, M. S., et al. 2007, PASA, 24, 1
- Kellermann et al. (1989) Kellermann, K. I., Sramek, R., Schmidt, M., Shaffer, D. B., & Green, R. 1989, AJ, 98, 1195
- Khusanova et al. (2022) Khusanova, Y., Bañados, E., Mazzucchelli, C., et al. 2022, A&A, 664, A39
- Koribalski et al. (2020) Koribalski, B. S., Staveley-Smith, L., Westmeier, T., et al. 2020, Ap&SS, 365, 118
- Lacy et al. (2020) Lacy, M., Baum, S. A., Chandler, C. J., et al. 2020, PASP, 132, 035001
- Lambert et al. (2024) Lambert, T. S., Assef, R. J., Mazzucchelli, C., et al. 2024, A&A, 689, A331
- Lawrence et al. (2007) Lawrence, A., Warren, S. J., Almaini, O., et al. 2007, MNRAS, 379, 1599
- Lenz et al. (2024) Lenz, L., Mortlock, D. J., Leistedt, B., Barnett, R., & Hewett, P. C. 2024, arXiv e-prints, arXiv:2408.12770
- Liu et al. (2021) Liu, Y., Wang, R., Momjian, E., et al. 2021, ApJ, 908, 124
- Loiacono et al. (2024) Loiacono, F., Decarli, R., Mignoli, M., et al. 2024, A&A, 685, A121
- Luo et al. (2015) Luo, B., Brandt, W. N., Hall, P. B., et al. 2015, ApJ, 805, 122
- Lyke et al. (2020) Lyke, B. W., Higley, A. N., McLane, J. N., et al. 2020, VizieR Online Data Catalog: SDSS quasar catalog, sixteenth data release (DR16Q) (Lyke+, 2020), VizieR On-line Data Catalog: VII/289. Originally published in: 2020ApJS..250….8L
- Madau (1995) Madau, P. 1995, ApJ, 441, 18
- Mainzer et al. (2011) Mainzer, A., Bauer, J., Grav, T., et al. 2011, ApJ, 731, 53
- Maiolino et al. (2024a) Maiolino, R., Risaliti, G., Signorini, M., et al. 2024a, arXiv e-prints, arXiv:2405.00504
- Maiolino et al. (2024b) Maiolino, R., Scholtz, J., Curtis-Lake, E., et al. 2024b, A&A, 691, A145
- Marocco et al. (2021) Marocco, F., Eisenhardt, P. R. M., Fowler, J. W., et al. 2021, ApJS, 253, 8
- Massaro et al. (2014) Massaro, F., Giroletti, M., D’Abrusco, R., et al. 2014, ApJS, 213, 3
- Matsuoka et al. (2018) Matsuoka, Y., Iwasawa, K., Onoue, M., et al. 2018, ApJS, 237, 5
- Mazzucchelli et al. (2017) Mazzucchelli, C., Bañados, E., Venemans, B. P., et al. 2017, ApJ, 849, 91
- Mazzucchelli et al. (2023) Mazzucchelli, C., Bischetti, M., D’Odorico, V., et al. 2023, A&A, 676, A71
- Mazzucchelli et al. (2025) Mazzucchelli, C., Decarli, R., Belladitta, S., et al. 2025, A&A, 694, A171
- McConnell et al. (2020) McConnell, D., Hale, C. L., Lenc, E., et al. 2020, PASA, 37, e048
- McGreer et al. (2013) McGreer, I. D., Jiang, L., Fan, X., et al. 2013, ApJ, 768, 105
- McMahon et al. (2013) McMahon, R. G., Banerji, M., Gonzalez, E., et al. 2013, The Messenger, 154, 35
- McMullin et al. (2007) McMullin, J. P., Waters, B., Schiebel, D., Young, W., & Golap, K. 2007, in Astronomical Society of the Pacific Conference Series, Vol. 376, Astronomical Data Analysis Software and Systems XVI, ed. R. A. Shaw, F. Hill, & D. J. Bell, 127
- Menzel et al. (2016) Menzel, M. L., Merloni, A., Georgakakis, A., et al. 2016, MNRAS, 457, 110
- Merloni et al. (2024) Merloni, A., Lamer, G., Liu, T., et al. 2024, A&A, 682, A34
- Meyer et al. (2019) Meyer, R. A., Bosman, S. E. I., & Ellis, R. S. 2019, MNRAS, 487, 3305
- Mignoli et al. (2020) Mignoli, M., Gilli, R., Decarli, R., et al. 2020, A&A, 642, L1
- Momjian et al. (2021) Momjian, E., Bañados, E., Carilli, C. L., Walter, F., & Mazzucchelli, C. 2021, AJ, 161, 207
- Moorwood et al. (1998) Moorwood, A., Cuby, J. G., & Lidman, C. 1998, The Messenger, 91, 9
- Morabito et al. (2019) Morabito, L. K., Matthews, J. H., Best, P. N., et al. 2019, A&A, 622, A15
- Mortlock et al. (2011) Mortlock, D. J., Warren, S. J., Venemans, B. P., et al. 2011, Nature, 474, 616
- Nanni et al. (2022) Nanni, R., Hennawi, J. F., Wang, F., et al. 2022, MNRAS, 515, 3224
- Neeleman et al. (2021) Neeleman, M., Novak, M., Venemans, B. P., et al. 2021, ApJ, 911, 141
- Onken et al. (2022) Onken, C. A., Wolf, C., Bian, F., et al. 2022, MNRAS, 511, 572
- Onorato et al. (2025) Onorato, S., Hennawi, J. F., Schindler, J.-T., et al. 2025, MNRAS[arXiv:2406.07612]
- Onoue et al. (2020) Onoue, M., Bañados, E., Mazzucchelli, C., et al. 2020, ApJ, 898, 105
- Onoue et al. (2019) Onoue, M., Kashikawa, N., Matsuoka, Y., et al. 2019, ApJ, 880, 77
- Plotkin et al. (2015) Plotkin, R. M., Shemmer, O., Trakhtenbrot, B., et al. 2015, ApJ, 805, 123
- Pogge et al. (2010) Pogge, R. W., Atwood, B., Brewer, D. F., et al. 2010, in Society of Photo-Optical Instrumentation Engineers (SPIE) Conference Series, Vol. 7735, Ground-based and Airborne Instrumentation for Astronomy III, ed. I. S. McLean, S. K. Ramsay, & H. Takami, 77350A
- Pons et al. (2019) Pons, E., McMahon, R. G., Simcoe, R. A., et al. 2019, MNRAS, 484, 5142
- Prochaska et al. (2020) Prochaska, J., Hennawi, J., Westfall, K., et al. 2020, The Journal of Open Source Software, 5, 2308
- Pudoka et al. (2024) Pudoka, M., Wang, F., Fan, X., et al. 2024, arXiv e-prints, arXiv:2405.03781
- Reed et al. (2015) Reed, S. L., McMahon, R. G., Banerji, M., et al. 2015, MNRAS, 454, 3952
- Reed et al. (2017) Reed, S. L., McMahon, R. G., Martini, P., et al. 2017, MNRAS, 468, 4702
- Richards et al. (2011) Richards, G. T., Kruczek, N. E., Gallagher, S. C., et al. 2011, in American Astronomical Society Meeting Abstracts, Vol. 218, American Astronomical Society Meeting Abstracts #218, 327.13
- Roberts-Borsani et al. (2024) Roberts-Borsani, G., Bagley, M., Rojas-Ruiz, S., et al. 2024, arXiv e-prints, arXiv:2407.17551
- Rodr´ıguez Hidalgo et al. (2020) Rodríguez Hidalgo, P., Khatri, A. M., Hall, P. B., et al. 2020, ApJ, 896, 151
- Ross & Cross (2020) Ross, N. P. & Cross, N. J. G. 2020, MNRAS, 494, 789
- Schindler (2022) Schindler, J.-T. 2022, Sculptor: Interactive modeling of astronomical spectra, Astrophysics Source Code Library, record ascl:2202.018
- Schindler et al. (2019) Schindler, J.-T., Fan, X., Huang, Y.-H., et al. 2019, ApJS, 243, 5
- Schindler et al. (2020) Schindler, J.-T., Farina, E. P., Bañados, E., et al. 2020, ApJ, 905, 51
- Schlafly et al. (2019) Schlafly, E. F., Meisner, A. M., & Green, G. M. 2019, ApJS, 240, 30
- Seifert et al. (2003) Seifert, W., Appenzeller, I., Baumeister, H., et al. 2003, in Society of Photo-Optical Instrumentation Engineers (SPIE) Conference Series, Vol. 4841, Instrument Design and Performance for Optical/Infrared Ground-based Telescopes, ed. M. Iye & A. F. M. Moorwood, 962–973
- Selsing et al. (2016) Selsing, J., Fynbo, J. P. U., Christensen, L., & Krogager, J. K. 2016, A&A, 585, A87
- Shen et al. (2016) Shen, Y., Brandt, W. N., Richards, G. T., et al. 2016, ApJ, 831, 7
- Shen et al. (2008) Shen, Y., Greene, J. E., Strauss, M. A., Richards, G. T., & Schneider, D. P. 2008, ApJ, 680, 169
- Shen et al. (2011) Shen, Y., Richards, G. T., Strauss, M. A., et al. 2011, ApJS, 194, 45
- Shen et al. (2019) Shen, Y., Wu, J., Jiang, L., et al. 2019, ApJ, 873, 35
- Shimwell et al. (2022) Shimwell, T. W., Hardcastle, M. J., Tasse, C., et al. 2022, A&A, 659, A1
- Simcoe et al. (2008) Simcoe, R. A., Burgasser, A. J., Bernstein, R. A., et al. 2008, in Society of Photo-Optical Instrumentation Engineers (SPIE) Conference Series, Vol. 7014, Ground-based and Airborne Instrumentation for Astronomy II, ed. I. S. McLean & M. M. Casali, 70140U
- Simcoe et al. (2013) Simcoe, R. A., Burgasser, A. J., Schechter, P. L., et al. 2013, PASP, 125, 270
- Steidel et al. (1996) Steidel, C. C., Giavalisco, M., Pettini, M., Dickinson, M., & Adelberger, K. L. 1996, ApJ, 462, L17
- Stepney et al. (2023) Stepney, M., Banerji, M., Hewett, P. C., et al. 2023, MNRAS, 524, 5497
- Taylor et al. (2024) Taylor, A. J., Finkelstein, S. L., Kocevski, D. D., et al. 2024, arXiv e-prints, arXiv:2409.06772
- Tee et al. (2023) Tee, W. L., Fan, X., Wang, F., et al. 2023, ApJ, 956, 52
- Tody (1993) Tody, D. 1993, in Astronomical Society of the Pacific Conference Series, Vol. 52, Astronomical Data Analysis Software and Systems II, ed. R. J. Hanisch, R. J. V. Brissenden, & J. Barnes, 173
- Torres-Albà et al. (2020) Torres-Albà, N., Bosch-Ramon, V., & Iwasawa, K. 2020, A&A, 635, A57
- Vanden Berk et al. (2001) Vanden Berk, D. E., Richards, G. T., Bauer, A., et al. 2001, AJ, 122, 549
- Venemans et al. (2015) Venemans, B. P., Bañados, E., Decarli, R., et al. 2015, ApJ, 801, L11
- Venemans et al. (2013) Venemans, B. P., Findlay, J. R., Sutherland, W. J., et al. 2013, ApJ, 779, 24
- Vestergaard & Osmer (2009) Vestergaard, M. & Osmer, P. S. 2009, ApJ, 699, 800
- Vestergaard & Peterson (2006) Vestergaard, M. & Peterson, B. M. 2006, ApJ, 641, 689
- Vestergaard & Wilkes (2001) Vestergaard, M. & Wilkes, B. 2001, in Astronomical Society of the Pacific Conference Series, Vol. 247, Spectroscopic Challenges of Photoionized Plasmas, ed. G. Ferland & D. W. Savin, 359
- Vito et al. (2022) Vito, F., Mignoli, M., Gilli, R., et al. 2022, A&A, 663, A159
- Wang et al. (2021a) Wang, F., Fan, X., Hennawi, J., et al. 2021a, A SPectroscopic survey of biased halos In the Reionization Era (ASPIRE): A JWST Quasar Legacy Survey, JWST Proposal. Cycle 1, ID. #2078
- Wang et al. (2017) Wang, F., Fan, X., Yang, J., et al. 2017, ApJ, 839, 27
- Wang et al. (2016) Wang, F., Wu, X.-B., Fan, X., et al. 2016, ApJ, 819, 24
- Wang et al. (2021b) Wang, F., Yang, J., Fan, X., et al. 2021b, ApJ, 907, L1
- Wang et al. (2024) Wang, F., Yang, J., Fan, X., et al. 2024, arXiv e-prints, arXiv:2404.15413
- Wang et al. (2019) Wang, F., Yang, J., Fan, X., et al. 2019, ApJ, 884, 30
- Wang et al. (2018) Wang, F., Yang, J., Fan, X., et al. 2018, ApJ, 869, L9
- Wayth et al. (2015) Wayth, R. B., Lenc, E., Bell, M. E., et al. 2015, PASA, 32, e025
- Wenzl et al. (2021) Wenzl, L., Schindler, J.-T., Fan, X., et al. 2021, AJ, 162, 72
- Weymann et al. (1991) Weymann, R. J., Morris, S. L., Foltz, C. B., & Hewett, P. C. 1991, ApJ, 373, 23
- Wilson et al. (2004) Wilson, J. C., Henderson, C. P., Herter, T. L., et al. 2004, in Society of Photo-Optical Instrumentation Engineers (SPIE) Conference Series, Vol. 5492, Ground-based Instrumentation for Astronomy, ed. A. F. M. Moorwood & M. Iye, 1295–1305
- Wolf et al. (2018) Wolf, C., Bian, F., Onken, C. A., et al. 2018, PASA, 35, e024
- Wolf et al. (2020) Wolf, C., Hon, W. J., Bian, F., et al. 2020, MNRAS, 491, 1970
- Wolf et al. (2024a) Wolf, C., Lai, S., Onken, C. A., et al. 2024a, Nature Astronomy, 8, 520
- Wolf et al. (2024b) Wolf, J., Salvato, M., Belladitta, S., et al. 2024b, arXiv e-prints, arXiv:2406.05118
- Wright et al. (1994) Wright, A. E., Griffith, M. R., Burke, B. F., & Ekers, R. D. 1994, ApJS, 91, 111
- Wright et al. (2010) Wright, E. L., Eisenhardt, P. R. M., Mainzer, A. K., et al. 2010, AJ, 140, 1868
- Wu et al. (2011) Wu, J., Brandt, W. N., Hall, P. B., et al. 2011, ApJ, 736, 28
- Wu & Shen (2022) Wu, Q. & Shen, Y. 2022, ApJS, 263, 42
- Wu et al. (2015) Wu, X.-B., Wang, F., Fan, X., et al. 2015, Nature, 518, 512
- Yang et al. (2024) Yang, D.-M., Schindler, J.-T., Nanni, R., et al. 2024, MNRAS, 528, 2679
- Yang et al. (2023) Yang, J., Fan, X., Gupta, A., et al. 2023, arXiv e-prints, arXiv:2302.01777
- Yang et al. (2021) Yang, J., Wang, F., Fan, X., et al. 2021, ApJ, 923, 262
- Yang et al. (2020a) Yang, J., Wang, F., Fan, X., et al. 2020a, ApJ, 897, L14
- Yang et al. (2020b) Yang, J., Wang, F., Fan, X., et al. 2020b, ApJ, 904, 26
- Yang et al. (2016) Yang, J., Wang, F., Wu, X.-B., et al. 2016, ApJ, 829, 33
- Yang & Shen (2023) Yang, Q. & Shen, Y. 2023, ApJS, 264, 9
- York et al. (2000) York, D. G., Adelman, J., Anderson, John E., J., et al. 2000, AJ, 120, 1579
- Zensus (1997) Zensus, J. A. 1997, ARA&A, 35, 607
Appendix A Broad-band photometry of the newly reported quasars
In this section, we present the AB magnitudes — corrected for Galactic extinction as described at the end of Sect. 1 — from optical to NIR bands, of all 25 newly identified quasars discussed in this paper.
We divided the sources into two tables: quasars selected from DELS+PS1 (see Sect. 2.3) are listed in Table 8, while all others are reported in Table 7.
Only for the sources selected from we report the information taken from the original catalog: ID, zphot, zphot range and probability to be a true quasar at that redshift.
| Quasar Name | RA | DEC | ref. surveys/follow-up | Cat. ID | Cat. | Cat. range | Cat. pqso (%) | |||||||||
|---|---|---|---|---|---|---|---|---|---|---|---|---|---|---|---|---|
| (1) | (2) | (3) | (4) | (5) | (6) | (7) | (8) | (9) | (10) | (11) | (12) | (13) | (14) | (15) | (16) | (17) |
| PSO J004.126135.9420 | 4.12608 | 35.94206 | 20.870.03 | 21.010.11 | 20.200.07 | 19.840.15 | 20.230.07 | 20.160.15 | DES,VHS,WISE | 1052413943 | 6.05 | 5.7-6.25 | 99.01 | |||
| PSO J011.170737.1195 | 11.17069 | 37.11954 | 24.280.33 | 20.770.02 | 20.730.06 | 20.370.08 | 19.890.15 | 20.110.06 | 20.350.16 | DES,VHS,WISE | 1093239958 | 6.25 | 6.15-6.95 | 99.52 | ||
| PSO J017.448248.7625 | 17.44821 | 48.76258 | 22.330.04 | 20.590.01 | 20.650.03 | 20.830.10 | 20.730.14 | 20.140.13 | 19.930.15 | 20.190.06 | 20.120.12 | DES,VHS,WISE | 1142387513 | 5.0 | 4.45-5.3 | 99.75 |
| MQC J021.371219.1450r | 21.37128 | 19.14503 | 21.560.10 | 19.830.01 | 20.210.03 | 19.590.04 | 19.620.09 | 19.080.09 | 18.250.05 | 18.490.09 | PS1,UHS,WISE | |||||
| PSO J035.260518.9787 | 35.26053 | 18.97877 | 22.120.03 | 20.460.01 | 20.370.02 | 20.280.06 | 20.300.06 | 19.770.13 | 20.370.08 | 19.950.12 | DES,VHS,WISE | 1267014001 | 5.0 | 4.4-5.65 | 98.51 | |
| PSO J060.038165.7335 | 60.03819 | 65.73352 | 23.110.10 | 20.470.02 | 20.720.10 | 20.380.08 | 20.180.24 | 20.170.05 | 20.060.08 | DES,VHS,CatWISE | ||||||
| PSO J070.936851.3424 | 70.936859 | 51.34243 | 22.280.03 | 20.770.01 | 20.540.02 | 20.490.07 | 20.730.20 | 20.270.20 | 20.510.29 | 20.170.05 | 20.090.09 | DES,VHS,WISE | 1500056114 | 5.05 | 4.3-5.5 | 99.93 |
| PSO J075.580518.7999 | 75.58052 | 18.79990 | 23.400.11 | 21.340.03 | 20.960.04 | 20.840.11 | 20.790.14 | 20.370.07 | 20.040.11 | PS1,DES,VHS,WISE | 1523525887 | 5.35 | 4.95-5.85 | 98.88 | ||
| PSO J078.318545.1393 | 78.31854 | 45.13936 | 22.720.05 | 20.790.01 | 20.810.03 | 20.710.08 | 20.520.11 | 20.260.24 | 20.190.05 | 20.360.11 | DES,VHS,WISE | 1540630274 | 5.0 | 4.9-5.3 | 98.24 | |
| PSO J082.206838.5674 | 82.20688 | 38.56745 | 22.270.03 | 20.360.01 | 20.160.01 | 20.060.04 | 19.890.07 | 19.130.13 | 18.820.02 | 18.740.03 | DES,VHS,WISE | 1558678317 | 5.05 | 4.83-5.3 | 98.39 | |
| PSO J091.385731.9921 | 91.38576 | 31.99210 | 22.230.04 | 20.590.01 | 20.370.02 | 20.210.05 | 20.350.12 | 20.090.24 | 19.950.05 | 20.080.11 | DES,VHS,WISE | 159854908 | 5.15 | 4.7-5.7 | 99.73 | |
| MQC J133.262202.7132r | 133.26225 | 2.71322 | 22.060.10 | 20.870.03 | 20.770.06 | 21.310.20 | 20.750.13 | 21.290.41 | PS1,CatWISE | |||||||
| PSO J143.602521.8856 | 143.60254 | 21.88560 | 22.450.16 | 20.560.06 | 20.570.11 | 20.010.16 | 19.460.18 | PS1,VHS | ||||||||
| PSO J200.526913.3985r | 200.52692 | 13.39853 | 22.240.13 | 20.670.03 | 20.460.03 | 20.490.07 | 20.170.13 | 19.870.13 | 19.620.05 | 19.390.07 | PS1,VHS,AllWISE | |||||
| PSO J273.279338.8379 | 273.27936 | 38.83790 | 23.260.24 | 22.520.10 | 20.790.05 | 20.870.12 | 20.270.15 | 19.540.17 | 20.010.06 | 20.050.10 | PS1,UHS,CatWISE | |||||
| PSO J307.745547.3164 | 307.74553 | 47.31643 | 22.970.06 | 21.200.02 | 20.880.03 | 20.600.07 | 20.520.15 | 20.470.20 | 20.390.26 | 20.270.07 | 20.230.15 | DES,VHS,WISE | 891420573 | 5.25 | 4.45-5.8 | 99.29 |
| PSO J311.809264.9840 | 311.80923 | 64.98403 | 22.720.08 | 21.050.03 | 20.960.04 | 21.030.16 | 20.870.17 | 20.900.12 | DES,VHS,WISE | 878441541 | 5.0 | 4.45-5.75 | 98.94 | |||
| PSO J334.690563.0657 | 334.69056 | 63.06573 | 21.220.04 | 21.300.12 | 20.790.12 | 20.510.27 | 20.630.09 | DES,VHS,WISE | 956655457 | 6.15 | 5.65-6.35 | 99.28 | ||||
| PSO J335.617215.6807 | 335.61728 | 15.68079 | 21.250.06 | 19.570.04 | 19.840.02 | 19.190.12 | 19.040.04 | 19.020.04 | PS1,NTT/SofI,CatWISE |
| Quasar Name | RA | DEC | ref. surveys/follow up | ref. | ||||||||
| (1) | (2) | (3) | (4) | (5) | (6) | (7) | (8) | (9) | (10) | (11) | (12) | (13) |
| New discoveries | ||||||||||||
| PSO J016.709706.1237 | 16.70975 | 6.12368 | 23.06 | 22.020.14 | 21.010.14 | 21.270.08 | 21.120.2 | 20.750.19 | 20.520.12 | 20.440.10 | DELS DR7,NTT/SofI | 1 |
| PSO J037.396808.1397 | 37.39686 | 8.13970 | 23.16 | 22.030.05 | 20.890.16 | 21.120.09 | 20.600.13 | 20.770.34 | DELS DR5,NTT/SofI | 1 | ||
| PSO J041.461806.6525 | 41.46186 | 6.65254 | 22.88 | 21.520.05 | 20.740.12 | 20.070.08 | 20.0710.16 | 20.280.21 | 20.890.15 | DELS DR7,NTT/SofI,UKIDSS | 1 | |
| PSO J067.681914.7614 | 67.6819 | 14.7614 | 22.5 | 21.520.08 | 20.770.21 | 20.710.09 | 20.230.05 | 19.860.04 | 19.900.07 | 19.600.12 | DELS DR5,NTT/SofI | 1 |
| PSO J217.071404.9084 | 217.07142 | 4.90844 | 23.15 | 22.350.11 | 21.450.17 | 21.050.05 | 20.260.08 | 20.230.17 | DELS DR7,NTT/SofI | 1 | ||
| PSO J289.374950.0537 | 289.37498 | 50.05371 | 23.0 | 21.920.07 | 21.020.18 | 20.590.05 | 20.470.06 | 21.190.11 | DELS DR6,NOT/NOTCam | 1 | ||
| New spectra publication | ||||||||||||
| PSO J062.869309.1305 | 62.86929 | 9.13050 | 22.53 | 20.680.03 | 20.040.06 | 19.920.04 | 19.520.21 | 19.550.05 | 19.460.10 | DELS DR5,NTT/SofI,VHS DR6 | 2,3 | |
| PSO J127.383241.2945 | 127.38319 | 41.29456 | 23.04 | 21.320.04 | 20.580.12 | 20.250.15 | 20.370.09 | 19.890.14 | DELS DR6,UHS | 3 | ||
| PSO J129.407649.4834 | 129.40766 | 49.48343 | 22.88 | 20.690.02 | 19.850.07 | 20.180.17 | 20.060.07 | 19.260.07 | DELS DR6,UHS | 3 | ||
| PSO J162.079501.1612 | 162.07951 | 1.16123 | 22.96 | 21.960.07 | 20.950.15 | 20.820.10 | 20.480.08 | 20.570.11 | 20.470.10 | 19.950.14 | DELS DR7,UKIDSS,NTT/SofI | 4 |
| PSO J164.532129.5115 | 164.53218 | 29.51159 | 22.96 | 21.570.06 | 20.590.09 | 21.060.16 | 20.940.33 | DELS DR7 | 5 | |||
| PSO J354.529321.7328 | 354.52930 | 21.73282 | 23.03 | 21.860.07 | 20.880.14 | 20.770.17 | 20.720.18 | 21.010.14 | 20.750.26 | DELS DR7,NOT/NOTCam | 5 | |
Appendix B DELSPS1 candidates already reported as high-z quasars in the literature
In this Appendix we list the candidates selected from the combination of both DELS and PS1 data (described in Section 2.3) that have been already published in the literature.
These are 16 quasars at redshift between 6.4 and 7.0.
In Table 9 we report quasar name, coordinates, redshift, photometric information and reference papers.
The photometric properties include new NIR imaging follow-up data for the quasar PSO J13716 and PSO J02728.
This latter was observed with th , and filters of the NTT/SofI instrument on November 20, 2020 (900s in and bands and 1200s in band).
We observed PSO J13716 in and -band filters with NTT/SofI on January 23, 2023, for a total exposure time of 1800 and 1200s, respectively.
The images were reduced with the same procedure described in Sect. 3.1.
We further report the radio detection of the quasar PSO J18445.
It is clearly detected (5) in the LOFAR LoTSS survey.
From a Gaussian fit performed by using the CASA software, we measured a peak flux density of Jy.
We calculated the value of R following the same steps applied to PSO J16429 (described in the main text, section 4.1.9).
We estimated a value of 155, which classifies the source as radio loud.
However, as for PSO J16429, PSO J18445 is not detected in other published radio surveys, therefore additional multi-band radio data will be essential to reinforce this classification.
| Quasar Name | RA | Dec | m1450 | M1450 | ref. surveys/follow up | References | |||||||||
|---|---|---|---|---|---|---|---|---|---|---|---|---|---|---|---|
| (1) | (2) | (3) | (4) | (5) | (6) | (7) | (8) | (9) | (10) | (11) | (12) | (13) | (14) | (15) | (16) |
| PSO J00915 | 9.65040 | 15.45656 | 7.0210.005 | 19.93 | 27.10 | 22.96 | 21.650.08 | 20.580.11 | 19.670.07 | 19.520.06 | 19.370.05 | 19.640.06 | 19.790.16 | DELS DR5,UKIRT/WFCAM | 1 |
| PSO J01109 | 11.38986 | 09.03249 | 6.46950.0002 | 20.85 | 25.96 | 22.25 | 21.350.04 | 20.540.10 | 20.770.07 | 20.620.24 | 20.740.34 | 20.460.11 | 20.910.37 | DELS DR8,MPG2.2m/GROND,RC20 | 2, 3 |
| PSO J02728 | 27.21960 | 28.44422 | 6.540.03 | 20.79 | 26.09 | 22.68 | 21.680.03 | 20.820.14 | 21.860.15 | 21.450.16 | 20.880.14 | 20.080.06 | 20.140.16 | DELS DR8,NTT/SofI | 4, This work |
| PSO J06201 | 62.53771 | 01.65552 | 6.9950.001 | 21.33 | 25.60 | 22.95 | 22.040.06 | 21.150.21 | 20.670.07 | 20.800.13 | 20.260.10 | 20.440.08 | 20.150.15 | DELS DR10,NTT/SofI | 5 |
| PSO J12939 | 129.94534 | 39.00319 | 6.90460.0003 | 20.63 | 26.29 | 23.05 | 20.990.03 | 20.250.09 | 20.360.20 | 19.190.03 | 19.050.07 | DELS DR6,UHS | 6, 7 | ||
| PSO J13716 | 137.55678 | 16.94163 | 6.7190.005 | 21.3 | 25.57 | 22.84 | 22.010.07 | 20.810.16 | 21.030.13 | 20.800.09 | 20.440.08 | 21.150.19 | 20.300.20 | DELS DR6,UKIRT/WFCAM,NTT/SofI | 6, 7, This work |
| PSO J14000 | 140.33566 | 00.12303 | 6.56540.0002 | 22.05 | 24.79 | 22.68 | 21.650.04 | 20.880.16 | 21.250.09 | 20.860.15 | 20.390.09 | 19.790.05 | 19.320.08 | DELS DR8,RC20 | 7, 8 |
| PSO J14004 | 140.94633 | 04.04844 | 6.6120.002 | 20.67 | 26.18 | 23.04 | 21.210.02 | 20.220.09 | 20.110.08 | 19.870.13 | 19.420.07 | 19.210.03 | 19.060.06 | DELS DR8,RC20 | 7, 8 |
| PSO J16621 | 166.08997 | 21.57467 | 6.7660.005 | 20.21 | 26.67 | 22.94 | 21.100.03 | 19.950.06 | 19.930.12 | 19.990.06 | 19.900.13 | DELS DR7,UHS | 6, 7 | ||
| PSO J16713 | 167.64159 | 13.49602 | 6.5080.001 | 21.25 | 25.57 | 22.86 | 21.070.06 | 20.490.11 | 21.170.09 | 20.210.26 | DELS DR3,VIKING,RC20 | 9 | |||
| PSO J17218 | 172.35569 | 18.77342 | 6.823 | 21.08 | 25.81 | 23.22 | 21.610.05 | 20.740.09 | 20.880.11 | 21.350.24 | 21.060.18 | 21.250.20 | DELS DR7,NOT/NOTCam | 10 | |
| PSO J17350 | 173.78721 | 50.1925 | 6.580.03 | 20.65 | 26.19 | 22.99 | 20.710.03 | 20.080.08 | 20.430.17 | 19.930.05 | 19.77.010 | DELS DR8,RC20 | 6 | ||
| PSO J18445 | 184.11489 | 45.31968 | 6.6480.003 | 21.27 | 25.59 | 23.00 | 21.540.07 | 20.670.09 | 21.010.13 | 20.050.06 | 19.800.10 | DELS DR6,UKIRT/WFCAM | 6, 7 | ||
| PSO J24724 | 247.29708 | 24.12770 | 6.4760.004 | 20.28 | 26.53 | 22.70 | 20.760.03 | 19.980.07 | 20.190.09 | 19.370.03 | 19.290.06 | DELS DR8,CAHA 3.5 m/Omega2000 | 2 | ||
| PSO J26119 | 261.03643 | 19.02861 | 6.4800.001 | 21.12 | 25.70 | 22.86 | 21.490.05 | 20.930.13 | 20.250.23 | 20.570.09 | 20.380.17 | DELS DR7,UHS | 2, 7 | ||
| PSO J33829 | 338.22982 | 29.50898 | 6.6550.003 | 20.78 | 26.08 | 22.50 | 21.100.05 | 20.240.09 | 20.300.14 | 20.460.08 | 21.070.33 | DELS DR7,UHS | 7, 9 |
Appendix C Rejected candidates
C.1 Candidates discarded from MQC and from YS23
In Table 10 we report the sources discarted from our list of candidates selected from the MQC because of a further cross-match with SIMBAD and SDSS DR18: two objects are true quasars at already published, two sources are classified as galaxies, and for the remaining 6 the SDSS spectral classification is unclear (and beyond the scope of this paper), but they are not quasars at .
Instead, visual inspection of the optical and NIR images of the YS23 candidates led us to discard 5 sources (see Table 11): 4 objects with no signal at all in the optical bands and 1 object that is only detected as a bright and extended source in band Decals.
We note that for each of these discarded sources from the YS23 catalog, the probability of being high- quasars reported in the catalog is greater than 98.57%.
| Name | RA | Dec | z | Obj Class | Ref. |
|---|---|---|---|---|---|
| (1) | (2) | (3) | (4) | (5) | (6) |
| J130649+615233 | 196.70701 | 61.87586 | 4.25 | quasar | 1 |
| J103720+421326 | 159.33672 | 42.22392 | 4.2 | quasar | 2 |
| J091515+333840 | 138.81547 | 33.64465 | -a | unknown | 3 |
| J021303+003811 | 33.26575 | 0.63663 | 0.7 | galaxy | 4 |
| J091618+005134 | 139.07809 | 0.85960 | 1.53 | galaxy | 3 |
| J090515+352624 | 136.31625 | 35.44011 | -a | unknown | 3 |
| J114926+150817 | 177.35931 | 15.13811 | -a | unknown | 3 |
| J092323+271512 | 140.84719 | 27.25342 | -a | unknown | 3 |
| J163132+445849 | 247.88476 | 44.98035 | -a | unknown | 3 |
| J234806+022828 | 357.02508 | 2.47447 | -a | unknown | 3 |
| Cat. ID | RA | Dec | Comment |
|---|---|---|---|
| (1) | (2) | (3) | (4) |
| 1238878646 | 31.49982 | 3.09267 | no signal |
| 1081134814 | 8.53176 | 1.29155 | no signal |
| 1336715064 | 41.85627 | 2.21061 | no signal |
| 1326787943 | 40.74876 | 2.84063 | no signal |
| 979248393 | 342.59386 | 2.32348 | bright object |
| only in band |
C.2 Spectroscopically rejected candidates
Table 12 lists 73 candidates whose spectra showed they were not high- quasars.
Objects with a CLASS value of 1 are cool dwarfs, while sources with a CLASS value of 2 and 3 are more likely low-z galaxies and unknown-type objects, respectively.
A thorough classification of these objects is beyond the scope of this work.
We note that two sources (PSO J02745 and PSO J04760) have been classified as ultra cool dwarf by dal Ponte et al. (2023).
The radio candidate ILT J00103239 as been classified as a M7 dwarf by Gloudemans et al. (2023).
Also, three objects from the YS23 catalog, with a probability of being quasars larger than 99%, turned out to be contaminants after a dedicated spectroscopic follow-up with NTT/EFOSC2: YS J04129 belongs to CLASS number 3, YS J04934 is a cool dwarf (CLASS 1) and YS J06628 turned out to be a low galaxy (CLASS 2).
| Rejected | RA | Dec | Telescope | Date | CLASS | Rejected | RA | Dec | Telescope | Date | CLASS |
|---|---|---|---|---|---|---|---|---|---|---|---|
| Candidate | (J2000) | (J2000) | Instrument | Candidate | (J2000) | (J2000) | Instrument | ||||
| (1) | (2) | (3) | (4) | (5) | (6) | (7) | (8) | (9) | (10) | (11) | (12) |
| ILT J00103239g | 02.5364 | 32.6504 | LBT/MODS | 2023/11/11 | 1 | PSO J00303 | 03.0822 | 03.7675 | LBT/MODS | 2023/11/12 | 1 |
| PSO J00804 | 08.3993 | 04.9334 | LBT/MODS | 2023/11/13 | 1 | PSO J01046 | 10.0308 | 46.4924 | LBT/MODS | 2023/11/12 | 3 |
| PSO J01236 | 12.0151 | 36.5762 | LBT/MODS | 2023/11/13 | 1 | PSO J02745a | 27.9230 | 45.5284 | NTT/EFOSC2 | 2024/01/24 | 1 |
| ILT J01573042 | 29.3863 | 30.7092 | LBT/MODS | 2023/11/13 | 2 | PSO J03904 | 39.9339 | 04.4616 | LBT/MODS | 2023/11/13 | 3 |
| MALS J02401719 | 40.0717 | 17.3222 | LBT/MODS | 2024/12/05 | 1 | YS J04129b | 41.1159 | 29.0798 | NTT/EFOSC2 | 2022/12/27 | 3 |
| PSO J04760 | 47.0409 | 60.8559 | NTT/EFOSC2 | 2024/01/27 | 1 | YS J04934b | 49.9160 | 34.3035 | NTT/EFOSC2 | 2022/12/27 | 1 |
| PSO J06003 | 60.2691 | 03.9825 | NTT/EFOSC2 | 2023/12/01 | 3 | YS J06628b | 66.5230 | 28.7629 | NTT/EFOSC2 | 2023/11/29 | 2 |
| PSO J06926 | 69.6370 | 26.8314 | NTT/EFOSC2 | 2023/12/02 | 1 | PSO J09957 | 99.7872 | 57.5060 | LBT/MODS | 2023/11/12 | 1 |
| PSO J11769 | 117.2528 | 69.6421 | NTT/EFOSC2 | 2024/01/24 | 1 | PSO J11233 | 112.1840 | 33.2182 | LBT/MODS | 2020/12/25 | 1 |
| PSO J13904a | 139.7676 | 04.2978 | NTT/EFOSC2 | 2024/01/24 | 1 | PSO J14527 | 145.5390 | 27.2683 | NTT/EFOSC2 | 2024/01/25 | 1 |
| PSO J15347 | 153.3546 | 47.6594 | LBT/MODS | 2023/04/19 | 1 | PSO J15523 | 155.3345 | 23.3206 | LBT/MODS | 2023/04/01 | 1 |
| MALS J10441412 | 161.0521 | 14.2127 | NTT/EFOSC2 | 2024/01/24 | 2 | PSO J16212 | 162.3426 | 12.6113 | NTT/EFOSC2 | 2022/02/04 | 1 |
| NVSS J16302 | 163.6297 | 02.0645 | NTT/EFOSC2 | 2022/02/04 | 3 | PSO J17028 | 170.6294 | 28.7200 | NTT/EFOSC2 | 2022/02/05 | 1 |
| PSO J17216 | 172.0984 | 16.0280 | NTT/EFOSC2 | 2022/02/04 | 1 | ILT J11404202 | 175.0467 | 42.0335 | LBT/MODS | 2023/06/13 | 3 |
| PSO J18130 | 181.2624 | 30.4606 | LBT/MODS | 2023/06/10 | 1 | PSO J18229 | 182.2378 | 29.9385 | NTT/EFOSC2 | 2022/02/05 | 1 |
| PSO J18205 | 182.3792 | 05.2293 | LBT/MODS | 2023/06/10 | 1 | PSO J18211 | 182.7458 | 11.1742 | LBT/MODS | 2023/04/01 | 3 |
| PSO J18283 | 182.7718 | 83.6176 | LBT/MODS | 2023/03/05 | 1 | PSO J18464 | 184.1091 | 64.8172 | LBT/MODS | 2023/06/08 | 1 |
| PSO J18680 | 186.1962 | 80.4875 | LBT/MODS | 2023/04/20 | 1 | PSO J18660 | 186.2609 | 60.5096 | LBT/MODS | 2023/06/08 | 1 |
| PSO J18708 | 187.1222 | 08.6590 | LBT/MODS | 2023/06/10 | 1 | MQC J12391617 | 189.8990 | 16.2973 | NTT/EFOSC2 | 2024/01/24 | 1 |
| PSO J19507 | 195.3068 | 07.2171 | NTT/EFOSC2 | 2022/02/04 | 1 | PSO J19586 | 195.6339 | 86.8951 | LBT/MODS | 2023/04/01 | 1 |
| PSO J19510 | 195.6990 | 10.0122 | LBT/MODS | 2023/06/10 | 3 | RACS J19840 | 198.7974 | 40.1505 | LBT/MODS | 2023/06/10 | 2 |
| ILT J13265429c | 201.5518 | 54.4944 | LBT/MODS | 2023/06/08 | 1 | RACS J20640 | 206.9889 | 40.3283 | LBT/MODS | 2023/06/10 | 2 |
| ILT J14074252 | 211.9176 | 42.8708 | LBT/MODS | 2023/06/07 | 2 | ILT J14314635 | 217.8540 | 46.5862 | LBT/MODS | 2023/06/07 | 1 |
| PSO J22205 | 222.3130 | 05.7496 | LBT/MODS | 2023/03/28 | 1 | NVSS J22511 | 225.2889 | 11.9584 | NTT/EFOSC2 | 2022/02/04 | 2 |
| ILT J15046258 | 226.1189 | 62.9802 | LBT/MODS | 2023/06/13 | 1 | PSO J22717 | 227.0505 | 17.3678 | LBT/MODS | 2023/04/01 | 1 |
| PSO J233+05 | 233.2398 | 05.4933 | LBT/MODS | 2023/06/08 | 1 | PSO J23409 | 234.5534 | 09.4578 | LBT/MODS | 2023/04/21 | 1 |
| RACS J23440 | 234.6786 | 40.4477 | LBT/MODS | 2023/06/10 | 1 | PSO J245+18 | 245.1485 | 18.6299 | LBT/MODS | 2023/06/08 | 1 |
| ILT J16235427 | 245.8994 | 54.4526 | LBT/MODS | 2023/06/13 | 3 | ILT J16294156 | 247.4075 | 41.9488 | LBT/MODS | 2023/06/08 | 3 |
| PSO J24710 | 247.8238 | 10.2805 | LBT/MODS | 2023/06/09 | 3 | PSO J25000 | 250.5826 | 00.9124 | LBT/MODS | 2023/04/21 | 1 |
| PSO J25300 | 253.1887 | 00.5648 | LBT/MODS | 2023/06/08 | 3 | PSO J25307 | 253.5664 | 07.4414 | LBT/MODS | 2023/06/08 | 1 |
| PSO25425 | 254.7461 | 25.6797 | LBT/MODS | 2023/04/18 | 1 | PSO J26220 | 262.6972 | 20.9801 | LBT/MODS | 2023/06/08 | 1 |
| PSO J26654 | 266.5850 | 54.9565 | LBT/MODS | 2023/06/09 | 1 | PSO J26919 | 269.8055 | 19.6993 | LBT/MODS | 2023/06/10 | 1 |
| RACS J27940 | 279.1253 | 40.6443 | LBT/MODS | 2023/06/13 | 1 | PSO J28158 | 281.8065 | 58.8070 | LBT/MODS | 2020/06/06 | 1 |
| PSO J29058 | 290.3967 | 58.9075 | LBT/MODS | 2023/06/08 | 1 | PSO J33109 | 331.9305 | 09.3771 | LBT/MODS | 2023/05/28 | 1 |
| PSO J33329 | 333.0793 | 29.2715 | LBT/MODS | 2022/10/20 | 1 | PSO J35018 | 350.3733 | 18.8181 | LBT/MODS | 2023/11/11 | 1 |
| PSO J35107 | 351.4983 | 07.0055 | LBT/MODS | 2023/11/13 | 1 | PSO J35320 | 353.0240 | 20.3663 | LBT/MODS | 2023/11/12 | 1 |
| PSO J35928 | 359.2352 | 28.8194 | LBT/MODS | 2023/11/12 | 1 |