2 Department of Computer Science and Engineering, Shiv Nadar Institute of Eminence, Delhi-NCR, Uttar Pradesh, India, Email: suchi.singh24@gmail.com, ut353@snu.edu.in.
3 School of Computer Science and Engineering, Hail University, KSA, Email: m.alsaffar@uoh.edu.sa.
Impact of Distance on Epidemiological Dynamics in Human Connection Network with Mobility
Abstract
: The spread of infectious diseases is often influenced by human mobility across different geographical regions. Although numerous studies have investigated how diseases like SARS and COVID-19 spread from China to various global locations, there remains a gap in understanding how the movement of individuals contributes to disease transmission on a more personal or human-to-human level. Typically, researchers have employed the concept of metapopulation movement to analyze how diseases move from one location to another. This paper shifts focus to the dynamics of disease transmission, incorporating the critical factor of distance between an infected person and a healthy individual during human movement. The study delves into the impact of distance on various parameters of epidemiological dynamics throughout human mobility. Mathematical expressions for important epidemiological metrics, such as the basic reproduction number () and the critical infection rate (), are derived in relation to the distance between individuals. The results indicate that the proposed model closely aligns with observed patterns of COVID-19 spread based on the analysis done on the available datasets.
Keywords:
Complex Network, Epidemic Spreading, Contact Network, Random Geometry, human mobility0.1 Introduction
Complex networks are powerful tools for modeling real-world systems, with applications in areas like biological network chen2024simplicial , social networks kumar2021quantum ; kumari2024novel , communication networks kumari2017modeling , and so on. They are particularly useful for studying the spread of information or diseases within a network. The major tasks include identifying nodes that can maximize information spread, minimize rumors, or reveal superspreaders in epidemics or computer viruses. Previous approaches require understanding the spreading abilities of nodes, often involving costly simulations like Monte Carlo methods in propagation models such as SIR. These models aim to understand epidemic dynamics and provide accurate predictions of spread over time and across locations, whether nationally or globally cooper2020sir . Most models fall under the category of “compartmental models” where the population is divided into compartments representing healthy individuals, the infected, the ill, the deceased, the recovered, and others purkayastha2021comparison . The transitions between these compartments are governed by a system of interconnected ordinary differential equations (ODEs) reyne2022principles .
Many epidemic models operate on the fundamental assumption of population homogeneity, implying that everyone has an equal chance of encountering someone new. This assumption is valid for local epidemics confined to a single community, where it allows the model to be simplified into mean field equations. However, this approach no longer applies to larger populations. Individuals who commute between locations play a crucial role in spreading diseases on a national and global scale, acting as infection carriers in new areas balcan2009multiscale . This process, which is influenced by movement and interaction across regions, cannot be adequately captured by traditional compartmental models. In their research, the authors explored the behavior of positive solutions to a reaction-diffusion system with Neumann boundary conditions, which is a more suitable approach for modeling such phenomena.
Recent advancements include network models that deviate from the assumption of homogeneous mixing silva2023epidemic . These models use ordinary differential equations (ODEs) by averaging encounters into grouped contagion rate coefficients, accounting for well-defined groups with either homogeneous or heterogeneous mixing conditions arquam2020impact ; arquam2020integrating . Traditionally, analytical studies on epidemic dissemination have predominantly focused on compartmental epidemic models grounded in ordinary differential equations. In scale-free networks, Liu et al. liu2011epidemic presented an SEIRS epidemic model in which the number of active contacts at each vertex was either constant or proportional to its degree. It is important to note that contemporary research often employs various differential equations to study the complex dynamics of epidemic spread. These are the most popular ways of studying and examining the complex dynamic system of epidemic spread. When looking at how epidemic spread, the dynamics of their distribution must be studied. In the event of an epidemic spreading from one location to another, geometric parameters must be examined.
This paper focused on the geometric distance and its impact on epidemic spreading in human connections and networks with mobility. Hence, this paper’s objectives are:
-
•
Development of Novel Approach: Develops a method to differentially parameterized SIR models of epidemics to geometric distance parameters.
-
•
Distance Analysis of Epidemic Spread: Study the geometric distances in people and how it affects the spread of diseases.
-
•
Framework Model Development: Create formulas for epidemiological data like the basic reproduction number and critical infection rate based on distance.
-
•
Human Mobility Modeling in Epidemic Spread: Integrate human movement and migration flows concerning disease spread in different places.
-
•
Real Data Model Assessment: Test the model with real data from the COVID-19 pandemic and compare it with infection dynamics observed in real life.
The paper is organised as follows: Section 2 offers a comprehensive review of the existing literature and relevant research on epidemic spreading. Section 3 presents a detailed description of the proposed model, including its key components and processes. The dynamics of epidemic transmission are explored, and the basic reproduction number is calculated to aid in understanding how epidemics propagate within the network. Section 4 discusses the simulation results and analyzes the outcomes, providing insights into potential scenarios and their impacts. Finally, Section 5 summarizes the findings and highlights possible directions for future research and development in this area. This structure enables a thorough examination of the epidemic spreading model within the SIR framework, focusing on geometric distance and its influence.
0.2 Literature survey
This section reviews related research in the field of epidemic spreading for various diseases. Samsuzzoha et al. samsuzzoha2012numerical developed a diffusive epidemic model to describe the spread of influenza. They introduced a vaccinated diffusive compartmental model to analyze the impact of vaccination and diffusion on influenza transmission dynamics. Epidemics often spread through the movement of infected individuals between locations. To model this, some metapopulation models simulate the effects of migration, linking local communities through a network of places or “patches” and using a transfer matrix to describe interactions between them brauer2017mathematical . Most of these models focus on the global spread of diseases, assuming unidirectional travel and capturing worldwide transmission dynamics kirkeby2021practical ; baker2022infectious .
Within the category of metapopulation models, both stochastic and deterministic types are commonly used, differing in their level of resolution. Some models, for example, focus only on the population density at each location. In these cases, population transfer between patches is handled by decreasing the population of one patch and increasing the population of another. Researchers introduce an efficient algorithm for modeling commuting in metapopulation models, which avoids the need for complex individual-level formulations or the expansion of epidemic models to account for a large number of patches pardo2023epidemic ; wang2021final . Other models, which track the position of everyone, offer greater precision. These models can incorporate important factors that simpler models may overlook, such as typical travel behaviors or the presence of “super spreaders”, individuals who visit multiple locations simultaneously costa2020outbreak . However, the main limitation of these detailed models is their high computational cost.
On a national level, travel patterns differ from random unidirectional movement in terms of both their properties and the effects they have on spreading. Individuals typically commute regularly to the same destination, such as an office or other nearby locations. Reverse commuting also occurs, where people spend part of their time in their “residence city” but the majority of their day at a different location, such as a workplace wang2023epidemic . Many models of metapopulation dynamics focus on unidirectional commuting, assuming that, with high commuting frequency relative to the infection rate, the system will eventually reach a steady state, regardless of the original geographic distribution. However, many models overlook reverse commuting due to the difficulty in tracking the health status of commuters at the end of their workday. When reverse commuting is considered, computational approaches often simulate each commuting group separately han2023effects .
Some methods of transmission may exhibit recurring patterns similar to those observed in infectious illnesses, however these patterns may vary in their predictability bu2022likelihood . Identifying the key factors contributing to these patterns can provide a framework for assessing treatment efficacy and guiding disease control planning kumar2022age . Ghosh et al. ghosh2021optimal proposed a deterministic compartmental model of infectious disease that incorporates test kits as a key tool for epidemic mitigation. The outbreak size and infection peaks depend highly on targeting nodes with higher degrees or centralities. Csimcsek csimcsek2022lexical introduced a Lexical Sorting Centrality (LSC) for epidemic modeling in complex networks, which is a combination of multiple centrality measures to assess the spreading capabilities of nodes. Using a sorting mechanism like lexical sorting, LSC ranks nodes more efficiently than traditional centrality measures and can better distinguish node spreading abilities with greater accuracy and speed. Contreras et al. contreras2024infection explored how different contagion models, including simple and complex contagions, influence infection patterns on a network. They found that simple contagions, spreading through individual connections, are robust, while complex contagions are sensitive to model parameters due to their reliance on the interplay between pairwise and group contagions.
Several studies focus on the analysis of the spread and mitigation of COVID-19. Zino et al. zino2021analysis reviewed the history and current state of epidemic modeling, analysis, and control in guiding public health decisions during the COVID-19 pandemic. It covers modeling approaches from early scalar differential equations to modern dynamic network models that account for spatial spread and changing human interactions. Goel et al. goel2021mobility proposed a mobility-based SIR model, considering both global connectivity and local population distribution to better understand the spreading dynamics of pandemics like COVID-19. They considered mixed population as well as real-life interaction in a complex pattern. Zhu et al. zhu2021connectedness constructed a complex network of 122 countries to analyze the global COVID-19 infection network considering some parameters such as small-world, close-world, and community structure. The analysis showed that factors such as population density, economic size, exports, and government expenditure increased network connectedness. Countries with higher economic activity and population density were more vulnerable with respect to those with better medical infrastructure had lower connectedness. Johnson johnson2024epidemic explained the importance of network topology on the spreading dynamics of diseases. He explained that the compartmental model generally overlooks the network structure and performs random mixing. But, this assumption leads to overestimations of both the herd-immunity threshold and basic reproduction number . The study suggests that the scale-free networks may be a better model for epidemics like COVID-19 than random mixing. Chen et al. chen2024simplicial investigated the impact of higher-order social interactions on COVID-19 spread and mitigation. They found that considering group interactions enhances contagion tracking and mitigation strategies, as group members spend more time together.
Li et al. li2022competing presented a model of two competing simplicial SIS epidemics on a higher-order system represented by a simplicial complex, where infections spread through both pairwise and higher-order (e.g., 2-simplex) interactions. The dynamics of infection depends on tie-strength where the system behaves like a simple graph for a weak infection strength. As the infection strength increases, an “alternative dominant” phase emerges, where the survival of one epidemic depends on initial conditions. Fan et al. fan2022epidemics explored the impact of higher-order interactions in a multilayer network model, where one layer represents a social network and the other a physical contact network. Using a microscopic Markov chain approach and Monte Carlo simulations, the research shows that the 2-simplex interactions in the social network can effectively mitigate epidemic outbreaks, especially when disease transmission rates in the physical network are low or medium.
Silva et al. silva2023epidemic investigates a SIR model considering local and global epidemic prevalence in heterogeneous networks. It was investigated that local awareness can significantly increase the epidemic threshold, delay peak prevalence, and reduce outbreak size. Li et al. li2021dynamics proposed a modified signed-SIS model to study epidemic spreading on signed networks, where edges are assigned positive or negative labels that impact transmission rates. They demonstrated that structural balance theory influences epidemic dynamics, affecting peak infection fractions and epidemic thresholds, through analysis on both random and scale-free networks. Rodriguez rodriguez2024analysis analyzed an SIS-type model and examined the influence of network topology on the spreading dynamics of viruses in the network. Through simulations, it shows that regular topologies with low node degrees, like Lattice4, facilitate faster virus extinction compared to denser or less regular topologies. The author eliminated edges and tried to convert the network into a regular graph to induce rapid virus extinction.
Key findings from the literature survey
Most researchers have considered either the meta-population concept or the radiation model to explain the spreading of infectious diseases from one location to another. But, they failed to explain the connecting pattern of individuals, and their movement from one location to another location. In this course of study, the author has demonstrated the impact of delay in epidemic spreading in human connection network arquam2019modelling . Arquam et al. arquam2020epidemic proposed a model considering change of geometric location and connecting distance of two individuals but failed to explain the impact of connecting distance. Therefore, connecting distance must be analysed while studying the epidemic spreading in human connection network.
0.3 Proposed Methodology
In this section, epidemic spreading due to human movement from one location to other location is explained. For human movement, a GNMN model arquam2020epidemic is taken to consider the human connection network in geometric region.
| Symbol | Meaning |
|---|---|
| Total number of nodes or individuals in the network | |
| Total number of edges or connections in the network | |
| Number of susceptible individuals at node at time | |
| Number of infectious individuals at node at time | |
| Number of recovered individuals at node at time | |
| Infection rate | |
| Recovery rate | |
| Euclidean distance between nodes and | |
| Threshold distance for spreading of infection | |
| Dispersion parameter controlling the effect of distance | |
| Average degree of the nodes in the network | |
| Area considered for the node’s movement | |
| Speed of node at time |
In the geometric network with mobile nodes (GNMN), the distance between two nodes plays a vital role in the spreading process of diseases in the network. Two nodes cannot infect each other beyond a threshold distance . As the spreading of the epidemic depends on the distance, the total number of connections () can be formulated in Eq. (1).
| (1) |
The first part of the fraction gives the probability of a node within the vicinity of other nodes in the network. The second component provides the fraction of time a node is in the active condition in the spreading process. The average degree () of a node is evaluated considering the distance travelled by the node within the designated area and the formulation for a random GNMN is provided in Eq. (2).
| (2) |
0.3.1 SIR model for GNMN
In 1760, Daniel Bernoulli bernoulli1760essai introduced the first mathematical framework for studying the spread of infectious diseases. Building upon this foundation, Kermack and McKendrick kermack1927contribution proposed the classical Susceptible-Infectious-Recovered (SIR) model. The following system of rate equations governs the dynamics of the SIR model:
| (3) | |||||
| (4) | |||||
| (5) |
where , , and represent the fractions of the susceptible, infected, and recovered populations at time , respectively. The parameters and denote the infection (spreading) rate and recovery rate.
Despite its historical significance, the classical SIR model does not account for heterogeneity or the underlying topology of complex networks, which are critical factors influencing epidemic dynamics in real-world scenarios. In this proposed work, SIR Epidemiological Dynamics can be explained using mean-field equation incorporating geometric network topology and change in Susceptible Individuals can be evaluated considering Eq. (6).
| (6) |
Infection spreading can be defined as,
| (7) |
Recovered dynamics can be written as,
| (8) |
The infection model incorporates an indicator function that ensures only nodes within a threshold distance contribute to the infection process. If the distance between nodes exceeds , the function becomes 0, preventing infections from occurring beyond this threshold. The rate of change of infectious individuals at node iii is determined by the product of the infection rate , the number of susceptible individuals , and the interaction term, which sums over all nodes within the threshold distance. This interaction is modulated by a Gaussian-like function , which reduces the infection probability as the distance between nodes increases. The rate of change of recovered individuals is given by , where is the recovery rate and is the number of infectious individuals at node . Finally, the change in susceptible individuals is determined by the decrease in due to infections spreading through the population.
0.3.2 Dynamical Behaviour of Epidemiological Model
The spread of infectious diseases begins when the following conditions must be satisfied, , , and .
The basic reproduction number ()
The basic reproduction number () represents the average number of secondary infections generated by a single infected individual in a fully susceptible population. It is a key parameter in epidemiology, as it helps assess the potential for disease transmission within a population. The formula for in a Generalized Network Model of Networks (GNMN) incorporates the following key parameters.
-
•
Infection rate () and recovery rate (): These parameters describe the speed at which the disease spreads and the rate at which individuals recover, respectively.
-
•
Network structure (): The average node degree represents the typical number of connections each node has in the network.
-
•
Distance (): The inclusion of spatial distance in the epidemic spread means that the distance between individuals in the network influences the likelihood of infection.
By considering the aforementioned parameters, the formulation of can be provided in Eq. (9)
| (9) |
The term represents the average number of secondary infections caused by a single infected individual before they recover. If , the network will be rapidly infected, while if is much smaller than , the infection will spread more slowly throughout the network. The term accounts for the average node degree, which reflects the connectivity of the network. The expression captures the attenuation effect of the distance threshold, ensuring that nodes beyond a certain distance have a negligible probability of infection. The last expression represents the average influence of an infected node on the infection probability of other nodes, considering the attenuation effect of distance. When exceeds , the disease can spread extensively within the population. On the other hand, when is below , the disease is less likely to establish a large outbreak. We can say that the basic reproduction number () is an important parameter in epidemiology as it helps to determine the conditions under which an epidemic can take hold and spread throughout a population.
Critical infection rate ()
The critical infection rate () is the value of the infection rate () at which the basic reproduction number () becomes greater than . In the context of distance-based epidemic spreading on a Generalized Network Model of Networks (GNMN) using a complex network approach, the critical infection rate can be derived below. From Eq. (9), the basic reproduction number can be expressed as.
As mentioned earlier, critical infection rate can be obtained when so it can be expressed as
| (10) |
Equation (10) gives the critical infection rate () at which the disease has the potential to establish a significant outbreak within the population, taking into account the distance-based effects on the spread of infection within a GNMN.
Epidemic size can be calculated as,
| (11) |
Epidemic size can be explained as the occurrence of the total infection during the epidemic process.
While spreading speed of infection in a geographical region will be,
| (12) |
Epidemic Spreading speed can be defined as the average infection rate in a particular geographical area.
0.4 Results and Analysis
This section presents the collection and analysis of real-world data on the human population across various Indian states, along with migration patterns to illustrate human connectivity using GNMN. Furthermore, COVID-19 data are incorporated to study the spread of the disease through human movement within the GNMN framework.
0.4.1 COVID-19 Spreading in various Indian States
COVID-19 data is collected from March 1, 2020, to February 1, 2021, capturing the spread of infection primarily driven by the movement of migrant workers between states, particularly Maharashtra and Uttar Pradesh. These states experienced a significant impact due to human mobility. Figure 1 illustrates the daily infection trends in Uttar Pradesh and Maharashtra, which had the highest number of migrant workers according to the 2011 Census of India.
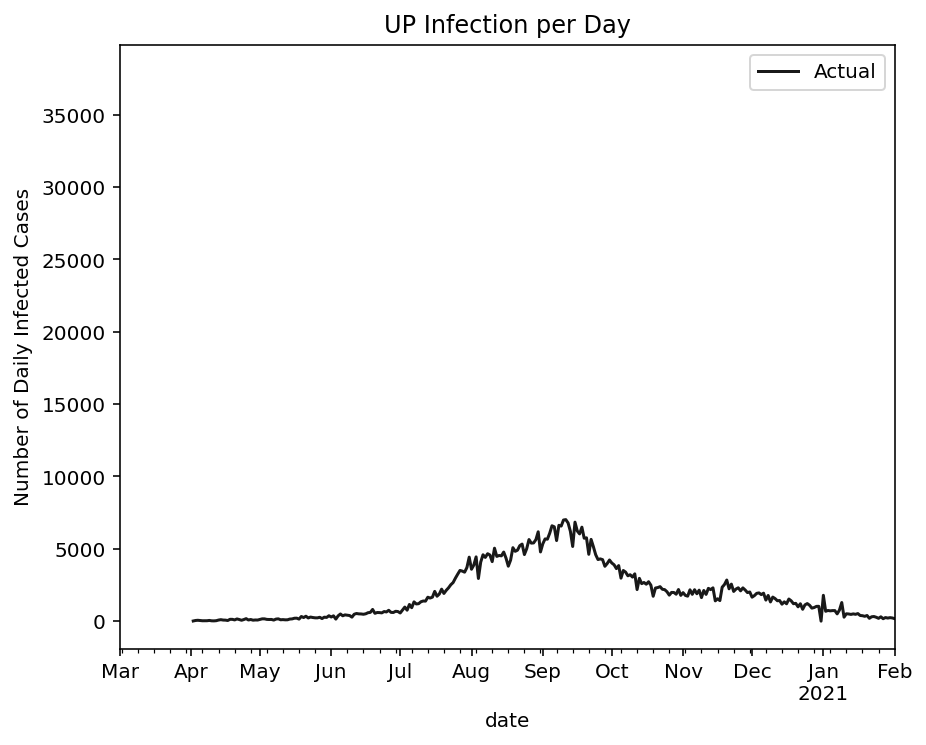
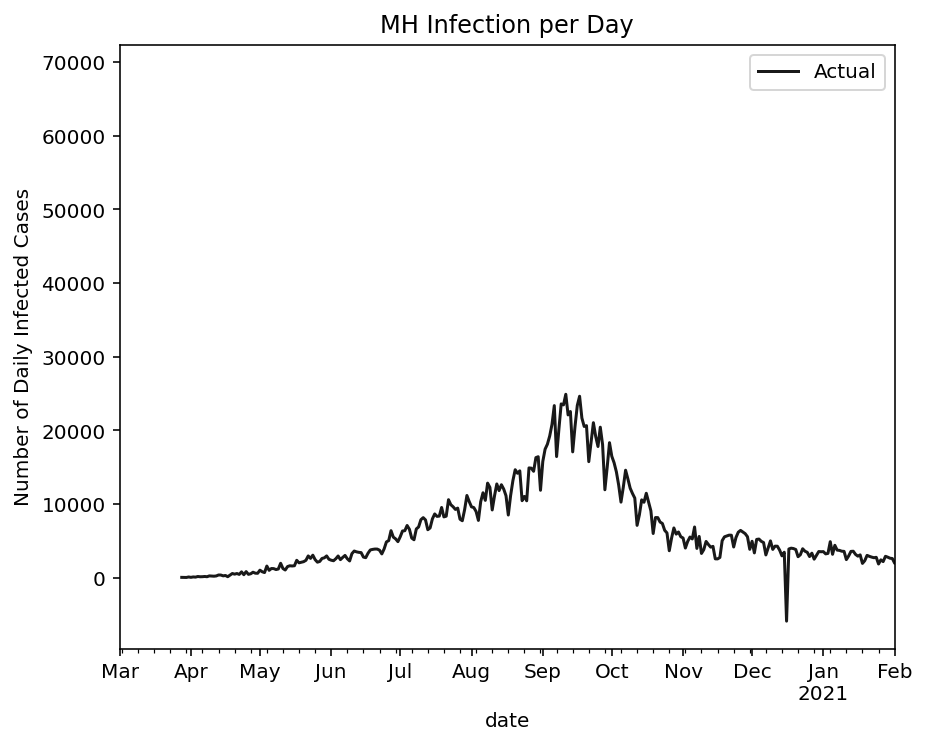
The spread of COVID-19 infections in India began in March 2020 but escalated significantly after April 2020. The infection rate remained at its peak between July and December 2020. In Uttar Pradesh, the infection peaked during August, September, and October, after which it started to decline, as illustrated in Figure 1(a). Maharashtra experienced the most severe outbreak, reaching a peak of 275,000 daily infections between September and October 2020. After December 2020, the daily infection rate stabilized, as shown in Figure 1(b).
0.4.2 Analyzing the effect of network parameters on the degree distribution of the sampled data
With the help of simulation, we aim to replicate the actual spread of COVID-19 based on real-world data. The latest COVID-19 data are sourced from the official Indian government website coronaoutbreak , while the Indian population statistics are obtained from Indian_Population . Migration data from various states are collected from Indian-migration , and information on human travel speed and resting time is derived from Brightkite cho2011friendship . COVID-19 data, including Confirmed Infections and Recovered Cases, is gathered and updated daily for each Indian state from March 1, 2020, to February 1, 2021. Since migration data are based on the 2011 Census, the Indian population data is also collected state-wise from the same census. To account for the increasing population and migration trends over time, a sampling approach is applied. The sampling is conducted after collecting data from both Indian states and migration records, given the large and outdated population data from 2011. An error margin of 1% with a confidence level of 99% is used, considering a -value of 3%. The Biostatistics model proposed by Daniel daniel2018biostatistics is applied to sample the human population accordingly and is provided in Eq. (13).
| (13) |
Where = 2.576 for a confidence level of 99%, = proportion of the population involved in the sampling, = population size, = margin of error.
In Table 2, the total number of actual and migrated populations for both the original and sampled population are presented. The analysis focuses on two states; Maharashtra and Uttar Pradesh, as they were among the most affected during the COVID-19 pandemic. Simulations are conducted to generate networks based on the sampled human population and migration data. Using the data from Tables 2 and 3, networks are constructed following the GNMN model, which examines the time of rest , and the connectivity region , within a defined spatial area.
| Indian States | Total Population | Migrated Population | ||
|---|---|---|---|---|
| Original | Sampled | Original | Sampled | |
| Maharashtra | 112374333 | 7724 | 57376776 | 3944 |
| Uttar Pradesh | 199812341 | 7724 | 56452083 | 2182 |
| Name of Parameters | Value |
|---|---|
| 2 days to 115 days | |
| Connectivity radius() | 2m |
| Velocity() | 1m/s to 50m/s |
| Area | 25000 25000 |
| Length of side () | 25000m |
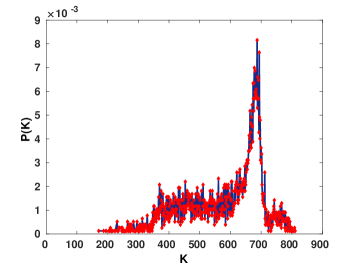
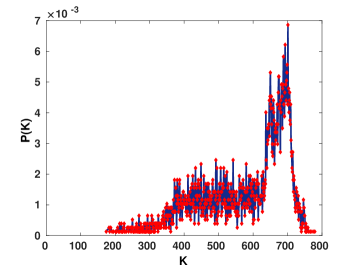
The static population and migrating population from various states moving to Uttar Pradesh are utilized to construct networks. The GNMN model is employed to establish a network of states with the highest migration influx into Uttar Pradesh. Figure 2 illustrates the degree distribution of human contact networks in Uttar Pradesh, incorporating the number of migratory individuals, their rest duration (), and the number of halting points. The higher-degree nodes corresponding to Delhi, Maharashtra, and Gujarat fall within the ranges of , , and , respectively, as depicted in Figure 2. The probabilities of high-degree nodes for these states are for Delhi, for Maharashtra, and for Gujarat.
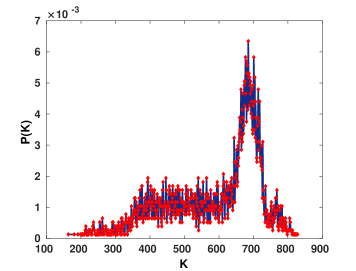
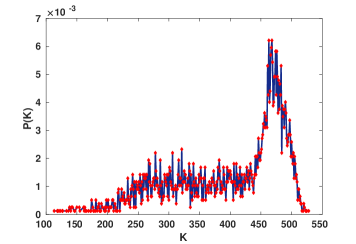
Networks are constructed using static and migrated populations from various states moving to Maharashtra. The states with the highest migration influx into Maharashtra are selected for network formation using the GNMN model. The degree distribution of these networks is depicted in Figure 3, where variations in the distribution are influenced by the number of migrating individuals, their rest time (), and the number of stopping points. From Figure 3, it is observed that higher-degree nodes fall within the ranges of for Andhra Pradesh, for Bihar, and for Uttar Pradesh. The probabilities of high-degree nodes for these states are for Andhra Pradesh, for Bihar, and for Uttar Pradesh.
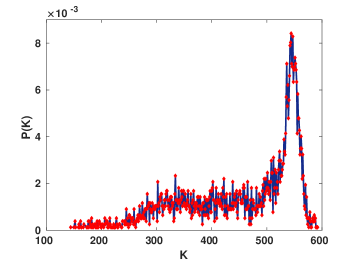
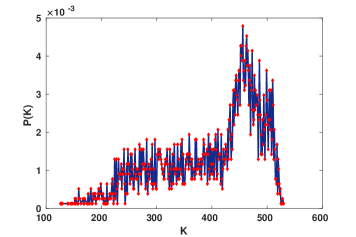
From the aforementioned plots for degree distribution, it is evident that each network’s degree distribution differs due to node mobility, which varies with velocity () and rest time (). Consequently, each graph exhibits distinct structural properties, leading to variations in the average degree. We hypothesize that when nodes move with random velocities and shorter times within a given spatial region, the network becomes sparser, resulting in fluctuating degree distributions. The density of the node is determined by the duration of . A longer means that other nodes from different locations are more likely to be drawn into the connectivity region () of the stationary node, thus influencing the formation of the network.
0.4.3 Visualization of infection spread using GNMN model
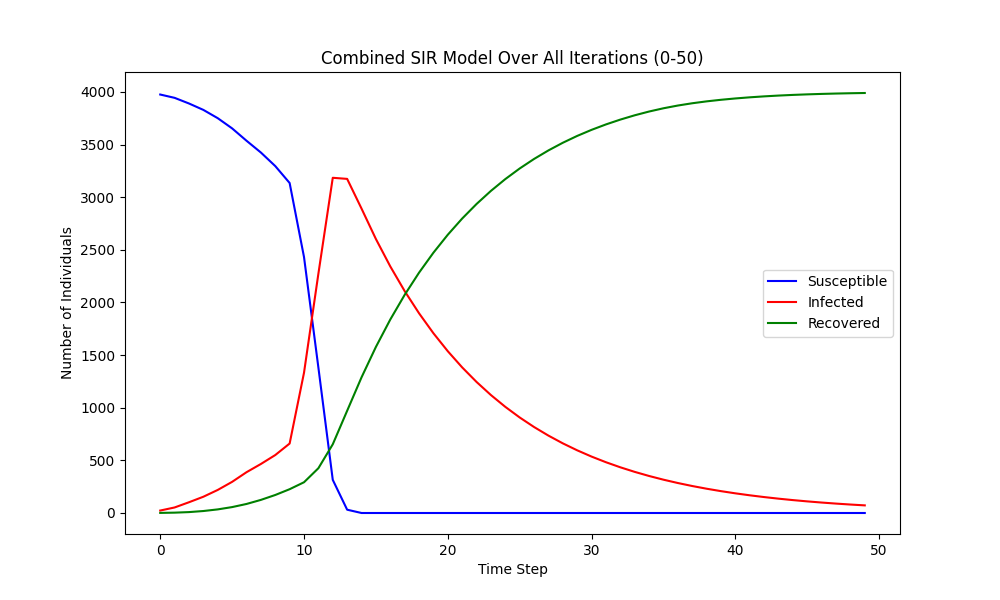
The infection propagation is modeled and visualized in Figure 4 to analyse the dynamics of infection spread within the human contact network. The SIR model is used to track population changes across compartments over time, with a synthetic network consisting of individuals. When the epidemic begins in the network, assuming GNMN as the underlying topology, the infection spreads slowly for the first nine time steps (as shown in Fig. 4). After this initial phase, the infection rate rises sharply, reaching 3,160 infected individuals by the time step. Concurrently, the susceptible population declines gradually at first but drops steeply after nine time steps. Following this peak, the infection rate starts to decline, and from the time step onward, it follows a monotonous decreasing trend. The recovery process accelerates after the time step, and by the time step, the infection is completely eradicated, rendering the entire population infection-free.
 |
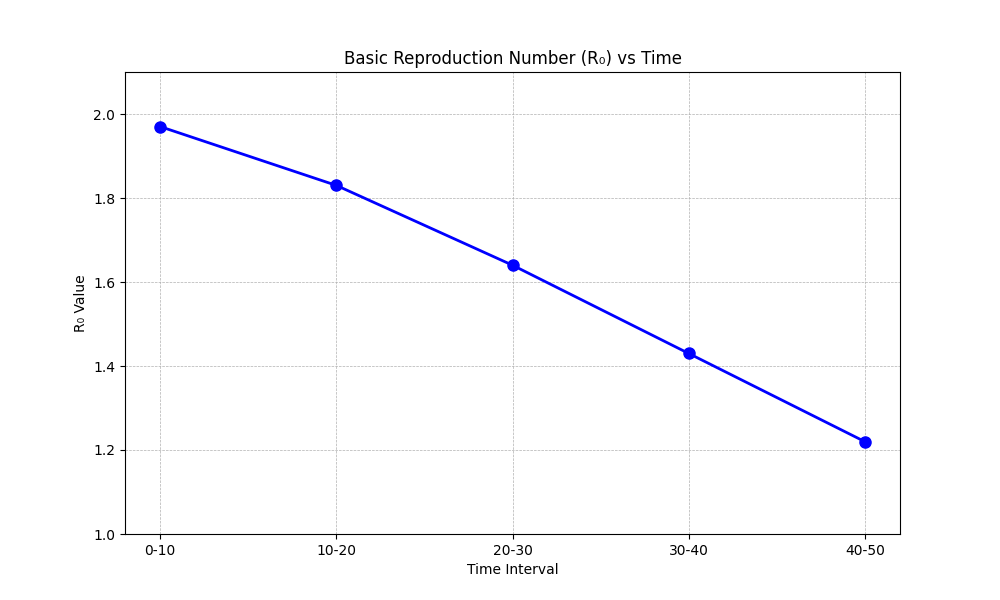
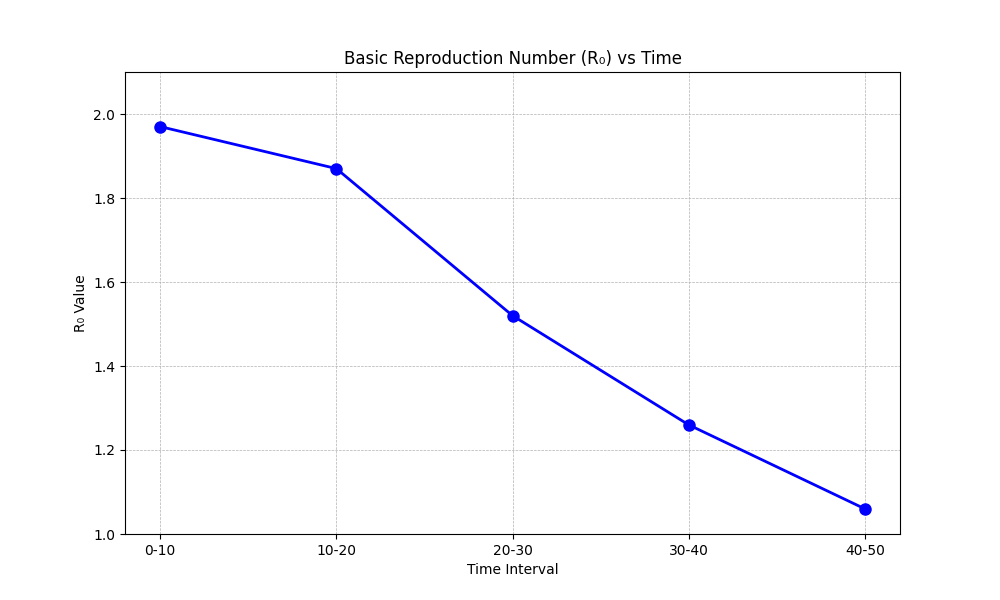
The basic reproduction rate for real data from Uttar Pradesh and Maharashtra is plotted alongside the corresponding values from the proposed model in Figure 5. To generate the plot for the proposed model, parameters from Table 3 were used. The plot exhibits a similar curve pattern to the real data. In the proposed model, begins at and declines to after time steps. In India’s real data, started at in March 2020 and gradually decreased to approximately by February 2021.
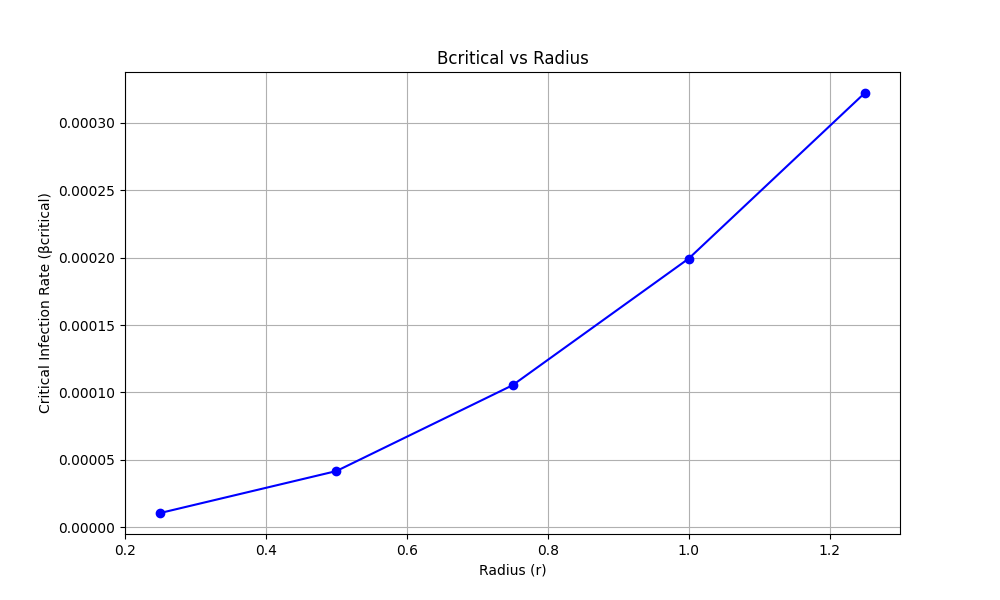
The effect of the spread rate over time is illustrated in Figure 6. At time step , the spreading rate reached for both Uttar Pradesh and Maharashtra. Beyond this point, the epidemic spreading rate continued to rise. This critical threshold marks the onset of the outbreak. The simulation was conducted for time steps, with the maximum attainable spreading rate reaching for both states.
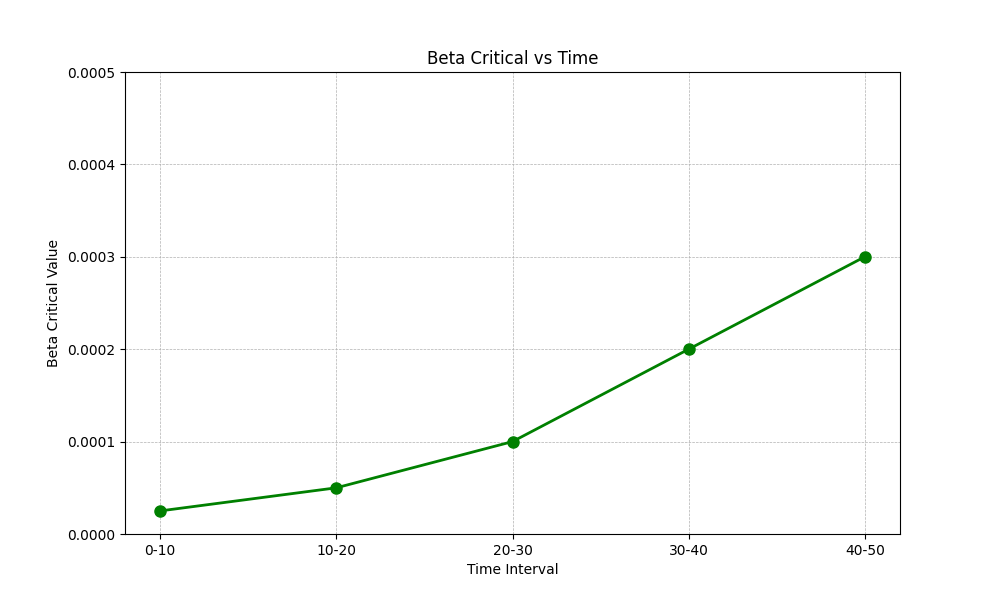
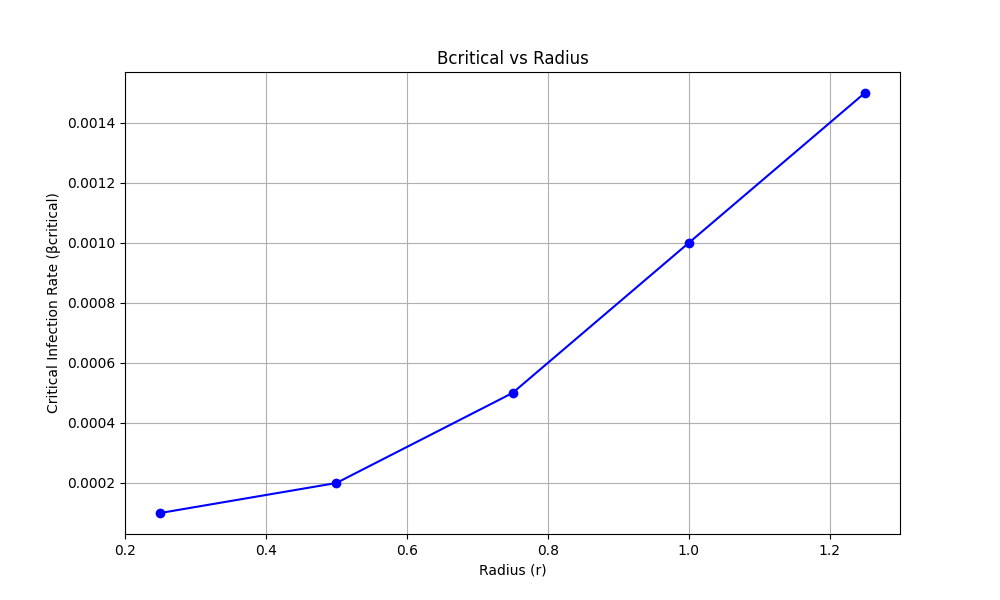
Figure 7 illustrates the relationship between the spreading rate and the varying radius of connectivity. The result indicates that the spreading rate is highly impacted by varying radius of connectivity. At time step , the spreading rate reaches for both Uttar Pradesh and Maharashtra, marking a critical threshold that triggers the epidemic outbreak. Beyond this point, the spreading rate continues to rise. The simulation runs for time steps, with the maximum achievable spreading rate reaching for both states.
0.5 Conclusions and Future Scopes
In this manuscript, we analyzed the importance of human contact and distance in the spread of disease, specifically in relation to the COVID-19 pandemic. By incorporating distance parameterization into the classical SIR model, the critical threshold of epidemic spreading is derived, such as the basic reproduction number and the critical infection rate , and how they are influenced by human movement. The model also accurately portrays the spread of infection in a human connection network. The findings challenge the traditional depiction of infection spread and prove that the topology of the connection strongly influences human pandemic mobility. The model proposed in this paper helps to understand how the connecting distance constraining factors can help mitigate the spread of disease and control an outbreak. This research examines how people movement and spatial distance affect an area’s epidemiological activity. The model is based on a distance-based version of SIR network model, constructed on the notion of distance-based human contact network. The evidence is consistent with the theory that mobility and spatially structured interaction is essential for the spread of the COVID-19 virus. It also supports the idea that during pandemics, how people move around the world strongly affects infection spread.
In the future work, behavioral patterns, vaccination effects, and environmental factors can be incorporated to enhance the model further. The integration of multi-layered networks can improve forecasting for multi-faceted epidemics because of different human interactivity aspects. Mobility trends can be utilized to design more effective intervention strategies through AI and machine learning. Broadening the scope of the study to include various infectious diseases and geographical regions will strengthen its applicability and accuracy in disease prevention and control.
References
- [1] Yuzhou Chen, Yulia R Gel, Madhav V Marathe, and H Vincent Poor. A simplicial epidemic model for covid-19 spread analysis. Proceedings of the National Academy of Sciences, 121(1):e2313171120, 2024.
- [2] Rajesh Kumar, Suchi Kumari, and Manju Bala. Quantum mechanical model of information sharing in social networks. Social Network Analysis and Mining, 11(1):42, 2021.
- [3] Suchi Kumari, Rajesh Kumar, Samya Muhuri, and Suyel Namasudra. A novel budget-constrained rewiring strategy for information flow in social networks. IEEE Transactions on Computational Social Systems, 2024.
- [4] Suchi Kumari and Anurag Singh. Modeling of data communication networks using dynamic complex networks and its performance studies. In Complex Networks & Their Applications V: Proceedings of the 5th International Workshop on Complex Networks and their Applications (COMPLEX NETWORKS 2016), pages 29–40. Springer, 2017.
- [5] Ian Cooper, Argha Mondal, and Chris G Antonopoulos. A sir model assumption for the spread of covid-19 in different communities. Chaos, Solitons & Fractals, 139:110057, 2020.
- [6] Soumik Purkayastha, Rupam Bhattacharyya, Ritwik Bhaduri, Ritoban Kundu, Xuelin Gu, Maxwell Salvatore, Debashree Ray, Swapnil Mishra, and Bhramar Mukherjee. A comparison of five epidemiological models for transmission of sars-cov-2 in india. BMC infectious diseases, 21(1):1–23, 2021.
- [7] Bastien Reyné, Nicolas Saby, and Mircea T Sofonea. Principles of mathematical epidemiology and compartmental modelling application to covid-19. Anaesthesia, Critical Care & Pain Medicine, 41(1):101017, 2022.
- [8] Duygu Balcan, Vittoria Colizza, Bruno Gonçalves, Hao Hu, José J Ramasco, and Alessandro Vespignani. Multiscale mobility networks and the spatial spreading of infectious diseases. Proceedings of the national academy of sciences, 106(51):21484–21489, 2009.
- [9] Diogo H Silva, Celia Anteneodo, and Silvio C Ferreira. Epidemic outbreaks with adaptive prevention on complex networks. Communications in Nonlinear Science and Numerical Simulation, 116:106877, 2023.
- [10] Md Arquam, Anurag Singh, and Hocine Cherifi. Impact of seasonal conditions on vector-borne epidemiological dynamics. IEEE Access, 8:94510–94525, 2020.
- [11] Md Arquam, Anurag Singh, and Hocine Cherifi. Integrating environmental temperature conditions into the sir model for vector-borne diseases. In Complex Networks and Their Applications VIII: Volume 1 Proceedings of the Eighth International Conference on Complex Networks and Their Applications COMPLEX NETWORKS 2019 8, pages 412–424. Springer, 2020.
- [12] Junli Liu and Tailei Zhang. Epidemic spreading of an seirs model in scale-free networks. Communications in Nonlinear Science and Numerical Simulation, 16(8):3375–3384, 2011.
- [13] Md Samsuzzoha, Manmohan Singh, and David Lucy. A numerical study on an influenza epidemic model with vaccination and diffusion. Applied Mathematics and Computation, 219(1):122–141, 2012.
- [14] Fred Brauer. Mathematical epidemiology: Past, present, and future. Infectious Disease Modelling, 2(2):113–127, 2017.
- [15] Carsten Kirkeby, Victoria J Brookes, Michael P Ward, Salome Dürr, and Tariq Halasa. A practical introduction to mechanistic modeling of disease transmission in veterinary science. Frontiers in veterinary science, 7:546651, 2021.
- [16] Rachel E Baker, Ayesha S Mahmud, Ian F Miller, Malavika Rajeev, Fidisoa Rasambainarivo, Benjamin L Rice, Saki Takahashi, Andrew J Tatem, Caroline E Wagner, Lin-Fa Wang, et al. Infectious disease in an era of global change. Nature Reviews Microbiology, 20(4):193–205, 2022.
- [17] Marta Pardo-Araujo, David García-García, David Alonso, and Frederic Bartumeus. Epidemic thresholds and human mobility. Scientific reports, 13(1):11409, 2023.
- [18] Yi Wang and Jinde Cao. Final size of network epidemic models: properties and connections. Sci. China Inf. Sci, 64:179201, 2021.
- [19] Guilherme S Costa, Wesley Cota, and Silvio C Ferreira. Outbreak diversity in epidemic waves propagating through distinct geographical scales. Physical Review Research, 2(4):043306, 2020.
- [20] Juquan Wang and Dun Han. Epidemic spreading on metapopulation networks considering indirect contact. Physica A: Statistical Mechanics and its Applications, 619:128722, 2023.
- [21] Dun Han and Juquan Wang. The effects of travel restrictions and detection measures on epidemic spreading in a metapopulation network. Nonlinear Dynamics, pages 1–14, 2023.
- [22] Fan Bu, Allison E Aiello, Jason Xu, and Alexander Volfovsky. Likelihood-based inference for partially observed epidemics on dynamic networks. Journal of the American Statistical Association, 117(537):510–526, 2022.
- [23] Manoj Kumar and Syed Abbas. Age-structured sir model for the spread of infectious diseases through indirect contacts. Mediterranean Journal of Mathematics, 19(1):14, 2022.
- [24] Subrata Ghosh, Abhishek Senapati, Joydev Chattopadhyay, Chittaranjan Hens, and Dibakar Ghosh. Optimal test-kit-based intervention strategy of epidemic spreading in heterogeneous complex networks. Chaos: An Interdisciplinary Journal of Nonlinear Science, 31(7), 2021.
- [25] Aybike Şimşek. Lexical sorting centrality to distinguish spreading abilities of nodes in complex networks under the susceptible-infectious-recovered (sir) model. Journal of King Saud University-Computer and Information Sciences, 34(8):4810–4820, 2022.
- [26] Diego Andrés Contreras, Giulia Cencetti, and Alain Barrat. Infection patterns in simple and complex contagion processes on networks. PLOS Computational Biology, 20(6):e1012206, 2024.
- [27] Lorenzo Zino and Ming Cao. Analysis, prediction, and control of epidemics: A survey from scalar to dynamic network models. IEEE Circuits and Systems Magazine, 21(4):4–23, 2021.
- [28] Rahul Goel, Loïc Bonnetain, Rajesh Sharma, and Angelo Furno. Mobility-based sir model for complex networks: with case study of covid-19. Social Network Analysis and Mining, 11:1–18, 2021.
- [29] Sha Zhu, Meng Kou, Fujun Lai, Qingxiang Feng, and Guorong Du. The connectedness of the coronavirus disease pandemic in the world: A study based on complex network analysis. Frontiers in Physics, 8:602075, 2021.
- [30] Samuel Johnson. Epidemic modelling requires knowledge of the social network. Journal of Physics: Complexity, 5(1):01LT01, 2024.
- [31] WenYao Li, Xiaoyu Xue, Liming Pan, Tao Lin, and Wei Wang. Competing spreading dynamics in simplicial complex. Applied Mathematics and Computation, 412:126595, 2022.
- [32] Junfeng Fan, Qian Yin, Chengyi Xia, and Matjaž Perc. Epidemics on multilayer simplicial complexes. Proceedings of the Royal Society A, 478(2261):20220059, 2022.
- [33] Hui-Jia Li, Wenzhe Xu, Shenpeng Song, Wen-Xuan Wang, and Matjaž Perc. The dynamics of epidemic spreading on signed networks. Chaos, Solitons & Fractals, 151:111294, 2021.
- [34] Carlos Rodríguez Lucatero. Analysis of epidemic models in complex networks and node isolation strategie proposal for reducing virus propagation. Axioms, 13(2):79, 2024.
- [35] Md Arquam, Anurag Singh, and Rajesh Sharma. Modelling and analysis of delayed sir model on complex network. In Complex Networks and Their Applications VII: Volume 1 Proceedings The 7th International Conference on Complex Networks and Their Applications COMPLEX NETWORKS 2018 7, pages 418–430. Springer, 2019.
- [36] Md Arquam and Anurag Singh. Epidemic spreading in geometric network with mobile agents. Acta Physica Polonica B, 51(9), 2020.
- [37] Daniel Bernoulli. Essai d’une nouvelle analyse de la mortalité causée par la petite vérole et des avantages de l’inoculation pour la prévenir. Histoire de l’Acad. Roy. Sci.(Paris) avec Mém. des Math. et Phys. and Mém, 1:1–45, 1760.
- [38] William O Kermack and Anderson G McKendrick. A contribution to the mathematical theory of epidemics. In Proceedings of the Royal Society of London A: mathematical, physical and engineering sciences, volume 115, pages 700–721. The Royal Society, 1927.
- [39] Corona outbreak in india ”https://www.kaggle.com/datasets/swaptr/covid19-state-data”.
- [40] Indian state population ”https://statisticstimes.com/demographics/india/indian-states-population.php/”.
- [41] Migration of indian population of various states ”https://censusindia.gov.in/2011census/migration.html”.
- [42] Eunjoon Cho, Seth A Myers, and Jure Leskovec. Friendship and mobility: user movement in location-based social networks. In Proceedings of the 17th ACM SIGKDD international conference on Knowledge discovery and data mining, pages 1082–1090. ACM, 2011.
- [43] Wayne W Daniel and Chad L Cross. Biostatistics: a foundation for analysis in the health sciences. Wiley, 2018.