Exploring Event-by-Event Fluctuations in pp Collisions at TeV: An Insight from ALICE
Bushra Ali111Bushra.Ali@cern.ch, for the ALICE Collaboration
Department of Physics, Aligarh Muslim University, India
Abstract: Event-by-event fluctuations of the mean transverse momentum () of relativistic charged particles are analyzed using the two-particle correlator , which quantifies the correlations strength in units of the mean in proton-proton collision at TeV in ALICE both for minimum bias and and high-multiplicity triggered events. The non-monotonic variations in correlations with changing energy could serve as a signature of QGP formation. A comprehensive investigation across soft-, intermediate-, and hard- regions could provide crucial insights into both equilibrium (e.g., thermal radial flow) and non-equilibrium (e.g., jet/minijet) contributions to fluctuations. The dependence of the correlator on particle multiplicity for different window widths and positions is explored. The correlator values are found to decrease with increasing charged particle density, following a power-law behavior similar to observations in both small and large systems at lower energies. Additionally, the influence of range on the power-law coefficient is studied and results are compared with predictions from Monte Carlo models, such as PYTHIA (pQCD string model) and EPOS (core-corona model), to enhance understanding of the underlying mechanisms driving fluctuations.
The 10th Asian Triangle Heavy-Ion Conference - ATHIC 2025
13-16 Jan, 2025
Indian Institute of Science Education and Research Berhampur, Odisha, India
1 Introduction
Fluctuations in mean transverse momentum may emerge from various correlation sources, for example, including resonance decays, quantum statistical effects, and hard scatterings such as jet production. These contributions are not exclusive to nucleus–nucleus (AA) collisions rather they have also been observed in smaller systems, like proton–proton (pp) at LHC energies. Results from pp collisions, therefore, would serve as a model-independent baseline to look for the occurrence of fluctuation patterns of dynamic nature in AA collisions, which lead to the modification of the fluctuation patterns exhibited by pp collisions [1]. Moreover, recent observations of strangeness enhancement comparable to that observed in AA collisions, flow-like signatures, and presence of collectivity in high-multiplicity pp collision events have reignited the interest towards the investigations involving small systems, like pp, at LHC energies [2, 3, 4]. A dedicated analysis of mean correlations in high-multiplicity pp events revealed that these events exhibit a similar trend of decreasing fluctuations with increasing multiplicity, consistent with the behavior observed in minimum bias data [8].
To probe the physical origin of fluctuations in detail, a differential analysis of correlations has been performed across various intervals. This approach is motivated by the fact that the soft and hard processes dominate different regions of the spectrum: hydrodynamic collectivity is expected to be significant at low , while high particles are more likely to originate from hard scatterings and parton fragmentation [5, 6]. Earlier studies involving experiments, such as STAR [7, 9, 10, 11, 12], ALICE [1], CERES [13, 14], and PHENIX [15] were primarily restricted to a limited acceptance (0.15 2.0 GeV/). Attempts are, therefore, made to study the mean correlations in windows having higher ranges, like 0.15 3.0, 0.15 4.0, and 0.15 6.0 GeV/, to investigate how the inclusion of harder particles influences correlation strength.
In order to isolate the dependent effects, windows of fixed widths ( GeV/ range) have also been considered: 1.0 2.0, 2.0 3.0, 3.0 4.0, and 4.0 5.0 GeV/. In windows positioned in regions of smaller , domination of soft processes is expected, whereas in window placed in high regions, hard scattering dynamics would dominate. A comparison of the experimental findings with the predictions of theoretical models, like PYTHIA8 (based on perturbative QCD and multiple parton interactions) and EPOS LHC (incorporating a core-corona framework with collective and jet-like features) would help understand the origins of mean correlations.
The two-particle correlator , in a multiplicity class m, is defined as [1],
| (1) |
where is the number of pairs in an event, is the number of events in class while denotes the mean of all particles in all events of that multiplicity class and may be estimated using the following relation:
| (2) |
2 Result and discussion
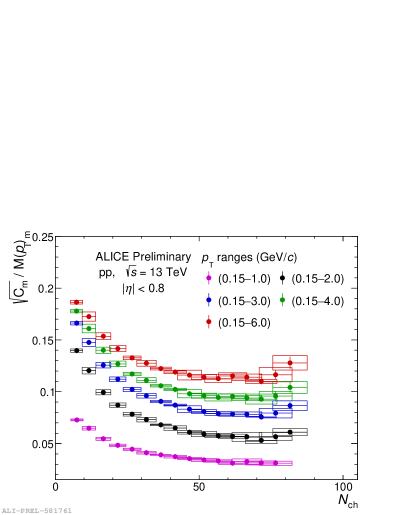
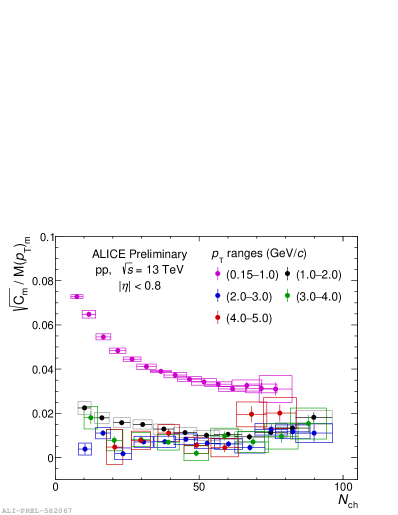
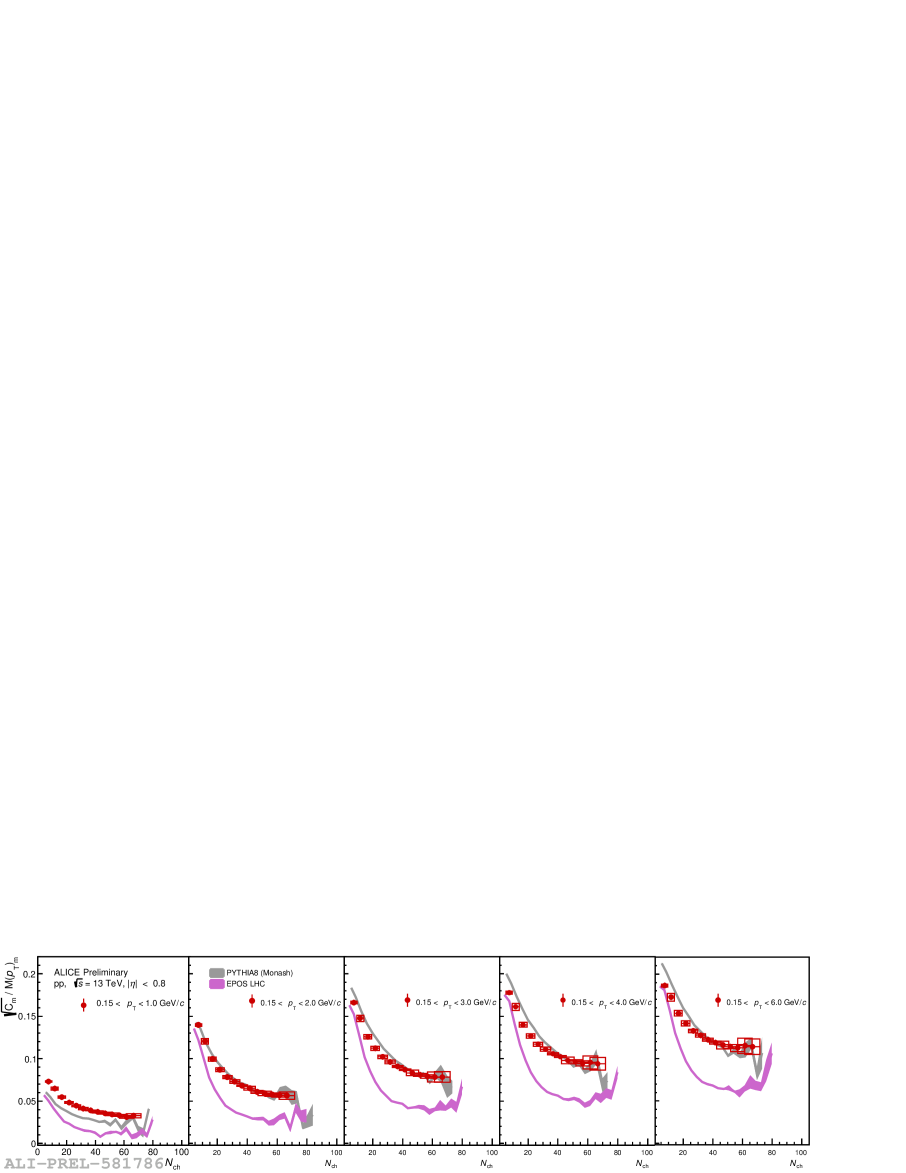
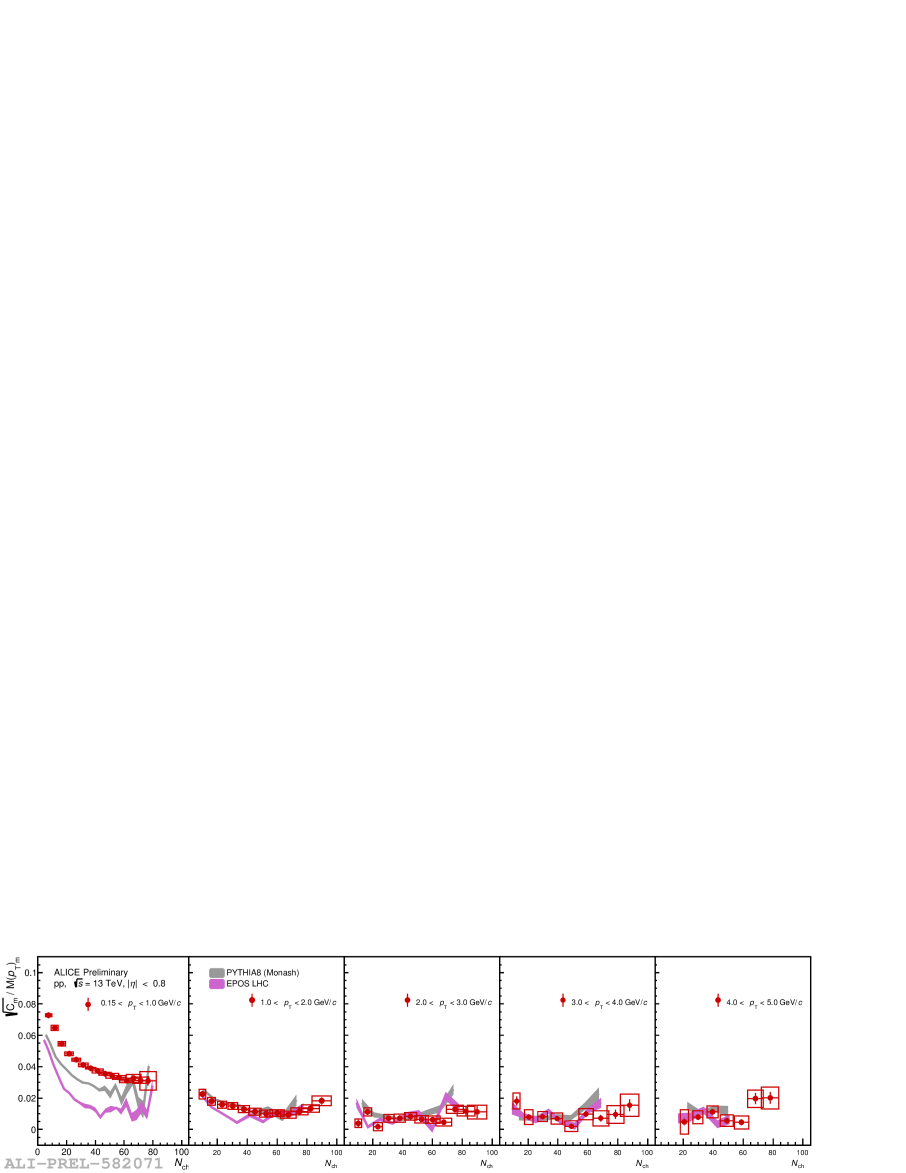
Figure 1 shows the variation of the two-particle correlator, , as a function of charged-particle multiplicity for two different selection schemes. The left panel illustrates the effect of progressively widening the interval, while the right panel explores the correlator behavior as a function of window positions, with fixed width.
In the case of widening windows, the strength of the correlator increases with multiplicity. This rise is attributed to the inclusion of a larger number of particles within the acceptance, enhancing the probability of correlated pairs contributing to the fluctuation signal. Conversely, when the window is shifted across momentum space while keeping its width fixed, a distinct trend emerges. A significant drop in the correlation strength is observed on moving from the lowest window (0.15–1.0 GeV/) to a window of higher range (1.0–2.0 GeV/). This, in turn, suggests the decreasing influence of soft processes such as collective flow and resonance decays on shifting the window to a higher range [16, 17]. On shifting the window to still higher ranges, the correlation strength is observed to be suppressed further and shows minimal multiplicity dependence. In the highest interval, the correlator values approach zero, suggesting a diminishing role of collectivity or correlated particle production mechanisms and an increasing dominance of independent high-momentum transfer processes such as jet fragmentation and hard scatterings [1, 18, 19].
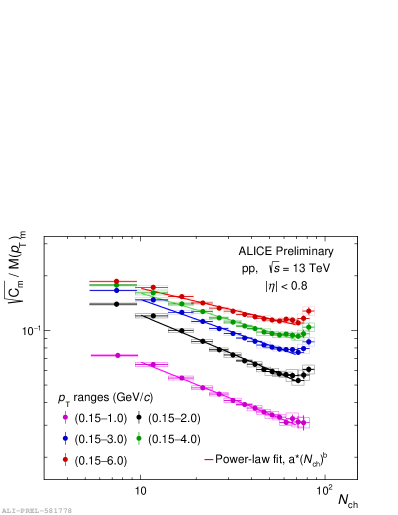
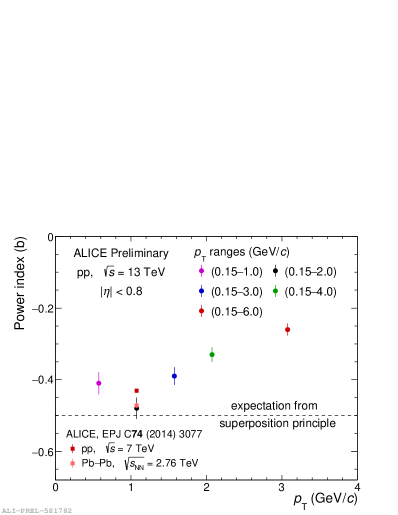
Power-law fits to the correlator values against is performed and shown in Fig. 2 for progressively widening windows. The fitting function used is , where and are free parameters. The fits are performed in the range . In the absence of dynamical correlations, the correlator is expected to follow statistical scaling, yielding a power index of . Any deviation from this value would suggest the presence of dynamical correlations. The values of power index obtained from the best fit to the data are plotted as a function of the window widths in the right panel of Fig. 2. A non-monotonic behavior of with window widths is observed. For the lowest interval (0.15–1.0 GeV/), , indicating a moderate deviation from statistical expectations. With the inclusion of higher particles (e.g., up to 2.0 GeV/), , suggesting a significant decrease with increasing multiplicity. However, on further widening of the window, an increase in the power index may be noticed in the figure, indicating a reduced sensitivity of the parameter to multiplicity enhancement due to widening of window. These observations suggest a crossover between soft and hard contributions to the observed fluctuations. The figure also shows the ALICE measurements [1] previously reported for pp collisions at TeV and Pb–Pb collisions at in the range, 0.15-2.0 GeV/. For pp collisions, it is seen that the magnitude of increases by from beam energy to TeV.
In order to compare the findings based on the real data with the monte carlo (MC) models, PYTHIA8 (Monash tune) and EPOS LHC, a parallel analysis of the MC data has been carried out and the results are displayed in Figs. 4 and 4. It is interesting to note from the figure that the decreasing trend of the correlator with increasing exhibited by the data is in qualitative agreement with the PYTHIA and EPOS LHC predictions. The models, however, fail to describe the data quantitatively in the low range, i.e., 0.15-1.0 GeV/. On increasing the window width, which includes higher particles, agreement between the data and PYTHIA model may be noticed to be rather better. Such improvements may be attributed to its pQCD-inspired framework, which effectively takes into account the semi-hard and hard processes, including multiple parton interactions and jet fragmentation [20]. EPOS LHC [21], which incorporates the collective effects through a core-corona approach and a hydrodynamic phase, may be noticed to underestimate the correlation strength.
Shown in Fig. 4 are the correlator dependence on for fixed-width intervals at increasing momentum scales. A sharp drop in correlation strength is observed on moving from the low- (0.15–1.0 GeV/) to the intermediate- region (1.0–2.0 GeV/), indicating a shift from soft to semi-hard processes. At even higher , the correlation strength flattens and approaches zero, reflecting the reduced influence of collective dynamics and the growing contribution of uncorrelated hard scatterings [16, 17].
3 Conclusion
The event-by-event mean fluctuations in pp collisions at TeV, measured using the ALICE detector, have been examined by varying width and positions of the selection windows. In one approach, the window is progressively widened to include higher- particles. Here, the correlation strength increases with window size, suggesting that the inclusion of particles from semi-hard and hard processes enhances the mean correlations. In the second approach, the width of the interval is fixed while the window is gradually shifted toward higher regions. In this case, the correlation strength decreases as the window moves away from the soft region, indicating a transition from soft processes to more uncorrelated semi-hard and hard scatterings that dominate at higher .
Furthermore, the comparison with PYTHIA8 predictions shows that the agreement with data becomes better as more high- particles are included. This aligns with the model’s pQCD-based description of hard scattering and parton fragmentation. These observations, thus, tend to suggest that the mean correlation strength in pp collisions is mainly driven by semi-hard and hard QCD processes, especially in the high- regime.
References
- [1] B. Abelev et al, (ALICE Collaboration) Euro. Phys. J. C74 (2014) 3077.
- [2] J. L. Nagle and W. A. Zajc, Ann. Rev. Nucl. Part. Sci. 68 (2018) 211.
- [3] J. L. Nagle and W. A. Zajc, Phys. Rev. C99 (2019) 054908.
- [4] V. Khachatryan et al, (CMS Collaboration) Phys. Lett. B765 (2017) 193.
- [5] C. Adler et al, (STAR Collaboration) Phys. Rev. Lett. 90 (2003) 032301.
- [6] S. Acharya et al., (ALICE Collaboration) Phys. Lett. B 845 (2023)138110.
- [7] J. Adams et al, (STAR Collaboration) Phys. Rev. C72 (2005) 044902.
- [8] Bushra Ali, PoS(ICHEP2024) 476 (2024) 571. 10.22323/1.476.0571.
- [9] J. Adams et al. (STAR Collaboration) Phys. Rev. C71 (2005) 064906.
- [10] J. Adams et al. (STAR Collaboration) J. Phys. G32 (2006) L37.
- [11] B.I. Abelev et al. (STAR Collaboration) Phys. Rev. C79 (2009) 034909.
- [12] J. Adams et al, (STAR Collaboration) Phys. Rev. C 99 (2019) 044918.
- [13] D. Adamová et al. (CERES Collaboration) Nucl. Phys. A727 (2003) 97.
- [14] D. Adamová et al. (CERES Collaboration) Nucl. Phys. A811 (2008) 179.
- [15] S. S. Adler et al. (PHENIX Collaboration) Phys. Rev. Lett. 93 (2004) 092301.
- [16] S. Acharya et al, (ALICE Collaboration) Phys. Rev. C 107 (2023) 054617.
- [17] ALICE Collaboration, arXiv:2411.07059.
- [18] S. Jeon and V. Koch, arXiv:hep-ph/0304012.
- [19] B. Alver et al, Phys. Rev. C81 (2010) 024909.
- [20] T. Sjöstrand et al., Comput. Phys. Commun. 191 (2015) 159.
- [21] T. Pierog et al., Phys. Rev. C92 (2015) 034906.