Lost in Benchmarks? Rethinking Large Language Model Benchmarking with Item Response Theory
Abstract
The evaluation of large language models (LLMs) via benchmarks is widespread, yet inconsistencies between different leaderboards and poor separability among top models raise concerns about their ability to accurately reflect authentic model capabilities. This paper provides a critical analysis of benchmark effectiveness, examining main-stream prominent LLM benchmarks using results from diverse models. We first propose a new framework for accurate and reliable estimations of item characteristics and model abilities. Specifically, we propose Pseudo-Siamese Network for Item Response Theory (PSN-IRT), an enhanced Item Response Theory framework that incorporates a rich set of item parameters within an IRT-grounded architecture. Based on PSN-IRT, we conduct extensive analysis which reveals significant and varied shortcomings in the measurement quality of current benchmarks. Furthermore, we demonstrate that leveraging PSN-IRT is able to construct smaller benchmarks while maintaining stronger alignment with human preference111Code and data are openly available at https://github.com/Joe-Hall-Lee/PSN-IRT.
Lost in Benchmarks? Rethinking Large Language Model Benchmarking with Item Response Theory
Hongli Zhou1∗, Hui Huang1∗, Ziqing Zhao1, Lvyuan Han1, Huicheng Wang1, Kehai Chen2, Muyun Yang1, Wei Bao3, Jian Dong3, Bing Xu1, Conghui Zhu1, Hailong Cao1, Tiejun Zhao1 1Faculty of Computing, Harbin Institute of Technology, Harbin, China 2School of Computer Science and Technology, Harbin Institute of Technolgy, Shenzhen, China 3China Electronics Standardization Institute, Beijing, China hongli.joe@stu.hit.edu.cn, yangmuyun@hit.edu.cn, {baowei, dongjian}@cesi.cn
1 Introduction
As the scale and performance of large language models (LLMs) continue to grow, accurately measuring their capabilities has become increasingly important. Currently, the performance of LLMs is primarily evaluated through various benchmarks, which are comprehensive test suites consisting of carefully designed questions aimed at assessing model behavior across different tasks. However, in practice, existing benchmarks often exhibit significant limitations, prompting deeper consideration of their effectiveness McIntosh et al. (2024).
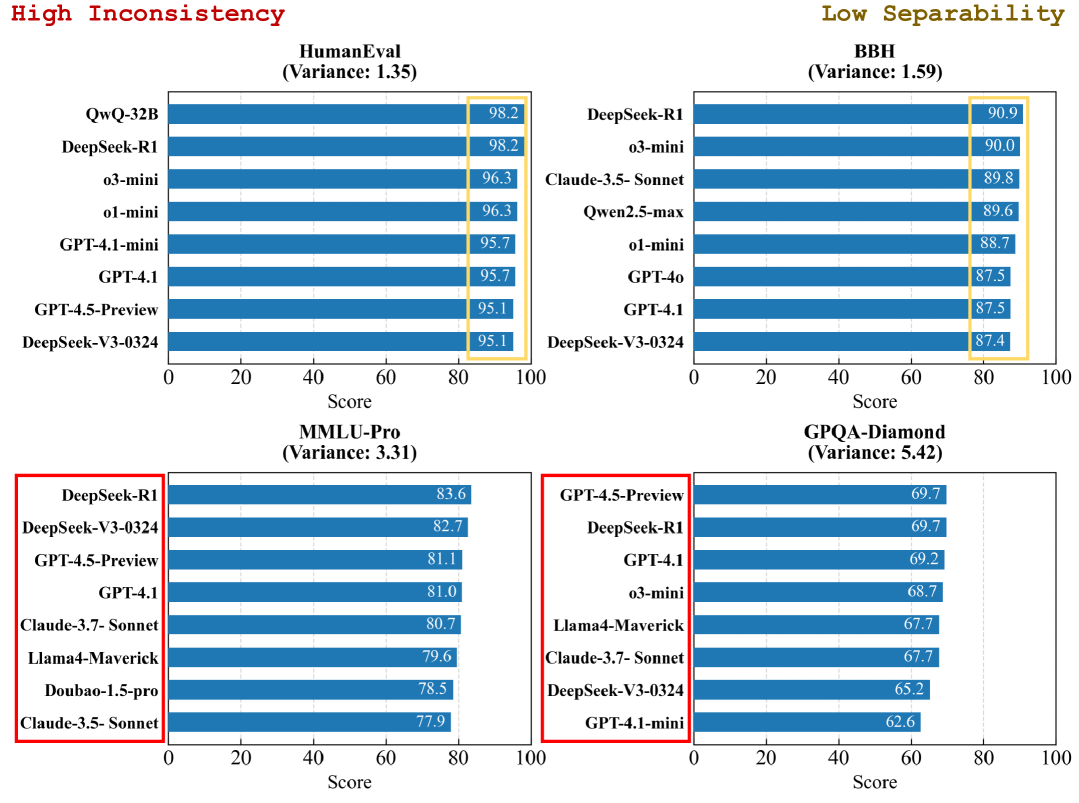
As illustrated in Figure 1, on one hand, different benchmarks often produce inconsistent leaderboards Perlitz et al. (2024), with the same model achieving substantially varying rankings across evaluations. This makes it challenging for researchers and developers to determine a model’s real performance. On the other hand, many benchmarks show weak separability among top models, limiting the ability to understand performance differences and further model refinement. Given these limitations, there is a growing need for a more systematic analysis of LLM benchmarks.
In this paper, we conduct a comprehensive analysis for various popular LLM benchmark datasets. Our experiment is based on Item Response Theory (IRT) Lord et al. (1968); Baker and Kim (2004), a psychometric framework widely used in educational assessment, analyzes item properties such as difficulty by modeling item response against examinee ability444In the paper, an item refers to a benchmark sample.. However, traditional IRT struggles with the complexity and scale of modern datasets and its assumption of normally distributed abilities does not always hold.
To advance our objective, we propose the Pseudo-Siamese Network for IRT (PSN-IRT), a framework for comprehensive and interpretable analysis of benchmark test sets. PSN-IRT processes model identifiers and item identifiers through independent neural network pathways. These pathways respectively estimate latent model ability and a rich set of item parameters. The estimated properties are then integrated using an IRT-based formulation to predict outcome probabilities. This architectural design ensures both powerful modeling capabilities and strong theoretical interpretability.
To validate the effectiveness of PSN-IRT, we conduct extensive experiments on evaluation results from 12 LLMs across 11 benchmarks. Our results show that PSN-IRT outperforms previous approaches in both parameter estimation accuracy and reliability. Based on PSN-IRT, we perform in-depth analyses of these benchmarks using key metrics, with key findings as follows:
-
1.
LLM benchmarks fail to achieve simultaneous excellence across multiple measurements.
-
2.
LLM benchmarks suffer from widespread saturation and insufficient difficulty ceilings, limiting their ability to challenge and accurately evaluate advanced models.
-
3.
LLM benchmarks exhibit data contamination in numerous items, compromising their reliability.
Furthermore, we find that model rankings derived from high-quality datasets selected by PSN-IRT are more consistent with human preference and offer stronger discriminability among top models.
Our contributions are summarized as follows:
-
1.
We propose PSN-IRT, a benchmark analysis framework demonstrating superior estimation accuracy and reliability.
-
2.
We conduct extensive experiments, using PSN-IRT for an in-depth analysis of mainstream benchmarks, and found that current LLM benchmarks present deficiencies in may aspects.
-
3.
We show that selecting items with PSN-IRT leads to model rankings that better align with human preference.
2 Background
2.1 Related Work
Researchers have explored various methods to enhance the reliability and interpretability of LLM benchmark evaluations. During test set construction, many benchmarks incorporate human annotation and leverage strong LLMs to ensure item quality, detect inconsistencies, and manage item difficulty He et al. (2024); Wei et al. (2024). Beyond these construction-phase strategies, recent studies have also introduced quantitative metrics to assess benchmark behavior post-deployment. For example, Benchmark Agreement Testing (BAT) evaluates the reliability of new benchmarks by comparing them with established ones using correlation-based measures Perlitz et al. (2024); White et al. (2025). Other work proposes novel metrics like Separability with Confidence for more nuanced benchmark analysis Li et al. (2024).
Item Response Theory (IRT) Lord et al. (1968); Baker and Kim (2004) offers a psychometric framework for finer-grained, item-level analysis. Within NLP, IRT has been primarily utilized to diagnose fundamental item properties such as difficulty and discriminability Byrd and Srivastava (2022); Vania et al. (2021) and, more recently, to inspire methods for improving evaluation efficiency, for instance, through optimized item selection or adaptive testing paradigms Maia Polo et al. (2024); Zhuang et al. (2024). However, due to the complexity and scale of modern datasets and its assumption of normally distributed abilities, the application of IRT on LLM benchmarks is still underexplored.
2.2 Preliminary: Item Response Theory
Item Response Theory (IRT) Lord et al. (1968) is a psychometric framework widely used in educational and cognitive assessments to model the relationship between benchmark items and examinee abilities. Unlike Classical Test Theory (CTT) DeVellis (2006), which relies on aggregate test scores, IRT analyzes individual item responses as a function of a latent ability , enabling precise measurement of both item and examinee properties.
Central to IRT is the Item Characteristic Curve (ICC), a mathematical function that describes the probability of a correct response, , as a function of ability . Typically logistic, the ICC visualizes how item properties influence performance, serving as the foundation for IRT.
The simplest IRT model, the One-Parameter Logistic (1PL) model, defines the ICC as:
| (1) |
where denotes item difficulty. When , the probability of the examinee generating a correct response is 0.5. The 1PL assumes all items have equal discriminability, a simplification that may not hold in complex testing scenarios.
More advanced IRT models introduce additional parameters to capture diverse item properties. However, traditional IRT often suffer from inaccurate parameter estimation and rely on assumptions like normal ability distributions, which may not align with real-world data Tsutsumi et al. (2021).
3 Pseudo-Siamese Network for IRT
In this section, we propose the Pseudo-Siamese Network for IRT (PSN-IRT), designed to diagnose benchmark item quality by analyzing LLM responses. Specifically, one property can be inferred for each model: model-ability, and four properties can be inferred for each benchmark item: discriminability, difficulty, guessing-rate and feasibility.
Model Architecture.
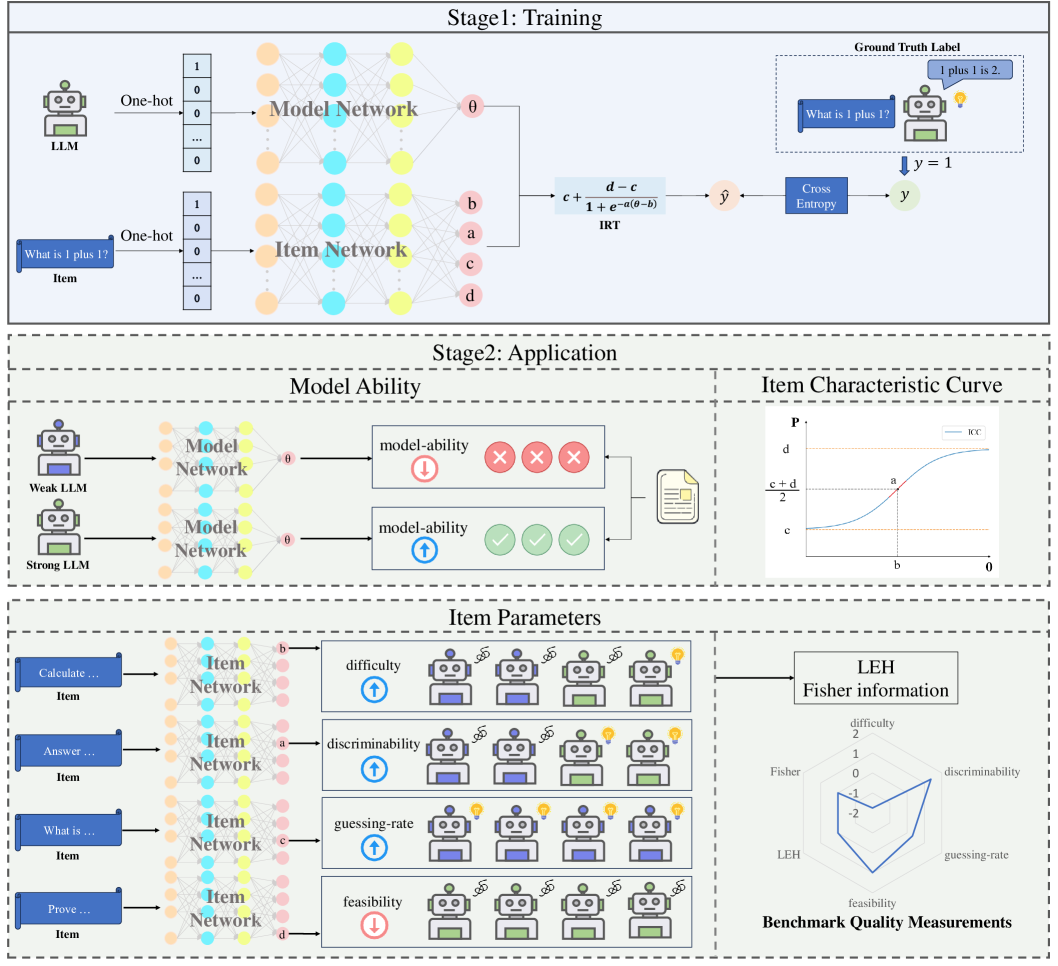
The PSN-IRT architecture comprises two independent networks: a model network and an item network. The model network processes one-hot encoded LLM identifiers to estimate model-ability , while the item network handles one-hot encoded item identifiers to produce the four IRT parameters: discriminability , difficulty , guessing-rate , and feasibility .
Each network consists of three fully connected layers with ReLU activation functions, enabling efficient and stable parameter estimation. After that, these estimated properties are then processed by a Logistic Calculation Layer. This layer operates using the Four-Parameter Logistic (4PL) model, an advanced IRT formulation that extends simpler models like the 1PL to capture nuanced behaviors:
| (2) |
where each parameter controls a different aspect of benchmark item behavior:
-
•
The difficulty determines the ability level where the probability changes most significantly.
-
•
The discriminability controls the steepness.
-
•
The guessing-rate captures how likely models are to succeed without full understanding.
-
•
The feasibility represents the maximum probability that even highly proficient models will correctly answer the item.
Training and Applications.
The PSN-IRT is trained end-to-end using the observed binary response data in the form of (Model, Item, Response, Outcome), where the binary outcome indicates the correctness of each LLM on each benchmark item. During training , PSN-IRT processes encoded pairs of LLM and item identifiers through their respective network pathways. For each pair, the PSN-IRT framework first internally estimates the specific model and item properties. These estimated properties are then passed to a Logistic Calculation Layer, with the training objective as follows:
| (3) |
where is the batch size. The training objective is to minimize the discrepancy between the model’s prediction and the observed binary outcomes. Consequently, all learnable weights within both the model and item networks are updated simultaneously, concurrently optimizing the estimated properties for both models and benchmark items.
Upon completion of training, the two networks of PSN-IRT can be used for evaluating model performance and diagnosing benchmark characteristics, respectively. Specifically, the Model Network, by processing a model’s encoding, outputs an estimate of the model ability . Meanwhile, the Item Network, given an benchmark item’s encoding, outputs its four estimated psychometric parameters , which can be used for an in-depth diagnosis of individual item characteristics and the overall benchmark quality.
4 Experiments
4.1 Set-up
Dataset.
To evaluate existing LLM benchmarks, we select 11 datasets that vary in domain coverage. They serve as a basis for comparing different IRT-based methods and analyzing test set properties. An overview of the datasets is provided in Table 1.
To construct training data, we conduct evaluations using OpenCompass Contributors (2023). The evaluation results are collected in the form of binary outcomes, indicating whether each model answered each item correctly. Then, we construct a unified outcome matrix by aggregating item-level results across all models and benchmarks. We split the interactions into training (60%), validation (20%), and test sets (20%). The validation set is utilized to monitor performance during model training and to implement early stopping, thereby preventing overfitting.
| Benchmark | Data Size | Domain | Metric | Format |
|---|---|---|---|---|
| ARC-C Clark et al. (2018) | 295 | General | EM | Multiple Choice |
| BBH Suzgun et al. (2023) | 6,511 | General | EM | Mixed |
| Chinese SimpleQA He et al. (2024) | 3,000 | Knowledge | LLM-as-a-Judge | QA |
| GPQA Diamond Rein et al. (2024) | 198 | Science | EM | Multiple Choice |
| GSM8K Cobbe et al. (2021) | 1,319 | Math | EM | QA |
| HellaSwag Zellers et al. (2019) | 10,042 | General | EM | Multiple Choice |
| HumanEval Chen et al. (2021) | 164 | Code | Pass@1 | QA |
| MATH Hendrycks et al. (2021b) | 5,000 | Math | EM | QA |
| MBPP Austin et al. (2021) | 500 | Code | Pass@1 | QA |
| MMLU Hendrycks et al. (2021a) | 14,042 | General | EM | Multiple Choice |
| TheoremQA Chen et al. (2023) | 800 | Science | EM | QA |
| Model | Parameter | Method | ACC | F1 | AUC | Kendall | Average |
| IRT | 4PL | MLE | 0.7211 | 0.8034 | 0.7012 | 0.9697 | 0.7989 |
| MCMC | 0.7070 | 0.7811 | 0.7278 | 0.9697 | 0.7964 | ||
| VI | 0.7201 | 0.8015 | 0.6940 | 0.9091 | 0.7812 | ||
| VIBO | 0.7188 | 0.8007 | 0.7055 | 0.9697 | 0.7987 | ||
| Deep-IRT | 1PL | Deep Learning | 0.7969 | 0.8507 | 0.8507 | 0.9697 | 0.8670 |
| PSN-IRT | 4PL | Deep Learning | 0.7991 | 0.8520 | 0.8477 | 1.0000 | 0.8747 |
Model.
We mainly focus on currently high-performing models, including 360GPT2-Pro555https://ai.360.cn/, DeepSeek-V3 DeepSeek-AI et al. (2025), Doubao-Pro666https://www.volcengine.com/product/doubao, Gemini-1.5 Team et al. (2024a), Hunyuan-Turbo777https://hunyuan.tencent.com/, Moonshot-v1888https://platform.moonshot.cn/, Qwen-Plus Yang et al. (2024), and Yi-Lightning Wake et al. (2025). However, testing only strong models might obscure differences in the discriminability of the test sets, as most items could be solved easily, thus limiting a comprehensive evaluation of test set quality Mart´ınez-Plumed et al. (2019). To address this, we intentionally included several relatively weaker models, including Gemma-2B-it Team et al. (2024b), Mistral-7B-Instruct-v0.1 Jiang et al. (2023), Qwen2.5-3B-Instruct Yang et al. (2024), and Vicuna-7B-v1.3 Chiang et al. (2023).
Baseline.
We mainly compare PSN-IRT with traditional IRT methods, namely IRT estimated based on traditional parameter estimation techniques, including Maximum Likelihood Estimation (MLE), Markov Chain Monte Carlo (MCMC) Hastings (1970), Variational Inference (VI) Jordan et al. (1999), and VIBO Wu et al. (2020). We also compare with Deep-IRT Tsutsumi et al. (2021), which is a neural extension of 1PL IRT that learns item-trait interactions via deep networks.
Metric.
Two quantitative metrics are included:
-
•
Prediction accuracy: We measure how well each method predicts whether a model answers an item correctly. These metrics include accuracy, F1 score, and ROC AUC.
-
•
Rank stability: We assess the consistency of model rankings by splitting the test set into two subsets. For each subset, we estimate model abilities and generate a ranking. Kendall’s is then computed between the two rankings.
4.2 Estimation Ability of PSN-IRT
Table 2 shows the estimation accuracy and reliability of PSN-IRT compared to traditional IRT and Deep-IRT. Both Deep-IRT and PSN-IRT significantly outperform traditional IRT in prediction accuracy. Despite its simpler Logistic output layer rooted in the IRT formula, PSN-IRT attains prediction accuracy on par with the more complex Deep-IRT, and surpasses it in rank reliability.
Given our primary objective of analyzing test sets, all methods except Deep-IRT utilized the more comprehensive 4PL structure for modeling benchmark items. However, the experimental results indicate that employing different parameter structures has a minimal impact on prediction accuracy, with detailed results available in Appendix A.3.
| Dataset | Difficulty | Discriminability | Guessing | Feasibility | LEH | Fisher | Total |
|---|---|---|---|---|---|---|---|
| Chinese SimpleQA | 2 | 3 | 1 | 9 | 3 | 5 | 21 |
| MBPP | 5 | 6 | 4 | 8 | 4 | 4 | 26 |
| MATH | 4 | 1 | 2 | 7 | 7 | 10 | 27 |
| TheoremQA | 1 | 10 | 3 | 11 | 2 | 2 | 27 |
| GPQA Diamond | 3 | 11 | 6 | 10 | 1 | 1 | 30 |
| MMLU | 9 | 9 | 9 | 5 | 5 | 3 | 31 |
| BBH | 6 | 5 | 8 | 6 | 6 | 7 | 32 |
| GSM8K | 8 | 2 | 5 | 3 | 11 | 11 | 32 |
| HellaSwag | 10 | 7 | 10 | 2 | 8 | 6 | 33 |
| HumanEval | 7 | 4 | 7 | 4 | 9 | 9 | 33 |
| ARC-C | 11 | 8 | 11 | 1 | 10 | 8 | 38 |
5 Benchmark Analysis with PSN-IRT
5.1 Benchmark Quality Measurements
In this section, we delve into a detailed analysis of the benchmarks based on different measurements. Specifically, we leverage the 4 item parameters (difficulty, discriminability, guessing-rate and feasibility) estimated by PSN-IRT, along with two additional metrics for evaluating item quality: Local Efficiency Headroom (LEH) Vania et al. (2021) and Fisher information Lord (1980).
LEH score assesses the potential of a test example to evaluate future progress in LLMs. It is calculated as the derivative of the item’s Item Characteristic Curve (ICC) with respect to the highest observed latent ability. A high LEH score indicates that even the top model remains far from the saturation point of the ICC.
Fisher information measures the amount of information an item provides about a model’s ability level. Items with higher Fisher information are more informative for estimating model abilities. For 4PL IRT, it is defined as:
| (4) |
where is defined as Equation 2.
5.2 Benchmark Analysis
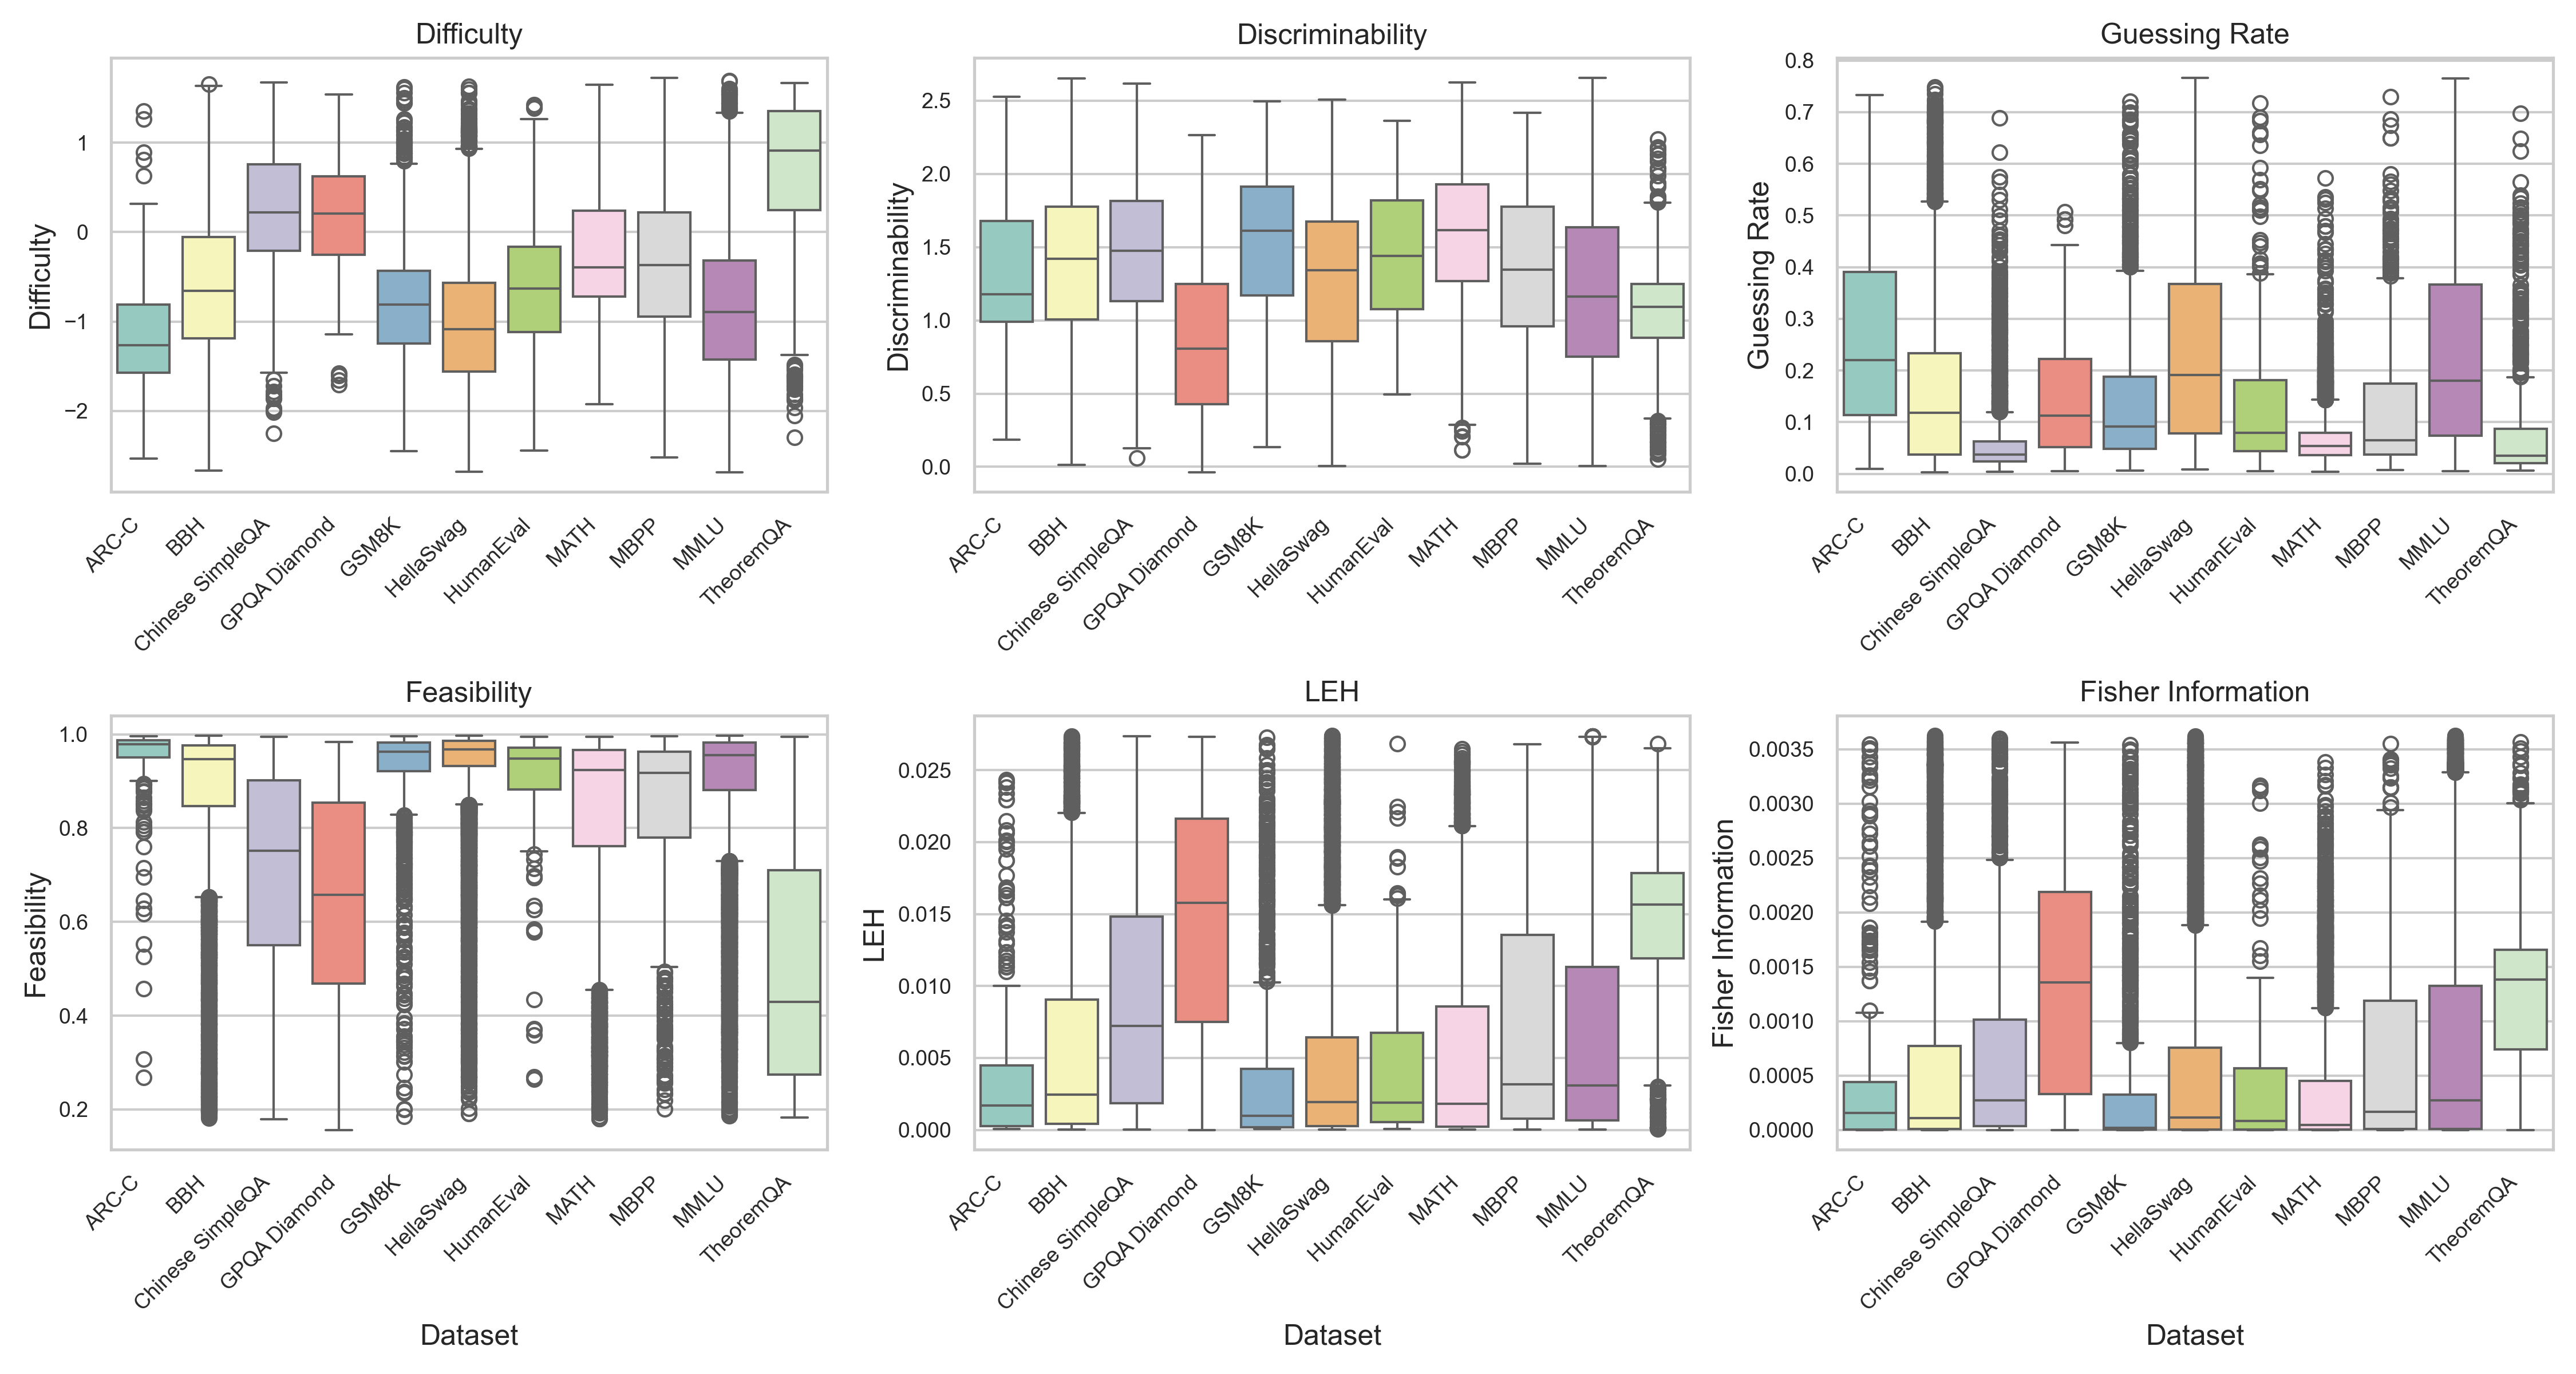
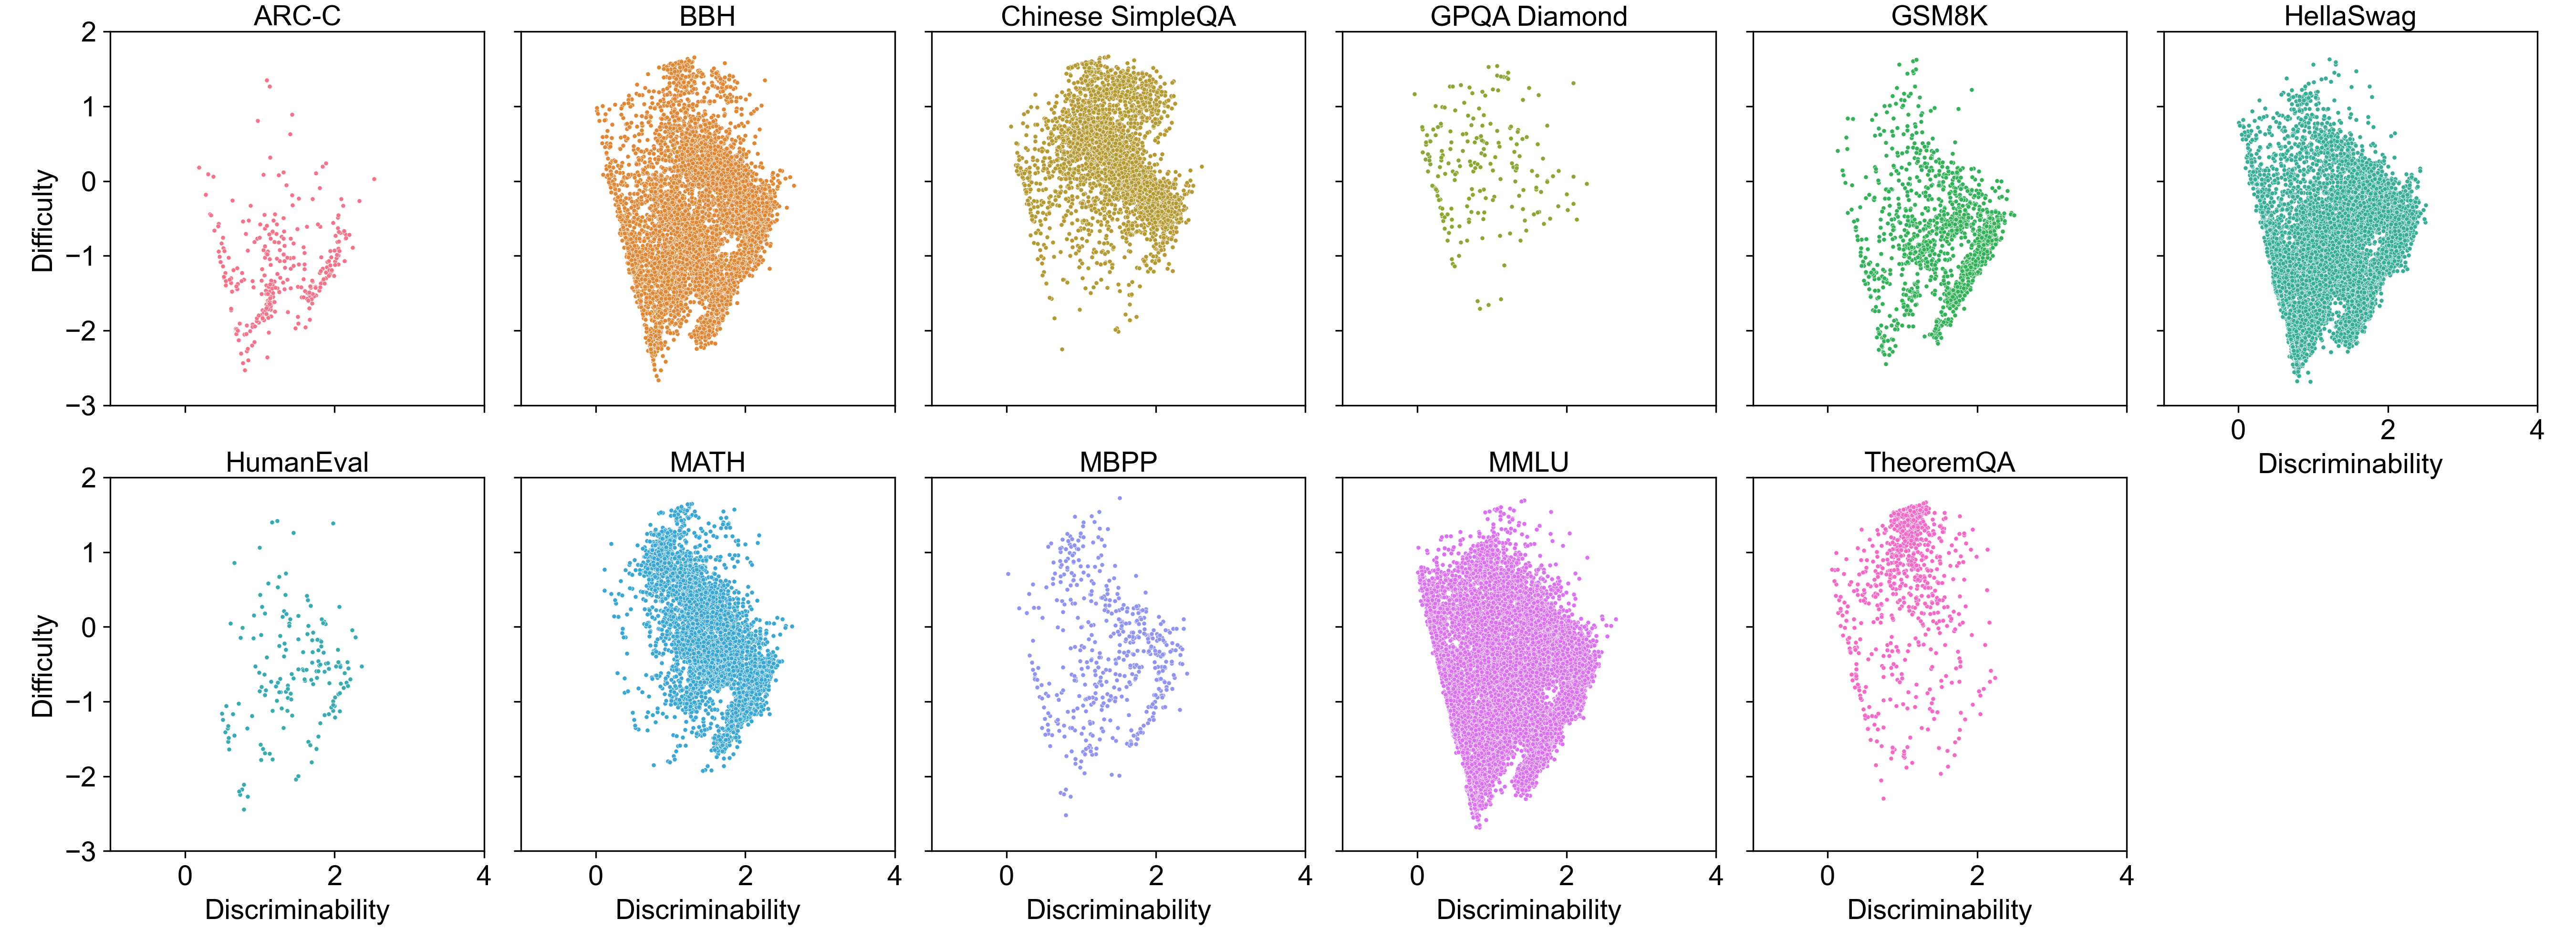
Based on the measurements, we present an aggregate rank for each benchmark based on the sum of individual ranks in Table 3, where a lower total score indicates better overall quality. We also present the distribution of item-level properties across 11 LLM benchmarks in Figure 3. Moreover, we further illuminates the relationship between item difficulty and discriminability in Figure 4. Based on these experiment results, we present our detailed analysis as follows.
Finding 1: LLM benchmarks fail to achieve simultaneous excellence across multiple measurement properties.
As shown in Table 3, the results clearly demonstrate this lack of simultaneous excellence. While Chinese SimpleQA achieves the best overall score, no benchmark performs universally well across the individual metrics. For instance, Chinese SimpleQA itself suffers from poor feasibility with a rank of 9. This pattern of strengths being offset by significant weaknesses is common across benchmarks, which underscores the inherent challenges and trade-offs in benchmark design. Moreover, the property distributions visualized in Figure 3 further highlight this variability and the difficulty for any single benchmark to achieve balanced, high quality across all desired measurement properties.
Finding 2: Current LLM benchmarks exhibit an insufficient difficulty ceiling to challenge the most advanced models.
As shown in Table 3, difficulty is varied among different benchmarks. Datasets such as TheoremQA, Chinese SimpleQA, and GPQA Diamond lead in difficulty and continue to challenge many LLMs. In contrast, other benchmarks including ARC-C, HellaSwag, and HumanEval have become comparatively easy, where many of the items are readily solved by high-performing models, diminishing their utility for differentiating top-tier systems.
Crucially, as shown in Figure 3, even within more challenging benchmarks, items often present only moderate difficulty to elite LLMs. For instance, item difficulty scores in the IRT scaling may be as low as 1.0 for models exhibiting ability scores above 3.0. This suggests that while such benchmarks can assess average models, they are less effective at separating most advanced systems, suggesting that they are insufficient for comprehensively evaluating frontier model capabilities.
Finding 3: Generally low LEH scores across most benchmarks reveal widespread item saturation.
While Table 3 indicates that datasets like GPQA Diamond and TheoremQA achieve the highest relative ranks for average LEH, suggesting they offer more headroom than other benchmarks, the absolute LEH values in Figure 3 are often smaller than ideal. Conversely, benchmarks such as MATH and particularly GSM8K exhibit even lower average LEH scores. This signifies that current high-performing models are already approaching or have reached the performance ceiling for a substantial portion of items within these test sets. This necessitates the development of new benchmark items and datasets explicitly designed with greater headroom as models continue to evolve.
Finding 4: Outlier-high guessing-rates in many benchmark items flag risks of data contamination.
The guessing-rate reflects the chance that a model can answer a question correctly without actual understanding, typically by exploiting format-based cues or shortcuts. As shown in Figure 3, datasets like ARC-C, HellaSwag, and MMLU generally present higher guessing-rates, possibly due to their multiple-choice formats. Notably, further inspection of the item guessing-rate parameter distributions, as depicted in Figure 3, reveals that a considerable number of items across several benchmarks exhibit unusually high guessing-rates. This observation regards the potential for such items to indicate data contamination, namely the content or answers for these items might have been present in the models’ pre-training data Zhuang et al. (2024).
Finding 5: Widespread low-feasibility items in scientific benchmarks reveal flawed question design.
Feasibility estimates how well a question can be answered based on the information provided. Low feasibility often arises from underspecified or overly broad questions, where even a strong model cannot determine a clear or defensible answer. As shown in Figure 3, datasets like TheoremQA and GPQA Diamond exhibit lower feasibility, likely due to complex scientific contexts or vague problem descriptions. In contrast, ARC-C and HellaSwag have high feasibility, suggesting their questions are well-formed and specific. Low feasibility more often reflects weaknesses in annotation quality or task design, and such items can distort evaluation by penalizing models for failing to resolve ambiguities Rodriguez et al. (2021).
Finding 6: Item discriminability is weakened by excessively high or low item difficulty.
As shown in Table 3, benchmarks such as MATH and GSM8K achieve high discriminability, while GPQA Diamond and TheoremQA exhibit the lowest discriminability. This limited variability in model outcomes on these latter datasets may arise from too high item difficulty, thereby reducing their capacity for precise model differentiation.
Moreover, as shown in Figure 4, item discriminability tends to be lower when item difficulty reaches extreme levels—being either too easy or too hard. Consequently, datasets that feature a balanced distribution of difficulty often exhibit higher discriminability, enabling them to more effectively distinguish between models of varying capabilities.
6 Efficient Benchmarking with PSN-IRT
The pursuit of comprehensive LLM evaluation has often led to the creation of increasingly large and diverse benchmark datasets. However, the sheer volume of benchmark items does not inherently guarantee higher quality or more insightful evaluations, and can incur significant computational costs. In this section, we explore how PSN-IRT can facilitate more efficient benchmarking by guiding the strategic curation of smaller, yet highly informative, item sets that maintain or even enhance evaluation accuracy and reliability compared to larger, undifferentiated collections.
To empirically examine this principle, we design an experiment to evaluate the effectiveness of different item selection strategies. Our methodology involve Benchmark Agreement Testing (BAT) Perlitz et al. (2024). We first establish a reference model ranking by aggregating results from two public leaderboards: Chatbot Arena Chiang et al. (2024) and OpenCompass Arena Contributors (2023)999These arenas are based on human evaluation and thus reflect human preference regarding overall model capabilities.. Subsequently, various subsets of benchmark items are chosen based on different criteria. Model rankings generated using these subsets are then compared against the reference arena ranking using Kendall’s to measure agreement. Alongside agreement, we also consider the variance of model scores on these subsets; higher variance generally indicates the subset’s capacity to differentiate more clearly between models. The evaluations are conducted using two distinct model groupings: one set comprising a mix of stronger and weaker models ("w/ weak models"), and another set from which weaker models are excluded ("w/o weak models"), to specifically assess differentiation among stronger contenders.
As shown in Table 4, selecting items based on Fisher information consistently produces model rankings with superior alignment to the reference arena ranking. For instance, a carefully selected subset composed of just 1000 items chosen via the Fisher information criterion achieves a Kendall’s of up to 0.9048. This level of agreement markedly surpasses that achieved by rankings derived from using all available items or from similarly sized randomly selected subsets.
In contrast, other item selection metrics such as discriminability proves less effective for differentiating among strong models. While such items are typically adept at distinguishing between broad capability tiers (e.g., strong versus weak models), they often lack the granularity to capture nuanced performance differences at the higher end of the ability spectrum. This further verify the estimation reliability of our proposed PSN-IRT.
| Metric | w/ weak models | w/o weak models | ||
|---|---|---|---|---|
| Variance | Kendall | Variance | Kendall | |
| All | 0.0434 | 0.6444 | 0.0010 | 0.2381 |
| Top 400 | ||||
| Random | 0.0421 | 0.6444 | 0.0007 | 0.2381 |
| Discrim. | 0.1841 | 0.5556 | 0.0000 | 0.2381 |
| Fisher | 0.0049 | 0.6889 | 0.0033 | 0.7143 |
| Top 1000 | ||||
| Random | 0.0406 | 0.6444 | 0.0009 | 0.2381 |
| Discrim. | 0.1805 | 0.6000 | 0.0000 | 0.3813 |
| Fisher | 0.0039 | 0.6889 | 0.0030 | 0.9048 |
7 Conclusion
In this work, we introduce PSN-IRT, a framework that combines psychometrics with neural networks to provide comprehensive and reliable analyses of LLM benchmarks. Through extensive experiments on 12 LLMs across 11 diverse datasets, we demonstrate that current benchmarks often suffer from uneven measurement properties, insufficient difficulty ceilings, item saturation, and data contamination. Moreover, we show that strategically selecting smaller, high-quality item sets using PSN-IRT enhances alignment with human preference and separability among top models.
Limitations
Our work still has some limitations: 1) The current analysis is based on a specific selection of contemporary LLMs and benchmarks. Future studies could extend our analysis to encompass a broader and more diverse range of models and datasets as they emerge. 2) PSN-IRT is designed to process binary (correct/incorrect) outcome data. This restricts its direct applicability to benchmarks that utilize graded scoring Zheng et al. (2023), for which extensions incorporating more generalized psychometric models would be necessary. 3) The item parameters estimated by PSN-IRT are currently dependent on the items being included in the training data, meaning that analyzing entirely new, unseen items typically requires retraining the model. Future iterations could explore the integration of item content features to potentially enable parameter estimation for new items without full retraining.
References
- Austin et al. (2021) Jacob Austin, Augustus Odena, Maxwell Nye, Maarten Bosma, Henryk Michalewski, David Dohan, Ellen Jiang, Carrie Cai, Michael Terry, Quoc Le, and Charles Sutton. 2021. Program synthesis with large language models. Preprint, arXiv:2108.07732.
- Baker and Kim (2004) Frank B Baker and Seock-Ho Kim. 2004. Item response theory: Parameter estimation techniques. CRC press.
- Byrd and Srivastava (2022) Matthew Byrd and Shashank Srivastava. 2022. Predicting difficulty and discrimination of natural language questions. In Proceedings of the 60th Annual Meeting of the Association for Computational Linguistics (Volume 2: Short Papers), pages 119–130, Dublin, Ireland. Association for Computational Linguistics.
- Chen et al. (2021) Mark Chen, Jerry Tworek, Heewoo Jun, Qiming Yuan, Henrique Ponde de Oliveira Pinto, Jared Kaplan, Harri Edwards, Yuri Burda, Nicholas Joseph, Greg Brockman, Alex Ray, Raul Puri, Gretchen Krueger, Michael Petrov, Heidy Khlaaf, Girish Sastry, Pamela Mishkin, Brooke Chan, Scott Gray, and 39 others. 2021. Evaluating large language models trained on code.
- Chen et al. (2023) Wenhu Chen, Ming Yin, Max Ku, Pan Lu, Yixin Wan, Xueguang Ma, Jianyu Xu, Xinyi Wang, and Tony Xia. 2023. TheoremQA: A theorem-driven question answering dataset. In Proceedings of the 2023 Conference on Empirical Methods in Natural Language Processing, pages 7889–7901, Singapore. Association for Computational Linguistics.
- Chiang et al. (2023) Wei-Lin Chiang, Zhuohan Li, Zi Lin, Ying Sheng, Zhanghao Wu, Hao Zhang, Lianmin Zheng, Siyuan Zhuang, Yonghao Zhuang, Joseph E. Gonzalez, Ion Stoica, and Eric P. Xing. 2023. Vicuna: An open-source chatbot impressing gpt-4 with 90%* chatgpt quality.
- Chiang et al. (2024) Wei-Lin Chiang, Lianmin Zheng, Ying Sheng, Anastasios Nikolas Angelopoulos, Tianle Li, Dacheng Li, Banghua Zhu, Hao Zhang, Michael Jordan, Joseph E. Gonzalez, and Ion Stoica. 2024. Chatbot arena: An open platform for evaluating LLMs by human preference. In Proceedings of the 41st International Conference on Machine Learning, volume 235 of Proceedings of Machine Learning Research, pages 8359–8388. PMLR.
- Clark et al. (2018) Peter Clark, Isaac Cowhey, Oren Etzioni, Tushar Khot, Ashish Sabharwal, Carissa Schoenick, and Oyvind Tafjord. 2018. Think you have solved question answering? try arc, the ai2 reasoning challenge. arXiv:1803.05457v1.
- Cobbe et al. (2021) Karl Cobbe, Vineet Kosaraju, Mohammad Bavarian, Mark Chen, Heewoo Jun, Lukasz Kaiser, Matthias Plappert, Jerry Tworek, Jacob Hilton, Reiichiro Nakano, Christopher Hesse, and John Schulman. 2021. Training verifiers to solve math word problems. arXiv preprint arXiv:2110.14168.
- Contributors (2023) OpenCompass Contributors. 2023. Opencompass: A universal evaluation platform for foundation models. https://github.com/open-compass/opencompass.
- DeepSeek-AI et al. (2025) DeepSeek-AI, Aixin Liu, Bei Feng, Bing Xue, Bingxuan Wang, Bochao Wu, Chengda Lu, Chenggang Zhao, Chengqi Deng, Chenyu Zhang, Chong Ruan, Damai Dai, Daya Guo, Dejian Yang, Deli Chen, Dongjie Ji, Erhang Li, Fangyun Lin, Fucong Dai, and 181 others. 2025. Deepseek-v3 technical report. Preprint, arXiv:2412.19437.
- DeVellis (2006) Robert F DeVellis. 2006. Classical test theory. Medical care, 44(11):S50–S59.
- Hastings (1970) W Keith Hastings. 1970. Monte carlo sampling methods using markov chains and their applications.
- He et al. (2024) Yancheng He, Shilong Li, Jiaheng Liu, Yingshui Tan, Weixun Wang, Hui Huang, Xingyuan Bu, Hangyu Guo, Chengwei Hu, Boren Zheng, Zhuoran Lin, Xuepeng Liu, Dekai Sun, Shirong Lin, Zhicheng Zheng, Xiaoyong Zhu, Wenbo Su, and Bo Zheng. 2024. Chinese simpleqa: A chinese factuality evaluation for large language models. Preprint, arXiv:2411.07140.
- Hendrycks et al. (2021a) Dan Hendrycks, Collin Burns, Steven Basart, Andy Zou, Mantas Mazeika, Dawn Song, and Jacob Steinhardt. 2021a. Measuring massive multitask language understanding. Proceedings of the International Conference on Learning Representations (ICLR).
- Hendrycks et al. (2021b) Dan Hendrycks, Collin Burns, Saurav Kadavath, Akul Arora, Steven Basart, Eric Tang, Dawn Song, and Jacob Steinhardt. 2021b. Measuring mathematical problem solving with the math dataset. NeurIPS.
- Jiang et al. (2023) Albert Q. Jiang, Alexandre Sablayrolles, Arthur Mensch, Chris Bamford, Devendra Singh Chaplot, Diego de las Casas, Florian Bressand, Gianna Lengyel, Guillaume Lample, Lucile Saulnier, Lélio Renard Lavaud, Marie-Anne Lachaux, Pierre Stock, Teven Le Scao, Thibaut Lavril, Thomas Wang, Timothée Lacroix, and William El Sayed. 2023. Mistral 7b. Preprint, arXiv:2310.06825.
- Jordan et al. (1999) Michael I Jordan, Zoubin Ghahramani, Tommi S Jaakkola, and Lawrence K Saul. 1999. An introduction to variational methods for graphical models. Machine learning, 37:183–233.
- Li et al. (2024) Tianle Li, Wei-Lin Chiang, Evan Frick, Lisa Dunlap, Tianhao Wu, Banghua Zhu, Joseph E Gonzalez, and Ion Stoica. 2024. From crowdsourced data to high-quality benchmarks: Arena-hard and benchbuilder pipeline. arXiv preprint arXiv:2406.11939.
- Lord et al. (1968) FM Lord, MR Novick, and Allan Birnbaum. 1968. Statistical theories of mental test scores.
- Lord (1980) Frederic M Lord. 1980. Applications of item response theory to practical testing problems.
- Maia Polo et al. (2024) Felipe Maia Polo, Lucas Weber, Leshem Choshen, Yuekai Sun, Gongjun Xu, and Mikhail Yurochkin. 2024. tinyBenchmarks: evaluating LLMs with fewer examples. In Proceedings of the 41st International Conference on Machine Learning, volume 235 of Proceedings of Machine Learning Research, pages 34303–34326. PMLR.
- Mart´ınez-Plumed et al. (2019) Fernando Martínez-Plumed, Ricardo BC Prudêncio, Adolfo Martínez-Usó, and José Hernández-Orallo. 2019. Item response theory in ai: Analysing machine learning classifiers at the instance level. Artificial intelligence, 271:18–42.
- McIntosh et al. (2024) Timothy R McIntosh, Teo Susnjak, Nalin Arachchilage, Tong Liu, Paul Watters, and Malka N Halgamuge. 2024. Inadequacies of large language model benchmarks in the era of generative artificial intelligence. arXiv preprint arXiv:2402.09880.
- Perlitz et al. (2024) Yotam Perlitz, Ariel Gera, Ofir Arviv, Asaf Yehudai, Elron Bandel, Eyal Shnarch, Michal Shmueli-Scheuer, and Leshem Choshen. 2024. Do these llm benchmarks agree? fixing benchmark evaluation with benchbench. Preprint, arXiv:2407.13696.
- Rein et al. (2024) David Rein, Betty Li Hou, Asa Cooper Stickland, Jackson Petty, Richard Yuanzhe Pang, Julien Dirani, Julian Michael, and Samuel R. Bowman. 2024. GPQA: A graduate-level google-proof q&a benchmark. In First Conference on Language Modeling.
- Rodriguez et al. (2021) Pedro Rodriguez, Joe Barrow, Alexander Miserlis Hoyle, John P. Lalor, Robin Jia, and Jordan Boyd-Graber. 2021. Evaluation examples are not equally informative: How should that change NLP leaderboards? In Proceedings of the 59th Annual Meeting of the Association for Computational Linguistics and the 11th International Joint Conference on Natural Language Processing (Volume 1: Long Papers), pages 4486–4503, Online. Association for Computational Linguistics.
- Suzgun et al. (2023) Mirac Suzgun, Nathan Scales, Nathanael Schärli, Sebastian Gehrmann, Yi Tay, Hyung Won Chung, Aakanksha Chowdhery, Quoc Le, Ed Chi, Denny Zhou, and Jason Wei. 2023. Challenging BIG-bench tasks and whether chain-of-thought can solve them. In Findings of the Association for Computational Linguistics: ACL 2023, pages 13003–13051, Toronto, Canada. Association for Computational Linguistics.
- Team et al. (2024a) Gemini Team, Petko Georgiev, Ving Ian Lei, Ryan Burnell, Libin Bai, Anmol Gulati, Garrett Tanzer, Damien Vincent, Zhufeng Pan, Shibo Wang, Soroosh Mariooryad, Yifan Ding, Xinyang Geng, Fred Alcober, Roy Frostig, Mark Omernick, Lexi Walker, Cosmin Paduraru, Christina Sorokin, and 1118 others. 2024a. Gemini 1.5: Unlocking multimodal understanding across millions of tokens of context. Preprint, arXiv:2403.05530.
- Team et al. (2024b) Gemma Team, Thomas Mesnard, Cassidy Hardin, Robert Dadashi, Surya Bhupatiraju, Shreya Pathak, Laurent Sifre, Morgane Rivière, Mihir Sanjay Kale, Juliette Love, Pouya Tafti, Léonard Hussenot, Pier Giuseppe Sessa, Aakanksha Chowdhery, Adam Roberts, Aditya Barua, Alex Botev, Alex Castro-Ros, Ambrose Slone, and 89 others. 2024b. Gemma: Open models based on gemini research and technology. Preprint, arXiv:2403.08295.
- Tsutsumi et al. (2021) Emiko Tsutsumi, Ryo Kinoshita, and Maomi Ueno. 2021. Deep item response theory as a novel test theory based on deep learning. Electronics, 10(9):1020.
- Vania et al. (2021) Clara Vania, Phu Mon Htut, William Huang, Dhara Mungra, Richard Yuanzhe Pang, Jason Phang, Haokun Liu, Kyunghyun Cho, and Samuel R. Bowman. 2021. Comparing test sets with item response theory. In Proceedings of the 59th Annual Meeting of the Association for Computational Linguistics and the 11th International Joint Conference on Natural Language Processing (Volume 1: Long Papers), pages 1141–1158, Online. Association for Computational Linguistics.
- Wake et al. (2025) Alan Wake, Bei Chen, C. X. Lv, Chao Li, Chengen Huang, Chenglin Cai, Chujie Zheng, Daniel Cooper, Fan Zhou, Feng Hu, Ge Zhang, Guoyin Wang, Heng Ji, Howard Qiu, Jiangcheng Zhu, Jun Tian, Katherine Su, Lihuan Zhang, Liying Li, and 25 others. 2025. Yi-lightning technical report. Preprint, arXiv:2412.01253.
- Wei et al. (2024) Jason Wei, Nguyen Karina, Hyung Won Chung, Yunxin Joy Jiao, Spencer Papay, Amelia Glaese, John Schulman, and William Fedus. 2024. Measuring short-form factuality in large language models. Preprint, arXiv:2411.04368.
- White et al. (2025) Colin White, Samuel Dooley, Manley Roberts, Arka Pal, Benjamin Feuer, Siddhartha Jain, Ravid Shwartz-Ziv, Neel Jain, Khalid Saifullah, Sreemanti Dey, Shubh-Agrawal, Sandeep Singh Sandha, Siddartha Venkat Naidu, Chinmay Hegde, Yann LeCun, Tom Goldstein, Willie Neiswanger, and Micah Goldblum. 2025. Livebench: A challenging, contamination-limited LLM benchmark. In The Thirteenth International Conference on Learning Representations.
- Wu et al. (2020) Mike Wu, Richard L. Davis, Benjamin W. Domingue, Chris Piech, and Noah D. Goodman. 2020. Variational item response theory: Fast, accurate, and expressive. In Proceedings of the 13th International Conference on Educational Data Mining, EDM 2020, Fully virtual conference, July 10-13, 2020. International Educational Data Mining Society.
- Yang et al. (2024) An Yang, Baosong Yang, Beichen Zhang, Binyuan Hui, Bo Zheng, Bowen Yu, Chengyuan Li, Dayiheng Liu, Fei Huang, Haoran Wei, Huan Lin, Jian Yang, Jianhong Tu, Jianwei Zhang, Jianxin Yang, Jiaxi Yang, Jingren Zhou, Junyang Lin, Kai Dang, and 22 others. 2024. Qwen2.5 technical report. arXiv preprint arXiv:2412.15115.
- Zellers et al. (2019) Rowan Zellers, Ari Holtzman, Yonatan Bisk, Ali Farhadi, and Yejin Choi. 2019. HellaSwag: Can a machine really finish your sentence? In Proceedings of the 57th Annual Meeting of the Association for Computational Linguistics, pages 4791–4800, Florence, Italy. Association for Computational Linguistics.
- Zheng et al. (2023) Lianmin Zheng, Wei-Lin Chiang, Ying Sheng, Siyuan Zhuang, Zhanghao Wu, Yonghao Zhuang, Zi Lin, Zhuohan Li, Dacheng Li, Eric Xing, Hao Zhang, Joseph E Gonzalez, and Ion Stoica. 2023. Judging llm-as-a-judge with mt-bench and chatbot arena. In Advances in Neural Information Processing Systems, volume 36, pages 46595–46623. Curran Associates, Inc.
- Zhuang et al. (2024) Yan Zhuang, Qi Liu, Yuting Ning, Weizhe Huang, Zachary A. Pardos, Patrick C. Kyllonen, Jiyun Zu, Qingyang Mao, Rui Lv, Zhenya Huang, Guanhao Zhao, Zheng Zhang, Shijin Wang, and Enhong Chen. 2024. From static benchmarks to adaptive testing: Psychometrics in ai evaluation. Preprint, arXiv:2306.10512.
Appendix A Appendix
A.1 Detailed Statistics
We provide the full list of average item-level property estimates for each dataset in Table 5. These values are computed as the mean of all item parameters within a benchmark and include difficulty, discriminability, guessing-rate, feasibility, LEH score, and Fisher information. The table allows for fine-grained comparisons between benchmarks beyond their aggregated rankings.
| Dataset | Difficulty | Discriminability | Guessing | Feasibility | LEH | Fisher |
|---|---|---|---|---|---|---|
| ARC-C | -1.1637 | 1.2822 | 0.2621 | 0.9481 | 0.0041 | 0.0005 |
| BBH | -0.6033 | 1.3845 | 0.1657 | 0.8747 | 0.0057 | 0.0006 |
| Chinese SimpleQA | 0.2656 | 1.4474 | 0.0609 | 0.7088 | 0.0089 | 0.0006 |
| GPQA Diamond | 0.1902 | 0.8598 | 0.1518 | 0.6437 | 0.0142 | 0.0014 |
| GSM8K | -0.7899 | 1.5255 | 0.1491 | 0.9167 | 0.0038 | 0.0004 |
| HellaSwag | -1.0353 | 1.2920 | 0.2449 | 0.9304 | 0.0047 | 0.0006 |
| HumanEval | -0.6351 | 1.4459 | 0.1565 | 0.8957 | 0.0046 | 0.0005 |
| MATH | -0.2396 | 1.5793 | 0.0673 | 0.8290 | 0.0054 | 0.0004 |
| MBPP | -0.3456 | 1.3625 | 0.1345 | 0.8221 | 0.0071 | 0.0007 |
| MMLU | -0.8383 | 1.1968 | 0.2381 | 0.8921 | 0.0067 | 0.0008 |
| TheoremQA | 0.6548 | 1.0656 | 0.0888 | 0.5012 | 0.0145 | 0.0013 |
A.2 Case Study
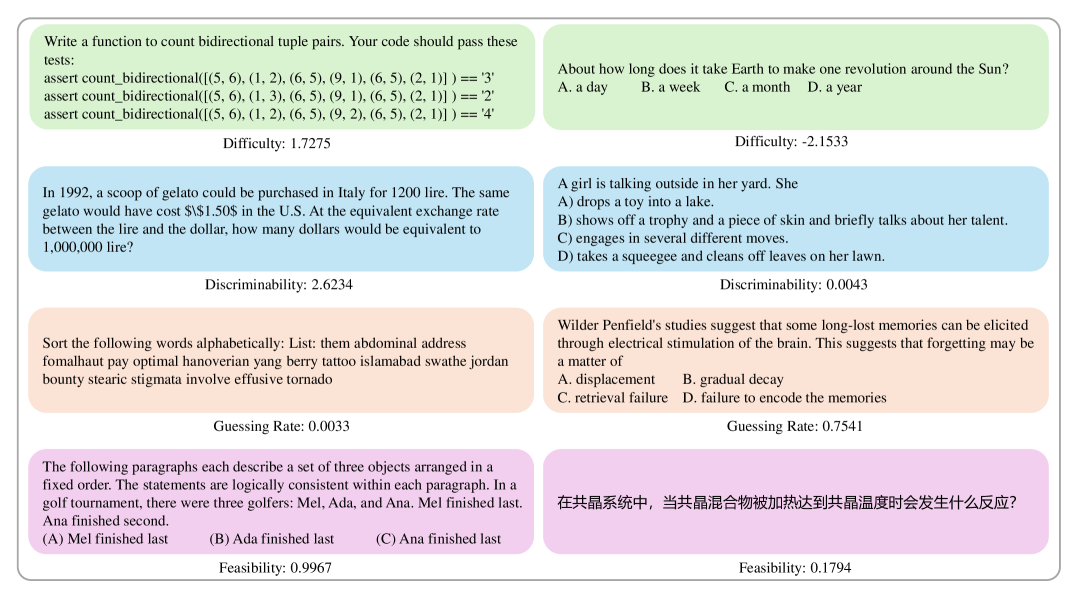
As depicted in Figure 5, these parameters capture a wide range of item behaviors:
-
•
For difficulty, the figure contrasts a complex coding task with a simple factual recall question, showcasing items at opposite ends of the challenge spectrum.
-
•
Examples for discriminability include a quantitative reasoning problem with a high value, indicating strong differentiating power, and a common-sense inference task with a low value, suggesting limited ability to distinguish between models.
-
•
For guessing-rate, an alphabetical sorting task exhibits a very low estimated parameter, offering little opportunity for chance success. In contrast, a multiple-choice question concerning scientific studies shows an exceptionally high guessing parameter. This item’s content is publicly accessible online, suggesting an associated risk of data contamination.
-
•
For feasibility, a logical arrangement task shows high feasibility, implying clarity and high attainability for proficient models, while a domain-specific question exhibits low feasibility, suggesting potential item ambiguities.
A.3 Ablation Study
To investigate the impact of model configurations, we evaluate PSN-IRT and baseline methods across 1PL to 4PL parameters, as shown in Table 6. Among these models, the Two-Parameter Logistic (2PL) model builds upon the 1PL by incorporating an item discriminability parameter :
| (5) |
Subsequently, the Three-Parameter Logistic (3PL) model extends the 2PL by adding a guessing-rate parameter :
| (6) |
The results demonstrate that performance exhibits no consistent pattern with increasing parameter complexity. While PSN-IRT with 4PL achieves the highest performance, simpler models occasionally outperform more complex ones in traditional IRT methods.
Additionally, we explore replacing one-hot encodings with learned embeddings and substituting the multi-layer perceptron with a graph neural network to model LLM-item interactions. However, these modifications failed to yield significant improvements, likely due to the inherent simplicity of LLM-item interaction patterns that don’t require complex relational modeling. We will explore improved input representations and model architectures as future work to enhance model robustness.
| Model | Method | Parameter | ACC | F1 | AUC | Kendall | Average |
|---|---|---|---|---|---|---|---|
| IRT | MLE | 1PL | 0.7219 | 0.8035 | 0.6970 | 1.0000 | 0.8056 |
| 2PL | 0.7172 | 0.7998 | 0.6963 | 0.9091 | 0.7806 | ||
| 3PL | 0.7218 | 0.8031 | 0.7057 | 0.9697 | 0.8001 | ||
| 4PL | 0.7211 | 0.8034 | 0.7012 | 0.9697 | 0.7989 | ||
| MCMC | 1PL | 0.7168 | 0.8011 | 0.7268 | 0.9697 | 0.8036 | |
| 2PL | 0.7232 | 0.8130 | 0.7301 | 0.9697 | 0.8090 | ||
| 3PL | 0.7172 | 0.8081 | 0.7297 | 1.0000 | 0.8138 | ||
| 4PL | 0.7070 | 0.7811 | 0.7278 | 0.9697 | 0.7964 | ||
| VI | 1PL | 0.7209 | 0.8024 | 0.6822 | 0.9697 | 0.7938 | |
| 2PL | 0.7198 | 0.8012 | 0.6938 | 1.0000 | 0.8037 | ||
| 3PL | 0.7189 | 0.8011 | 0.6956 | 0.9697 | 0.7963 | ||
| 4PL | 0.7201 | 0.8015 | 0.6940 | 0.9091 | 0.7812 | ||
| VIBO | 1PL | 0.7007 | 0.7801 | 0.6901 | 0.9697 | 0.7852 | |
| 2PL | 0.7301 | 0.8048 | 0.6987 | 0.8788 | 0.7781 | ||
| 3PL | 0.7172 | 0.7993 | 0.7048 | 0.9091 | 0.7826 | ||
| 4PL | 0.7188 | 0.8007 | 0.7055 | 0.9697 | 0.7987 | ||
| Deep-IRT | Deep Learning | 1PL | 0.7969 | 0.8507 | 0.8507 | 0.9697 | 0.8670 |
| PSN-IRT | Deep Learning | 1PL | 0.7948 | 0.8497 | 0.8473 | 0.9091 | 0.8502 |
| 2PL | 0.7560 | 0.8266 | 0.8259 | 0.9697 | 0.8445 | ||
| 3PL | 0.7965 | 0.8510 | 0.8510 | 0.8788 | 0.8443 | ||
| 4PL | 0.7991 | 0.8520 | 0.8477 | 1.0000 | 0.8747 |