No Gold Standard, No Problem: Reference-Free Evaluation of Taxonomies
Abstract
We introduce two reference-free metrics for quality evaluation of taxonomies. The first metric evaluates robustness by calculating the correlation between semantic and taxonomic similarity, covering a type of error not handled by existing metrics. The second uses Natural Language Inference to assess logical adequacy. Both metrics are tested on five taxonomies and are shown to correlate well with F1 against gold-standard taxonomies.
No Gold Standard, No Problem: Reference-Free Evaluation of Taxonomies
Pascal Wullschleger⋄,†, Majid Zarharan⋄, Donnacha Daly† Marc Pouly†, Jennifer Foster⋄ ⋄ School of Computing, Dublin City University † Lucerne School of Computer Science and Information Technology pascal.wullschleger@hslu.ch
1 Introduction
Taxonomies are hierarchical systems used to classify items, ideas, or organisms based on shared characteristics. They help organize information, making it easier to find, understand, and manage. In the food industry, for example, taxonomies play a critical role in the development of new recipes and their adaptation to changing culinary trends, dietary requirements, and sustainability objectives.
Automated taxonomy generation addresses the challenges posed by ever-increasing volumes of unstructured information. By leveraging machine learning, automated systems can identify emergent categories, detect previously unrecognized relationships, and update or create taxonomic structures in real time with minimal human effort.
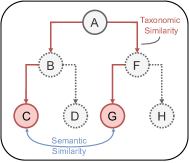
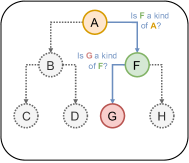
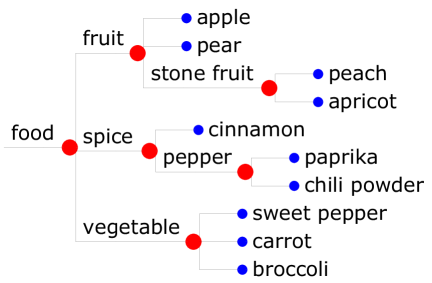
Approaches for automatically generating or completing taxonomies are usually evaluated against gold standard taxonomies Manzoor et al. (2020); Wang et al. (2022); Liu et al. (2021); Zhang et al. (2021); Xu et al. (2023); Shen et al. (2020), ignoring the fact, that there can be multiple valid taxonomies for a given set of concepts. Furthermore, when generating taxonomies from scratch, there might be no gold standard to compare against, making reference-free measures attractive. To our knowledge, efforts in this area have been limited to work by Langlais and Gao (2023). We build on established taxonomy quality criteria, particularly robustness Unterkalmsteiner and Adbeen (2023), but find existing automated measures insufficient for certain errors. Likewise, criteria for human-curated taxonomies overlook logical adequacy, such as whether a child concept is truly a subtype of its parent. Consequently, we suggest two basic properties for evaluating taxonomy quality in a reference-free way: the correlation of semantic and taxonomic similarity (robustness – see Fig.1a) and the recognition of is-a parent-child relationships (logical adequacy – see Fig.1b). In a comparison on five different taxonomies, we demonstrate the potential of these measures on taxonomies across the food, lexical and medical domains.
2 Preliminaries
Following Zeng et al. (2021), a taxonomy is a directed acyclic graph with edges pointing from a parent concept to a child concept . Edges represent hypernym-hyponym relations, where the child concept is the least detailed but different specialization of the parent concept. A placement of a concept is called a triplet , where is the query concept that is placed as a child of and as a parent of . Following Manzoor et al. (2020), we add a pseudo-leaf and a pseudo-root to to accommodate concepts without parents or children. This means that if is a leaf, is the pseudo-leaf and if is the root, then is the pseudo-root. To compare a custom taxonomy to a gold standard, precision, recall and F1 can be calculated over triplets (see App. A).
As a measure of taxonomic similarity we use the well-established Wu & Palmer Similarity (WPS) Wu and Palmer (1994). Let denote the path from the root concept to a target concept . Furthermore, let denote the depth of the least common ancestor of the paths and . Then the WPS (Eq. 1) represents the similarity between concepts and in the range , with meaning that they share the same parent.
| (1) |
3 Taxonomy Quality Attributes
In their compendium of taxonomy quality attributes, Unterkalmsteiner and Adbeen (2023) consolidate various names for the taxonomy quality attributes found in prior work and identify a minimal, well-defined set of measurable attributes — comprehensiveness, robustness, conciseness, extensibility, explanatory, mutual exclusiveness, reliability. They evaluate these attributes on six taxonomies across three domains111For an overview of the criteria, see Appendix B..
We focus on robustness, which represents how well a taxonomy can tell things apart, meaning how clearly the concepts in a taxonomy represent different ideas and how closely related sibling concepts are. Robustness is intrinsic and therefore independent of the application of the taxonomy, which allows for evaluation in an automated way.
We also observe that existing works do not account for the need to assess violations of the is-a property. While such erroneous relations are rare in human-created taxonomies, this does not necessarily hold for generated taxonomies. We refer to this property as logical adequacy.
4 Methodology
This section outlines our approach to evaluating taxonomy robustness and logical adequacy.
4.1 Robustness
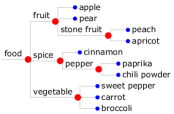
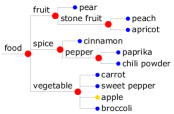
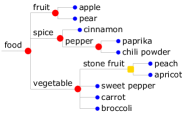
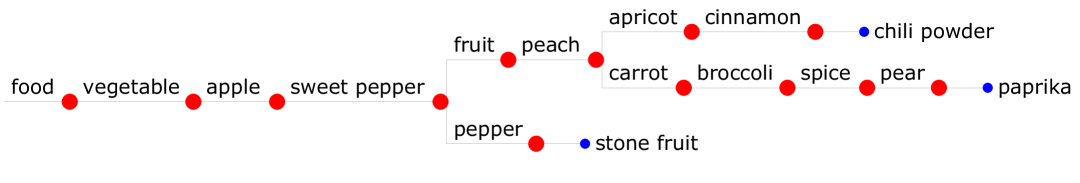
We suggest the following two (non-exhaustive) scenarios to which a robustness measure should be sensitive, and propose mutations to test the scenarios on a toy example (see Fig. 2).
Unterkalmsteiner and Adbeen (2023) propose Semantic Proximity (SP) as a robustness metric that measures the rate of intruders in groups of siblings. They check if the minimum inter-group similarity is larger than the minimum extra-group similarity and average over all groups. For a precise definition see App. C.
The SP metric has the property that it disregards the hierarchical nature of taxonomies. It essentially treats groups of leaves as clusters, but does not consider that they could be nested in a hierarchical structure. We expect SP to be insensitive to Mutation 2 (Fig. 2c) since it only looks at groups of leaf concepts to calculate a score and in Mutation 2, only non-leaf concepts, but not leaves, are changed.
To mitigate this, we propose Concept Similarity Correlation (CSC) to measure robustness based on the assumption that the semantic distance between concept terms and their taxonomic distance should correlate. We measure the Wu & Palmer Similarity between concepts and using the paths from the root to the concepts (Eq. 1). Next, for each concept in the taxonomy, we define its semantic representation as the embedding of the concept description. Our CSC score is the Kendall rank correlation of the semantic (cosine) similarity between concept representations and the taxonomic similarity . Thus, we make the assumption, that the relationship between taxonomic and semantic similarity is monotonically increasing, i.e if semantic similarity increases, so does taxonomic similarity.
| (2) |
4.2 Logical Adequacy
Since a robustness measure does not necessarily respect that parent-child relations need to be of the type is-a in a taxonomy, we introduce a second measure to assess this. From a probabilistic standpoint, we express this as the likelihood of correctly classifying an external object using the taxonomy.
Probabilistic Interpretation
A classification process is a walk on the taxonomy graph represented as a tuple of relations that connect the root concept to any concept under which an external object is classified, with and for . If denotes the event of adequacy, it follows that the probability of the classification being adequate is the joint probability of the parent-child relations being adequate (Eq. 3)222 depends only on the local parent-child relation .
| (3) |
This will guide an optimization process towards a taxonomy where all leaf concepts are directly attached to the root (see App. D). Drawing inspiration from comparison of probabilities of documents with different lengths in language modeling, we apply the perplexity Jelinek et al. (2005), which is the reciprocal of the geometric mean of the sequence of probabilities (see App. E). We obtain a normalized probability by the geometric mean of the relation probabilities (Eq. 4)
| (4) |
We can now express the normalized probability that a randomly sampled classification in our taxonomy is adequate as the union probability across classifications. Since we have no notion of what the distribution of classifications looks like during the application of the taxonomy, we define it as uniform for the purpose of the metric. Factoring out the probability of a random classification, this results in the mean over probabilities of adequacy given the classification (Eq. 5). For an extended derivation, see App. D.
| (5) |
Approximating Relation Probabilities
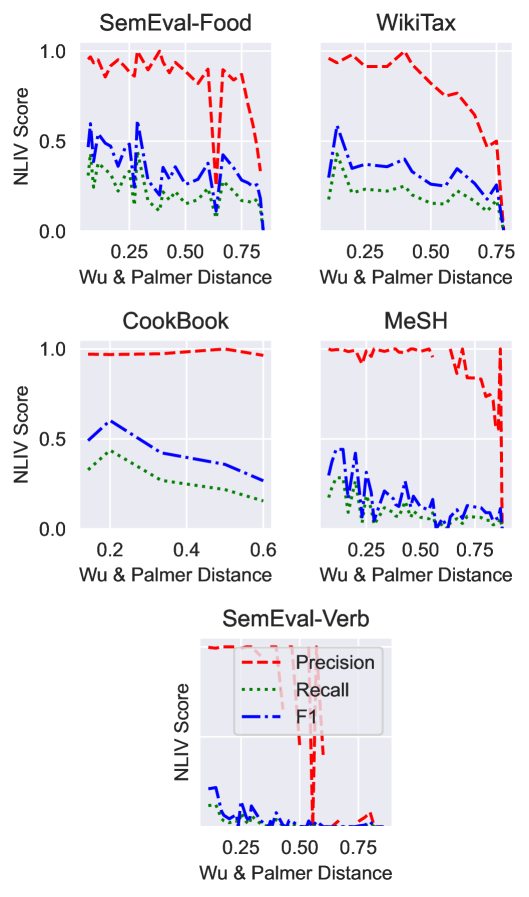
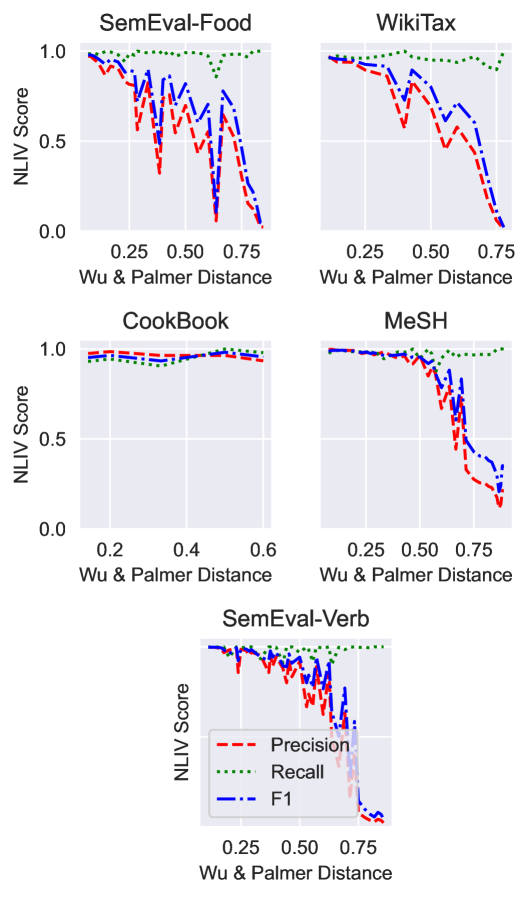
We estimate using Natural Language Inference (NLI) by calculating the probability of a relation being adequate. We rely on a flavor of NLI that approximates a probability distribution over the classes of contradicts, neutral and entails, given a premise and hypothesis separated by a dot. For example, consider the relation (antipasto, appetizer) in a taxonomy about food items. We define the premise as "antipasto is a course of appetizers in an Italian meal" and the hypothesis as "antipasto is a kind of appetizer".
There are two possibilities for estimating the probability of a relation being adequate: the child description 1) must entail the relation (strong, NLIV-S) or 2) must not contradict the relation (weak, NLIV-W). The strict and weak versions are shown in Eq. 7 and Eq. 8 for parent and child . The expression denotes the string of the premise and hypothesis resulting from the relation by application of the template in Eq. 6, where denotes the concept description and the lemma of the concept name for .
| (6) | ||||
| (7) | ||||
| (8) | ||||
Parallels to Previous Work
Langlais and Gao (2023) propose rating parent-child relationships in a taxonomy by generating valid parent concepts for a given child using masked language model prompts and assessing whether the true parent appears in the set of valid parents. While they average over all parent-child pairs, we compare complete classifications. We argue that incorrect relations at higher levels should impact the score more than e.g., misclassified leaves deep in the taxonomy. We compare to their metric, RaTE, in our experiments.
5 Experiments
Following Xu et al. (2023) and Wang et al. (2022), we evaluate on SemEval-Food (SF), SemEval-Verb (SV), and MeSH (ME) datasets. SemEval-Food, the largest taxonomy from SemEval-2016 Task 13, was used to evaluate taxonomy extraction methods for a given corpus Bordea et al. (2016). SemEval-Verb, based on WordNet 3.0 Fellbaum (2019), was featured in SemEval-2016 Task 14 for evaluating taxonomy enrichment approaches Jurgens and Pilehvar (2016). MeSH is a hierarchical vocabulary of medical terms Lipscomb (2000).
Additionally, we extract a taxonomy from Wikidata333https://www.wikidata.org/ (WT) using Food (Q2095) as the root and retrieving all descendants (see App. F.3). We also utilize a proprietary taxonomy from a major food market chain employed in recipe development, which we call the CookBook (CB) taxonomy.444Both taxonomies will be released with our source code upon publication. For details on the datasets see App. F.1.
To evaluate our proposed metrics, we first show their behavior on our toy example from Fig. 2 and then conduct a more thorough empirical validation using our benchmark taxonomies, which we assume to be of high quality and reflect human judgment. We create degraded versions of all taxonomies by randomly relocating sub-graphs of the taxonomies. We continue this up to mutations and calculate F1 (against the gold standard taxonomy), NLIV, CSC , RaTE and SP scores every mutations (5 times). We sample between 50 - 100 (depending on dataset size) different degradations for each dataset, resulting in 250 - 500 degraded versions. We then calculate the correlation between F1 and our proposed metrics (CSC, NLIV-S and NLIV-W) and previous metrics (RaTE and SP). As an NLI-model, we use bart-large-mnli555https://huggingface.co/facebook/bart-large-mnli and for semantic similarity all-MiniLM-L6-v2666https://huggingface.co/sentence-transformers/all-MiniLM-L6-v2.
5.1 Results
Tab. 1 shows a comparison of SP, CSC and NILV on the toy example (Fig. 2). We can see that SP is only sensitive to Mutation 1, while CSC and NILV are sensitive to both mutations.
| Mutation |
|
|
|
|
||||||||
| Original | 0.7924 | 0.5057 | 0.2252 | 0.9492 | ||||||||
| Misclassified Non-Leaves | 0.7924 | 0.4221 | 0.1956 | 0.8351 | ||||||||
| Misclassified Leaves | 0.5069 | 0.4485 | 0.2176 | 0.9486 |
Fig. 3 shows the Kendall rank correlations between F1 score against the original taxonomy and CSC/NLIV/SP/RaTE scores. For RaTE, correlations will be undefined (NA) or close to zero when the metric predicts the same score for all or most mutated taxonomies. This can happen when none of the true parents are listed in the top- candidates of RaTE and is one of the reasons Langlais and Gao (2023) perform domain specific fine-tuning of masked language models.
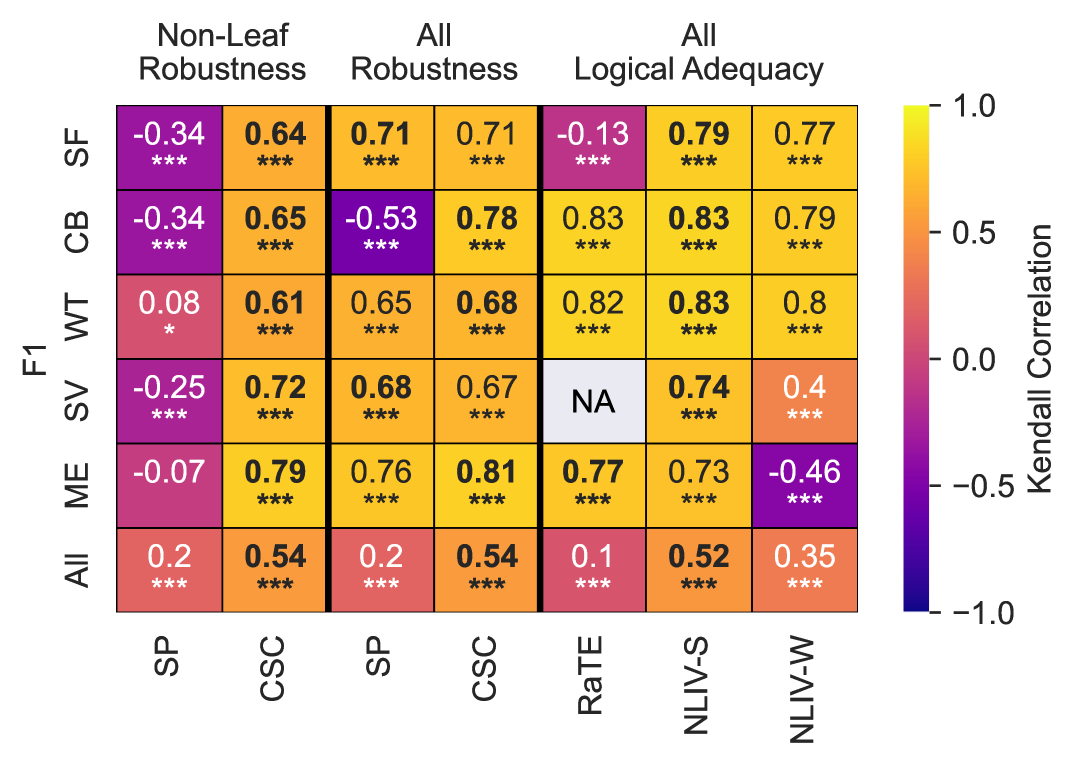
CSC and the strong version of NLIV are highly correlated with F1 on all datasets. SP shows strong correlation with the exception of CookBook. This is due to Cookbook’s higher branching factor, since intruders are more likely with larger leaf-groups. When mutating only non-leaf concepts, SP fails to correlate with the ground truth comparison.
6 Conclusion
We propose novel reference-free metrics for assessing taxonomy quality that offer greater resilience across different domains and mutations than existing ones without requiring fine-tuning. Since robustness and logical adequacy measure different properties of taxonomies, further research is needed to explore how these metrics could be combined and leveraged to optimize taxonomy generation and completion.
7 Limitations
-
•
Our approximation using NLI relies on a single prompt template, though more effective templates may exist. Exploring alternative templates could improve performance.
-
•
While our proposed metrics are designed to be domain-independent, the pre-trained models we use are not. As a result, the computed scores may reflect biases inherent in the models used for semantic similarity and NLI.
-
•
Our assessment of logical adequacy relies heavily on NLI. Before applying our method, we recommend evaluating the model’s performance in the taxonomy domain through experiments similar to those in App. H.
References
- Bordea et al. (2016) Georgeta Bordea, Els Lefever, and Paul Buitelaar. 2016. SemEval-2016 task 13: Taxonomy extraction evaluation (TExEval-2). In Proceedings of the 10th International Workshop on Semantic Evaluation (SemEval-2016), pages 1081–1091, San Diego, California. Association for Computational Linguistics.
- Fellbaum (2019) Christiane Fellbaum, editor. 2019. Wordnet. Language, Speech and Communication. Bradford Books, Cambridge, MA.
- Jelinek et al. (2005) F Jelinek, R L Mercer, L R Bahl, and J K Baker. 2005. Perplexity—a measure of the difficulty of speech recognition tasks. The Journal of the Acoustical Society of America, 62(S1):S63–S63.
- Jurgens and Pilehvar (2016) David Jurgens and Mohammad Taher Pilehvar. 2016. SemEval-2016 task 14: Semantic taxonomy enrichment. In Proceedings of the 10th International Workshop on Semantic Evaluation (SemEval-2016), pages 1092–1102, San Diego, California. Association for Computational Linguistics.
- Langlais and Gao (2023) Phillippe Langlais and Tianjian Lucas Gao. 2023. RaTE: a reproducible automatic taxonomy evaluation by filling the gap. In Proceedings of the 15th International Conference on Computational Semantics, pages 173–182, Nancy, France. Association for Computational Linguistics.
- Lipscomb (2000) C E Lipscomb. 2000. Medical subject headings (MeSH). Bull. Med. Libr. Assoc., 88(3):265–266.
- Liu et al. (2021) Zichen Liu, Hongyuan Xu, Yanlong Wen, Ning Jiang, Haiying Wu, and Xiaojie Yuan. 2021. TEMP: Taxonomy expansion with dynamic margin loss through taxonomy-paths. In Proceedings of the 2021 Conference on Empirical Methods in Natural Language Processing, pages 3854–3863, Online and Punta Cana, Dominican Republic. Association for Computational Linguistics.
- Manzoor et al. (2020) Emaad Manzoor, Rui Li, Dhananjay Shrouty, and Jure Leskovec. 2020. Expanding taxonomies with implicit edge semantics. In Proceedings of The Web Conference 2020, WWW ’20, pages 2044–2054, New York, NY, USA. Association for Computing Machinery.
- Shen et al. (2020) Jiaming Shen, Zhihong Shen, Chenyan Xiong, Chi Wang, Kuansan Wang, and Jiawei Han. 2020. TaxoExpan: Self-supervised taxonomy expansion with position-enhanced graph neural network. In Proceedings of The Web Conference 2020, WWW ’20, pages 486–497, New York, NY, USA. Association for Computing Machinery.
- Unterkalmsteiner and Adbeen (2023) Michael Unterkalmsteiner and Waleed Adbeen. 2023. A compendium and evaluation of taxonomy quality attributes. Expert Syst., 40(1):e13098.
- Wang et al. (2022) Suyuchen Wang, Ruihui Zhao, Yefeng Zheng, and Bang Liu. 2022. QEN: Applicable taxonomy completion via evaluating full taxonomic relations. In Proceedings of the ACM Web Conference 2022, WWW ’22, pages 1008–1017, New York, NY, USA. Association for Computing Machinery.
- Wu and Palmer (1994) Zhibiao Wu and Martha Palmer. 1994. Verbs semantics and lexical selection. In Proceedings of the 32nd annual meeting on Association for Computational Linguistics, ACL ’94, pages 133–138, USA. Association for Computational Linguistics.
- Xu et al. (2023) Hongyuan Xu, Ciyi Liu, Yuhang Niu, Yunong Chen, Xiangrui Cai, Yanlong Wen, and Xiaojie Yuan. 2023. TacoPrompt: A collaborative multi-task prompt learning method for self-supervised taxonomy completion. In Proceedings of the 2023 Conference on Empirical Methods in Natural Language Processing, pages 15804–15817, Stroudsburg, PA, USA. Association for Computational Linguistics.
- Zeng et al. (2021) Qingkai Zeng, Jinfeng Lin, Wenhao Yu, Jane Cleland-Huang, and Meng Jiang. 2021. Enhancing taxonomy completion with concept generation via fusing relational representations. In Proceedings of the 27th ACM SIGKDD Conference on Knowledge Discovery & Data Mining, KDD ’21, pages 2104–2113, New York, NY, USA. Association for Computing Machinery.
- Zhang et al. (2021) Jieyu Zhang, Xiangchen Song, Ying Zeng, Jiaze Chen, Jiaming Shen, Yuning Mao, and Lei Li. 2021. Taxonomy completion via triplet matching network. AAAI, 35(5):4662–4670.
Appendix A Gold Standard Comparisons
The metrics for evaluating mutated taxonomies against gold standards are described below. Note that for a position to be considered correct, both parent and child of the query concept need to be correct. A correctly predicted parent with an incorrectly predicted child will result in a false positive and vice versa.
Recall (R)
How many of the true positions were correctly predicted by the model.
| (9) |
Precision (P)
How many of the predicted positions were correct.
| (10) |
F1-score (F1)
The harmonic mean of the precision and recall for the positions.
| (11) |
Appendix B Quality Citeria
The consolidated quality criteria of taxonomies according to Unterkalmsteiner and Adbeen (2023) are detailed below.
-
•
Comprehensiveness: Comprehensiveness describes the capacity to categorize all objects within the domain for which the taxonomy was designed.
-
•
Robustness: Robustness indicates how well a taxonomy can tell things apart. It depends on how clearly the concepts in the taxonomy represent different ideas (orthogonality). Also, if sibling concepts are closely related (cohesiveness), it’s easier to classify something.
-
•
Conciseness: Conciseness in taxonomy refers to its capacity to classify objects using a minimal amount of concepts. It’s considered an external quality, observed in the taxonomy’s practical application.
-
•
Extensibility Extensibility refers to a taxonomy’s capability to accommodate structural modifications, including the addition, alteration, or removal of roots or concepts.
-
•
Explanatory A taxonomy is explanatory if it allows users to classify objects by their characteristics or infer characteristics from their placement.
-
•
Mutual exclusiveness: Mutual exclusiveness in a taxonomy refers to its capability to uniquely identify an object, ensuring that no object falls under different concepts within the same dimension. This attribute is considered an external quality, observed during the application of the taxonomy.
-
•
Reliability Reliability refers to a taxonomy’s ability to ensure consistent classification among different coders.
Appendix C Semantic Proximity
Eq. 12 shows the SP where is the set of sibling concepts, is the set of all concepts, and represent concepts, and denotes the similarity measure between two concepts. The indicator function evaluates to 1 if the minimum similarity within is greater than the minimum similarity between and external concepts, indicating the presence of intruders. The SP is then the average of for all groups of leaves in the taxonomy.
| (12) |
Appendix D Logical Adequacy
The probability of a classification being adequate follows a binomial distribution, since the adequacy of a relation is an independent Bernoulli trial. As such, the probability of an adequate classification decreases with its length, which is the reason for our normalization of probabilities (Eq. 13).
| (13) |
Eq. 14 shows how we arrive at the mean normalized classification probability with the union over relation adequacy probabilities and uniformly distributed .
| (14) |
Appendix E Perplexity
Perplexity is the reciprocal of the geometric mean of the sequence probabilities (Eq. 15), with being a probabilistic model to evaluate.
| (15) |
Appendix F Experiment Details
F.1 Taxonomy Properties
Tab. 2 shows statistics of the taxonomy datasets used in the empirical evaluation.
| Dataset | ||||||
| SemEval-Food | 1486 | 1576 | 9 | 1184 | 0.80 | 5.08 |
| SemEval-Verb | 13936 | 13407 | 13 | 10360 | 0.74 | 4.12 |
| MeSH | 9710 | 10496 | 11 | 5502 | 0.57 | 3.88 |
| Wikitax | 941 | 973 | 7 | 754 | 0.80 | 5.20 |
| CookBook | 1985 | 1984 | 4 | 1795 | 0.90 | 10.44 |
F.2 Degrading Taxonomies Randomly
We sample two unrelated concepts (neither are descendants or ancestors of each other) in the taxonomy and change the parent of the first concept to the second concept. In some taxonomies, concepts can have multiple parents. In such cases, we remove all current parents before adding the concept at the new parent. Tab. 3 shows the number of sampled degraded taxonomies per taxonomy.
| Strategy | Dataset | Number of Samples | Number of Degradations |
| All | CB | 500 | 100 |
| ME | 250 | 50 | |
| SF | 500 | 100 | |
| SV | 250 | 50 | |
| WT | 500 | 100 | |
| Non-Leaf | CB | 500 | 100 |
| ME | 250 | 50 | |
| SF | 500 | 100 | |
| SV | 250 | 50 | |
| WT | 500 | 100 |
F.3 WikiData Taxonomy
We extract the WikiTax taxonomy using the relations subclass of, instances of and subproperty of (Wikidata identifiers P279, P31 and P1647)777https://github.com/nichtich/wikidata-taxonomy.
F.4 Correlation Coefficients
We use rank correlation, since we do not expect a linear relationship between scores, but expect the degraded taxonomies’ F1 score to be ranked similarly to our proposed metrics.
Appendix G Extended Results
G.1 Toy Example
To get an intuition about what is regarded as bad by the proposed metrics, Fig. 4 shows the idealized and worst taxonomies found by 1000 samples on the taxonomy space for the toy example concepts.
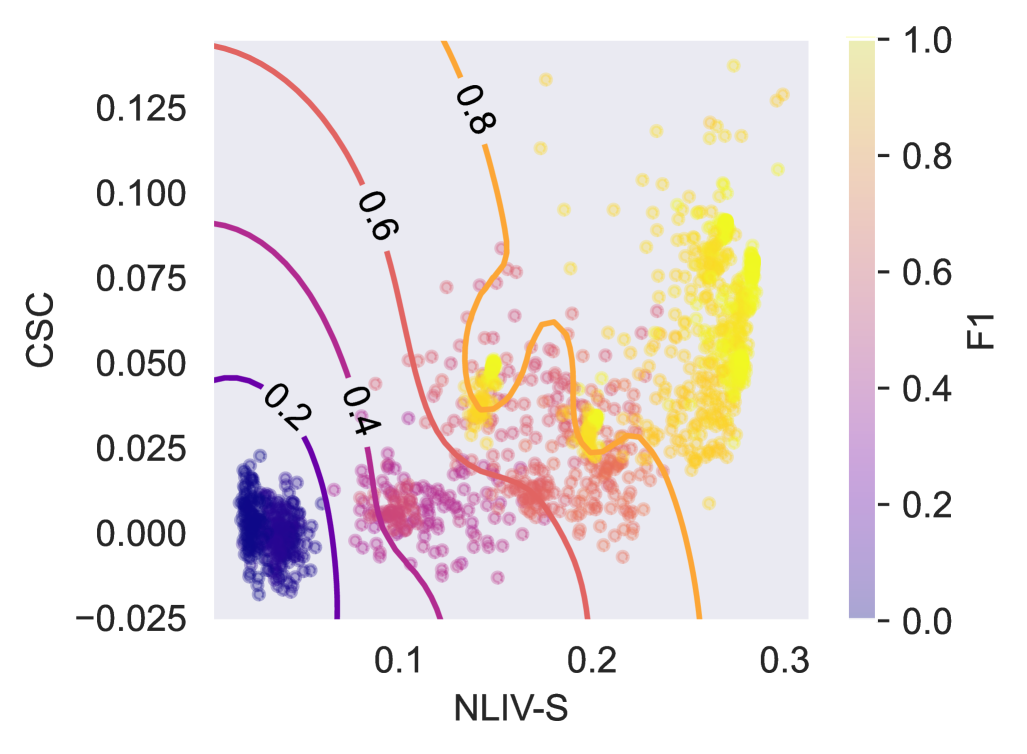
G.2 Metric Surface
For intuition, Fig. 5 shows the interpolated surface of the metrics surface in a contour plot and Fig. 6 shows the averaged and normalized scores against the number of random mutations on the taxonomies. Averages are across datasets and independent degradations.

G.3 Correlations on Non-Leaf Degradations
One might expect the correlations to be undefined for SP in the non-leaf experiment. However, since we can create leaves by removing non-leaves from their parents, there will be slight differences in SP scores.
Appendix H Approximation Performance of NLI
Figure 7 shows the performance of our approximation of the adequacy of parent-child relations on all datasets for the strong and the weak strategy. For negatives, we randomly sample the same amount of pairs as we have for true parent child relations.