EP241021a: a months-duration X-ray transient with luminous optical and radio emission
Abstract
We present the discovery of a peculiar X-ray transient, EP241021a, by the Einstein Probe (EP) mission, and the results from multiwavelength follow-up observations. The transient was first detected with the Wide-field X-ray Telescope as an intense flare lasting for 100 s, reaching a luminosity of . Further observations with EP’s Follow-up X-ray Telescope reveal a huge drop in the X-ray flux by a factor of 1000 within 1.5 days. After maintaining a nearly plateau phase for 7 days, the X-ray flux declines as over a period of 30 days, followed by a sudden decrease to an undetectable level by EP and XMM-Newton, making it being the longest afterglow emission detected among known fast X-ray transients. A bright counterpart at optical and radio wavelengths was also detected, with high peak luminosities in excess of and respectively. In addition, EP241021a exhibits a non-thermal X-ray spectrum, red optical color, X-ray and optical rebrightenings in the light curves, and fast radio spectral evolution, suggesting that relativistic jets may have been launched. We discuss possible origins of EP241021a, including a choked jet with supernova shock breakout, a merger-triggered magnetar, a highly structured jet, and a repeating partial tidal disruption event involving an intermediate-mass black hole, but none can perfectly explain the multiwavelength properties. EP241021a may represent a new type of X-ray transients with month-duration evolution timescales, and future EP detections and follow-up observations of similar systems will provide statistical samples to understand the underlying mechanisms at work.
1 Introduction
In the past decade, a few tens of fast evolving X-ray transients (FEXTs) have been discovered with Chandra and XMM-Newton, either from serendipitious observations or through target searches of archival data (e.g., Jonker et al., 2013; Glennie et al., 2015; Bauer et al., 2017; Alp & Larsson, 2020; Quirola-Vásquez et al., 2022, 2023; Lin et al., 2022; Eappachen et al., 2023). These FEXTs are characterized by intense bursts of soft X-ray emission lasting tens to thousands of seconds with a wide range of luminosities, the nature of which remains enigmatic. Several possibilities have been invoked as the origins of FEXTs, including stellar flares (Glennie et al., 2015), supernova shock breakout (Alp & Larsson, 2020), long gamma-ray bursts (GRBs, Bauer et al., 2017), magnetars after binary neutron star mergers (Lin et al., 2022; Quirola-Vásquez et al., 2024), stellar tidal disruption events involving an intermediate-mass black hole (Jonker et al., 2013; Shen, 2019; Peng et al., 2019), or an entirely new class of transient phenomena. Due to the lack of prompt multi-wavelength follow-up observations in previous studies, it is challenging to explore and distinguish these different mechanisms in details.
Following the successful launch on 2024 Jan 9, the Einstein Probe (EP, also known as the Tianguan telescope), has started monitoring the sky in the soft X-ray regime (Yuan et al., 2025)111https://ep.bao.ac.cn/ep/, opening a new avenue to characterize and study FEXTs. Operating in the 0.4–5 keV band, the wide-field X-ray telescope (WXT) onboard EP has a large instantaneous field-of-view (3600 deg2), and is capable of surveying the available night sky several times per day. EP also carries a follow-up X-ray telescope (FXT) in 0.3-10 keV, which has a larger effective area to perform follow-up observations and provide more precise localization of new transients triggered by WXT. The prompt follow-up FXT observations are capable of determining the temporal evolution properties of the afterglow X-ray emission (down to a typical sensitivity of ), i.e., the duration, the shape of light curve, and spectral evolution, which are crucial to understanding the origin of FEXTs.
In its first year of scientific operations, EP/WXT has detected dozens of FEXTs in real time, most of which have received rapid follow-ups at optical and radio bands. Analyzing the multi-wavelength properties has revealed diversity in transient types and progenitor systems. While a number of the FEXTs detected by EP have turned out to be GRBs, such as EP240219a (Yin et al., 2024), EP240315a (Levan et al., 2024; Liu et al., 2025b; Ricci et al., 2025), and EP240801a (Jiang et al., 2025), there is a variety that has been linked to Galactic stellar flares (e.g., Liu et al., 2025a). A few of EP FEXTs have also been observed to show clear associations with Type Ic-BL supernova, but without high energy -ray counterpart, including EP240414a (Sun et al., 2024; van Dalen et al., 2025; Srivastav et al., 2025), EP250108a (Li et al., 2025; Srinivasaragavan et al., 2025; Eyles-Ferris et al., 2025; Rastinejad et al., 2025) and EP250304a (Izzo et al., 2025), which could be explained by a jet-forming supernova trapped in a dense envelope. They have also been suggested to resemble luminous fast blue optical transients due to the detection of delayed optical bump with fast rise time although is not as blue (van Dalen et al., 2025).
In addition, EP has discovered a new type of X-ray transients with an intermediate evolution timescale. The most intriguing FEXT is EP240408a, which was characterized by a post-flare plateau lasting for 4 d in the X-ray light curve, followed by a steep decay to an undetectable level about 10 d after the initial detection (Zhang et al., 2025). No optical, near-infrared and radio counterparts were detected, making EP240408a’s temporal properties inconsistent with any of the transient types known so far. Unfortunately, spectroscopic observations are not sensitive enough to confirm its redshift, preventing further investigations on the nature of EP240408a, although an exotic GRB or an abnormal jetted tidal disruption event (TDE) was suggested (O’Connor et al., 2025).
| Obs ID | Exposure Time (s) | Obs Start Time (UTC) | Phase (days) | Flux (0.3-10 keV) | Photon Index | |
| () | () | |||||
| WXT 222The spectrum during the 91.9s flare is extracted and fitted in 0.5-4 keV, while the flux in 0.3-10 keV is reported based on the best-fit spectral model. | ||||||
| 11900012322 | 1013 | 2024-10-21 04:51:25 | 5 | |||
| FXT | ||||||
| 06800000167 | 3024 | 2024-10-22 17:43:00 | 1.54 | 5 | ||
| 06800000168 | 6044 | 2024-10-23 17:46:00 | 2.54 | 5 | – | |
| 06800000170 | 6037 | 2024-10-24 19:25:00 | 3.61 | 5 | – | |
| 06800000173 | 8559 | 2024-10-25 17:51:00 | 4.54 | 5 | – | |
| 06800000181 | 6122 | 2024-10-27 14:47:00 | 6.41 | 5 | – | |
| 06800000186 | 5575 | 2024-10-29 08:28:00 | 8.15 | 5 | – | |
| 06800000198 | 2093 | 2024-11-02 15:04:00 | 12.43 | 5 | – | |
| 06800000202 | 6175 | 2024-11-04 07:08:00 | 14.10 | 5 | – | |
| 06800000211 | 4791 | 2024-11-07 12:04:00 | 17.30 | 5 | – | |
| 06800000250 | 5966 | 2024-11-20 15:41:00 | 30.45 | 5 | – | |
| 06800000269333 EP241021a was only detected by FXT-B. | 8943 | 2024-11-30 19:13:00 | 40.60 | 5 | – | |
| 06800000356444 EP241021a was not detected, and the corresponding 3 upper limits on flux are given. | 8706 | 2025-01-08 10:36:19 | 79.24 | – | – | |
| XMM-Newton/MOS2 | ||||||
| 0954190901c | 39918 | 2025-01-18 13:03:43 | 89.34 | – | – | |
In this Letter, we report the discovery of a peculiar EP X-ray transient, EP241021a, which exhibits a long-lasting X-ray emission for more than one month, making it a FEXT with longest evolution timescale ever observed. Shortly after the trigger, it was detected by follow-up observations in optical and radio bands. Optical spectroscopy observations confirm that the redshift of EP241021a is at , based on the detection of narrow emission and absorption lines from the faint host galaxy. The multi-wavelength observations and data reduction are described in Section 2. In Section 3, we present the detailed analysis of X-ray spectral and variability properties, and the modeling of the radio flux and SED evolution. Discussion on the possible interpretations for EP241021a is given in Section 4. We summarize the results in Section 5. We adopt a cosmology of = 0.3, = 0.7, and = 70 km s-1 Mpc-1 when computing luminosity distance.
2 OBSERVATION AND DATA
2.1 X-ray trigger and observations
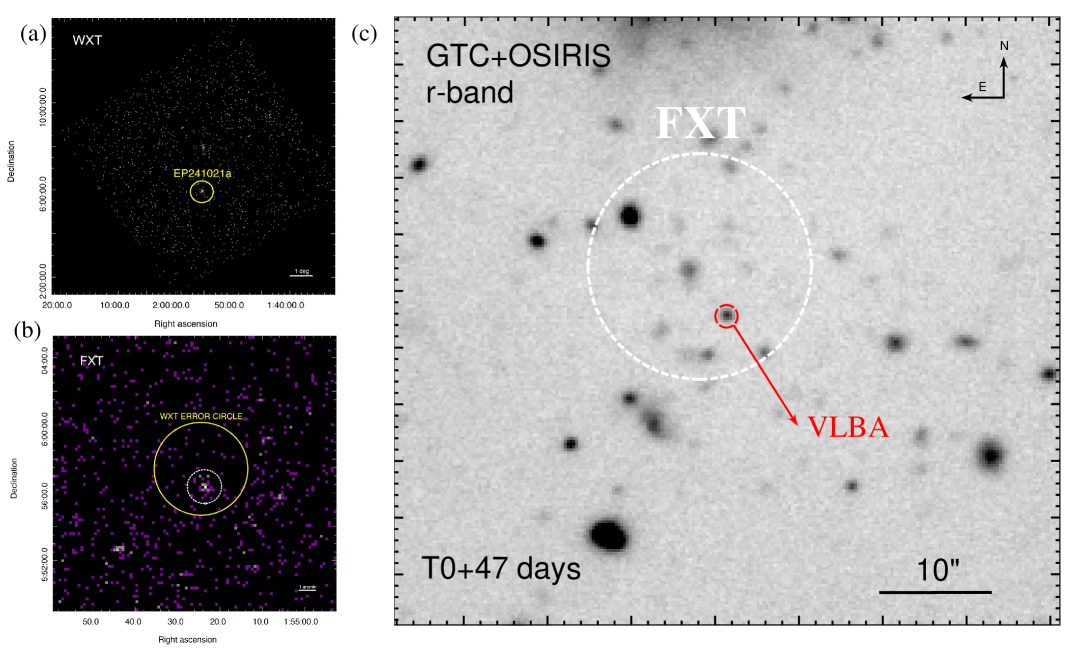
2.1.1 EP/WXT
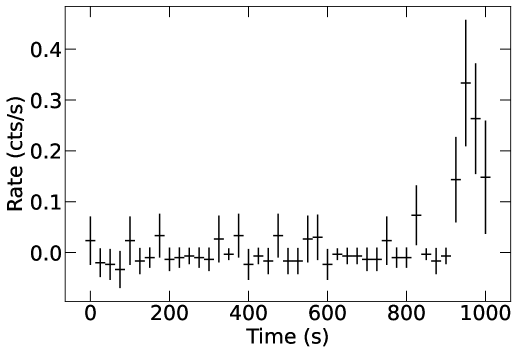
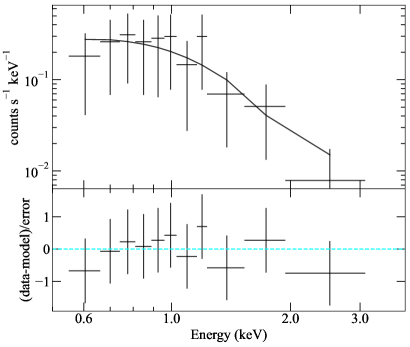
The source EP241021a was initially detected by CMOS detector 10 of the EP/WXT during the observation conducted on October 21, 2024, between 04:51:21 and 05:10:39 UTC (Hu et al., 2024). The data reduction was performed using the wxtpipeline software tool (version 0.1.0). The WXT image in which EP241021a is detected (R.A. = 01:55:24.48, Dec. = +05:57:25.20, with an uncertainty of 2.4′) is shown in Figure 1(a). The light curve shows a significant flux increase from EP241021a that started at 05:07:56 UTC and lasted for approximately 100 seconds (Figure 2), with a time-averaged X-ray flux of in the 0.5–4.0 keV, corresponding to an isotropic equivalent luminosity as high as at . The transient has a relatively hard X-ray spectrum, which can be fitted by a power-law with photon index of . We will refer to the time of EP/WXT trigger as for the phases of multiwavelength follow-up observations.
2.1.2 EP/FXT
Following the initial detection of EP241021a by WXT, an observation was performed with the FXT on board EP approximately 36.96 hours later. This follow-up observation has a total exposure time of 3024 seconds, during which the previously uncatalogued source was detected within the WXT’s error circle, at the coordinates R.A. = 01:55:23.59, Dec. = +05:56:22.20 with an uncertainty of 10′′ (Wang et al., 2024). Subsequent monitoring of EP241021a continued until January 8, 2025, consisting of a total of 12 observations (Table 1). The FXT was configured in Full Frame mode in all the observations. The data were reducted using the fxtchain tool in the FXT Data Analysis Software (FXTDAS). The detailed analysis of the X-ray spectra and light curve will be presented in Section 3.1 and 3.2, respectively.
2.1.3 XMM-Newton
To fully constrain the late time decay of EP241021a , we also obtained a ToO observation with XMM-Newton (Obsid 0954190901; PI Eyles-Ferris). This was performed on January 18, 2025, 90 days after the first detection of EP241021a . We obtained the resulting Pipeline Processing System (PPS) files from the XMM-Newton Science Archive555https://www.cosmos.esa.int/web/xmm-newton/xsa (XSA). After filtering for background flares, exposure times were 38.2, 39.9 and 30.7 ks with the EPIC MOS1, MOS2 and pn detectors respectively.
No source was detected at the position of EP241021a in any of the EPIC instruments. To derive the upper limits on flux, we used the method of Kraft et al. (1991) using a circular aperture of radius 10″ centred on the source position. We estimated the background using a 60″ radius aperture placed on the same chip as the source position and applied the PPS exposure maps to correct for vignetting. We repeated this for all three detectors, finding that MOS2 gives the deepest limit. We then converted the 0.2 - 12 keV count rate to 0.3 - 10 keV flux using Pimms v4.15 and a photon index of 1.83. The resulting unabsorbed flux upper limit is (at 3 confidence level).
2.2 Non-detections from Gamma-Ray observations
There was no Fermi-GBM onboard trigger around EP241021a. An automated, blind search for short gamma-ray bursts below the onboard triggering threshold in Fermi-GBM also identified no counterpart candidates. The GBM targeted search for GRB-like signals, was run from 30 s before the EP trigger time until 300 s after, but no signal was identified either (Burns et al., 2024, GCN 37855). Konus-Wind (KW) was observing the position of EP241021a (Svinkin et al., GCN 38034) for 1000s before and after the trigger time, and did not detect the source, with an upper limit (90% confidence level) on the 20 - 1500 keV peak flux to for a typical long GRB spectrum. Therefore, EP241021a was not detected by any high-energy gamma-ray observations.
2.3 Optical photometry
The optical counterpart of EP241021a was first reported by Nordic Optical Telescope (NOT) equipped with Alhambra Faint Object Spectrograph and Camera (ALFOSC) at the coordinates R.A. = 01:55:23.41, Dec. = +05:56:18.01 with an uncertainty of 0.5′′ (Fu et al., 2024a). This result was confirmed by earlier observations of the Thai Robotic Telescope network located at Fresno, California, US (TRT-SRO) (Fu et al., 2024b), the 0.76-m Katzman Automatic Imaging Telescope (KAIT) located at Lick Observatory (Zheng et al., 2024b) and the Liverpool telescope (LT) located at the Observatorio del Roque de los Muchachos, La Palma, Spain (Li et al., 2024; Kumar et al., 2024). After the first detection of the optical counterpart, several optical photometry follow-up campaigns were carried out, such as NOT, Thai Robotic Telescope network located at New South Wales, Australia (TRT-SBO), 50cm-A and 100cm-C telescope of the JinShan project, located at Altay, Xinjiang, China (ALT-50A&-100C), the HMT-0.5m telescope located at Nanshan, Xinjiang, China (HMT), 1.5m telescope at Observatorio de Sierra Nevada, Spain (OSN), LT, and Gran Telescopio Canarias (GTC) located at Roque de los Muchachos Observatory, La Palma, Spain. The log of photometry observations and results are listed in Table LABEL:tab:obs_optical in Appendix.
2.4 Optical spectroscopy
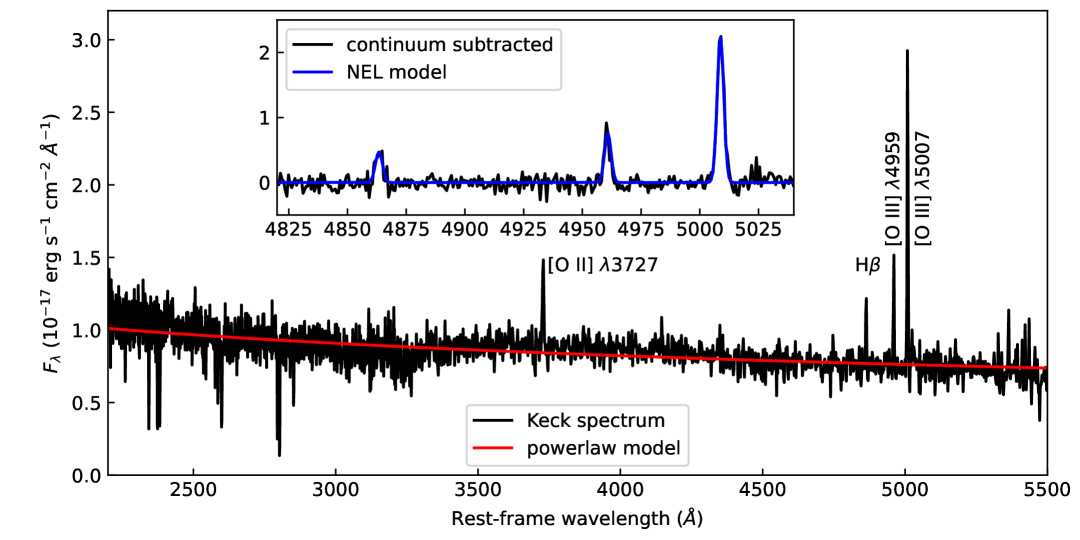
EP241021a was observed with the Low Resolution Imaging Spectrometer (LRIS; Oke et al., 1995) on the Keck I 10 m telescope at the W. M. Keck Observatory, on October 30, 2024 (Zheng et al., 2024a). The spectrum was acquired with the slit oriented at or near the parallactic angle to minimize slit losses due to atmospheric dispersion (Filippenko, 1982). The data was processed using the LPipe (Perley, 2019) data reduction pipeline. The spectrum was flux calibrated using observations of appropriate spectrophotometric standard stars observed on the same night, at similar airmasses, and with an identical instrument configuration.
As shown in Figure 3, the continuum of the Keck spectrum can be well fitted with a powerlaw with . We clearly detect narrow emission lines of [O II] 3727, H, and [O III] 4959,5007 at a common redshift of = 0.7478, which likely originate from the host galaxy. We also detect an absorption line system containing Mg II 2796,2803 doublet and Fe II lines at similar redshift, making the redshift more reliable. The [O III] 5007 and [O II] 3727 have luminosities of and erg s-1, respectively. The line ratio [O III]/H of indicates that the emission lines could be produced either by star formation or by active galactic nuclei. The FWHM of [O III] is km s-1, consistent with that of the line spread function of km s-1 (measured using sky emission lines), indicating that the emission lines are narrow and not resolved. If the emission lines mainly comes from star formation, the [O II] luminosity corresponds to a star formation rate of 2.4 yr-1 according to the relation of Kennicutt (1998).
| Observatory | Project | Date | Phase | ||
|---|---|---|---|---|---|
| (GHz) | (days) | (mJy) | |||
| ATCA | CX585 | 5.0 | 2024 Oct 29 | 8 | 0.350 0.029 |
| 5.5 | 2024 Oct 29 | 8 | 0.382 0.024 | ||
| 6.0 | 2024 Oct 29 | 8 | 0.407 0.029 | ||
| 8.5 | 2024 Oct 29 | 8 | 0.434 0.028 | ||
| 9.0 | 2024 Oct 29 | 8 | 0.453 0.026 | ||
| 9.5 | 2024 Oct 29 | 8 | 0.467 0.028 | ||
| VLBA | BS346 | 6.2 | 2024 Nov 28 | 37 | 0.774 0.072 |
| 8.4 | 2024 Nov 30 | 39 | 0.762 0.081 | ||
| VLA | 24B-487 | 5.0 | 2025 Jan 28 | 98 | 0.544 0.038 |
| 7.0 | 2025 Jan 28 | 98 | 0.374 0.038 | ||
| 15.0 | 2025 Jan 28 | 98 | 0.110 0.020 | ||
| 10.0 | 2025 Feb 14 | 115 | 0.225 0.074 | ||
| 6.0 | 2025 Feb 21 | 122 | 0.319 0.025 | ||
| MeerKAT | DDT-20250123-XS-01 | 2.2 | 2025 Jan 29 | 99 | 0.522 0.027 |
| 3.1 | 2025 Jan 29 | 99 | 0.478 0.025 | ||
| 1.3 | 2025 Feb 15 | 116 | 0.375 0.020 | ||
| 2.2 | 2025 Feb 16 | 117 | 0.367 0.020 | ||
| 3.1 | 2025 Feb 16 | 117 | 0.413 0.022 |
2.5 Radio observations
2.5.1 VLA
While EP241021a was not detected by e-MERLIN on 2024 Oct 24 (Gianfagna et al., 2024), three days since discovery, a radio brightening was identified in both ATCA and AMI-LA observations in 2024 Oct 29-30 (Ricci et al., 2024; Carotenuto et al., 2024), with a radio luminosity at 5 GHz of . To further study the radio properties, we triggered two-epoch VLA observations through the DDT program (project code: VLA/24B-487) at central frequencies of 6 GHz (C-Band), 10 GHz (X-Band) and 15GHz (Ku-Band). The VLA observations were carried out 98 and 115 days after discovery. The data were reduced using the Common Astronomy Software Applications (CASA, McMullin et al., 2007, version 6.6.1) and the standard VLA calibration pipeline (version 2024.1.1). Where the signal-to-noise ratio allowed, we enhanced frequency resolution by splitting the Measurement Set (MS) from groups of the spectral windows. We reran the pipeline after manually inspecting and additional flagging. The calibrated data were imaged using the CLEAN algorithm with Briggs weighting and ROBUST parameter of 0, which helps to reduce side-lobes and achieve a good sensitivity. EP241021a was clearly detected in all observations. We used the IMFIT task in CASA to fit the radio emission component with a two-dimensional elliptical Gaussian model to determine the position, integrated and peak flux density. The radio emission at all bands is unresolved and no extended emission is detected. For consistency, only peak flux densities are used in our following analysis. The VLA observation log and flux density measurements are presented in Table 2.
We also searched for radio emission at 3 GHz using the archival data from the Very Large Array Sky Survey (Lacy et al., 2020), but found EP241021a remains undetected over its three-epoch observations between 2017 Oct and 2023 Mar, with a 5 upper limit on the peak flux of 0.8 mJy beam-1.
2.5.2 MeerKAT
We conducted multi-frequency radio observations with the MeerKAT telescope over two epochs (project code: DDT-20250123-XS-01). The first epoch observations were performed in the S0 and S4-band, centered at 2.2 GHz and 3.1 GHz, respectively, while the L-band observations (with central frequency of 1.3 GHz) have been included in the second epoch. The MeerKAT observations were observed quasi-simultaneously as VLA, to measure the broad-band SED and its evolution properties. We used the ‘4K’ wideband coarse mode to ensure a high sensitivity. For the first epoch, the total time is about 1.9 hrs for each band, of which 1.5 hrs were spent on source, and 0.4 hr on the flux and phase calibrators (J0408-6545 and J0149+0555), resulting in a rms of 10 Jy. Shorter on-source exposure (0.7 hr) in each band was used for the second epoch observations, yielding a larger rms of 20 Jy. We reduced the MeerKAT data using the OxKAT software (Heywood, 2020), and the final images were cleaned with the WSClean algorithm (Offringa & Smirnov, 2017). We then measured the integrated and peak flux in CASA, following the same procedures described above. The source is clearly detected in all three bands. The ratio of the integrated flux to the peak flux is in the range of 0.92 to 1.06, with a median value of 0.99, suggesting that most, if not all, of the radio emission is unresolved, consistent with observations from other telescopes, although the spatial resolution is very different. The flux densities obtained from MeerKAT observations are listed in Table 2.
2.5.3 VLBA
We carried out Very Long Baseline Array (VLBA) observations at the location of EP241021a on 2024 November 28 at 6.186 GHz and on 2024 November 30 at 8.368 GHz with its 10 antennas (project code: BS346). The observing frequency was centered at 6.186 GHz in the C band and 8.368 GHz in the X band, respectively. The observation was performed in the phase-referencing mode to a nearby strong compact radio source J0149+0555. Phase-reference cycle times were 4.5 minutes, with 3.5 minutes on-target and 1.0 minutes for the phase calibrator. We also inserted several scans of the bright radio source 3C 84 for fringe and bandpass calibration with an integration time of 3.0 minutes for each scan. The resulting total on-source time on both band is 5 hours. To achieve sufficiently high imaging sensitivity, we adopted the observational mode RDBE/DDC to use the largest recording rate of 2 Gbps, corresponding to a recording bandwidth of 256 MHz in each of the dual circular polarizations. We used the NRAO AIPS software to calibrate the amplitudes and phases of the visibility data, following the standard procedure from the AIPS Cookbook666http://www.aips.nrao.edu/cook.html. The calibrated data were imported into the Caltech DIFMAP package (Shepherd, 1997) for imaging and model-fitting. During imaging, we noted that the gain solutions were bad for the MK, SC, and HN antennas at 6.2 GHz, and for the HN antenna at 8.4 GHz. Therefore, we flagged data from these antennas.
VLBA detects a compact source in the final cleaned image, which has a deconvolved size of 3.77 mas 1.12 mas. To further investigate whether the source is resolved or not, we used the task Modelfit in DIFMAP to fit the radio emission component, but found no additional emission components in the residual map. Therefore, EP241021a remains compact and unresolved at the resolution of VLBA observation, with an upper limit on its size of 8.22 pc. The VLBA observation log and flux density measurements are presented in Table 2.
2.5.4 ATCA
EP241021a was observed with the Australia Telescope Compact Array (ATCA) in 16 cm and 4 cm band. The observations were made in the 6A configuration on 2024 October 29 (Ricci et al., 2024, Program ID: CX585, GCN 37949) and were carried out with two 2GHz wide intermediate frequencies (IFs) of 4.5-6.5 GHz (centered at 5.5 GHz) and 8-10 GHz (centered at 9 GHz). PKS B1934-638 was used as a bandpass and flux density calibrator and 0146+056 was used as a complex gain calibrator. The data reduction was carried out with the software Miriad (Sault et al., 1995), following the standard procedure.
Firstly, we performed the automatic radio frequency interference flagging by using the task pgflag before calibration to reduce the influence of RFI. Secondly, standard calibration involved bandpass and flux density calibration on PKS B1934-638 using the Miriad tasks mfcal and gpcal, and this was applied to the gain calibrator 0146+056. Time-varying gains and polarization leakage calibration were done using the task gpcal on 0146+056, and these gains were transferred and applied to the target before imaging.
Imaging was performed using the tasks invert, cgdisp, mfclean, and restor to create six continuum images (three for each of the IFs). Images were made in Stokes I, with a Briggs visbility weighting robustness parameter of 0.5. Images were restored with a Gaussian synthesized beam of 27.21 1.36 arcsec with a position angle of -1.5 degree for the 5.5GHz image and 16.78 0.83 arcsec with a position angle of -1.5 degree for the 9GHz image. EP241021a was clearly detected in all bands, the radio emission unresolved and no extended emission is detected. The central region of 5.5GHz image has an rms noise level of 15.1 Jy/beam, while the 9GHz image has an rms noise level of 11.8 Jy/beam. The flux density of target were fitted by using the task imfit. The ATCA observation log and flux density measurements are presented in Table 2.
3 Analysis and Results
3.1 X-ray spectra
We grouped the spectra to have at least 1 counts in each bin so as to adopt the -statistic for the spectral fits. The following spectral analysis was performed with the software BXA (Buchner et al., 2014), which connects the nested sampling algorithm UltraNest777https://johannesbuchner.github.io/UltraNest/ (Buchner, 2021), and integrates the conventional spectral fitting software XSPEC (version 12.14.1). For the EP/WXT spectral fittings, a simple absorbed power-law model provides an acceptable fit (Figure 2), yielding the best-fit photon index of . Given the limited spectral signal-to-noise ratios (S/Ns) for the EP/FXT data, we performed a joint fit of all the EP/FXT spectra in the 0.3–10 keV using the data from epochs when EP241021a was detected, with the photon indices were tied and was frozen at the Galactic value of cm-2. A single uniform prior is defined for each parameter, and the best-fit values with 68.3% uncertainty margins are given by the posterior distributions. The resulting photon index is , consistent with that obtained by WXT, suggesting marginal spectral evolution during FXT observations. To secure the result, we used addspec 1.4.0 to stack the exposure-weighted X-ray spectra from the first 6 FXT observations which exhibit relatively small flux variations. The stacked spectrum can also be described by an absorbed power-law model with the photon index of , as shown in Figure 4 (left). We used this best-fit model to extrapolate the flux in the 0.3–10 keV for all the EP/FXT data as well as that observed by XMM-Newton. For the last FXT observation, EP241021a was faint and not detected. Based on the aperture photometry method (Kraft et al., 1991; Ruiz et al., 2022), we estimated the upper limit on flux at a 3 confidence level. All the X-ray flux measurements are shown in Table 1.
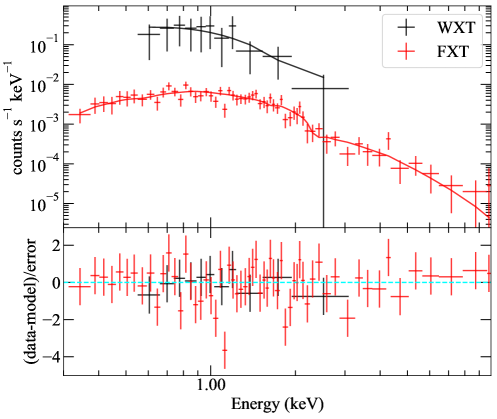
3.2 X-ray light curve
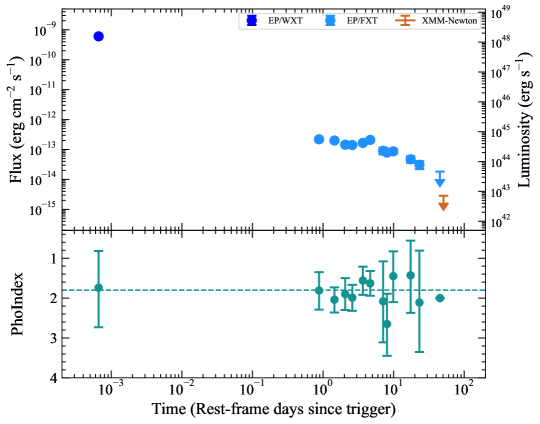
During the 91.9s flare period, EP/WXT collected a total of 26 photon counts from EP241021a, with no significant short-timescale features being discernible. EP241021a could not be distinctly separated from the background during non-flare intervals. Following the X-ray flare detected by EP/WXT, EP/FXT observed EP241021a between 1 and 79 days since trigger. As shown in Figure 4 (right), the X-ray light curve shows a nearly plateau phase for the first 7 days, followed by a steep decline up to 79 days, after which EP241021a becomes undetectable by EP/FXT, with a 3 upper limit on the flux of . EP241021a remains undetected by more sensitive XMM-Newton observation at days, with a 3 confidence upper limit on the flux of (Section 2.1.3).
To quantify the evolution of the X-ray emission, we first fitted a smoothed broken power-law to the light curve in the rest frame (Appendix B), excluding the EP/WXT data. Although the model can describe the EP/FXT data, it seems to overpredict the flux if compared to the upper limit obtained by XMM-Newton, indicating a steep break in the light curve. Therefore, we included a third power-law to take into account the steep flux break, and found that it provides a statistically better fitting result over the previous broken powerlaw model, according to the Bayes factor of . Therefore, we favor the three piecewise power-law function as the model to describe the light curve evolution. We used an MCMC fitting technique to determine the best-fitting parameters and uncertainties (Appendix B). Based on the results of MCMC analysis, we found a slope of for the plateau’s decline, which breaks to at a rest-frame time of days post-trigger, followed by a more steep drop at days, with . We note that the power-law slope for the final drop phase in the luminosity evolution was poorly constrained, due to the sparse temporal coverage in the light curve between the last EP/FXT detection and the late-time limit provided by XMM-Newton.
3.3 Radio flux and SED evolution
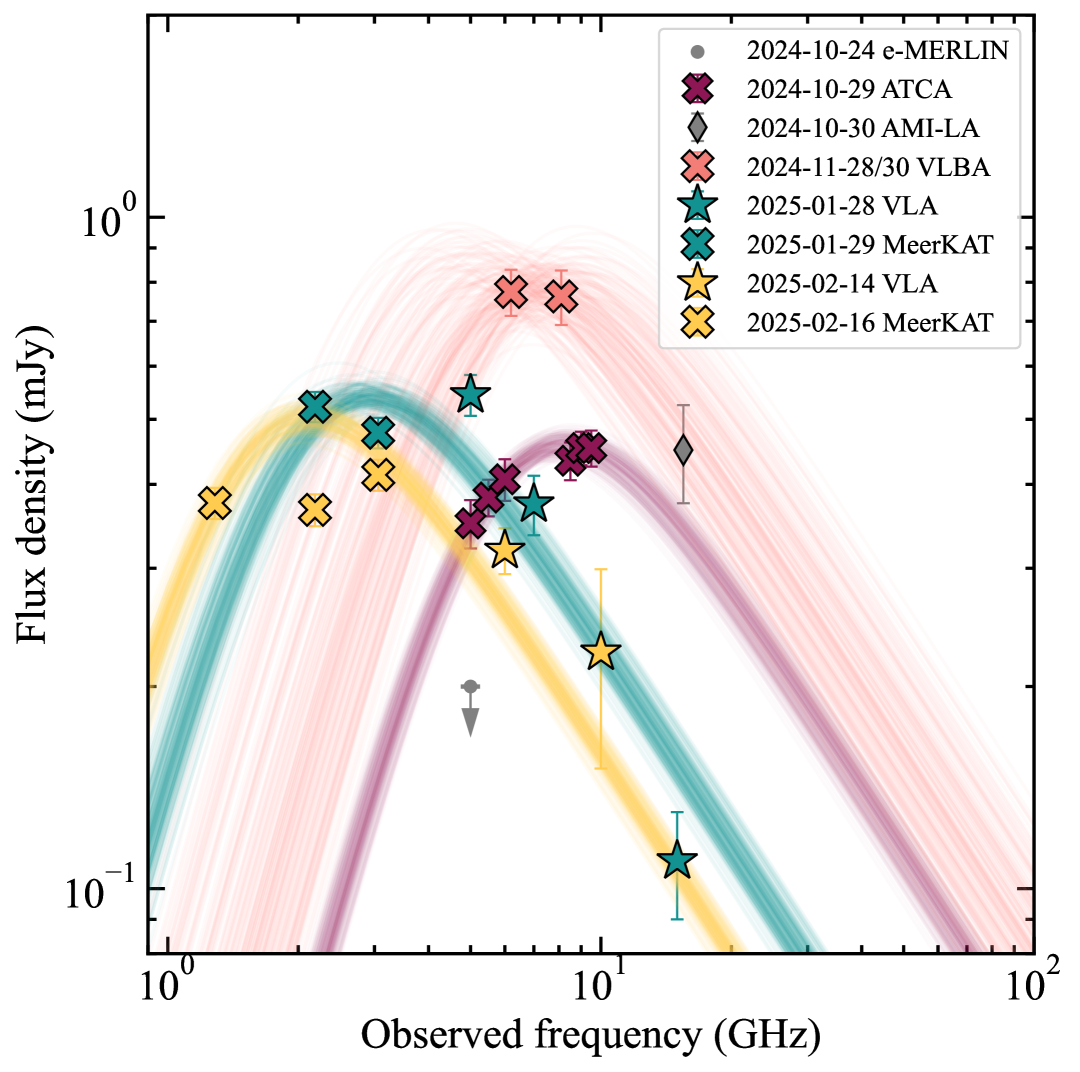
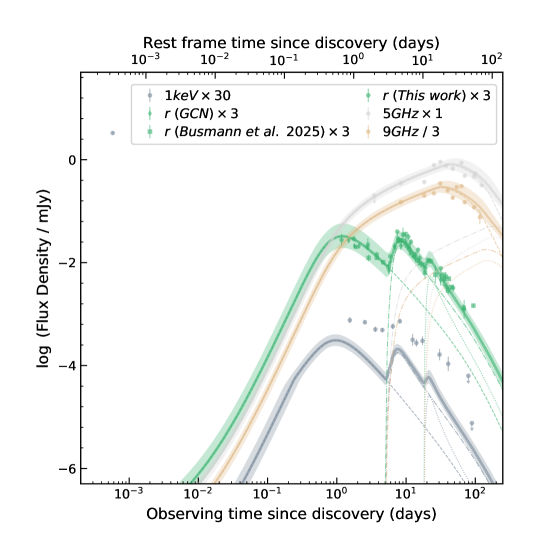
Figure 5 shows the radio SED and its evolution over four epochs, which was constructed using the publicly available ATCA data (Ricci et al., 2024, GCN 37949), as well as our own data obtained with MeerKAT, VLA and VLBA. Upon the radio detection, the SED peaks at 10 GHz, but exhibits a shift towards higher flux density through 18 days in rest-frame. The joint MeerKAT and VLA observations, taken between 57 and 67 rest-frame days post trigger, revealed that the peak of the SED shifts downwards to 2 GHz, with a flux of 0.5 mJy. To quantify the temporal evolution, we fit the SED with synchrotron emission models in the context of an outflow expanding into and shocking the surrounding medium, following the same approach outlined in Goodwin et al. (2022) and Zhang et al. (2024).
Due to the sparse sampling of radio spectrum and lack of high frequency observations, we fit the radio spectrum using the synchrotron spectrum 2 model described in Granot et al. (2002), assuming , where is the characteristic synchrotron frequency of the emitting electrons with the least energy and is the self-absorption frequency, and fixing the synchrotron energy index in the optical thin regime to (e.g., Alexander et al., 2016; Cendes et al., 2021). We use an MCMC fitting technique (python module emcee; Foreman-Mackey et al., 2013) to marginalize over the synchrotron model parameters to determine the best-fitting parameters and uncertainties. In Figure 5, we show the resulting SED models, which provide reasonable fits to the data. From the best-fitting SED models, we determine the peak flux density and frequency, and , respectively.
Using the inferred values of and , we can calculate the equipartition radius and energy in the relativistic regime assuming the outflow is viewing on-axis (Barniol Duran et al., 2013), which was derived as:
Here and are geometric factors, for , and is the Lorentz factor of outflow. Considering the exceptionally high X-ray and radio luminosity likely due to a strong beaming effect, we assume a narrow jet with a half-opening angle of , such that .
To find the mimimal energy using the equipartition arguments, we need another equation that relates the time since the onset of the relativistic outflow, , the radius , and the Lorentz factor ():
where is the velocity of the outflow. The equipartition analysis suggests a modest Lorentz factor , and an equipartition energy . Note that the total minimal energy will be increased by a factor of , if considering that the hot protons carry a significant portion of the total energy (Barniol Duran & Piran, 2013). Furthermore, if considering the case that we are away from the equipartition, the estimate on the Lorentz factor is still valid. In this case, the total energy will be larger by a factor of if , where and are the microphysical parameters, the fractions of the total energy in electrons and magnetic field, respectively.
We note that the flux at S0-band (2.2 GHz) observed by MeerKAT decreased from 0.51 mJy to 0.39 mJy over two-weeks, while the variability amplitude observed in other MeerKAT bands was not as significant as that in the S0-band. We consider whether the observed variability might be affected by interstellar scintillation (ISS). This process occurs when radio waves propagate through an inhomogeneous plasma of our Galaxy, which could cause intraday variability in some AGNs with compact radio emission (Lovell et al., 2003; Rickett, 2007). The amount and timescale of radio variation caused by ISS depend on the Galactic electron column density along the line of sight and the observing frequency. Using the NE2001 free electron density model developed by Cordes & Lazio (2002)888https://pypi.org/project/pyne2001/, and the Galactic dispersion measure (DM)999EP241021a has a galactic coordinate of (). We used the DM of 27.5 cm-3 pc for EP241021a, which was derived from the pulsar J0156+0402 () in the ATNF Pulsar Catalogue., we find that, at the position of EP241021a, the transition frequency between strong and weak-scattering regime is 7.93 GHz and the angular size limit of the first Fresnel zone at the transition is 6.2 as. Using the formalism in Walker (1998), we estimate that the level of frequency- and time-dependent random flux variations induced by ISS is from 59 at 3.1 GHz to 2.8 at 15.0 GHz for EP241021a. When adding the ISS-induced flux variations to the measurement uncertainties, the radio SED fittings in epoch II and III observations cannot converge. This is because that SED sampling is either too sparse or peaks at lower frequency where the expected ISS effect is large. On the other hand, we find that while the ISS effect increases the uncertainty on the derived physical parameters for the epoch I and IV observations, it does not bias the above estimation of Lorentz factor and total minimal energy of outflow.
4 Discussion
Here we summarize the multi-wavelength properties of EP241021a, highlighting the uniqueness in the temporal evolution:
(1) EP241021a was triggered by EP/WXT that had a duration of 100 s, with a time-averaged X-ray flux (0.5-4 keV) of , corresponding to an isotropic-equivalent energy of the prompt emission erg. The flare’s X-ray spectrum is relatively hard with a photon index , likely associated with non-thermal emission.
(2) An X-ray counterpart was detected by EP/FXT about 36.96 hr after the trigger, with a flux (0.3-10 keV) of , implying a rapid flux decline by more than three orders of magnitude within about 1.5 d. During the phase from d to 8 d ( is the time of trigger), the evolution of the X-ray emission enters a nearly plateau phase, with a sign of late-time rebrightening. The FXT observations confirmed the hard X-ray spectrum, with no significant spectral evolution. Then the X-ray emission shows a power-law decline with over 30 d, followed by rapidly dropping below detection.
(3) Optical emission associated with EP241021a was detected within 1.8 d after the X-ray trigger, possibly related to the afterglow of the prompt X-ray emission. At d, an optical brightening was observed peaking at mag in the r-band, with a fast rise time of only 2 d. Such a fast timescale of the optical evolution and high peak luminosity resemble luminous fast blue optical transients (FBOTs, Ho et al., 2023). During the optical peak, Keck spectroscopy observations have been performed, which revealed narrow emission lines from the host galaxy and confirmed the redshift of EP241021a at . A late-time optical rebrightening appears at d, though not as significant and bright as the second one, with a peak luminosity of mag. EP241021a exhibits a persistent red color ( 0.4 mag) over a period of at least 40 days since discovery, which is unusual among known optical transients. There is a potential coincidence between the phases of optical and X-ray brightenings.
(4) Follow-up radio observations reveal the appearance of the radio counterpart at d. Over the period of 110 days of post-trigger radio observations, the peak flux density increases for the first month, followed by a decrease in the subsequent two months. During this time range, the self-absorption frequency decreases. The radio spectral luminosity is as high as erg s-1 Hz-1, comparable to that of long GRBs and jetted TDEs at similar evolution epochs. An equipartition analysis suggests that a relativistic outflow with a moderate bulk Lorentz factor () and a minimumn energy of may have launched.
The X-ray, optical and radio observations suggest that EP241021a is an extremely unusual transient, and multiple emission components might be required to account for its multi-wavelength properties, such as various mechanisms to produce the rebrightening emission or episodic energy injections from multiple outflows. In the next section, we will explore the possible scenarios that could accommodate the multi-wavelength behavior of EP241021a.
4.1 A choked/weak jet and a supernova shock breakout
Both the isotropic energy and the peak energy of the prompt emission are significantly lower than those of conventional long GRBs. While the luminosity of EP241021a falls into the range of low-luminosity GRBs, it stands as an outlier from the Amati-Yonetoku relation due to its lower peak energy, similar to the EP FEXTs EP240414a and EP250108a, both of which are associated with broad-lined Type Ic supernovae (SN Ic-BL, Sun et al., 2024; Li et al., 2025). Note that both EP240414a and EP250108a also exhibited optical brightening in their light curves (Sun et al., 2024; Li et al., 2025). Together with the non-detection of high-energy gamma-ray emission, it has been proposed that a collapsar-driven low-energy jet choked in an extended circumstellar material (CSM) can explain their multi-wavelength properties (Hamidani et al., 2025; Eyles-Ferris et al., 2025). In this scenario, multiple emission components are invoked account for the evolution in different phases, including the early-phase afterglow emission from the choked/weak jet, the late-phase emission from a Type Ic-BL supernova, and the middle rebrightening phase due to the supernova shock breakout (SBO). In addition, the cocoon produced by the interaction of the jet with the dense CSM could also contribute to the emission (Hamidani et al., 2025).
Generally speaking, no supernova-like features were identified in the late-time optical spectroscopy observations of EP241021a (Busmann et al., 2025). However, such a negative supernova observation could just be due to the relatively large distance of the source. One cannot fully rule out that the second optical bump is produced by the breakout of the supernova shock from the CSM. In order to account for the fast evolution of the optical bump and its bolometric luminosity on the order of , the mass of the CSM would be required to be about , which spreads within a range of several thousands of solar radius (Khatami & Kasen, 2024). However, it could still be not easy to account for the large radius of the emitting photosphere, which can be constrained to
| (1) | ||||
where is the Stefan-Boltzmann constant and the reference value of the black body temperature is taken according to its relatively red color. Furthermore, the existence of the dense CSM environment could effectively hinder the propagation of the jet/cocoon and thus the generation of the afterglow emission. Finally, very different from EP240414a and EP250108a, EP241021a displays a long-lasting X-ray afterglow emission (39 d), which can even brighten up too with the optical bump. This X-ray bump obviously cannot be contributed by the cooling cocoons or generated by a radiation-mediated shock propagating into the dense CSM (Margalit et al., 2022).
4.2 A magnetar engine and its possible origin
If the optical rebrightening is not contributed by a supernova SBO, then whether it is possible or not to directly ascribe the rebrightening to a supernova-like emission? Using the photospheric radius to represent the outer radius of the explosion ejecta, which can be correct when the ejecta is optically thick at the early time, we can constrain the expansion velocity of the ejecta to be . This velocity is obviously higher than the typical velocity of supernovae. Meanwhile, according to the prompt emission energy of and assuming a reference radiation efficiency of , we can further take the initial kinetic energy of the explosion ejecta to be about , which is typical for both normal supernova explosions and compact binary mergers. Combining the estimates of and , the mass of the ejecta can be calculated to . Then, we can express the photon diffusion timescale of the expanding ejecta by
| (2) | ||||
which indicates that a relatively high opacity would be invoked to match the observed peak time of the optical rebrightening.
All of the high speed, low mass, and high opacity of the ejecta point to that EP241021a could originate from a merger of double neutron stars or a collapse of a super-Chandrasekhar white dwarf. In the former case, it is widely believed that an amount of Lanthanides can be synthesized in the neutron-rich ejecta, which can give a natural explanation for the ultra-high opacity as (Kasen et al., 2013). The low mass of the ejecta further indicates that the prompt emission energy of EP241021a on the order of erg cannot be provided by the decays of radioactive elements in the ejecta and, instead, a more powerful energy source is definitely required. As widely suggested, such an extra energy supply can be provided naturally by the remnant compact object, which is most likely to be a millisecond magnetar (Yu et al., 2013; Metzger & Piro, 2014; Yu et al., 2019b, a). In this case, the magnetar can not only enhance the optical thermal emission of the ejecta, but can also generate X-rays directly through its wind nebula emission. So, the X-ray bump associating with the optical transient can be explained by the leakage of the nebula emission from the ejecta (Yu et al., 2019a). For a detailed modeling of EP241021a in this scenario please see Wu et al. (2025). In particular, if this millisecond magnetar is specifically formed from an accretion-induced collapse (AIC) of a white dwarf, then the interaction between the magnetar and the residual companion star could further lead to intermittent energy injection into the ejecta. As a result, some post-peak light-curve bumps could be produced (Zhu et al., 2024), just as observed in EP241021a .
In such magnetar engine cases, the s bright X-ray emission detected by WXT may be attributed to the magnetar wind dissipation during the initial spindown period, with a viewing angle away from the central jet (Zhang, 2013; Sun et al., 2017; Chen et al., 2025) and multi-messenger gravitational wave signals may be accompanied but are too faint to be detected with the current gravitational wave detectors.
4.3 A structured GRB jet
The general synchronous evolution of the optical and X-ray emission could also indicate that the multi-wavelength brightenings are the results of the dynamical evolution of a structured jet. On the one hand, the jet could be radially structured and its external shock can be continuously refreshed because of the energy injection from the catching-up and more energized jet material (Rees & Mészáros, 1998; Yu et al., 2007; Busmann et al., 2025). However, in this scenario, it could not be easy to produce a flux jump of , unless the jet actually consists of a series of discrete segments that have very different Lorentz factors (see Sect. 4.4 for a specific example). On the other hand, the jet could be angularly structured and the line of sight (LOS) somewhat deviates from the symmetric axis of the jet (Rossi et al., 2002; Zhang & Mészáros, 2002). Then, as the emission from the core of the jet gradually enters the view, a rising afterglow can be obtained. Here, in order to explain the fast jump of the emission, the jet should consist of two or more separated angular components, which could specifically correspond to the core, wing, and cocoons of the jet (see Gianfagna et al. (2025) for a detailed modeling). In this case, since the LOS initially pointed to the wide slow component, optical and X-ray bumps can be produced when the narrow fast component suddenly emerges in the view at a later time (Granot et al., 2002; Yamazaki et al., 2004; Xu et al., 2023b; O’Connor et al., 2024). Such a non-thermal origin of both optical and X-ray brightenings is further beneficial for explaining the hard X-ray spectrum and the relatively red color of the optical emission
To model the multi-wavelength light curves in the two-component jet scenario, we use mainly the optical -band data taken from our follow-up observations, GCN Circulars, and the dataset presented by Busmann et al. (2025), in which the bump features are more clearly presented. All the fluxes have been corrected by the Galactic extinction. For the radio data, we utilize mainly the flux densities observed at 5 GHz and 9 GHz, as they are less affected by the ISS effect and are relatively well sampled. In addition to data provided in Table 2, we retrieve the relevant data observed by ATCA (Program ID: CX585), consisting of totally 8 observations. We then produce the calibrated clean images, and measure the flux densities at 5 GHz and 9 GHz, following the same procedures described in Section 2.3.4. However, the fitting to the multi-wavelength light curves with a structured jet yields an unphysically high Lorentz factor (exceeding ) for the fast, narrow jet. Furthermore, this model fails to account for the third optical bump observed around days after the burst. The optical flux observed after this bump is also significantly higher than that predicted by the model.
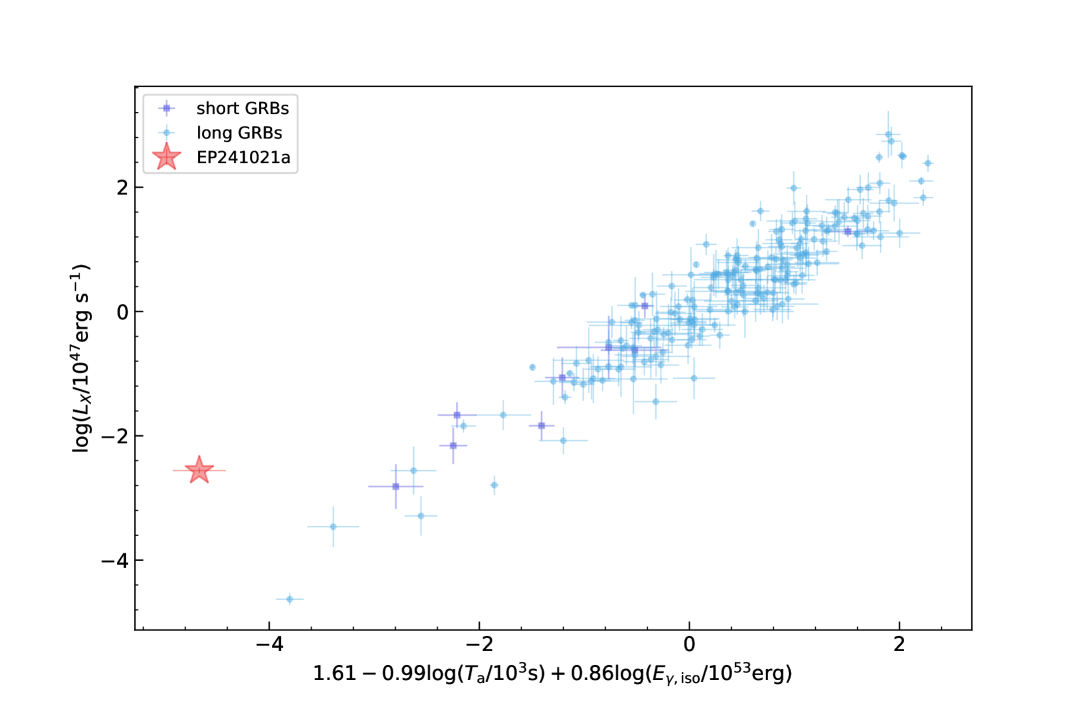
In any case, Xu & Huang (2012) identified a tight relation linking the luminosity and duration of the plateau to the isotropic-equivalent gamma-ray energies. As shown in Figure 6, EP241021a deviates significantly from this relation, suggesting a possibly different origin for the X-ray emission as observed in conventional GRBs.
4.4 Multiple jet ejections from repeating partial TDE
4.4.1 Modeling the multi-wavelength light curves with three jets launched at separate times
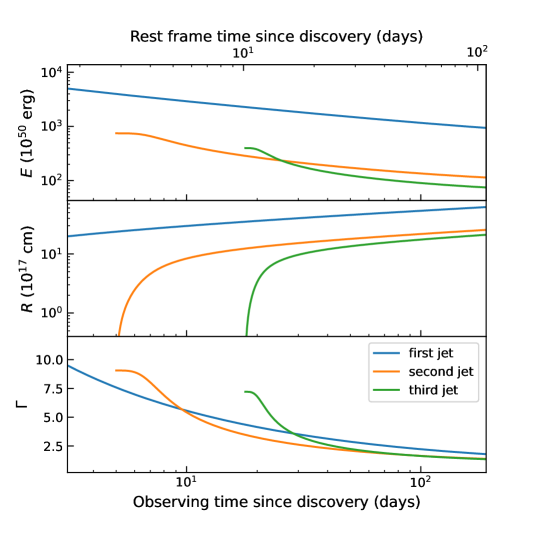
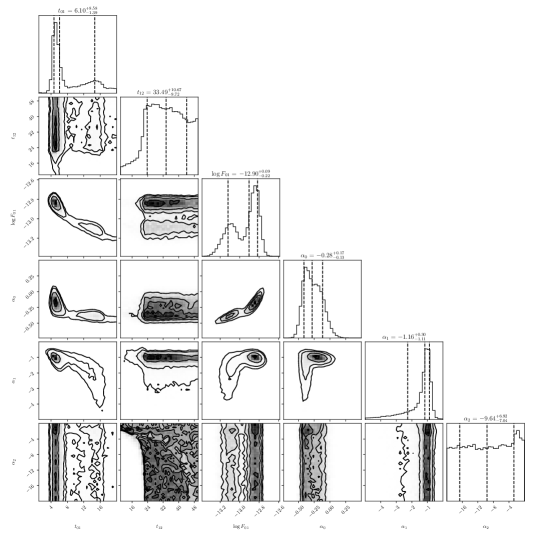
The discrepancies of modeling with a two-component structured jet motivate us to explore an alternative explanation. We thus turn to the scenario involving three jet ejections, in which the two late-time optical bumps arise from the interactions of two additional jets launched a few days after the initial one. Following the approach outlined in Huang et al. (2000), we calculate the jet dynamics and associated synchrotron emission separately for each of the three jet components (see also Xu et al., 2023a). The MCMC algorithm is employed to constrain the model parameters. The subscripts 1”, 2”, and “3” denote the first, second, and third jets, respectively. Determining the opening angles of all three jets are challenging due to the absence of a clear jet break in the lightcurve. As a result, the opening angles of all three jets are fixed at rad, and assumed to be viewed on-axis.
The best-fit models to match the multi-wavelength light curves are plotted in the left panel of Figure 7. In the right panel of Firgure 7, we illustrate the evolution of the kinetic energy, radius, and Lorentz factor for the three jets. The best-fit results are presented in Table C1, while the corresponding corner plot is shown in in Figure C1. The inferred initial Lorentz factors are for the first jet, for the second, and for the third, indicating that all three outflows are mildly relativistic. The Lorentz factors are not at odds with that constrained by the radio SED fittings and the equipartition analysis (Section 3.3), though only one jet shocking synchrotron emission component was assumed for the latter. The isotropic kinetic energies are estimated to be erg for the first jet, erg for the second, and erg for the third. The time interval between the first and second jets is constrained to approximately days in the rest frame, while the interval between the second and third jets spans about days in the rest frame. We note that the model under-predicts the X-ray emission, suggesting that an additional emission component is required, perhaps from the internal dissipation process within the jet powered by an active central engine (Andreoni et al., 2022; Yao et al., 2024). We will discuss the interesting implications of the three-jet model in the next section.
4.4.2 Constraints on the black hole mass in the context of TDE
The long-lived X-ray emission may be attributed to a stellar tidal disruption, in which an extreme accretion episode onto a black hole produces relativistic jet ejections. Thus, EP241021a could be a rare jetted TDE. So far only four TDEs with relativistic jets have been disclosed, with the latest one being AT2022cmc (Andreoni et al., 2022). Jetted TDEs are generally characterized by luminous X-ray and radio emission, as well as rapid variability in the early X-ray emission on timescales of as short as 100 s (Mangano et al., 2016; Pasham et al., 2023). In Swift J1644+57, the prototype of jetted TDE, the X-ray flux can vary by more than two orders of magnitude in the first several days since trigger, with multiple brief flares lasting for s (Krolik & Piran, 2011). The large-amplitude flares could result from geometric effects due to erratic ‘wrobbling’ of the jet during the alignment process (Tchekhovskoy et al., 2014; Teboul & Metzger, 2023). In the context of TDEs, the prompt X-ray emission of EP241021a may be related to the precessing jet. It is possible that other flares (if present) may have lower luminosities hence been escaped detection by EP/WXT (Yuan et al., 2025). The observed duration for prompt emission (100 s) can be used to place an upper limit on the size of the X-ray emitting region, cm. By requiring that exceeds the light-crossing time of the Schwarzschild radius of a black hole with mass , we find M⊙.
Our deep XMM-Newton limit at days indicates a decrease in the X-ray flux by a factor of 10 and a deviation from the earlier power-law decline. Such a sudden decrease could be interpreted as an accretion state transition from super- to sub-Eddington, leading to the cessation of jet ejections, as observed in other jetted TDEs (Eftekhari et al., 2024). In the scenario of a TDE, we can estimate the black hole mass () of EP241021a by equating the X-ray luminosity at shut-off to the Eddington luminosity (Eftekhari et al., 2024), such that
| (3) |
where is the breaking luminosity at the time of jet shut-off ( ). and represent the radiative efficiencies of the disk and jet, respectively. As before, we adopt a jet half-opening angle rad, yielding the jet beaming factor . Following Eftekhari et al. (2024), by assuming and a bolometric correction to the jet luminosity , we obtain a black mass M⊙, making EP241021a a possibly jetted TDE involving an intermediate-mass black hole (IMBH). On the other hand, if the fast rise time (1.3 d) in the second optical bump is related to the fallback timescale of the disrupted stellar material, which is given by
| (4) |
where is the mass of the disrupted star, and represents its radius for a main-sequence star. The implied black hole mass is M⊙ for a solar type star, supporting for the scenario of a TDE by an IMBH.
Finally, at the redshift of EP241021a, the host galaxy is not detected in deep imaging with the DESI-Legacy survey down to a limiting r-band magnitude of 24.5. The host may be fainter than 24.9 mag as observed by VLT (Busmann et al., 2025), corresponding to an upper limit on the stellar mass of M⊙. We use a galaxy bulge–black hole mass relation and the upper limit on the EP241021a’s galaxy mass to obtain an upper limit on BH mass of M⊙, which is not at odds with the mass estimates as inferred from the timescale and luminosity of jet shut-off.
4.4.3 Energy and time-scale considerations for repeating partial TDE
To account for the rebrightening of both X-ray and optical emission, we invoke a scenario that a star is tidally disrupted by the IMBH, more than once, i.e., repeating partial TDE. The timescale of X-ray and optical rebrightening will then correspond to the orbital period of the survived stellar core after the first disruption. We consider a main-sequence star initially on a slightly bound orbit. Following each disruption, the accretion of stellar debris onto the IMBH powers a relativistic jet, which accommodates the model of multiple jet ejections discussed previously. The kinetic energy of the jets is approximately , where and denote the isotropic kinetic energy and Lorentz factor, respectively. The accretion of the stellar debris by an IMBH can generate energy of , which suggests that stellar materials of mass as low as needs to be tidally stripped off each time in order to fuel the jet (with a jet energy efficiency of .)
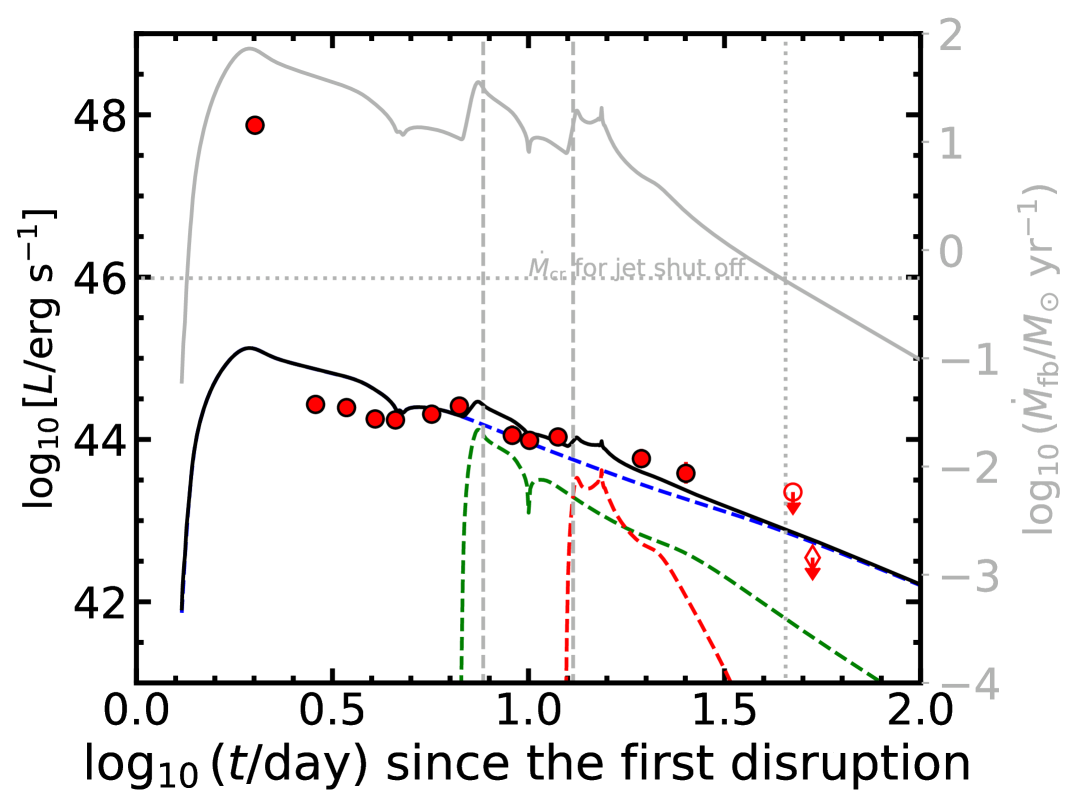
Based on this picture, we conduct theoretical calculations to match three key constraints placed by observations: 1) The orbital timescale of the stellar core, after the first disruption, should match the timescale of the X-ray and optical rebrightening timescale. 2) The overall debris fallback rate should decay from super-Eddington to sub-Eddington around the time that the jet is observed to shut off. 3) The accretion of the stellar materials is sufficient to power the observed jet energy.
For the calculation of the for stars in a bound orbit, we modified the parabolic fallback rate, that is given in Guillochon & Ramirez-Ruiz (2013) (assuming a polytropic star), by shifting the debris specific energy to , where is the specific orbital energy of the star. is given by with shifted , aligning with the simulations of eccentric TDEs (Hayasaki et al., 2013). We also account for the change of orbital energy of the stellar remnant during a partial disruption following the approach of Chen et al. (2024).
We find that the observational constraints as mentioned above can be reasonably well satisfied using the model of a IMBH partially disrupting a solar-like star. The star initially approaches the IMBH along a bound orbit with eccentricity and impact factor . After the first encounter, the star goes through a partial TDE, and the suvived core returns for a second encounter with and impact factor , followed by a second partial TDE. After the second TDE, the suvived core returns with and impact factor , leading to a complete disruption. To reconcile the energy ratio of the three jets, i.e., and , the accreted stellar masses in these three encounters are , , and , respectively. We note that the stellar mass-radius relation should deviate from that of a main-sequence star after the encounter. In our calculation, the stellar density has a slight decrease after each encounter, which is consistent with tidal effects such as tidal heating and tidal spin-up causing the star to expand.
We also show the comparison between and the observed data in Figure 8. One can see that the overall fallback rate behavior can well explain the observed rebrightening at and days, as well as the accretion state transition observed at day after the initial trigger. Subsequent to this transition, falls below the critical value , leading to the jet shut off. is given by (Shen & Matzner, 2014), where , and are the Eddington luminosity, disk radius and Schwarzchild radius of the IMBH, respectively. To match the timing of the X-ray sharp decay, we find that the disk size should be , where is the pericenter radius of the stellar orbit. This value is reasonable for a typical TDE, where the initial disk experiences modest expansion due to viscous shear.
The inferred isotropic luminosity is given by
| (5) |
where is the efficiency of converting accretion power into jet radiative energy, and the values of for the three jets are taken to be , and , respectively, as derived from previous calculations. For matching the overall level of the X-ray flux, a very small value () is needed, suggesting that the jet energy is mostly in the form of the kinetic energy (and electromagnetic energy) instead of radiative energy, which is consistent with recent simulations of super-Eddington jets (Dai et al., 2018; Curd & Narayan, 2019).
5 Conclusion
We report the discovery of a peculiar X-ray transient, EP241021a, by EP/WXT on Oct 21, 2024, and the results from follow-up multiwavelength observations including X-ray, optical and radio. Our sensitive X-ray observations with EP/FXT and XMM-Newton reveal a long-duration of X-ray emission lasting for at least one month, which is unprecedented among known extragalactic fast X-ray transients. Both optical and radio counterparts are detected within several days after the trigger, with high peak luminosities in excess of and , respectively. These properties, together with the non-thermal X-ray spectrum, red optical color, X-ray and optical rebrightening, and fast radio spectral evolution, are suggesting that relativistic jets may have been launched, possibly driven by an active central engine. We have considered a variety of scenarios as origins of EP241021a, and favor a magnetar engine or jetted TDE, although neither can perfectly interpret the multiwavelength properties.
Observations with the Hubble Space Telescope, and possibly with the James Webb Space Telescope, are encouraged, which have sufficient sensitivity to potentially unveil the faint host galaxy once the transient emission has disappeared. The detection of the host will enable to further explore whether the transient position (for example, the radio position from our high-resolution VLBA observations) is spatially coincident with the host light centroid. This is crucial to understand the nature of EP241021a, from a rare jetted TDE involving an IMBH or an off-nuclear extremely unusual stellar explosion ever found. With its unique capability of wide-field survey and rapid X-ray follow-ups, EP will discover more transients similar to EP241021a with intermediate evolution timescale of months. Timely and deep multi-wavelength follow-up observations are essential for further characterizing and uncovering their intriguing properties as a potential new phenomenon.
References
- Alexander et al. (2016) Alexander, K. D., Berger, E., Guillochon, J., Zauderer, B. A., & Williams, P. K. G. 2016, ApJ, 819, L25, doi: 10.3847/2041-8205/819/2/L25
- Alp & Larsson (2020) Alp, D., & Larsson, J. 2020, ApJ, 896, 39, doi: 10.3847/1538-4357/ab91ba
- Andreoni et al. (2022) Andreoni, I., Coughlin, M. W., Perley, D. A., et al. 2022, Nature, 612, 430, doi: 10.1038/s41586-022-05465-8
- Astropy Collaboration et al. (2013) Astropy Collaboration, Robitaille, T. P., Tollerud, E. J., et al. 2013, A&A, 558, A33, doi: 10.1051/0004-6361/201322068
- Astropy Collaboration et al. (2018) Astropy Collaboration, Price-Whelan, A. M., Sipőcz, B. M., et al. 2018, AJ, 156, 123, doi: 10.3847/1538-3881/aabc4f
- Astropy Collaboration et al. (2022) Astropy Collaboration, Price-Whelan, A. M., Lim, P. L., et al. 2022, ApJ, 935, 167, doi: 10.3847/1538-4357/ac7c74
- Barniol Duran et al. (2013) Barniol Duran, R., Nakar, E., & Piran, T. 2013, ApJ, 772, 78, doi: 10.1088/0004-637X/772/1/78
- Barniol Duran & Piran (2013) Barniol Duran, R., & Piran, T. 2013, ApJ, 770, 146, doi: 10.1088/0004-637X/770/2/146
- Bauer et al. (2017) Bauer, F. E., Treister, E., Schawinski, K., et al. 2017, MNRAS, 467, 4841, doi: 10.1093/mnras/stx417
- Buchner (2021) Buchner, J. 2021, The Journal of Open Source Software, 6, 3001, doi: 10.21105/joss.03001
- Buchner (2023) —. 2023, Statistics Surveys, 17, 169, doi: 10.1214/23-SS144
- Buchner et al. (2014) Buchner, J., Georgakakis, A., Nandra, K., et al. 2014, A&A, 564, A125, doi: 10.1051/0004-6361/201322971
- Burns et al. (2024) Burns, E., Ravasio, M. E., Jonker, P. G., Goldstein, A., & Fermi-GBM Team. 2024, GRB Coordinates Network, 37855, 1
- Busmann et al. (2025) Busmann, M., O’Connor, B., Sommer, J., et al. 2025, arXiv e-prints, arXiv:2503.14588, doi: 10.48550/arXiv.2503.14588
- Carotenuto et al. (2024) Carotenuto, F., Bright, J., & Fender, R. 2024, GRB Coordinates Network, 38014, 1
- Cendes et al. (2021) Cendes, Y., Alexander, K. D., Berger, E., et al. 2021, ApJ, 919, 127, doi: 10.3847/1538-4357/ac110a
- Chen et al. (2025) Chen, C., Wang, Y., & Zhang, B. 2025, arXiv e-prints, arXiv:2505.01606, doi: 10.48550/arXiv.2505.01606
- Chen et al. (2024) Chen, J.-H., Dai, L., Liu, S.-F., & Ou, J.-W. 2024, 977, 80, doi: 10.3847/1538-4357/ad8b24
- Cordes & Lazio (2002) Cordes, J. M., & Lazio, T. J. W. 2002, arXiv e-prints, astro, doi: 10.48550/arXiv.astro-ph/0207156
- Curd & Narayan (2019) Curd, B., & Narayan, R. 2019, 483, 565, doi: 10.1093/mnras/sty3134
- Dai et al. (2018) Dai, L., McKinney, J. C., Roth, N., Ramirez-Ruiz, E., & Miller, M. C. 2018, 859, L20, doi: 10.3847/2041-8213/aab429
- Deller et al. (2011) Deller, A. T., Brisken, W. F., Phillips, C. J., et al. 2011, PASP, 123, 275, doi: 10.1086/658907
- Deng et al. (2023) Deng, C., Huang, Y.-F., & Xu, F. 2023, ApJ, 943, 126, doi: 10.3847/1538-4357/acaefd
- Eappachen et al. (2023) Eappachen, D., Jonker, P. G., Levan, A. J., et al. 2023, ApJ, 948, 91, doi: 10.3847/1538-4357/acc184
- Eftekhari et al. (2024) Eftekhari, T., Tchekhovskoy, A., Alexander, K. D., et al. 2024, ApJ, 974, 149, doi: 10.3847/1538-4357/ad72ea
- Eyles-Ferris et al. (2025) Eyles-Ferris, R. A. J., Jonker, P. G., Levan, A. J., et al. 2025, arXiv e-prints, arXiv:2504.08886, doi: 10.48550/arXiv.2504.08886
- Filippenko (1982) Filippenko, A. V. 1982, PASP, 94, 715, doi: 10.1086/131052
- Foreman-Mackey et al. (2013) Foreman-Mackey, D., Hogg, D. W., Lang, D., & Goodman, J. 2013, PASP, 125, 306, doi: 10.1086/670067
- Fu et al. (2024a) Fu, S. Y., Zhu, Z. P., An, J., et al. 2024a, GRB Coordinates Network, 37840, 1
- Fu et al. (2024b) Fu, S. Y., Tinyanont, S., Anutarawiramkul, R., et al. 2024b, GRB Coordinates Network, 37842, 1
- Gianfagna et al. (2024) Gianfagna, G., Bruni, G., Piro, L., & Thakur, A. L. 2024, GRB Coordinates Network, 37906, 1
- Gianfagna et al. (2025) Gianfagna, G., Piro, L., Bruni, G., et al. 2025, arXiv e-prints, arXiv:2505.05444, doi: 10.48550/arXiv.2505.05444
- Glennie et al. (2015) Glennie, A., Jonker, P. G., Fender, R. P., Nagayama, T., & Pretorius, M. L. 2015, MNRAS, 450, 3765, doi: 10.1093/mnras/stv801
- Goodwin et al. (2022) Goodwin, A. J., van Velzen, S., Miller-Jones, J. C. A., et al. 2022, MNRAS, 511, 5328, doi: 10.1093/mnras/stac333
- Granot et al. (2002) Granot, J., Panaitescu, A., Kumar, P., & Woosley, S. E. 2002, ApJ, 570, L61, doi: 10.1086/340991
- Greisen (2003) Greisen, E. W. 2003, in Astrophysics and Space Science Library, Vol. 285, Information Handling in Astronomy - Historical Vistas, ed. A. Heck, 109
- Guillochon et al. (2018) Guillochon, J., Nicholl, M., Villar, V. A., et al. 2018, ApJS, 236, 6, doi: 10.3847/1538-4365/aab761
- Guillochon & Ramirez-Ruiz (2013) Guillochon, J., & Ramirez-Ruiz, E. 2013, ApJ, 767, 25, doi: 10.1088/0004-637X/767/1/25
- Hamidani et al. (2025) Hamidani, H., Sato, Y., Kashiyama, K., et al. 2025, arXiv e-prints, arXiv:2503.16243, doi: 10.48550/arXiv.2503.16243
- Hayasaki et al. (2013) Hayasaki, K., Stone, N., & Loeb, A. 2013, MNRAS, 434, 909, doi: 10.1093/mnras/stt871
- Heywood (2020) Heywood, I. 2020, oxkat: Semi-automated imaging of MeerKAT observations, Astrophysics Source Code Library, record ascl:2009.003
- Ho et al. (2023) Ho, A. Y. Q., Perley, D. A., Gal-Yam, A., et al. 2023, ApJ, 949, 120, doi: 10.3847/1538-4357/acc533
- Hu et al. (2024) Hu, J. W., Wang, Y., He, H., et al. 2024, GRB Coordinates Network, 37834, 1
- Huang et al. (2000) Huang, Y. F., Gou, L. J., Dai, Z. G., & Lu, T. 2000, ApJ, 543, 90, doi: 10.1086/317076
- Izzo et al. (2025) Izzo, L., Martin-Carrillo, A., Malesani, D. B., et al. 2025, GRB Coordinates Network, 39851, 1
- Jiang et al. (2025) Jiang, S.-Q., Xu, D., van Hoof, A. P. C., et al. 2025, arXiv e-prints, arXiv:2503.04306, doi: 10.48550/arXiv.2503.04306
- Jonker et al. (2013) Jonker, P. G., Glennie, A., Heida, M., et al. 2013, ApJ, 779, 14, doi: 10.1088/0004-637X/779/1/14
- Kasen et al. (2013) Kasen, D., Badnell, N. R., & Barnes, J. 2013, ApJ, 774, 25, doi: 10.1088/0004-637X/774/1/25
- Kennicutt (1998) Kennicutt, Jr., R. C. 1998, ARA&A, 36, 189, doi: 10.1146/annurev.astro.36.1.189
- Khatami & Kasen (2024) Khatami, D. K., & Kasen, D. N. 2024, ApJ, 972, 140, doi: 10.3847/1538-4357/ad60c0
- Kraft et al. (1991) Kraft, R. P., Burrows, D. N., & Nousek, J. A. 1991, ApJ, 374, 344, doi: 10.1086/170124
- Krolik & Piran (2011) Krolik, J. H., & Piran, T. 2011, ApJ, 743, 134, doi: 10.1088/0004-637X/743/2/134
- Kumar et al. (2024) Kumar, A., Maund, J. R., Sun, N. C., et al. 2024, GRB Coordinates Network, 37875, 1
- Lacy et al. (2020) Lacy, M., Baum, S. A., Chandler, C. J., et al. 2020, PASP, 132, 035001, doi: 10.1088/1538-3873/ab63eb
- Levan et al. (2024) Levan, A. J., Jonker, P. G., Saccardi, A., et al. 2024, arXiv e-prints, arXiv:2404.16350, doi: 10.48550/arXiv.2404.16350
- Li et al. (2024) Li, W. X., Sun, N. C., Maund, J., Wang, Y. N., & Wiersema, K. 2024, GRB Coordinates Network, 37846, 1
- Li et al. (2025) Li, W. X., Zhu, Z. P., Zou, X. Z., et al. 2025, arXiv e-prints, arXiv:2504.17034, doi: 10.48550/arXiv.2504.17034
- Lin et al. (2022) Lin, D., Irwin, J. A., Berger, E., & Nguyen, R. 2022, ApJ, 927, 211, doi: 10.3847/1538-4357/ac4fc6
- Liu et al. (2025a) Liu, M. J., Li, D. Y., Zhang, M. H., et al. 2025a, GRB Coordinates Network, 39187, 1
- Liu et al. (2025b) Liu, Y., Sun, H., Xu, D., et al. 2025b, Nature Astronomy, 9, 564, doi: 10.1038/s41550-024-02449-8
- Lovell et al. (2003) Lovell, J. E. J., Jauncey, D. L., Bignall, H. E., et al. 2003, AJ, 126, 1699, doi: 10.1086/378053
- Mangano et al. (2016) Mangano, V., Burrows, D. N., Sbarufatti, B., & Cannizzo, J. K. 2016, ApJ, 817, 103, doi: 10.3847/0004-637X/817/2/103
- Margalit et al. (2022) Margalit, B., Quataert, E., & Ho, A. Y. Q. 2022, ApJ, 928, 122, doi: 10.3847/1538-4357/ac53b0
- McMullin et al. (2007) McMullin, J. P., Waters, B., Schiebel, D., Young, W., & Golap, K. 2007, in Astronomical Society of the Pacific Conference Series, Vol. 376, Astronomical Data Analysis Software and Systems XVI, ed. R. A. Shaw, F. Hill, & D. J. Bell, 127
- Metzger & Piro (2014) Metzger, B. D., & Piro, A. L. 2014, MNRAS, 439, 3916, doi: 10.1093/mnras/stu247
- O’Connor et al. (2024) O’Connor, B., Beniamini, P., & Gill, R. 2024, MNRAS, 533, 1629, doi: 10.1093/mnras/stae1941
- O’Connor et al. (2025) O’Connor, B., Pasham, D., Andreoni, I., et al. 2025, ApJ, 979, L30, doi: 10.3847/2041-8213/ada7f5
- Offringa & Smirnov (2017) Offringa, A. R., & Smirnov, O. 2017, MNRAS, 471, 301, doi: 10.1093/mnras/stx1547
- Oke et al. (1995) Oke, J. B., Cohen, J. G., Carr, M., et al. 1995, PASP, 107, 375, doi: 10.1086/133562
- Pasham et al. (2023) Pasham, D. R., Lucchini, M., Laskar, T., et al. 2023, Nature Astronomy, 7, 88, doi: 10.1038/s41550-022-01820-x
- Peng et al. (2019) Peng, Z.-K., Yang, Y.-S., Shen, R.-F., et al. 2019, ApJ, 884, L34, doi: 10.3847/2041-8213/ab481b
- Perley (2019) Perley, D. A. 2019, PASP, 131, 084503, doi: 10.1088/1538-3873/ab215d
- Quirola-Vásquez et al. (2022) Quirola-Vásquez, J., Bauer, F. E., Jonker, P. G., et al. 2022, A&A, 663, A168, doi: 10.1051/0004-6361/202243047
- Quirola-Vásquez et al. (2023) —. 2023, A&A, 675, A44, doi: 10.1051/0004-6361/202345912
- Quirola-Vásquez et al. (2024) —. 2024, A&A, 683, A243, doi: 10.1051/0004-6361/202347629
- Rastinejad et al. (2025) Rastinejad, J. C., Levan, A. J., Jonker, P. G., et al. 2025, arXiv e-prints, arXiv:2504.08889, doi: 10.48550/arXiv.2504.08889
- Rees & Mészáros (1998) Rees, M. J., & Mészáros, P. 1998, ApJ, 496, L1, doi: 10.1086/311244
- Ricci et al. (2024) Ricci, R., Bruni, G., Carotenuto, F., Gianfagna, G., & Yao, Y. 2024, GRB Coordinates Network, 37949, 1
- Ricci et al. (2025) Ricci, R., Troja, E., Yang, Y.-H., et al. 2025, ApJ, 979, L28, doi: 10.3847/2041-8213/ad8b3f
- Rickett (2007) Rickett, B. J. 2007, Astronomical and Astrophysical Transactions, 26, 429, doi: 10.1080/10556790701600580
- Rossi et al. (2002) Rossi, E., Lazzati, D., & Rees, M. J. 2002, MNRAS, 332, 945, doi: 10.1046/j.1365-8711.2002.05363.x
- Ruiz et al. (2022) Ruiz, A., Georgakakis, A., Gerakakis, S., et al. 2022, MNRAS, 511, 4265, doi: 10.1093/mnras/stac272
- Sault et al. (1995) Sault, R. J., Teuben, P. J., & Wright, M. C. H. 1995, in Astronomical Society of the Pacific Conference Series, Vol. 77, Astronomical Data Analysis Software and Systems IV, ed. R. A. Shaw, H. E. Payne, & J. J. E. Hayes, 433
- Shen (2019) Shen, R.-F. 2019, ApJ, 871, L17, doi: 10.3847/2041-8213/aafc64
- Shen & Matzner (2014) Shen, R.-F., & Matzner, C. D. 2014, 784, 87, doi: 10.1088/0004-637x/784/2/87
- Shepherd (1997) Shepherd, M. C. 1997, in Astronomical Society of the Pacific Conference Series, Vol. 125, Astronomical Data Analysis Software and Systems VI, ed. G. Hunt & H. Payne, 77
- Srinivasaragavan et al. (2025) Srinivasaragavan, G. P., Hamidani, H., Schroeder, G., et al. 2025, arXiv e-prints, arXiv:2504.17516, doi: 10.48550/arXiv.2504.17516
- Srivastav et al. (2025) Srivastav, S., Chen, T. W., Gillanders, J. H., et al. 2025, ApJ, 978, L21, doi: 10.3847/2041-8213/ad9c75
- Sun et al. (2017) Sun, H., Zhang, B., & Gao, H. 2017, ApJ, 835, 7, doi: 10.3847/1538-4357/835/1/7
- Sun et al. (2024) Sun, H., Li, W. X., Liu, L. D., et al. 2024, arXiv e-prints, arXiv:2410.02315, doi: 10.48550/arXiv.2410.02315
- Tchekhovskoy et al. (2014) Tchekhovskoy, A., Metzger, B. D., Giannios, D., & Kelley, L. Z. 2014, MNRAS, 437, 2744, doi: 10.1093/mnras/stt2085
- Teboul & Metzger (2023) Teboul, O., & Metzger, B. D. 2023, ApJ, 957, L9, doi: 10.3847/2041-8213/ad0037
- van Dalen et al. (2025) van Dalen, J. N. D., Levan, A. J., Jonker, P. G., et al. 2025, ApJ, 982, L47, doi: 10.3847/2041-8213/adbc7e
- Walker (1998) Walker, M. A. 1998, MNRAS, 294, 307, doi: 10.1046/j.1365-8711.1998.01238.x10.1111/j.1365-8711.1998.01238.x
- Wang et al. (2024) Wang, Y., He, H., Yang, S. K., et al. 2024, GRB Coordinates Network, 37848, 1
- Wu et al. (2025) Wu, G.-L., Yu, Y.-W., Liu, L.-D., & et al. in preparation. 2025
- Xu et al. (2023a) Xu, F., Huang, Y.-F., & Geng, J.-J. 2023a, A&A, 679, A103, doi: 10.1051/0004-6361/202346674
- Xu et al. (2023b) Xu, F., Huang, Y.-F., Geng, J.-J., et al. 2023b, A&A, 673, A20, doi: 10.1051/0004-6361/202245414
- Xu et al. (2021) Xu, F., Tang, C.-H., Geng, J.-J., et al. 2021, ApJ, 920, 135, doi: 10.3847/1538-4357/ac158a
- Xu & Huang (2012) Xu, M., & Huang, Y. F. 2012, A&A, 538, A134, doi: 10.1051/0004-6361/201117754
- Yamazaki et al. (2004) Yamazaki, R., Ioka, K., & Nakamura, T. 2004, ApJ, 606, L33, doi: 10.1086/421084
- Yao et al. (2024) Yao, Y., Lu, W., Harrison, F., et al. 2024, ApJ, 965, 39, doi: 10.3847/1538-4357/ad2b6b
- Yin et al. (2024) Yin, Y.-H. I., Zhang, B.-B., Yang, J., et al. 2024, ApJ, 975, L27, doi: 10.3847/2041-8213/ad8652
- Yu et al. (2019a) Yu, Y.-W., Chen, A., & Li, X.-D. 2019a, ApJ
- Yu et al. (2019b) Yu, Y.-W., Chen, A., & Wang, B. 2019b, ApJ
- Yu et al. (2007) Yu, Y. W., Liu, X. W., & Dai, Z. G. 2007, ApJ, 671, 637, doi: 10.1086/522829
- Yu et al. (2013) Yu, Y.-W., Zhang, B., & Gao, H. 2013, ApJ, 776, L40, doi: 10.1088/2041-8205/776/2/L40
- Yuan et al. (2025) Yuan, W., Dai, L., Feng, H., et al. 2025, arXiv e-prints, arXiv:2501.07362, doi: 10.48550/arXiv.2501.07362
- Zhang (2013) Zhang, B. 2013, ApJ, 763, L22, doi: 10.1088/2041-8205/763/1/L22
- Zhang & Mészáros (2002) Zhang, B., & Mészáros, P. 2002, ApJ, 571, 876, doi: 10.1086/339981
- Zhang et al. (2024) Zhang, F., Shu, X., Yang, L., et al. 2024, ApJ, 962, L18, doi: 10.3847/2041-8213/ad1d61
- Zhang et al. (2025) Zhang, W., Yuan, W., Ling, Z., et al. 2025, Science China Physics, Mechanics, and Astronomy, 68, 219511, doi: 10.1007/s11433-024-2524-4
- Zheng et al. (2024a) Zheng, W., Brink, T. G., Filippenko, A. V., Yang, Y., & KAIT GRB Team. 2024a, GRB Coordinates Network, 38294, 1
- Zheng et al. (2024b) Zheng, W., Han, X., Zhang, P., Filippenko, V., A., & KAIT GRB team. 2024b, GRB Coordinates Network, 37849, 1
- Zhu et al. (2024) Zhu, J.-P., Liu, L.-D., Yu, Y.-W., et al. 2024, ApJ, 970, L42, doi: 10.3847/2041-8213/ad63a8
Appendix A Log of optical photometry observations
The log of optical photometry observations and results are shown in Table LABEL:tab:obs_optical.
| Time (days) | Band | Magnitudea | Telescope |
|---|---|---|---|
| 1.13 | clear | BOOTES-7 | |
| 1.14 | g | BOOTES-7 | |
| 1.14 | clear | KAIT(Vega) | |
| 1.15 | r | BOOTES-7 | |
| 1.17 | V | TRT-SRO | |
| 1.17 | R | TRT-SRO | |
| 1.76 | r | 21.55 0.13 | LT |
| 1.77 | g | 22.04 0.22 | LT |
| 1.77 | z | NOT | |
| 1.91 | r | NOT | |
| 2.07 | r | 21.88 0.11 | LCO |
| 2.08 | i | 21.73 0.11 | LCO |
| 2.12 | clear | KAIT(Vega) | |
| 2.76 | r | NOT | |
| 2.80 | g | 22.06 0.18 | LT |
| 2.81 | r | 21.83 0.30 | LT |
| 2.82 | i | 21.60 0.18 | LT |
| 2.82 | z | NOT | |
| 2.83 | z | 21.78 0.20 | LT |
| 2.93 | R | 21.92 0.16 | 1.5m-OSN |
| 3.72 | g | 22.52 0.35 | LT |
| 3.73 | i | 21.92 0.19 | LT |
| 3.77 | r | NOT | |
| 3.79 | z | NOT | |
| 5.90 | r | NOT | |
| 6.55 | r | ALT-50A | |
| 7.46 | R | TRT-SBO | |
| 7.76 | g | 21.73 0.07 | LT |
| 7.78 | i | 21.27 0.06 | LT |
| 7.90 | r | 21.58 0.12 | LT |
| 7.92 | r | NOT | |
| 7.92 | z | 20.93 0.16 | LT |
| 7.93 | z | NOT | |
| 8.93 | g | 21.69 0.20 | LT |
| 8.96 | z | 21.04 0.32 | LT |
| 8.96 | B | TRT-SRO | |
| 8.99 | V | TRT-SRO | |
| 9.01 | R | TRT-SRO | |
| 9.03 | I | TRT-SRO | |
| 9.64 | g | 22.03 0.11 | LCO |
| 9.65 | r | 21.67 0.13 | LCO |
| 9.71 | g | 21.89 0.21 | LT |
| 9.72 | i | 21.25 0.08 | LT |
| 9.73 | r | 21.66 0.31 | LT |
| 9.73 | z | 20.95 0.22 | LT |
| 9.78 | r | NOT | |
| 9.80 | z | NOT | |
| 10.74 | g | 22.25 0.22 | LT |
| 10.74 | i | 21.33 0.11 | LT |
| 10.75 | r | 21.45 0.16 | LT |
| 10.76 | z | 21.11 0.17 | LT |
| 11.72 | g | 22.12 0.16 | LT |
| 11.73 | i | 21.92 0.14 | LT |
| 11.74 | r | 21.70 0.13 | LT |
| 11.74 | z | 21.33 0.49 | LT |
| 12.74 | r | NOT | |
| 13.88 | z | NOT | |
| 13.97 | r | 22.53 0.20 | LCO |
| 13.98 | i | 21.86 0.15 | LCO |
| 14.72 | g | 22.54 0.11 | LT |
| 14.73 | i | 21.86 0.10 | LT |
| 14.85 | g | 22.53 0.25 | LT |
| 14.86 | r | 22.09 0.12 | LT |
| 14.86 | i | 22.12 0.18 | LT |
| 14.87 | z | 21.58 0.25 | LT |
| 15.71 | g | 22.86 0.27 | LT |
| 15.72 | r | 22.49 0.17 | LT |
| 15.72 | i | 22.19 0.12 | LT |
| 15.73 | z | 21.89 0.26 | LT |
| 18.70 | r | NOT | |
| 19.80 | z | NOT | |
| 27.39 | r | NanShan-HMT | |
| 31.71 | r | 22.98 | LT |
| 31.72 | g | 23.01 | LT |
| 31.74 | i | 22.35 0.32 | LT |
| 31.75 | z | 22.23 | LT |
| 37.47 | r | ALT-100C | |
| 37.52 | z | ALT-100C | |
| 38.68 | r | NOT | |
| 39.41 | r | ALT-100C | |
| 39.43 | z | ALT-100C | |
| 47.77 | r | 23.94 0.18 | GTC |
| 48.76 | i | NOT | |
| 68.83 | r | NOT | |
| 73.67 | i | NOT | |
| aThe magnitude has not been corrected for Galactic extinction. | |||
Appendix B Fittings to the X-ray light curve
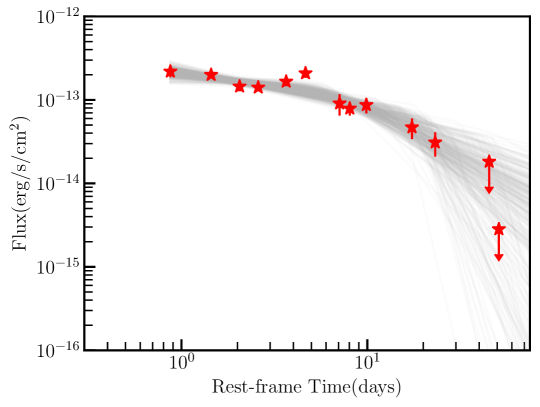
Figure B1 shows the X-ray light curve of EP241021a (filled red circles and downward arrows) and the best-fit model realizations from MCMC fittings (gray curves). The light curve is modeled using a smoothed broken power-law function. The function takes the following form as presented by Eftekhari et al. (2024):
In order to incorporate the information provided by the upper limit points into the fitting process, we redefine the likelihood function (Eftekhari et al., 2024):
Where denotes a data point without detection, and represents the detection data point.
where is the error function. represents the Poisson single-sided upper limits for data points without detection.
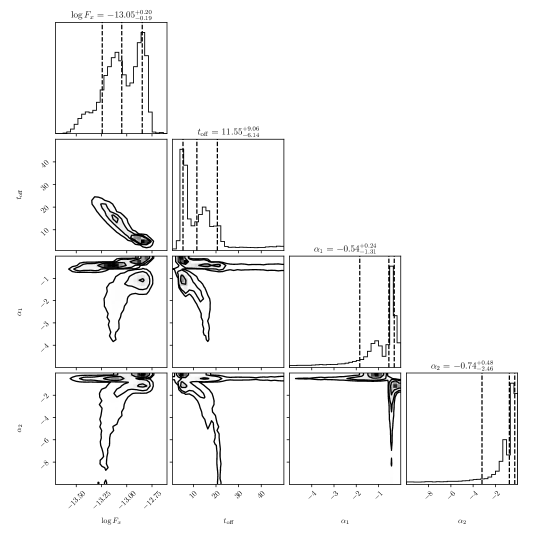
We find that the fit cannot adequately capture the last two upper-limit points. To address this issue, we introduce a third power-law segment into the fitting formula and omit the smoothing factor. The resulting functional form is as follows.
Here, , , and denote the power-law indices of the three segments; and represent the times of the first and second breaks, respectively; and denotes the flux at the first break time.
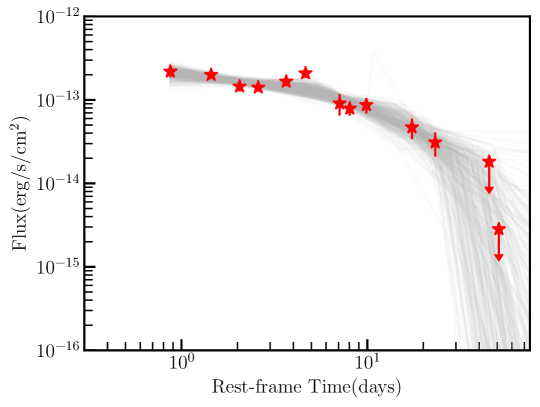
In Figure B2, we also show the best-fit model realizations to the X-ray light curve using the three piecewise power-law model. In comparison with the broken power-law function, we found that the Bayes factor , where , and are known as the marginal likelihood or Bayesian evidence (Buchner, 2023). This suggests that the fittings with piecewise powerlaw is statistically better than the broken power law function. Therefore, our analysis of the X-ray light curve was based mainly on the fitting results with the piecewise power-law.
Appendix C Parameter Constraints for the Three-jets Model from the Lightcurve Fitting
In this section, we show the corner plot of the multiwavelength fitting results using the model consisting of three jet ejections (Figure C1), and the constraints on the jet parameters (Table C1).
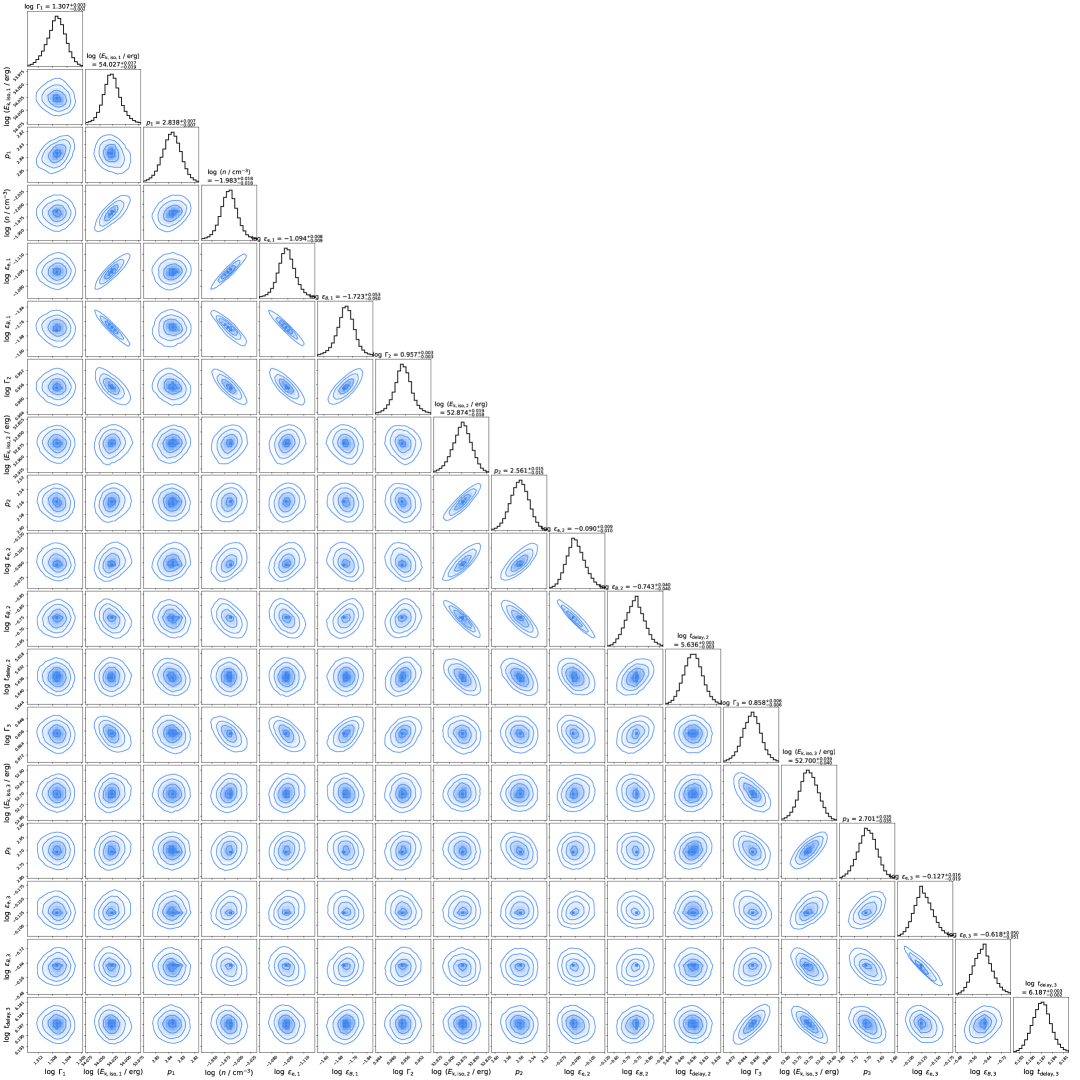
| Parametersa | First Jet | Second jet | Third jet |
|---|---|---|---|
| 1.307 0.002 | 0.957 0.003 | 0.858 0.006 | |
| 54.027 0.018 | 52.874 0.018 | 52.7 0.04 | |
| 2.838 0.007 | 2.561 0.015 | 2.701 0.035 | |
| -1.094 0.008 | -0.09 0.01 | -0.127 0.018 | |
| -1.723 0.052 | -0.743 0.04 | -0.618 0.05 | |
| -1.983 0.018 | … | … | |
| … | 5.636 0.003 | 6.187 0.002 |
Notes. aafootnotetext: The parameters involved in the three-jets model. and denote the initial Lorentz factor and the isotropic kenetic energy, respectively. represents the power-law index of the electron energy distribution. and are the fractions of energy carried by electrons and magnetic fields, respectively. is the number density of the circumburst medium. indicates the time delay between the emergence of the first jet and the subsequent two jets.