Investigating the Upper Scorpius OB association with HERMES. I. The spectroscopic sample and 6D kinematics
Abstract
OB associations are large, unbound groups of young stars, which typically exhibit great complexity in spatial, kinematic and age structure, which hints at formation scenarios involving an intricate interplay of molecular cloud turbulent kinematics and stellar feedback over extended periods. The kinematic properties of the numerous low-mass populations within OB associations can provide valuable constraints on their initial configurations, and thus the dominant mechanisms driving star formation and their dispersal into the field. However, precise kinematic information and accurate membership determination is necessary to build a complete and detailed description of OB associations, to test the many competing hypotheses for their formation. We present results from a large spectroscopic survey of the nearest young association to the Sun, Upper Scorpius, conducted using 2dF/HERMES on the Anglo-Australian Telescope. We use spectroscopic youth criteria such as Li-equivalent widths to identify 1000 pre-main sequence (PMS) members across the region and measure radial velocities, combining these with Gaia EDR3 5-parameter astrometry to obtain 6D kinematic information. We separate confirmed PMS association members into distinct kinematic groups and measure expansion and rotation trends in each. We find strong evidence for asymmetric expansion in several groups and derive expansion timescales from the greatest rates of expansion in each group. We also trace the past motion of these groups using an epicycle approximation and estimate the time since their most compact configuration. These kinematic properties are compared to literature ages and the star formation history of Upper Scorpius is discussed. We find evidence that a scenario in which star formation in the subgroups of Upper Scorpius proceeded independently, either by self-instability or external feedback from Upper Centaurus-Lupus, is more likely than a recently proposed “cluster chain” scenario in which these subgroups have triggered each other.
keywords:
Surveys; techniques: spectroscopic; stars: kinematics and dynamics; stars: pre-main-sequence; open clusters and associations: individual: Upper Scorpius1 Introduction
Most stars form in dense, gravitationally bound clusters or sparse substructured associations (e.g., Lada & Lada, 2003; Wright et al., 2023). Apart from the brightest O & B type stars, by which OB associations were first identified (Ambartsumian, 1947; Blaauw, 1964; de Zeeuw et al., 1999), the sparse distributions of low-mass young stellar objects (YSOs) that accompany them have historically been harder to detect. In addition, they tend to be unbound and thus disperse into the Galactic field over timescales of a few tens of Myrs (Wright, 2020).
Recent investigations, particularly using high precision astrometry from Gaia (Gaia Collaboration et al., 2016, 2021), have been able to identify the sparse and highly substructured distributions of nearby associations (e.g., Wright et al., 2016; Wright & Mamajek, 2018; Cantat-Gaudin et al., 2019a; Zari et al., 2019; Armstrong et al., 2022). Associations have also been revealed to contain significant age gradients (Kounkel et al., 2018; Kos et al., 2019; Cantat-Gaudin et al., 2019b; Damiani et al., 2019; Ratzenböck et al., 2023b), which, along with significant kinematic structure (Wright et al., 2016; Wright & Mamajek, 2018; Armstrong et al., 2022; Miret-Roig et al., 2022b; Kerr et al., 2025), indicates complex star formation histories involving the impact of feedback processes and turbulence within molecular clouds to produce initially unbound distributions of young stars in large volumes. This is in contrast to the monolithic cluster formation model where stars form in initially compact configurations, but disperse after residual gas expulsion (Tutukov, 1978; Hills, 1980; Kroupa et al., 2001), which would imply that OB associations are an intermediate stage of cluster dissolution.
However, it has yet to be determined what are the dominant mechanisms driving star formation in these complexes. It has been suggested that the age gradients found in OB associations point toward multiple epochs of star formation, with the initiation of star formation in one epoch being triggered by the impact of feedback from massive stars formed in the previous epoch (e.g., Elmegreen & Lada, 1977; Posch et al., 2025; Kerr et al., 2025). There is also the suggestion that star formation could be initiated by collisions between giant molecular clouds (GMCs) (e.g., Scoville et al., 1986), with a model in which collisions are driven by galactic shearing motions of orbiting GMCs (Tan, 2000; Tasker & Tan, 2009; Li et al., 2018) being potentially relevant to explaining observed large-scale star formation properties of disk galaxies (Tan, 2010; Suwannajak et al., 2014; Fortune-Bashee et al., 2024). Simulations of star formation resulting from individual GMC-GMC collisions, with relative cloud velocities of can produce spatial structure and disturbed kinematics among the newly formed stars similar to those observed in nearby regions (e.g., Wu et al., 2017, 2020). Stellar feedback driven cloud collisions have also been proposed as the main driver of new star formation in galaxies (Inutsuka et al., 2015). Other possibilities include models of star formation regulated by turbulence in GMCs (e.g., Krumholz & McKee, 2005; Padoan & Nordlund, 2011; Hennebelle & Chabrier, 2011). Combinations of the above models are also possible, e.g., if shear-driven GMC collisions are the main driver of turbulence in GMCs (Tan et al., 2013; Wu et al., 2018).

Upper Scorpius is the youngest ( 11 Myr; Pecaut & Mamajek, 2016) subgroup within Scorpius-Centaurus, the nearest OB association to the Sun (100-150 pc; de Zeeuw et al., 1999), containing OB stars spread over 200 square degrees. Its proximity, youth and low extinction make it a prime target for studies of the low-mass population of OB associations, even to the brown-dwarf regime (Wright & Mamajek, 2018; Damiani et al., 2019; Luhman & Esplin, 2020). The low extinction for association members indicates that the association has dispersed from its primordial molecular cloud. Recent kinematic studies show that Upper Sco is highly kinematically substructured and almost certainly unbound (Wright & Mamajek, 2018; Squicciarini et al., 2021). The full extent of the low-mass population is currently unknown, but thousands of low-mass counterparts to the OB population should exist for a normal initial mass function (IMF; e.g., Kroupa, 2001; Chabrier, 2003). The velocity dispersion ( 3.2 km/s; Wright & Mamajek, 2018) and age ( 11 Myr; Pecaut & Mamajek, 2016) of the known PMS and OB stars, and total spatial extent ( 40 pc; Wright & Mamajek, 2018) of Upper Sco seem incompatible with the simple expansion of a monolithic cluster after gas expulsion, and in fact Wright & Mamajek (2018) could not find evidence that the association had expanded from a single compact cluster. Instead, a hypothesis is that Upper Sco formed hierarchically at various sites, perhaps in a sequential way, so that there is a widespread population of unbound PMS stars dispersed across the association, while the massive stars may coincide with bound subclusters with unique kinematics (Damiani et al., 2019).
Recently the clustering and kinematics of Upper Scorpius have been investigated using high-precision astrometry from Gaia (Gaia Collaboration et al., 2021) with the finding that Upper Scorpius can indeed be divided into multiple subgroups (Squicciarini et al., 2021; Miret-Roig et al., 2022b; Ratzenböck et al., 2023b), which differ in their kinematics and ages, with older subgroups being centrally located within the Upper Scorpius region and younger subgroups located at the outskirts. This has led to the proposed “cluster chain” formation scenario (Posch et al., 2025) which hypothesises that the formation of the younger subgroups was triggered by feedback from the older subgroups in sequence. This would produce a significant age gradient across the region, as well as the large-scale “acceleration” observed between these subgroups.
However, these previous kinematic studies have gathered the majority of their radial velocity information from public surveys, such as APOGEE (Ahumada et al., 2020) and GALAH (Buder et al., 2021), which vary in radial velocity precision and in coverage across the region, meaning that the internal 3D kinematics of much of the low-mass population has not yet been fully analysed. Also, in these studies, membership for the bulk of the low-mass population of Upper Sco has so far been determined using astro-photometric or kinematic criteria, which risks biasing sample selection and analysis away from sources and structures with kinematics distinct from the bulk of the region. Ideally, membership determination and target selection for further observations should be kinematically unbiased in order to investigate the full complexity of the region. In particular, spectroscopic observations are necessary to provide both the missing radial velocities and firm youth criteria, such as Li-equivalent widths, enabling us to perform membership determination for young stars in the region independent of the kinematics we wish to analyse.
In this study we present results from a large-scale spectroscopic survey across the Upper Scorpius region with the goal of identifying young stars and studying their kinematics. Section 2 outlines the data used and the spectroscopic observations performed. Section 3 provides an overview of the region and dissects the young stellar population into distinct kinematic groups, with Section 5 going on to analyse their internal dynamics, focusing on expansion trends, kinematic anisotropies and kinematic age estimates via dynamical traceback. In particular, we look for evidence that the subgroups in the region are unbound and were likely in more compact configurations in the past, with the goal of assessing whether they could have formed as a sequence of dense clusters, or whether it is more likely that they formed in sparse distributions. In Section 6 we discuss our results in light of recent literature and infer the likely star formation scenario of the Upper Scorpius association.
2 The data
In this section we describe the target selection for spectroscopic observations with 2dF/AAT, and derivation of spectroscopic parameters, which we combined with astrometric and photometric data from Gaia to produce our sample of young stars with complete kinematic information.
2.1 AAT observations
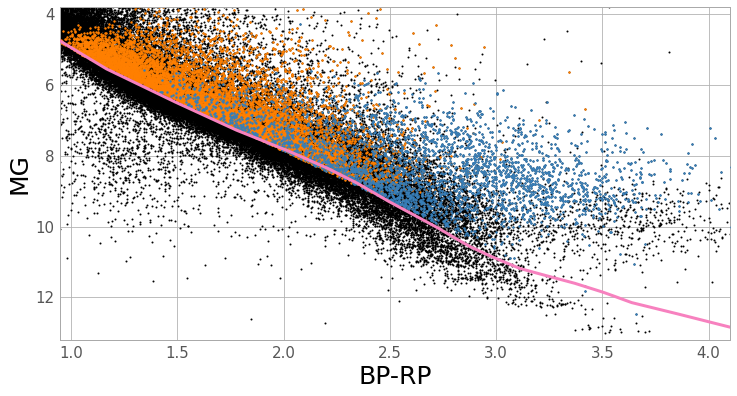
We selected candidate PMS stars in the Upper Sco region for spectroscopic follow-up using a Gaia DR3 GBP-GRP versus MG colour-absolute magnitude diagram (using distance estimates from Bailer-Jones et al. 2021) and selecting sources located above a 20 Myr PMS isochrones (Baraffe et al., 2015, see Fig. 1), with and mas (400 pc) to filter out background contaminants.
We selected targets in 25 fields (Fig. 2; listed in Table 1), which cover the densest groups of likely young stars in the region, as indicated by our photometric selection (Fig. 1) and by Gaia DR3 variability criteria (Marton et al., 2023), and effectively sample the distinct populations present in the region (Luhman & Esplin, 2020; Miret-Roig et al., 2022b; Ratzenböck et al., 2023b).
Observations were made on April 16th, May 21st - 22nd & June 10th - 12th 2023 with the 2-degree field (Lewis et al., 2002, 2dF) fibre positioner and the high-efficiency and resolution multi-element spectrograph (Sheinis et al., 2015, HERMES), which provides a resolution of 28,000 in four optical bands, at the Anglo-Australian Telescope (AAT). The red band of HERMES covers the wavelength range 6478–6737 Å within which both the H 6562.8 Å and Li 6707.8 Å lines are found. For each field we selected targets based on colour-absolute magnitude diagram (CaMD) position, which totaled 8061 targets for all fields with overlap, 7039 of which were unique sources. Multiple 1800s exposure were taken for each field, the total time for which, along with numbers of targets and numbers of spectroscopically confirmed PMS stars (Section 2.1.3), are given in Table 1. Calibration frames, including dark frames and multifibre flat fields were taken for each field and 25-40 fibres were used to measure the sky spectrum for each field.
.
2.1.1 Data reduction and analysis
The spectroscopic data were calibrated and reduced using the 2dF Data Reduction (2DFDR) software tool (AAO Software Team, 2015). Measurement of spectroscopic parameters (equivalent widths of the Li 6707.8 Å line; EW(Li)s) from reduced spectra was done using the same approach as described in Armstrong et al. (2022), following the procedures of Jeffries et al. (2021). We produced synthetic spectra using the MOOG spectral synthesis code (Sneden et al., 2012), with Kurucz (1992) solar-metallicity model atmospheres, for log = 4.5 and down to = 3500 K in 100k steps, with rotational broadening and instrument resolution accounted for in the extraction profile.
2.1.2 Radial Velocities
Radial velocities are the last component of complete 6D position-velocity information missing from Gaia for most sources. With high-resolution spectra from HERMES we can measure radial velocities up to a precision of , which is sufficient to investigate the internal kinematics of young clusters and star-forming regions.
The spectra we obtained in these observations have been included in the GALAH survey data release 4 (Buder et al., 2024). Among the many parameters derived are RVs, which we incorporate into our data sample for kinematic analysis. However, not all candidate YSO members of Upper Sco we observed necessarily have RVs in GALAH DR4, due to the various quality controls imposed in the compilation of the catalogue. Therefore, we also derive RVs and uncertainties from our own reduced spectra using the same approach as described in Armstrong et al. (2022).
Reduced target spectra were cross-correlated with their best-fitting synthetic spectra and RVs were determined from the position of the peak in the cross-correlation function (CCF) by fitting a Gaussian function. Targets for which a Gaussian function cannot be satisfactorily fitted to the CCF are not given valid RVs and are rejected from our sample.
RV uncertainties were also determined using the same approach as described in Armstrong et al. (2022), by measuring the change in RV between separate exposures of the same target (), normalised per field using the scaling function (equation 1; Armstrong et al., 2022).
We also cross-match our sources with the Survey of surveys catalogue (Tsantaki et al., 2022), which contains calibrated RVs for over 11,000,000 Gaia sources, compiled from multiple spectroscopic surveys. We find RVs for 874 of our targets; 605 with RVs from APOGEE (Majewski et al., 2017), 38 with RVs from the Gaia-ESO survey (Gilmore et al., 2012) and 295 with RVs from Gaia, with overlap.
We find 4006 of our targets with RVs km s-1 and SNR from both the GALAH DR4 catalogue and our analysis, with a median offset of 0.084 km s-1. We also find 386 targets with RVs km s-1 from both GALAH DR4 (SNR ) and the Survey of surveys catalogue (Tsantaki et al., 2022), with a median offset of 0.459 km s-1. We calibrate the compiled RVs by applying these offsets to RVs from the relevant source catalogues. For the targets with multiple RVs we take the weighted mean RVs, weighted by the square of the inverse measurement uncertainties in each case, with the aforementioned RV offsets applied.
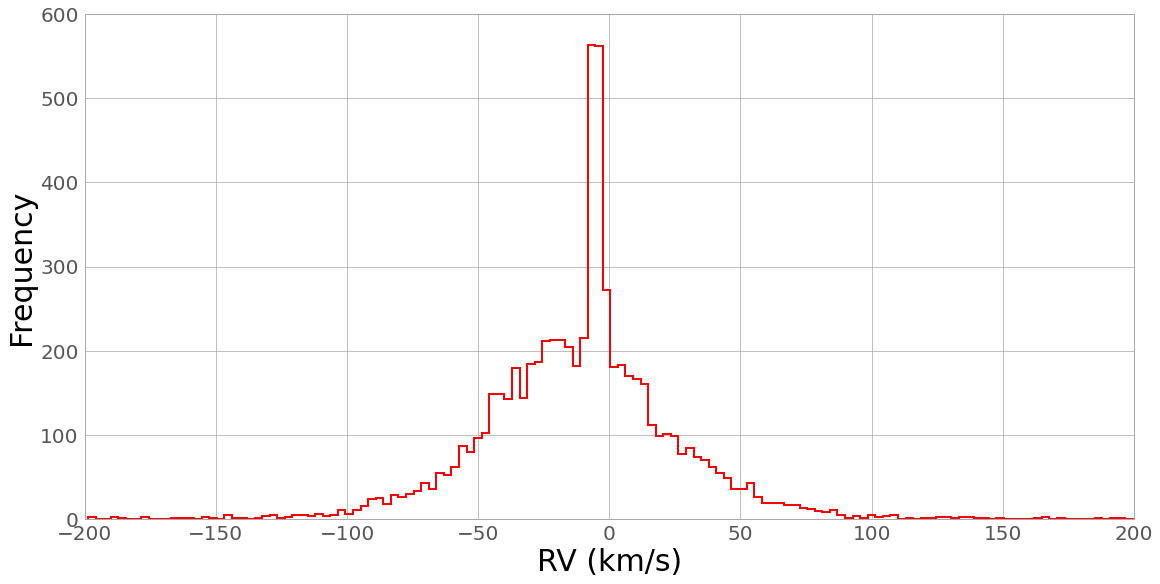
In total we have RVs available for 6727 of our 7039 unique targets, the distribution of which is plotted in Fig. 3.
| Field number | RA (∘) | Dec (∘) | Exposure time (s) | Targets | Confirmed YSOs |
|---|---|---|---|---|---|
| 1 | 244.0 | -24.0 | 5400 | 321 | 88 |
| 2 | 244.0 | -22.268 | 5400 | 328 | 59 |
| 3 | 245.5 | -23.134 | 6210 | 325 | 107 |
| 4 | 245.5 | -24.866 | 9000 | 321 | 108 |
| 5 | 244.0 | -25.732 | 9000 | 314 | 57 |
| 6 | 242.5 | -24.866 | 5400 | 321 | 67 |
| 7 | 242.5 | -23.134 | 5400 | 314 | 71 |
| 8 | 244.0 | -20.536 | 7200 | 321 | 33 |
| 9 | 245.5 | -21.402 | 5400 | 314 | 38 |
| 10 | 247.0 | -22.268 | 5400 | 321 | 25 |
| 11 | 247.0 | -24.0 | 5400 | 313 | 133 |
| 12 | 247.0 | -25.732 | 3600 | 326 | 96 |
| 13 | 245.5 | -26.598 | 9000 | 324 | 47 |
| 14 | 241.0 | -24.0 | 5400 | 328 | 41 |
| 15 | 241.0 | -22.268 | 5400 | 324 | 65 |
| 16 | 242.5 | -21.402 | 5400 | 324 | 62 |
| 17 | 244.0 | -18.804 | 5400 | 324 | 31 |
| 18 | 248.5 | -24.866 | 5400 | 328 | 47 |
| 19 | 239.5 | -23.134 | 5400 | 328 | 56 |
| 20 | 239.5 | -21.402 | 5400 | 324 | 30 |
| 21 | 241.0 | -20.536 | 11520 | 327 | 67 |
| 22 | 242.5 | -19.670 | 5400 | 324 | 86 |
| 23 | 241.0 | -18.804 | 5400 | 324 | 60 |
| 24 | 242.5 | -17.938 | 10800 | 328 | 24 |
| 25 | 238.0 | -22.268 | 5400 | 324 | 24 |
| Total | 8061 (7039) | 1522 (1204) |
2.1.3 Identifying YSOs
The presence of Li is an effective indicator of youth in low-mass young stars (Soderblom, 2010). We measured the equivalent width of the Li Å line (EW(Li)) following the same approach as described in Armstrong et al. (2022), by subtracting the synthetic spectrum from the target spectrum and then integrating under the relevant profile. EW(Li) uncertainties are taken as the RMS value of the EWs measured using the same procedure with the Gaussian profile of the CCF centred at five wavelengths either side of the Li Å line (Jackson et al., 2018).
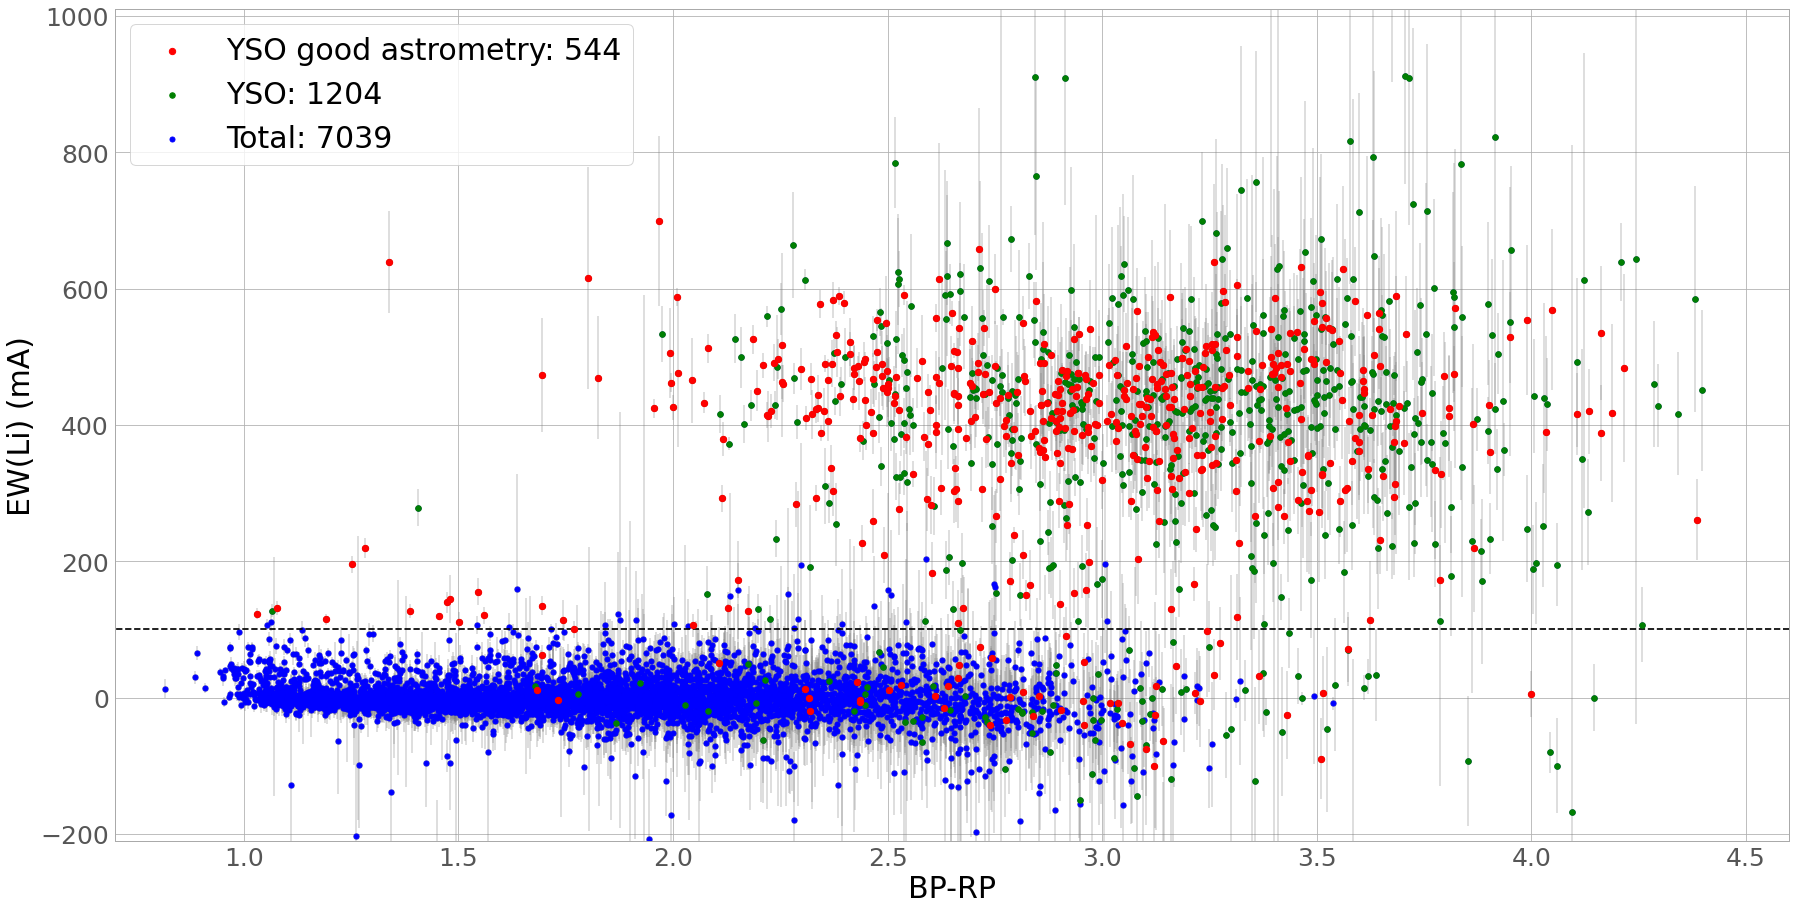
We obtained values of EW(Li) and EW(Li) uncertainties for 6937 (98.6%) of our 7039 unique targets, the distribution of which is illustrated in Fig. 4, and we identify 999 YSOs that pass the youth criteria of EW(Li)-EW(Li)_error mÅ .
Due to veiling, EW(Li)s can be underestimated for YSOs with high mass accretion rates (yr-1, Palla et al., 2005; Frasca et al., 2017), so we also measure spectroscopic signatures of accretion to identify such YSOs, in particular, excess emission of the H line at 6562.8Å .
As in Armstrong et al. (2022) we use both the equivalent-width of H and the spectral index of the wing components of the H emission profile, as described by Damiani et al. (2014), to select likely Classical T Tauris (CTTs). We adopt thresholds of EW(H) - EW(H)_error 10 Å and 1.1 (for sources with ). We identify 230 YSOs (likely CTTs) in our sample via these H criteria, 62 of which did not meet the EW(Li) criteria of EW(Li)-EW(Li)_error mÅ .
We also cross-match spectroscopic targets with YSOs from the Gaia DR3 variability catalogue (Marton et al., 2023). One of the main reasons why YSOs are expected to exhibit optical variability is as a result of fluctuating accretion activity while there remains a circumstellar disk. We identify 986 likely YSOs via this variability criteria, 176 of which we identify as CTTs by our H criteria and 831 which are also confirmed as YSOs via EW(Li).
Thus, in total, we identify 1204 YSOs.
2.2 Gaia astrometry
Spectroscopic targets are matched to the Gaia DR3 catalogue (Gaia Collaboration et al., 2021) to obtain positions, proper motions and parallaxes. Combined with our RVs, this gives us full 6D kinematic information for all of our 1204 confirmed YSOs. We filter targets with poor Gaia astrometric quality following the recommended criteria of Fabricius et al. (2021); RUWE 1.4, ipd_frac_multi_peak 3 and ipd_gof_harmonic_amplitude 0.1, in order to remove non-single stars. The velocity contribution of binary orbits, in particular, could bias our kinematic analysis. After applying these astrometric quality filters we are left with 544 confirmed YSOs with quality 6D kinematic information.
2.3 Deriving 3D positions and velocities
We obtain Cartesian positions XYZ and velocities UVW in the Galactic system following the same approach as Armstrong et al. (2022), using the coordinate transformation matrices from Johnson & Soderblom (1987). This is done via Bayesian inference where we perform 1000 iterations with 100 walkers in an unconstrained parameter space. We sample the posterior distribution using the MCMC sampler emcee (Foreman-Mackey et al., 2013), reporting the median, 16th and 84th percentiles as the best fit and 1 uncertainties respectively, after discarding the first 500 iterations as a burn in.
When deriving 3D positions we use Gaia parallaxes rather than distance estimates from Bailer-Jones et al. (2021). As described in Fiorellino et al. (2024), the priors involved in the probabilistic estimation of distances by Bailer-Jones et al. (2021) are not optimised for YSOs, nor for sources in clustered regions.
2.4 Summary of the data
After reducing the spectra of our AAT sources, we have 6646 unique sources with spectroscopic RV and EW(Li) values spread across 25 fields over the Upper Sco region, with 5-parameter astrometry from Gaia EDR3, with which we calculate Cartesian XYZ positions and UVW velocities. 1204 of these sources are identified as YSOs with significant EW(Li)s, EW(H)s or Gaia variability flag. The median uncertainties on parallax, distance, proper motion and RV for the confirmed PMS stars are 0.05 mas, 0.9 pc, 0.05 mas yr-1 and 0.56 km s-1 respectively. 544 of these confirmed PMS stars pass our filters for astrometric quality.
3 Overview of the sample
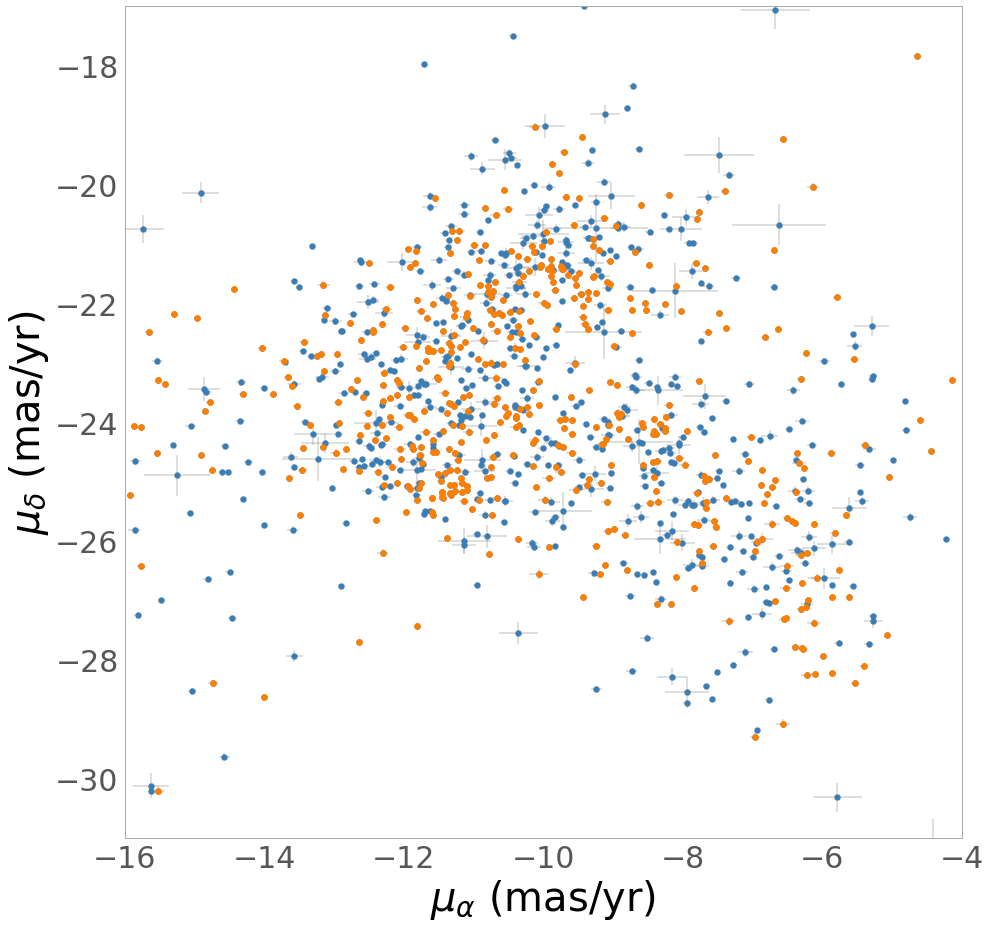
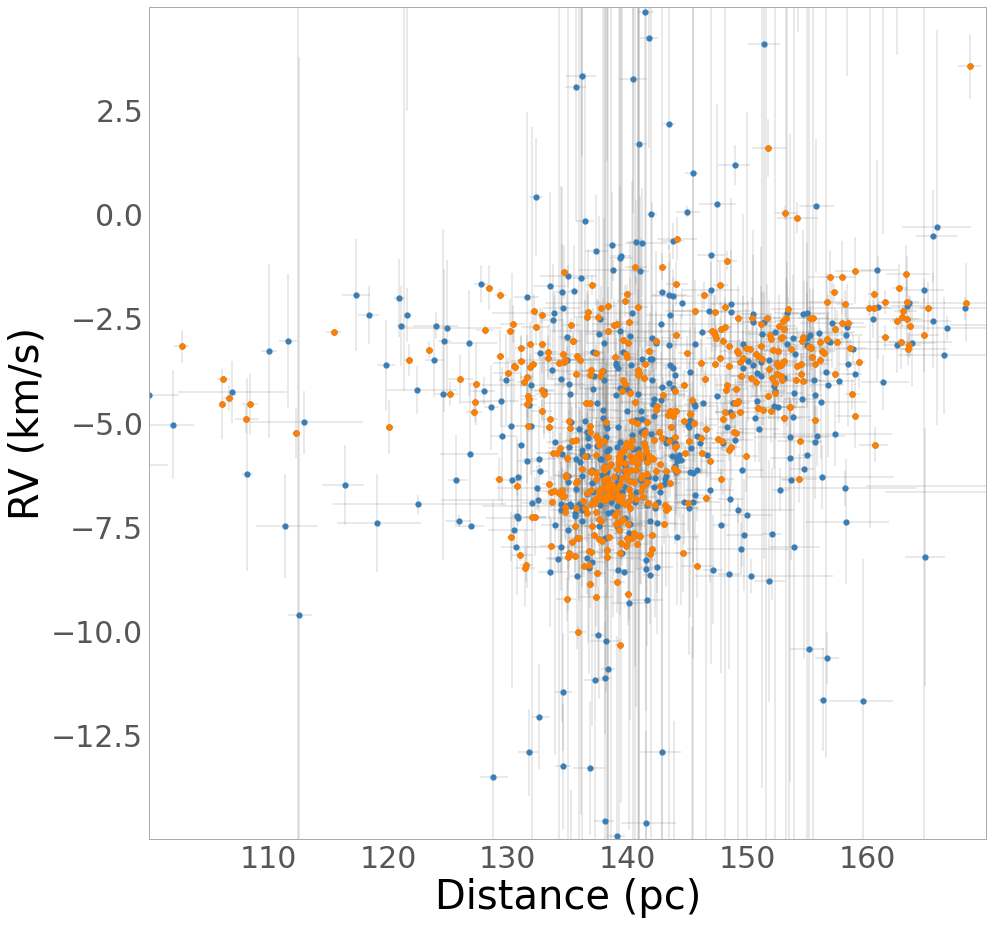
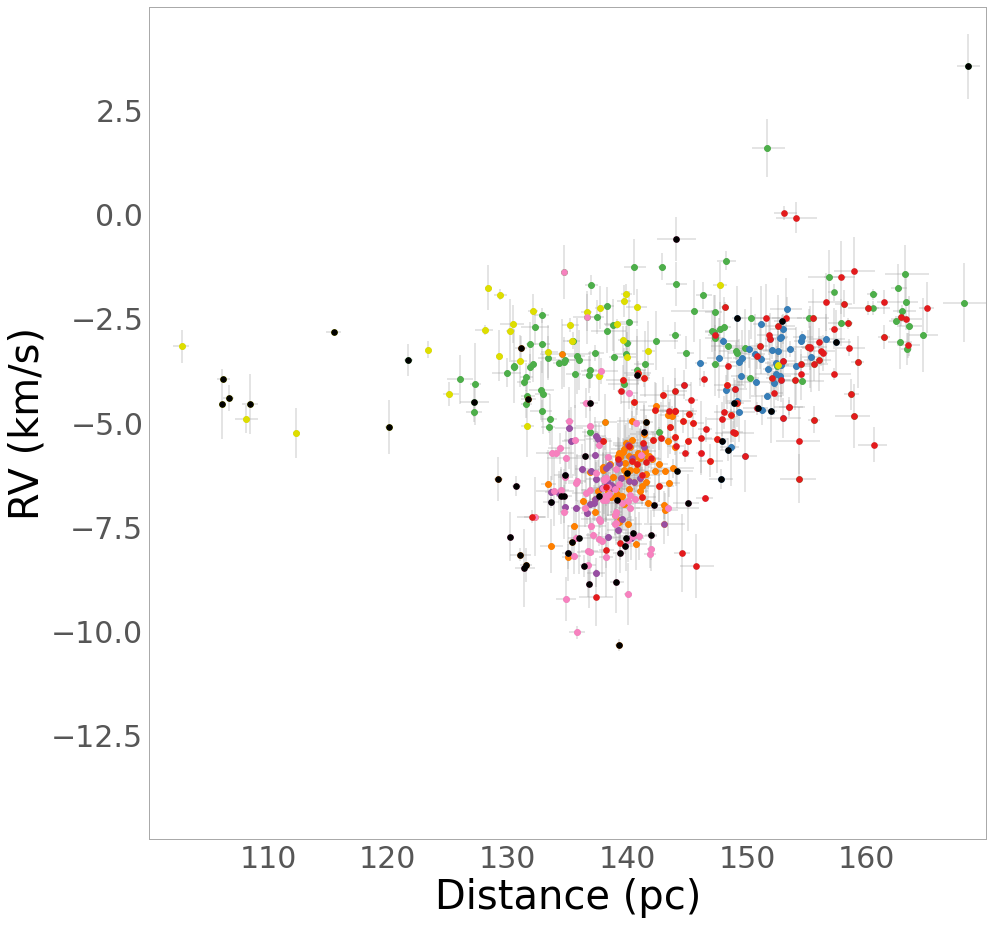
Fig. 5 shows the spatial distribution of the 1204 confirmed YSOs with their proper motion vectors colour-coded according to their relative proper motion (relative to the median of the sample). It is immediately apparent that there are multiple subgroups among the YSOs with distinct bulk proper motions, as well as a number of high proper motion YSOs seemingly unassociated with any of the major groups. The distribution of YSOs in proper motion space and line-of-sight (LOS) distance versus RV space is plotted in Fig. 6. There is also apparent spatial and velocity structure along the LOS, with the bulk of the YSO population located at pc, but also a smaller concentration at pc, as well as a sparse distribution up to pc in the foreground.
We compare our sample of confirmed YSOs to previously compiled catalogues of candidate YSOs in Upper Sco to assess their relative completeness and to highlight the advantages of different methods of YSO identification.


3.1 Cross-match with Miret-Roig et al. (2022b)
Miret-Roig et al. (2022b) used a Gaussian mixture model to separate the Upper Sco and Ophiuchus YSO candidate list of Miret-Roig et al. (2022a) into kinematically distinct subgroups. Out of our full target sample we find 1065 matches with the members of Upper Sco identified by Miret-Roig et al. (2022b) using the HDBSCAN algorithm. 228 belong to Sco, 98 belong to Sco, 199 belong to Sco, 119 belong to Sco, 85 belong to Sco, 197 belong to Oph, 139 belong to Sco. Also, 946 of these are identified as YSOs in the Gaia variability catalogue (Marton et al., 2023), and 946 have RVs in our sample.
Considering our 1204 confirmed YSOs, we find 1030 matches with the members of Upper Sco identified by Miret-Roig et al. (2022b). 224 belong to Sco, 98 belong to Sco, 198 belong to Sco, 94 belong to Sco, 84 belong to Sco, 197 belong to Oph, 135 belong to Sco. The remaining 174 YSOs were not identified as members of any subgroup by Miret-Roig et al. (2022b), and we discuss their membership in Section 4. There are also 5 subgroup members of Miret-Roig et al. (2022b) for which we have spectra of SNR, but do not meet any of our YSO criteria. The number of false-negatives in particular highlights the importance of spectroscopic youth indicators for identifying YSOs with kinematics distinct from the major subgroups.
Out of our 544 confirmed YSOs with quality 6D kinematic information we find 493 matches with the members of Upper Sco identified by Miret-Roig et al. (2022b). 111 belong to Sco, 53 belong to Sco, 110 belong to Sco, 35 belong to Sco, 43 belong to Sco, 93 belong to Oph, 48 belong to Sco. The remaining 51 YSOs were not allocated to any subgroup by Miret-Roig et al. (2022b), and we discuss their membership in Section 4.
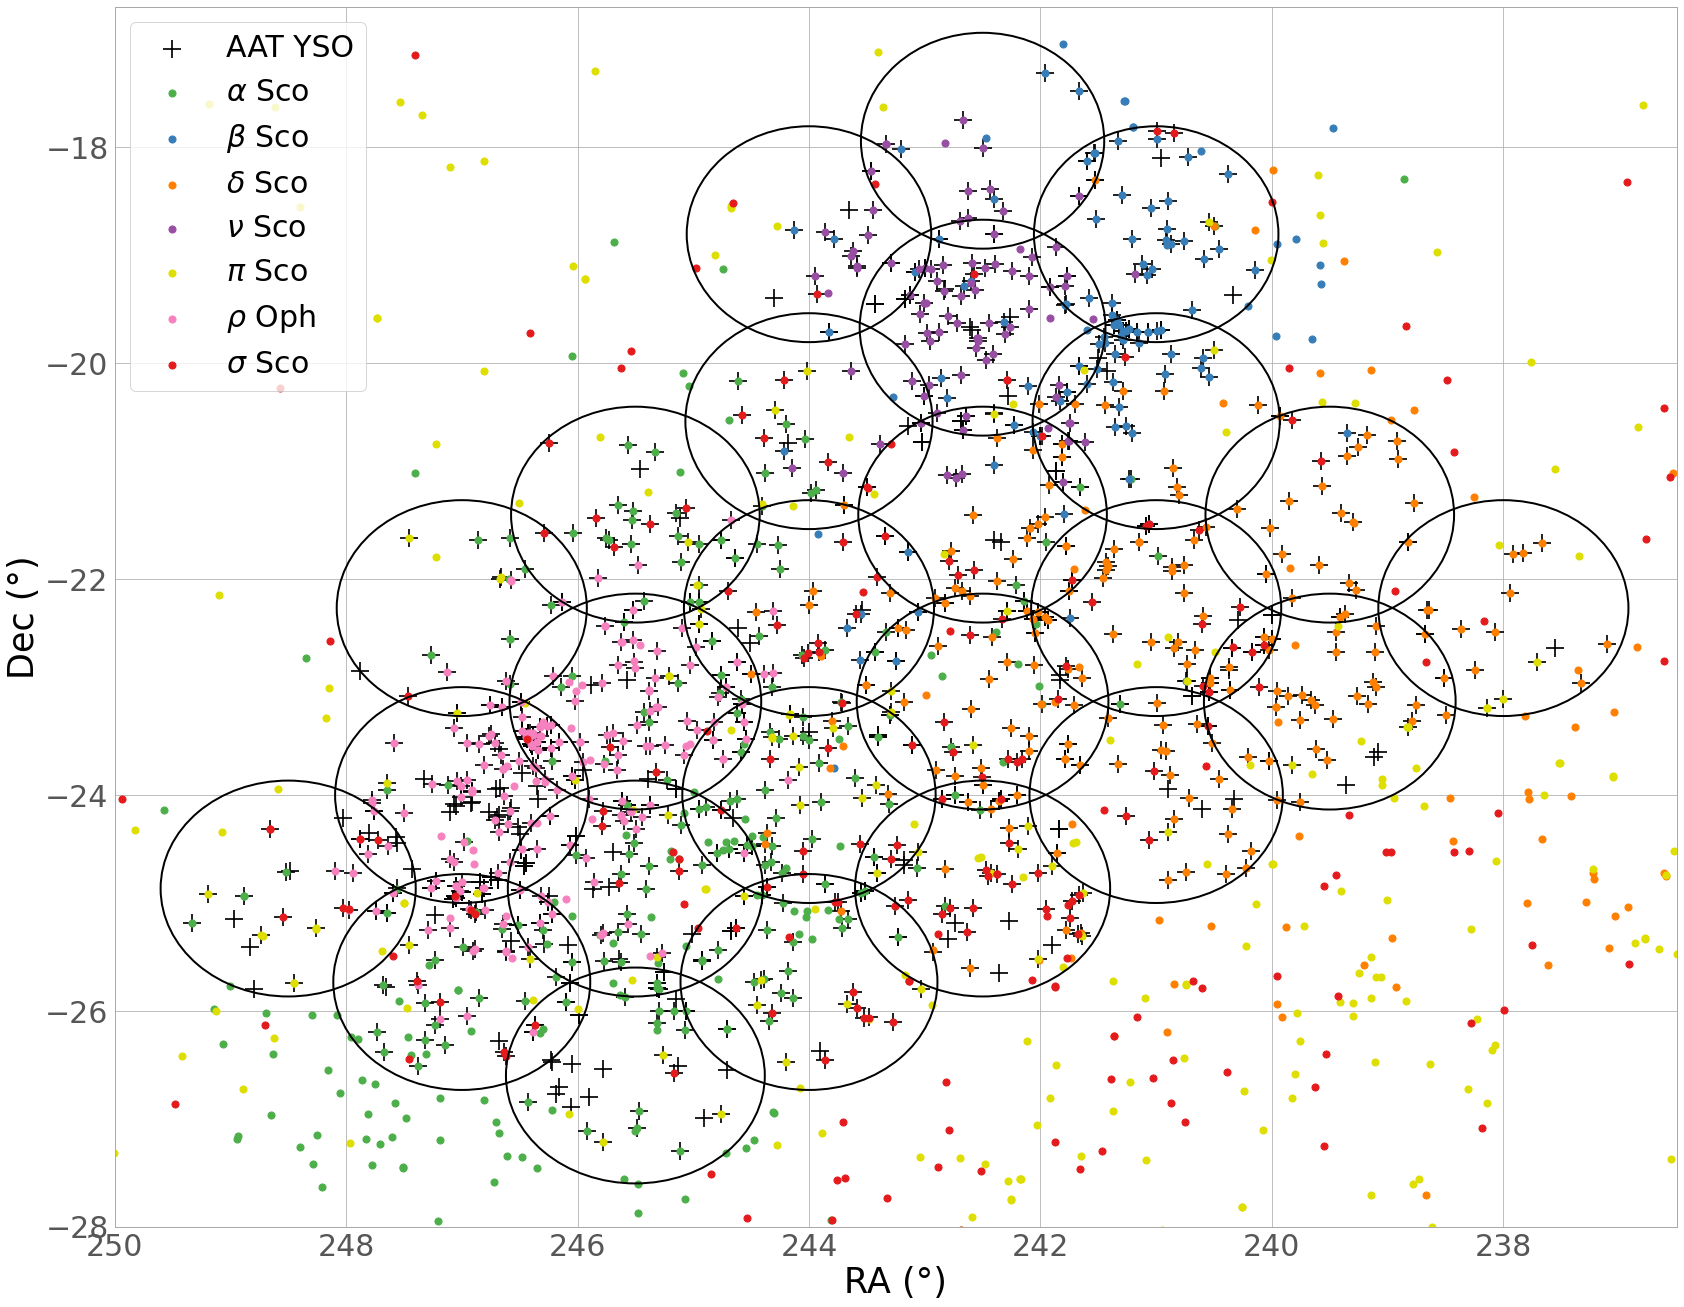
Fig. 9 shows the spatial distribution of the 1204 confirmed PMS stars indicated with plus symbols, as well as the positions of 1580 Upper Sco subgroup members of Miret-Roig et al. (2022b) within the same magnitude range as our observed sample (), colour-coded according to their subgroup membership. The AAT FOVs are indicated by the overlaid circles.
It is important to note that the FOVs coverage of each subgroup varies. , Sco and Oph are almost completely covered, while , and Sco have many members that lie outside the observed region, towards Lupus and Upper Centaurus-Lupus (UCL). Therefore, the central positions of these subgroups in our sample will differ from those given by Miret-Roig et al. (2022b), but our sample should still be sufficient to measure kinematic properties.

3.2 Cross-match with Ratzenböck et al. (2023b)
Ratzenböck et al. (2023b) selected a large sample of candidate YSOs across Sco-Cen, including Upper Sco, from the Gaia DR3 catalogue using photometric cuts and astrometric quality criteria. They then identify kinematically distinct subgroups using the SIGMA clustering algorithm (Ratzenböck et al., 2023a).
Out of our full target sample we find 1121 matches with the members of Sco-Cen (including Upper Sco) identified by Ratzenböck et al. (2023b) using the SIGMA algorithm. 217 belong to Oph, 79 belong to Sco, 276 belong to Sco, 121 belong to Sco, 165 belong to Sco, 157 belong to Antares, 54 belong to Sco, 52 belong to US-foreground. Also, 960 of these are identified as YSOs in the Gaia variability catalogue (Marton et al., 2023), and 994 have RVs in our sample.
Out of our 1204 confirmed YSOs we find 1085 matches with the members of Sco-Cen identified by Ratzenböck et al. (2023b). 216 belong to Oph, 78 belong to Sco, 272 belong to Sco, 121 belong to Sco, 161 belong to Sco, 154 belong to Antares, 52 belong to Sco, 31 belong to US-foreground. The remaining 119 YSOs were not identified as members of any subgroup by Ratzenböck et al. (2023b), likely because their kinematics are too distinct from the subgroups for the SIGMA algorithm to allocate them. There are also 7 subgroup members of Ratzenböck et al. (2023b) for which we have spectra of SNR, but do not meet any of our YSO criteria. 29 more of our targets with matches to the list of Ratzenböck et al. (2023b) we do not confirm as YSOs, but these have spectra of SNR and so their EW(Li) measurements are relatively uncertain. Again, the number of false-negatives highlights the importance of spectroscopic youth indicators for identifying YSOs independently of their kinematics.
Out of our 544 confirmed YSOs with quality 6D kinematic information we find 495 matches with the members of Sco-Cen identified by Ratzenböck et al. (2023b). 92 belong to Oph, 36 belong to Sco, 138 belong to Sco, 55 belong to Sco, 71 belong to Sco, 70 belong to Antares, 24 belong to Sco, 9 belong to US-foreground. The remaining 49 YSOs were not identified as members of any subgroup by Ratzenböck et al. (2023b).
3.3 Cross-match with Luhman (2022)
Luhman (2022) selected likely members of Sco-Cen using Gaia DR3 photometric and astrometric criteria. Out of our total observed sample we find 1009 matches with the members of Sco-Cen identified by Luhman (2022), 1007 of which match with our 1204 confirmed YSOs, and 2, for which we have spectra of SNR, do not meet any of our YSO criteria.
4 Clustering
Considering the limitations involved in target selection, and positional bias introduced by the fibre configuration for observations, we do not perform our own clustering analysis of Upper Sco with our spectroscopic sample. Rather, we adopt the subgroups identified by Miret-Roig et al. (2022b).
For the YSOs that we have identified which were not included in the subgroup membership list of Miret-Roig et al. (2022b), we allocate to the group to which its 6D kinematics are most similar. We determine which group a YSO is most similar to using the distance in 6D between the YSO and the group central Cartesian positions (X,Y,Z) and velocities (U,V,W) weighted by the inverse of the group’s standard deviation in these coordinates (Fig. 7). The total number of YSO members in each subgroup and the number of new YSOs, either with or without quality 6D kinematic information, are given in Table 2.
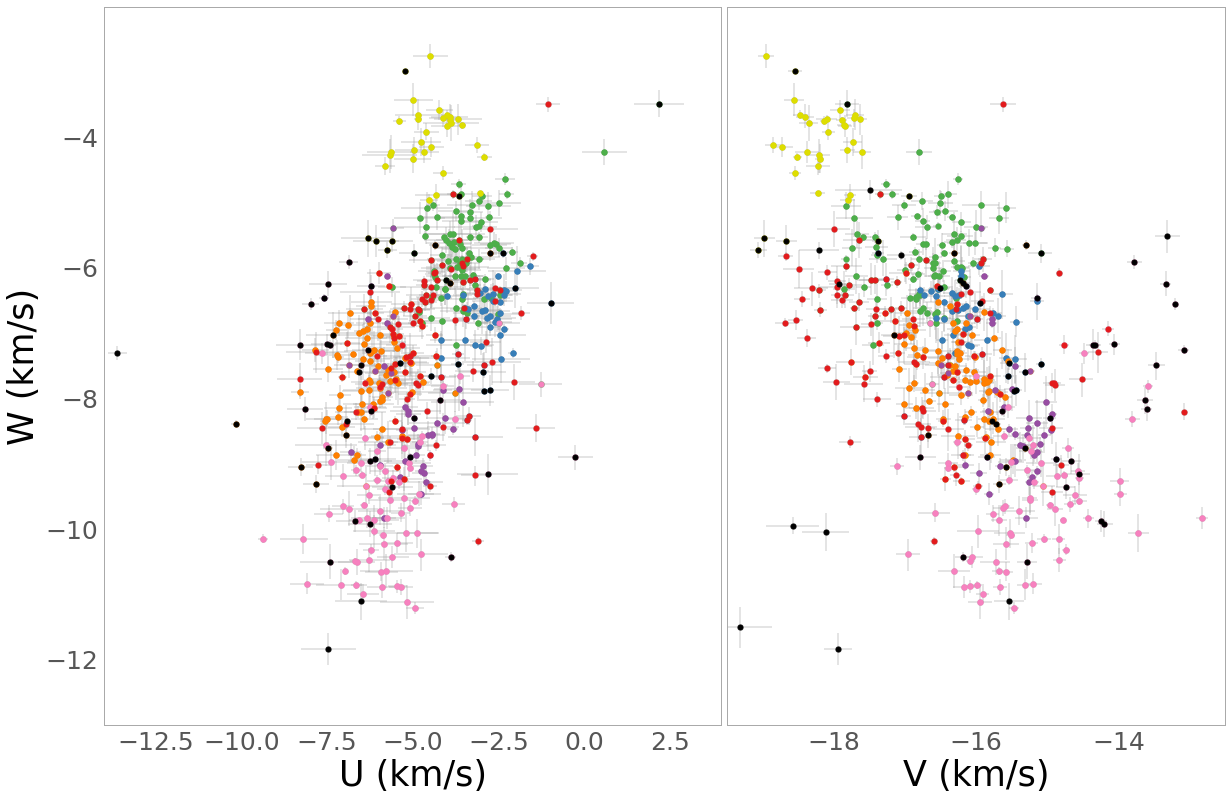
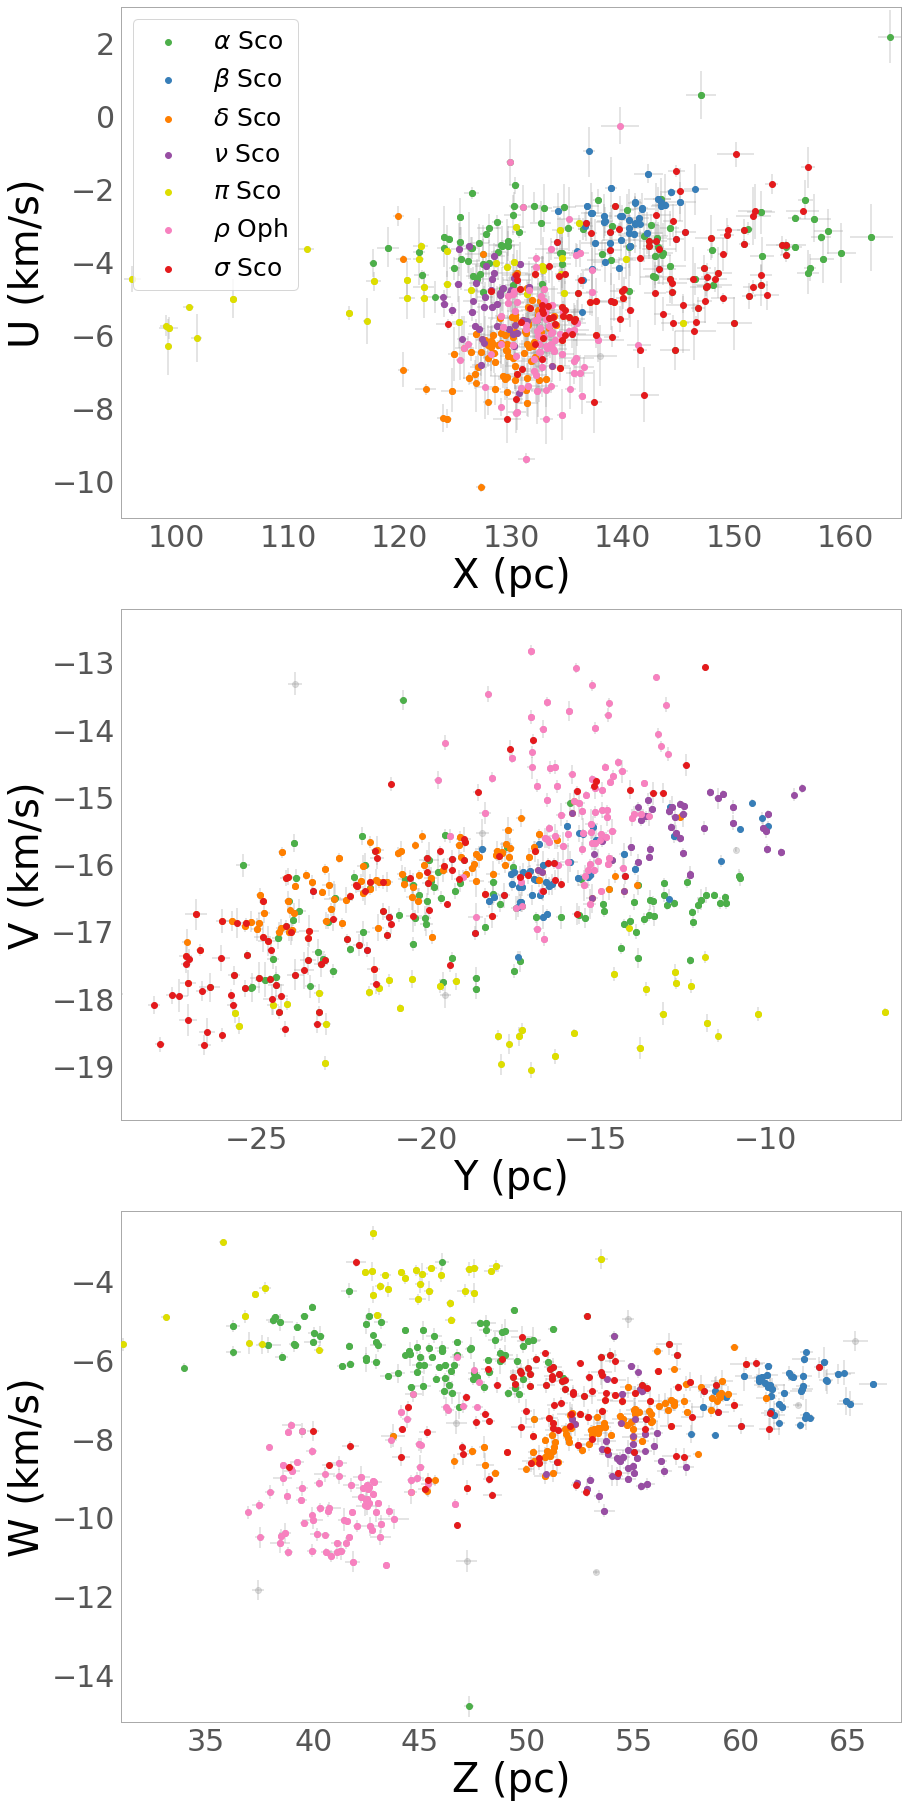
We then recalculate the new median and dispersion of each Cartesian coordinate per subgroup using the total number of YSOs with quality 6D kinematic information and present these with their associated uncertainties in Table 2. In subsequent figures members of these subgroups are plotted in green for Sco, blue for Sco, orange for Sco, purple for Sco, yellow for Sco, pink for Oph & red for Sco.
For YSOs with significantly distinct kinematics from any group, i.e., 6D weighted difference (Fig. 7), we keep separately in a group of kinematic outliers, which we investigate later to determine if any might be dynamically ejected YSOs either from Upper Sco or from another nearby young cluster. We find 84 YSOs that we categorise as kinematic outliers. In subsequent figures these are plotted in black.
We re-plot the proper motion distribution and LOS distance versus RV distribution of YSOs in Fig. 8 colour-coded according to the kinematic subgroup they have been allocated to. Most subgroups appear sparse and have significant overlap in proper motion space, but clearer separation is seen in LOS distance versus RV between Sco (green) and Sco (yellow) which extend further into the foreground and have greater RVs than Sco (orange), Sco (purple) and Sco (red).
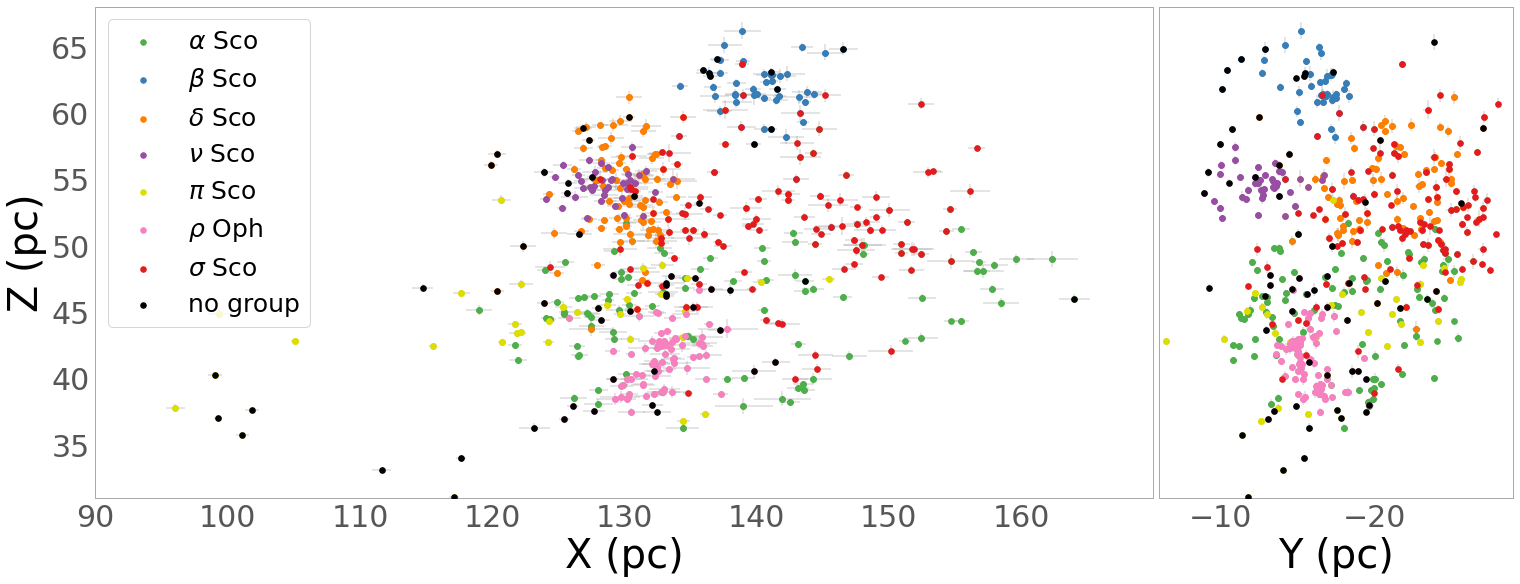
In Fig. 10 we show the Cartesian spatial (XYZ, top panel) and velocity (UVW, lower panel) structure of the 544 confirmed PMS stars with quality 6D information, colour-coded according to which subgroup they are assigned to.
Notably, all subgroups apart from Sco have their largest spatial spread () in the Cartesian direction (Fig. 10). For both Sco and Sco, is more than twice as large as the next greatest, , and is different from the spread in at the significance level. We measure the significance of anisotropy by dividing the difference between the largest spatial spread and the smallest to their combined uncertainties for each subgroup. For Sco, spatial spreads are anisotropic at the 6 level, for Sco, at the level, for Sco, at the level, for Oph, at the level and for Sco, at the level.
The Heliocentric Cartesian X coordinate is directed towards the Galactic center, so for Upper Sco this is the coordinate which contains the greatest component of observed parallax. Thus, parallax uncertainty, and uncertainty in line-of-sight distance, would likely inflate the spread of positions in this direction. However, as Upper Sco is relatively nearby (100 - 150 pc), the median uncertainty in LOS distance of our confirmed YSOs is relatively small, only pc, and thus cannot account for this spatial anisotropy. Rather, limitations in the coverage of observations, particularly the total sky area of observed fields, likely have a greater impact. In Fig. 9 we plot the sky positions of all members of Upper Sco subgroups of Miret-Roig et al. (2022b) along with circles indicating the fields of observation. There are many members of Sco, Sco and Sco in particular that were not covered in our observations, which has the effect of reducing the spatial spread in Y and Z relative to X.
Similarly, all subgroups apart from Sco have their largest velocity dispersion () in the Cartesian direction (). This could be due to the effect of unresolved binary orbits contributing to the observed RVs. We analyse this in greater detail in Section 5.1.

| Group | |||||||
|---|---|---|---|---|---|---|---|
| YSOs (new) | 280 (133) | 144 (70) | 263 (112) | 105 (48) | 117 (64) | 271 (126) | 174 (104) |
| 6D YSOs (new) | 201 (91) | 88 (35) | 184 (74) | 76 (33) | 63 (29) | 162 (69) | 111 (63) |
| median X (pc) | |||||||
| (pc) | |||||||
| median Y (pc) | |||||||
| (pc) | |||||||
| median Z (pc) | |||||||
| (pc) | |||||||
| median U (kms-1) | |||||||
| (kms-1) | |||||||
| median V (kms-1) | |||||||
| (kms-1) | |||||||
| median W (kms-1) | |||||||
| (kms-1) | |||||||
| (kms-1) | |||||||
| (%) | 59 | 69 | 83 | 59 | 64 | 72 | 73 |
| (masyr-1) | |||||||
| (kms-1) | |||||||
| (masyr-1) | |||||||
| (kms-1) | |||||||
| (kms-1) | |||||||
| (kms-1) | |||||||
| (kms-1) | |||||||
| Virial Mass () | |||||||
| Stellar Mass () | |||||||
| (Myr) | |||||||
| (Myr) | |||||||
| (pc) | |||||||
| (pc) | |||||||
| (pc) | |||||||
| (pc) |
The Sco (blue) and Sco (purple) subgroups appear to be the most spatially distinct, having little to no overlap with other subgroups in YZ space, though Sco overlaps with Sco (orange) in XZ space. However, there is much greater overlap between these subgroups and others in velocity space. There is also an apparent gap between the two subgroups, particularly noticeable in XZ space, with an approximate separation of 12 pc. Around these subgroups are distributed a number of YSOs with kinematics not closely matching any group, which may be candidate ejected stars with high velocities relative to the bulk of Upper Sco, or else may be sparse fringes of the Sco and Sco subgroups.
Oph (pink) is the most densely concentrated subgroup spatially, but then appears to be one of the sparser subgroups in velocity space. It has significant spatial overlap with Sco (green) and some with Sco (yellow), but these groups are then the most dissimilar to it in velocity space.
Sco (red) is perhaps the most sparsely distributed subgroup in both spatial and velocity spaces. Spatially the bulk of Sco is located behind Sco in the line of sight, but its fringes also overlap with , , and Sco. Only Oph does not have any members of Sco overlapping in 3D.
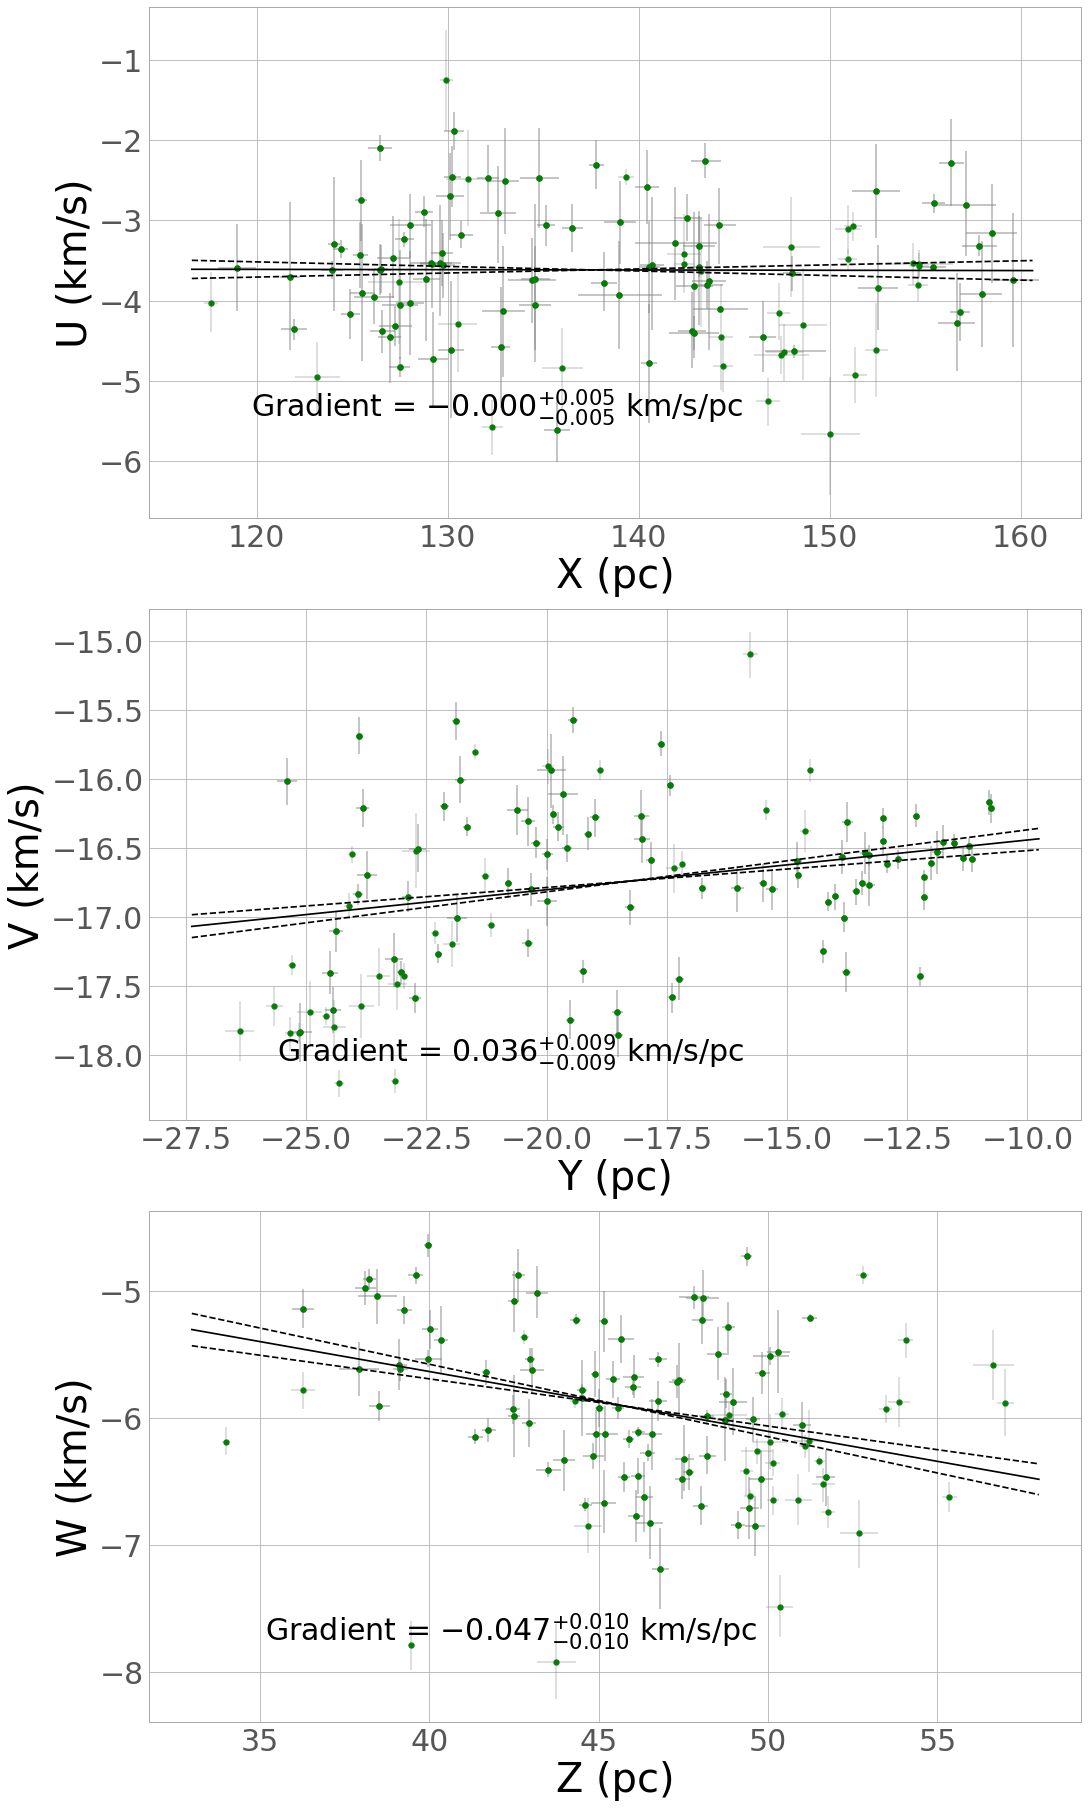
In Fig. 11 we show the Cartesian spatial - velocity coordinate pairs in each panel (X-U: top, Y-V: middle, Z-W: bottom). In X-U and Y-V there are visible positive correlations between spatial and velocity coordinates across multiple subgroups, which suggests large-scale expansion across Upper Sco. Again, Sco (yellow) is a notable exception to these trends, with its members located well outside of the multi-subgroup linear trends.
Notably, in Z-W space (Fig. 11, bottom) Oph (pink) is clearly separated from the majority of other subgroups, overlapping with only a dozen members of Sco and Sco.
5 Kinematics
In Fig. 12 we show the Cartesian spatial coordinates of confirmed YSOs with quality 6D kinematic information, colour-coded according to which subgroup they have been allocated to, with vectors indicating their Cartesian velocities (in km s-1) relative to the sample mean.
There is significant variation in the orientation of vectors for members of the sparse subgroups Sco (orange) and Sco (red), which is a result of their large scatter in velocity space (as can be seen in Fig. 10 bottom panels) as well as proximity to the sample mean velocity.
The more spatially concentrated subgroups Sco (blue), Sco (purple) and Oph (pink) tend to have less variation in the orientation of their velocity vectors, as they have less scatter in velocity space. Oph as a whole is clearly moving away from the center of Upper Sco, while and Sco appear to be moving primarily away from each other rather than from the center of Upper Sco.
It can also be seen in Fig. 12 that the majority of members of Sco (green) and Sco (yellow) have vectors directed toward the center of Upper Sco, defying the outward trend followed by the other subgroups, which is also evidenced by the lack of positive correlation in Cartesian position - velocity space as shown in Fig. 11 (particularly in Z). This indicates that Sco and Sco likely have distinct origins from the other Upper Sco subgroups.
In the following analysis we explore the kinematics of individual subgroups in greater detail.
5.1 Velocity dispersions
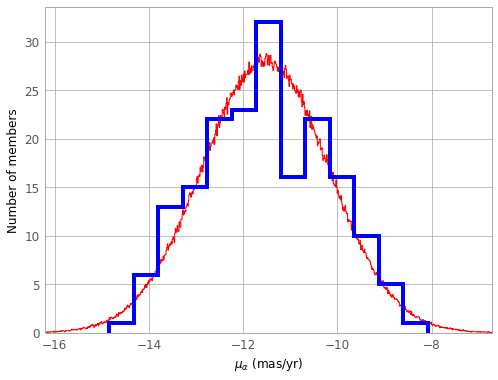
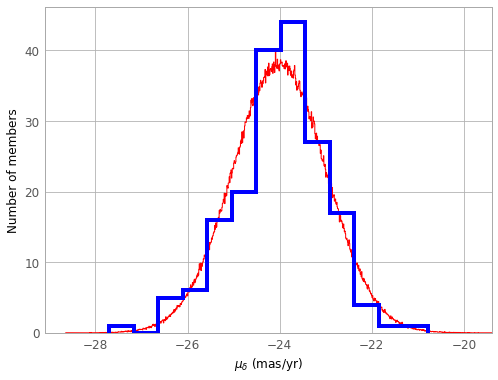
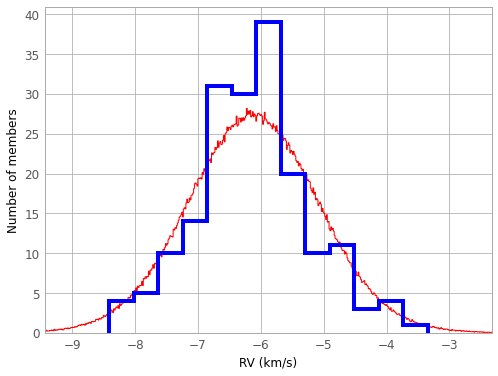
Velocity dispersions provide crucial information related to the dynamical state of star clusters and associations. We estimate the velocity dispersions for each group in our sample using a Bayesian approach similar to that described in Armstrong et al. (2022). Where we model the velocity distributions as 3-dimensional Gaussians with the central velocity () and velocity dispersion () in each proper motion and RV as free parameters. We add uncertainties randomly sampled from the observed uncertainty distribution in each dimension for each star.
As in Armstrong et al. (2022), we account for the possible inflation of our RV dispersion due to unresolved binaries by adding velocity offsets to our modeled RVs for 46% of our modeled stars, according to the expected binary fraction (Raghavan et al., 2010). We create a synthetic population of binaries with primary star masses in the range of our observed sample, taken to be 0.65 - 0.1 , following a Maschberger (2013) IMF, with secondary star masses randomly sampled with uniform probability from between 0.1 -1.0 of their primaries’ mass. We sample orbital periods from a log-normal distribution with mean period and dispersion days (Raghavan et al., 2010) and we sample eccentricities from a flat distribution between a minimum of to a maximum scaled with orbital period (Parker et al., 2009). We calculate velocities along the line of sight for each star at random points in their binary orbits at random inclinations in 3D and then weight the velocities of each star per binary by their luminosities.
We do not consider triple systems for the same reasons as given in Armstrong et al. (2022), i.e., their properties are not well constrained and that the RV contribution of third stars is likely to be negligible.
The posterior distribution function is sampled using emcee (Section 2.3) and using an unbinned maximum likelihood test. We use uniform priors of to kms-1 for central velocities and 0 to 100 kms-1 for velocity dispersions in each direction. We perform 2000 iterations with 1000 walkers and take the median, 16th and 84th percentile values as the best fit and 1 uncertainties respectively, after discarding the first 1000 iterations as burn-in.
In Table 2 we list the best fit central velocities and velocity dispersions for all the seven subgroups of Upper Sco, based on the 544 YSO members with quality filtered 6D kinematic information. Figure 13 shows the 3D velocity distributions for stars in Sco as an example, with the best-fitting velocity dispersion models overplotted in red. We measure the significance of anisotropy by dividing the difference between the largest velocity dispersion and the smallest to their combined uncertainties for each subgroup. The best fitting velocity dispersions for most subgroups are significantly anisotropic, with a confidence of for Sco, for Sco, for Sco, for Sco, for Sco, for Oph, for Sco.
OB associations are typically sparse and unbound and thus are believed to be relatively dynamically un-evolved (Wright, 2020), i.e., they retain their initial velocity substructure, which is indicated by velocity anisotropy. The evidence of anisotropy in these subgroups indicates that they have not undergone sufficient dynamical mixing to develop isotropy and thus likely did not form as compact clusters.
5.2 Virial mass
In their analysis, Posch et al. (2025) estimate the masses of groups by multiplying the total number of likely members with the peak mass () of a Kroupa et al. (2001) IMF. Following this approach we estimate total masses of subgroups by taking the number of members of each from Miret-Roig et al. (2022b), apply a scaling factor which is the ratio of total YSOs per subgroup in our sample to new YSOs (those previously unallocated to subgroups by Miret-Roig et al. 2022b) and multiply by the peak mass. We approximate the uncertainty with a Poisson error. The approximate masses of subgroups are for Sco, for Sco, for Sco, for Sco, for Sco, for Oph and for Sco (Table. 2). This then implies a total mass of for Upper Sco, which is reasonable agreement with previous estimates ( Preibisch & Mamajek, 2008).
We combine our observed velocity dispersions to obtain 3D velocity dispersions () and using these we estimate virial masses for each subgroup according to
| (1) |
where (Zwart et al., 2010), and is the smallest radius containing half of a subgroup’s member YSOs. These values are given in Table 2.
Our estimated virial masses for subgroups are all significantly larger than those estimated using the IMF, in some cases by an order of magnitude, which is evidence that these groups are gravitationally unbound. The lowest virial masses we obtain are for Sco and Sco, the youngest subgroups after Oph (Ratzenböck et al., 2023b), but even then their virial masses are twice and three times larger than their IMF-based mass estimates respectively. For subgroups with many candidate YSO members outside of the area covered by our observations (see Fig. 9), the half-mass radius is likely underestimated, and thus so is our virial mass estimate.
The Oph cluster in particular has previously been considered gravitationally bound (Rigliaco et al., 2016; Miret-Roig et al., 2022b; Wright et al., 2024) despite the large velocity dispersion among its member YSOs. In fact, our velocity dispersion in RVs for Oph is in excellent agreement with the dispersion of Rigliaco et al. (2016) of kms-1. This is due to the binding mass of gas still in the region, which has been estimated to be M⊙ (Loren, 1989), which well exceeds the virial mass we estimate.
5.3 Expansion velocity
We calculate expansion velocities (km s-1) similarly to Armstrong & Tan (2024), which are the components of velocity for each subgroup members directed away from the subgroup center in 3D. The median () and uncertainties for each subgroup are reported in Table 2. A significantly positive indicates overall expansion of the subgroup, while a significantly negative indicates overall contraction (Kuhn et al., 2019; Wright et al., 2024). We also count the number of subgroup members with positive individual expansion velocities and report the percentage per subgroup in Table 2.
For all subgroups we find that is positive, though with varying significance. Also, all subgroups have at least of their members with 6D kinematic information moving away from the subgroup center in 3D. The highest and also most significant belongs to Sco ( km s-1), which is also the subgroup with the highest proportion of its members moving away from the subgroup center (). This is a reasonable value of for a young cluster, falling near the median of values found by Kuhn et al. (2019) and Wright et al. (2024).
Interestingly the Oph cluster, which has previously been considered gravitationally bound (Rigliaco et al., 2016; Miret-Roig et al., 2022b), has both a positive of significance and of its members have positive individual , which is evidence that this group is expanding despite the binding mass of gas in the region. Wright et al. (2024) calculated an expansion velocity of km s-1 for Oph, implying contraction, though this was based on a sample of 38 member YSOs identified in the Gaia-ESO survey (Gilmore et al., 2022; Randich et al., 2022) within a diameter area centered on (RA=246.0∘, Dec=-23.8∘), whereas we have a sample of 162 YSOs with 6D kinematic information which are distributed across . This discrepancy may indicate that there is a contracting core of YSOs in the center of Oph, surrounded by an expanding halo.
However, simulations of young clusters (e.g., Sills et al., 2018; Kuhn et al., 2019) have indicated that bound clusters may still exhibit significantly positive median up to kms-1 as they rebound from the initial collapse of hierarchical cluster assembly after Myr, until reaching an equilibrium at Myr. The Oph cluster is within the age range (3-4 Myr; Ratzenböck et al., 2023b) when this rebound would be expected to happen, though it should be noted that Sills et al. (2018) simulated much more massive clusters ( M⊙) than Oph is estimated to be (), which become nearly spherical after Myr following hierarchical cluster assembly, so it is unclear to what degree these simulations might represent the dynamical evolution of a sparser, low-mass cluster like Oph.
5.4 Linear Expansion Trends
Linear expansion is a key indicator that a stellar association is unbound and in the process of dispersing into the Galactic field. The precise rates of expansion and potential anisotropy can also be useful in constraining an association’s initial configuration and dynamical history.
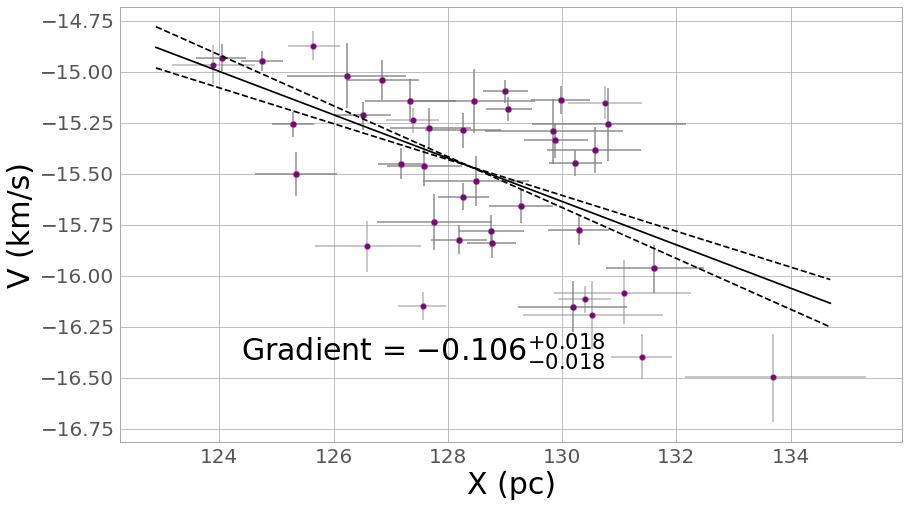
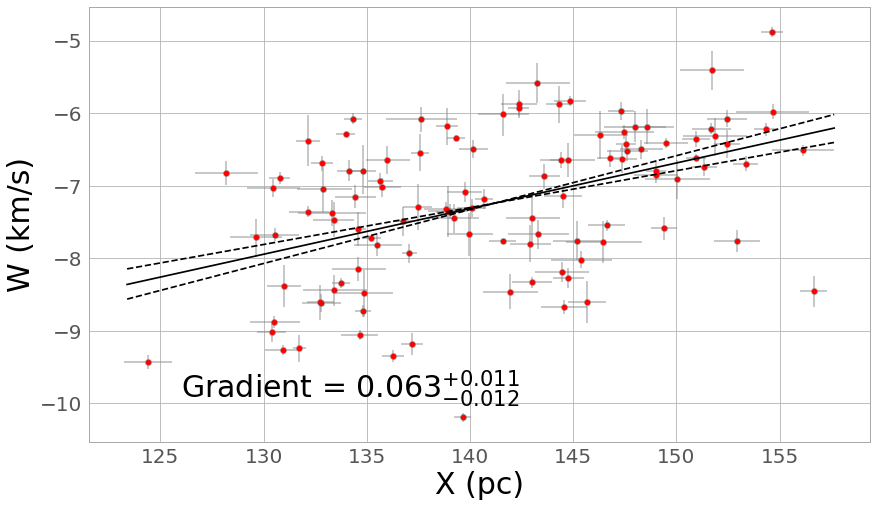
We investigate evidence for expansion among the subgroups of Upper Sco by looking for linear correlations between Cartesian velocity and position in each direction, where positive or negative correlations will indicate either expansion or contraction, respectively. The best fitting parameters for the linear correlations, the gradient, intersection and the fractional underestimation of the variance (, , ), are determined following the same approach as described in Armstrong et al. (2022), using Bayesian inference, with outliers in position and velocity removed. We also vary the positions of YSOs by randomly sampling from their uncertainties. We perform 2000 iterations with 200 walkers, half of which are discarded as burn in, and report the medians,16th and 84th percentiles from the posterior distribution as the linear best fit gradient and 1 uncertainties respectively. Our results are listed in Table 3. In Fig. 14 we plot linear expansion trends for Sco (green) and Sco (orange) as examples.
All groups show expansion trends of at least 3 significance in at least one direction and Sco, Sco & Sco show trends of at least 3 significance in all directions, but the direction of greatest expansion is not the same for all groups. Sco, Sco & Sco show the greatest rate of expansion in the direction of Galactic rotation Y, whereas Sco, Sco, Sco & Oph show the greatest rate of expansion in the direction perpendicular to the Galactic plane Z.
It is worth noting that the weak expansion trends in X may be due in part to the fact that this direction coincides most closely to the line-of-sight from the Sun, thus the errors on the X coordinate contain the largest component of parallax error, and the U velocity the largest component of RV error, including unresolved binarity, which remain the greatest sources of uncertainty in our 6D kinematic information.
In Sco, Sco & Sco the rates of expansion are significantly anisotropic (at least 4). This anisotropy may indicate a level of kinematic substructure in these groups that has survived dynamical mixing. Despite the relatively old ages of these groups (Ratzenböck et al., 2023b, Myr;), they were likely formed too sparse to undergo significant mixing and will retain most of their substructure as they expand until they eventually disperse into the field, similar to what has been concluded for other nearby associations such as Vela OB2 (Wright, 2020; Armstrong et al., 2022).
Sco is the only subgroup to show evidence for contraction, at a rate of km s-1 pc-1 in Z, the direction perpendicular to the Galactic plane.
We also fit linear gradients to the entire YSO sample, which are plotted in Fig. 18. We find significantly positive () linear expansion rates in all directions, of km s-1 in X versus U, km s-1 in Y versus V and km s-1 in Z versus W. This provides strong evidence that Upper Sco as a whole is unbound and expanding, with clear anisotropy ( difference in expansion rates between X and Y). However, the expansion rates of the whole Upper Sco sample are distinct from any of the internal rates for subgroups given in Table. 3, which may indicate that the region-wide expansion trends are dominated by inter-subgroup kinematics rather than internal kinematics.
5.5 Expansion Timescales
We also derive expansion timescales in Myr by inverting the greatest expansion rates of each subgroup, and list these results in Table 3. Sco, Sco, Sco, Oph & Sco all yield expansion timescales Myr, while Sco & Sco yield timescales of Myr and Myr, respectively, which are much larger than previous age estimates for these groups. On the other hand, the expansion timescale of Myr for Sco agrees reasonably well with the kinematic ages of 4-6 Myr given in Miret-Roig et al. (2022b).
The expansion timescales of Myr, Myr, Myr & Myr for Sco, Sco, Oph & Sco, respectively, are all significantly greater than the kinematic ages of 1-4 Myr, Myr, Myr and 1-3 Myr given in Miret-Roig et al. (2022b) for these groups. In particular, Miret-Roig et al. (2022b) found no evidence that Oph had been more compact in the past, and so estimated kinematic ages consistent with . However, since timescales derived from expansion trends implicitly assume that the group of stars has been expanding from a point, they should be interpreted as upper limits. Therefore, there is no particular inconsistency between our expansion timescales and these literature kinematic ages.
However, considering expansion timescales as upper limit kinematic ages, it is then notable that both Sco and Sco in particular have expansion timescales significantly lower than their isochronal age estimates, Myr and Myr from Ratzenböck et al. (2023b), respectively. Such a difference between kinematic and isochronal ages has been hypothesised by Miret-Roig et al. (2024) to indicate a period in the early evolution of a cluster or association subgroup where the bulk of member YSOs remain gravitationally bound and possibly still embedded in their natal molecular cloud. The lower kinematic age then indicates when the subgroup becomes unbound and its members begin to disperse, possibly following residual gas expulsion. In the case of Sco and Sco, our expansion timescales would imply embedded phases of Myr, similar to the findings of Miret-Roig et al. (2024). However, the length of such a phase is highly uncertain as it depends on uncertainties in both kinematic and isochronal age methods. We discuss this further in Sect. 6.
5.6 Rotation
We also investigate evidence for rotation in the subgroups of Upper Sco by fitting linear gradients to combinations of velocity and position in different directions. Note that since these subgroups are gravitationally unbound these gradients may not indicate true rotation, but rather residual angular momentum. Our results are listed in Table 4. In Fig. 15 we plot linear rotation trends for Sco (purple) in X versus V and Sco (red) in X versus W as examples.
Rotation in young clusters has been hypothesised to arise from the merging of subclusters in the assembly phase of hierarchical cluster formation, the signature of which may even be stronger than that of cluster expansion in this scenario (e.g., Mapelli, 2017). It is therefore a potential way of discriminating between hierarchical and monolithic cluster formation scenarios.
In the case of rotation found in substructures within an extended population such as an OB association, it may be inherited from the turbulent motion of the natal gas from which the substructure forms.
Significant () trends are found in at least one position - velocity pair in every subgroup. The subgroups with the greatest spatial extent (, and Sco) exhibit significant rotation trends in multiple directions, though, apart from a rotation rate of km s-1pc-1 in W versus Y for Sco, the rotation rates are relatively low in all directions in comparison to the expansion rates. These are among the older subgroups and so have had more time for expansion to suppress their rotation rates.
Meanwhile, Oph, which is the densest and possibly youngest subgroup, exhibits the greatest rotation rates of kms-1pc-1 in U versus Z and of kms-1pc-1 in U versus Y. This is expected given that Oph is still in a compact configuration and dynamically young, supporting the evidence from the asymmetry of its expansion trends (Sect. 5.4). That being said, these rates are still not significantly greater than the expansion rate in W versus Z, so there is not significant evidence for a hierarchical formation scenario for Oph.
5.7 Traceback
With precise kinematic information we can calculate the positions of stars in the past, and thus estimate when a cluster or association began expanding from its most initially compact configuration. This differs from a linear expansion age (Section 5.5) which, in effect, traces stars back to a point, and instead traces stars to an initial non-negligible volume.
We calculate 3D positions as a function of time following the same approach as Armstrong et al. (2022), using the epicycle approximation and the orbital equations from Fuchs et al. (2006), with the Oort and constants from Feast & Whitelock (1997), the local disc density from Holmberg & Flynn (2004), the local standard of rest velocity from Schönrich et al. (2010) and a solar Z distance above the Galactic plane of 17 pc (Karim & Mamajek, 2017). 3D positions are calculated up to 10 Myrs in the past in 0.1 Myr steps. At each step we calculate the spatial coherence of the association using both the total length of the minimum spanning tree (MST) between YSO members of a subgroup (Squicciarini et al., 2021), which we denote as , and the sum of 3D distances between YSOs and the median position of the subgroup (Quintana & Wright, 2022), which we denote as . We estimate uncertainties on these using a Monte Carlo process with 1000 iterations, taking the 84th and 16th percentiles of the posterior distribution as the 1 uncertainties. We plot the resulting metrics as functions of traceback time in Fig. 16 with different filters on the cluster members included, all members in red, 3 velocity outliers removed in green, 2 velocity outliers removed in blue, and the 32% longest branches removed in black (Fig. 16 left). We also give the traceback times at which these metrics are minimised, with uncertainties, in Table 2.
For and , negative values indicate that a subgroup would have been at its most compact in the past, while positive values indicate that a subgroup will be more compact in the future. Both Sco and Sco, which exhibited evidence for contraction in Table 3, have positive and values, and are thus likely to become more compact in the future, while the other groups are likely to have been more compact in the past.
and estimates for each of Sco, Sco, Oph & Sco of & Myr, & Myr, & Myr, & Myr, respectively, are consistent between size metrics. However, the and estimates for Sco of & Myr are significantly different, as are estimates for Sco of & Myr. This possibly indicates a certain amount of substructure remaining within these subgroups, making these different size metric inconsistent. Notably, these two subgroups are not recovered by the SIGMA algorithm (Ratzenböck et al., 2023b) in the same forms as by Miret-Roig et al. (2022b) with HDBSCAN, but their members are redistributed primarily among the Antares, Sco and US-foreground populations.
Miret-Roig et al. (2022b) estimated dynamical traceback ages for these groups using a similar approach to ours, but used the determinant and trace of a covariance matrix consisting of radial, azimuthal and vertical sizes as the metrics minimised to determine the most compact configuration of groups in the past. According to the trace of the covariance matrix the subgroups have dynamical ages of, Myr ( Sco), Myr ( Sco), Myr ( Sco), Myr ( Sco), Myr ( Sco), Myr ( Oph) and Myr ( Sco). While our dynamical age estimates and agree well with those of Miret-Roig et al. (2022b) for Sco and within uncertainties for Sco, they are notably different for the majority of subgroups. For Sco, Sco, Sco and Sco we obtain younger dynamical ages than Miret-Roig et al. (2022b) according to both of our size metrics, while for Oph we find larger dynamical ages according to both metrics.
The most likely causes of this difference in dynamical ages are the difference in samples of subgroup members and RVs available to enable dynamical traceback in 3D. The fact that we obtain younger dynamical ages for the majority of subgroups indicates that they may have become gravitationally unbound more recently than previously suggested.
5.7.1 Initial size
We also estimate the initial size of each subgroup via several metrics. We calculate half-mass radii and the radii containing of subgroup members at the times when they were most compact, and , according to the dynamical ages and . These radii are given in Table 2. It should be noted that since and Sco have positive dynamical ages, we don’t expect their initial configurations to be significantly more compact than the present day distributions.
Cometary or pillar shaped cloud structures within which protostars are thought to form from triggering via feedback, such as the “Pillars of Creation” in the Eagle Nebula, have been observed to have typical diameters pc (e.g., Miao et al., 2006). If the subgroups of Upper Sco had formed in such structures, as has been proposed in the “cluster-chain” triggered formation scenario (Posch et al., 2025), we would expect their initial sizes to be similar. However, we find that even the subgroups which become most compact at their initial configurations have half-mass radii pc and radii pc, an order of magnitude larger than such pillar structures.
However, this estimate of initial size will be inflated by scatter due to observational uncertainties in parallax, proper motions and RVs which are propagated through the traceback calculation. We estimate the inflation of the radii and due to uncertainties by performing numerical simulations, where we create a synthetic population of stars equal to the number of confirmed YSOs with 6D kinematics per subgroup in our data, and place them at the origin of a 3D Cartesian space. We then add perturbations in 3D positions and velocities randomly sampled from the observed position and velocity uncertainties to the synthetic population of stars and calculate their radial distances from the origin at time , equal to the larger of the dynamical traceback ages or for a given subgroup. We then calculate the radii and of the synthetic populations at time . We perform 10 000 iterations of this simulation for each subgroup and take the median of the posterior distributions of and as the predicted inflation of initial size estimates, and the 16th and 84th percentiles values as the uncertainties.
For the subgroups hypothesised to belong to the “cluster-chains” described by (Posch et al., 2025) which we infer to have been more compact in the past via our traceback calculations ( Sco, Sco, Oph and Sco), we estimate that for Sco is inflated by pc, for Sco is inflated by pc, for Sco is inflated by pc, for Sco is inflated by pc, for Oph is inflated by pc, for Oph is inflated by pc, for Sco is inflated by pc and for Sco is inflated by pc.
In each of these cases, the estimated initial sizes of these subgroups can not be accounted for by scatter due to observational uncertainties alone. Subtracting the estimates of inflation from the estimated radii for these subgroups still results in pc and pc.
We acknowledge the caveat that we are not accounting for unresolved binaries in our sample when making these estimates, which we would expect to contribute to scatter in the RVs especially. With further information about binarity among YSOs, more complete coverage of the region with spectroscopic observations for RVs and youth identification, and with greater precision of parallaxes and proper motions with the upcoming Gaia DR4, improved estimates of the initial size of subgroups in Upper Sco could provide strong constraints on the likely star formation scenario of the region.
| Velocity - Position pair | Gradient () | Sig. | Timescale (Myr) | Aniso. | |
|---|---|---|---|---|---|
| - | |||||
| 4 | 6 | ||||
| 4 | |||||
| 3 | |||||
| 6 | 1 | ||||
| 4 | |||||
| 5 | |||||
| 12 | |||||
| 16 | 4 | ||||
| 1 | |||||
| 3 | |||||
| 1 | 1 | ||||
| 3 | |||||
| - | |||||
| 3 | 2 | ||||
| 1 | |||||
| - | |||||
| 4 | 2 | ||||
| 5 | |||||
| 12 | 5 | ||||
| 3 |

| Group | Velocity | Position | Gradient (km/s/pc) | Signif. |
|---|---|---|---|---|
| 5 | ||||
| 4 | ||||
| - | ||||
| 3 | ||||
| 2 | ||||
| 5 | ||||
| 4 | ||||
| - | ||||
| - | ||||
| 1 | ||||
| - | ||||
| - | ||||
| 3 | ||||
| - | ||||
| 2 | ||||
| 2 | ||||
| - | ||||
| 4 | ||||
| 5 | ||||
| - | ||||
| - | ||||
| - | ||||
| 1 | ||||
| - | ||||
| 1 | ||||
| 2 | ||||
| - | ||||
| 3 | ||||
| - | ||||
| - | ||||
| - | ||||
| 2 | ||||
| 2 | ||||
| - | ||||
| 3 | ||||
| 1 | ||||
| 4 | ||||
| 5 | ||||
| 1 | ||||
| 5 | ||||
| 1 | ||||
| 1 |

6 Discussion
6.1 Association membership
The confirmation of 1204 YSOs in the Upper Scorpius region, 118 that were not included in the clustering of Miret-Roig et al. (2022b), and 62 YSOs not included in Ratzenböck et al. (2023b), underlines the importance of spectroscopic indicators for accurate identification of members of young associations with complex kinematics.
There are also 35 members of the Miret-Roig et al. (2022b) clusters in our sample that we cannot confirm as YSOs via either spectroscopic indicators or Gaia variability. Five of these have AAT-HERMES spectra of , and so are unlikely to be YSOs, while the others have and so may not be confirmed due to large uncertainties in measured EW(Li).
6.2 The likely star formation scenario of the Upper Scorpius association
Figure 17 presents a summary of the spatial distribution and kinematics that we have derived for the sub-groups of the Upper Sco OB association. Previous studies of this region have found evidence of an age gradient among the different subgroups present (Squicciarini et al., 2021; Ratzenböck et al., 2023b), and thus infer scenarios of sequential star formation in this region. In particular, Posch et al. (2023) and Posch et al. (2025) recently proposed a star formation scenario in which feedback from massive stars in the oldest subgroups compresses molecular gas in an adjacent region, initiating a new generation of star formation while simultaneously pushing the star-forming gas away, similar to the triggered formation scenario of Elmegreen & Lada (1976). They invoke this scenario as an explanation for both the age gradient found in Upper Sco, with the older groups Sco and Sco being centrally located and younger groups such as Sco being located toward the periphery of Upper Sco, as well as the apparent outward acceleration of the younger groups relative to the older groups. In this “cluster-chain” scenario, Sco and Sco are proposed to have triggered star formation in Sco, which subsequently triggered the formation of Sco.


Our dynamical ages are generally younger than, and have a smaller range than, those of Miret-Roig et al. (2022b), which does not necessarily indicate that the groups are younger, but rather that they began expanding (i.e., became free of gas or unbound) more recently than previously suggested (Miret-Roig et al., 2024).
In the case that residual gas expulsion is the mechanism by which these groups became unbound and initiated expansion, one would assume that feedback should expel gas within the cluster (and thus cause unbinding of the subgroup) before triggering star formation at a more distant region of the molecular cloud. Then, the smaller differences between dynamical ages of these groups also indicates shorter intervals between subgroup formation for the triggering via feedback to occur.
In fact, such a scenario requires that the unbinding of the first cluster () precedes the formation of the second in the sequence (). Thus, assuming that an accurate isochronal cluster age () indicates the formation time of a cluster and a dynamical age () indicates the time of unbinding, sequential cluster formation requires that
| (2) |
In the case of the proposed cluster chain Sco Sco Sco (Posch et al., 2025), isochronal ages are estimated to be Myr, Myr and Myr respectively (Ratzenböck et al., 2023b, according to PARSEC models with BP-RP colour), but have dynamical ages of Myr, Myr and Myr respectively by our estimation of , and dynamical ages of Myr, Myr and Myr respectively according to Miret-Roig et al. (2024). Notably, the oldest dynamical age of a cluster in this chain ( Sco) is less than the lowest isochronal age ( Sco), indicating that no cluster in this proposed chain had expelled its surrounding gas and become unbound until star formation had already begun in all the other clusters. This brings into doubt a scenario where the star formation of the younger groups was triggered by feedback from the previous group in a chain.
A possible alternative explanation that preserves the sequential cluster-chain hypothesis is that the clusters do not become unbound immediately after gas expulsion and before triggering the formation of the next cluster in the sequence, but several Myr later via a different mechanism, perhaps from gradual mass loss as unbound stars escape or from tidal forces exerted by nearby molecular clouds. Thus would no longer be required. However, in this case the dynamical age does not indicate when a cluster became gas free, and so the difference between isochronal ages and dynamical ages does not give us the timescale of an “embedded phase” as suggested by Miret-Roig et al. (2024).
This seems unlikely, though, given that natal molecular gas makes up a significant proportion of an embedded cluster’s binding mass, and so the infant mortality rate of clusters having undergone residual gas expulsion is expected to be at least 50% (e.g., Goodwin & Bastian, 2006). (Wright et al., 2024) found that the clusters they studied were all gravitationally unbound when considering the stellar mass only, but were nearly all gravitationally bound when considering the gas and stellar mass. This is very strong evidence for residual gas expulsion being responsible for unbinding a cluster. Our traceback analysis of the subgroups of Upper Sco indicates that they were likely initially too sparse, as well as too low-mass, to survive gas expulsion. Thus we consider that the dynamical age likely does indicate when gas expulsion occurred for each subgroup.
The anisotropy of velocity dispersions (Table 2) and expansion rates (Table 3), as well as the low fractions of subgroup members consistent with moving away from their subgroup center in 3D (Table 2), indicate that subgroups did not expand uniformly from initially compact configurations, but rather formed with significant kinematic substructure. The initial size estimates we make for subgroups (Section 5.7.1) as well as the short dynamical ages relative to linear expansion rates ( and Myr respectively for Sco, and Myr respectively for Sco) also imply initially sparse distributions in large volumes, which may be incompatible with subgroup formation as “clusters” embedded within “pillars” of gas (Posch et al., 2025). This is closer to the picture of “low density” star formation advocated for OB associations such as Cygnus OB2 by e.g., Wright et al. (2014).
Large initial volumes for subgroups also suggests a star-formation scenario where the triggering mechanism, such as via a cloud-cloud collision (e.g., Tan, 2000; Wu et al., 2017) or via stellar feedback (e.g., Farias et al., 2024), impacts a large surface area of molecular cloud at a similar time, producing a sparse distribution of coeval young stars. This implies a greater distance between the feedback-driving source and the impacted region of molecular cloud.
Together, these results better support scenarios in which star formation in Upper Sco is either initiated spontaneously via development of instabilities in a GMC or else via large-scale external triggering, such as via a GMC-GMC collision or from external stellar feedback, or some combination of these modes.
For the GMC-GMC collision scenario, the range in ages of the subgroups would be expected to be similar to the GMC crossing time at the collision speed, i.e., Myr. Such a scenario could lead to a coherent large-scale gradient in ages, i.e., as different parts of the cloud are engulfed in the collision. It could also lead to disturbed (unbound) kinematics of individual sub-groups.
For the external stellar feedback scenario, triggering may be from sources in the adjacent Upper Centaurus-Lupus (UCL) region, such as multiple likely past supernovae (see Krause et al., 2018). However, the formation of distinct subgroups within Upper Sco at different times due to this feedback impacting different regions of molecular gas at different times and with differing intensity, initiating star formation later in regions further from the feedback driving sources (e.g., Sco and Oph), rather than star formation being triggered by feedback from previous generations in sequence within Upper Sco itself.
This scenario is similar to that recently proposed by Kerr et al. (2025) to explain the observed kinematic and age structure they identified in the Circinus star forming complex. In particular, they make comparison of their observations to the outputs of fiducial STARFORGE simulations (Grudić et al., 2021; Guszejnov et al., 2022), which have previously been shown to produce unbound and expanding populations similar to observed OB associations (Farias et al., 2024), and find that the scenario of ’inside-out’ sequential star formation driven by feedback from a central cluster can produce the structures and age gradient found in Circinus and also in Vel & Vela OB2 (Pang et al., 2021; Armstrong et al., 2022).
However, the difference between Circinus, Vela OB2 and Upper Sco is the lack of a central dense cluster within Upper Sco which would have driven feedback across the region, as ASCC 79 and Vel are hypothesised to have done in Circinus and Vela OB2 respectively. Rather, the trends seen in these regions align better when considering Upper Sco as a part of Sco-Cen, with the central feedback-driving cluster being UCL.
In future work based on this survey data we will investigate the origins of the 84 YSOs with kinematics distinct from any major subgroup, particularly as candidate runaway stars. We will compare a variety of kinematic age estimates for subgroups to ages derived from fitting stellar evolution models as well as Li-depletion models. We will also calculate mass accretion rates for YSOs and investigate trends between accretion, stellar mass and age.
7 Summary
-
•
We have carried out spectroscopic observations of targets selected from the Gaia DR3 source catalogue within 25 2∘-diameter fields across the young nearby Upper Scorpius association using the 2dF/HERMES spectrograph at the AAT.
-
•
We reduce and analyse the spectra in order to derive radial velocities and youth indicators such as EW(Li)s, which we obtain for 6727 and 6937 unique sources, respectively.
-
•
We identify YSOs on the basis of EW(Li)s, H emission and optical variability flagged in Gaia DR3. We identify 1204 confirmed YSOs.
-
•
We filter our YSO sample on Gaia astrometric quality criteria, leaving us with a sample of 544 confirmed YSOs with full reliable 6D kinematic information.
- •
-
•
We derive 3D heliocentric Cartesian positions and velocities for our confirmed YSOs from observed astrometry.
-
•
We allocate our confirmed YSOs into the 7 kinematically distinct subgroups of Upper Sco as defined by Miret-Roig et al. (2022b), but we are also left with 84 YSOs whose kinematics are distinct from any of these groups by which we consider separately as candidate ejected stars.
-
•
We estimate 3D velocity dispersions for each kinematic subgroup using a Bayesian approach with randomly sampled RV offsets from a simulated binary population. We find that velocity dispersions for most subgroups are significantly () anisotropic, indicating that the subgroups retain much of their initial kinematic substructure and have not yet undergone sufficient dynamical mixing to develop isotropy. This is a commonly observed feature of OB associations and their subgroups (Wright, 2020).
-
•
We then use the 3D velocity dispersions to estimate virial masses for the subgroups and compare them to masses estimated by extrapolation from a Kroupa et al. (2001) IMF. Virial mass estimates for all subgroups are significantly larger than those estimated by IMF extrapolation, in some cases by an order of magnitude, indicating that the subgroups are gravitationally unbound, as expected for OB associations.
-
•
We calculate expansion velocities vout and find that they are positive above uncertainties for all subgroups with varying levels of significance. In particular, the Oph subgroup, often considered to be a bound young cluster, has a positive vout of significance and 72% of its members moving outward from the central position. This is in contrast to the recent observation that Rho Oph is contracting (Wright et al., 2024).
-
•
We find evidence for expansion ( positive gradients) in at least one direction in all 7 groups, and evidence for contraction in Sco and Sco. Sco, Sco & Sco exhibit significant expansion trends in all directions, while the trends of Sco, Sco & Sco are significantly () anisotropic. For Sco, Sco & Sco the greatest rate of expansion is in the direction of Galactic rotation , while for Sco, Sco, Sco & Oph the greatest rate of expansion is in the direction perpendicular to the Galactic plane .
-
•
From the linear expansion gradients we also derive expansion timescales for each group, of , , , , , & Myr respectively. For Sco, Sco, Oph & Sco these are comparable with literature age estimates.
-
•
By fitting linear gradients to perpendicular position and velocity pairs we can also detect rotation trends. We find evidence () of rotation in all 7 subgroups of Upper Sco.
-
•
We use an epicycle approximation and orbital equations to estimate the positions of YSOs up to 10 Myr in the past and thus trace the past evolution of the Upper Sco subgroups. We also use MST total length (; Squicciarini et al., 2021) and summed 3D distance (; Quintana & Wright, 2022) metrics to estimate when subgroups would have been at their most compact configurations in the past, assumed to be approximately their initial configurations. Sco and Sco, which previously showed evidence for contraction, are found to be approaching their most compact configurations in the near future. For the other subgroups which are expanding overall, we derive non-zero kinematic ages of , , , and Myr respectively. Except for Oph, these are consistently significantly younger than the expansion timescales derived by Miret-Roig et al. (2022b).
-
•
We estimate the sizes of subgroups at the past times when they would have been in their most compact configurations. We find that all subgroups would likely have had initial radii pc, which seems inconsistent with formation in ’cometary-shape’ or ’pillars’ of molecular gas of typical diameter pc and is more consistent with the extended, low-density view of OB association formation advocated by Wright et al. (2014) for Cygnus OB2.
-
•
We compare the results of our kinematic analyses with those in recent literature as well as literature ages for the subgroups estimated by fitting PMS isochrones. We find that our dynamical ages estimates for the subgroups, as well as those from recent literature, are significantly younger than isochronal age estimates, which is problematic for the “cluster-chain” sequential formation scenario.
-
•
We assess the results of our analysis and we propose that a star formation scenario where feedback from the older UCL region of Sco-Cen initiated star formation at different times in different locations of Upper Sco, creating the age gradient seen among the distinct subgroups. The low intensity of feedback from the relatively distant UCL region, impacting a large surface area of molecular gas in Upper Sco over an extended period, resulted in initially sparse subgroups which have largely retained their initial kinematic structure.
8 Acknowledgments
JJA & JCT acknowledge support from ERC Advanced Grant MSTAR (788829). This project has also received funding from the European Union’s Horizon 2020 research and innovation programme under grant agreement No 101004719. This material reflects only the authors views and the Commission is not liable for any use that may be made of the information contained therein. This work has made use of data from the ESA space mission Gaia (http://www.cosmos.esa.int/gaia), processed by the Gaia Data Processing and Analysis Consortium (DPAC, http://www.cosmos.esa.int/web/gaia/dpac/consortium). Funding for DPAC has been provided by national institutions, in particular the institutions participating in the Gaia Multilateral Agreement. This research made use of the Simbad and Vizier catalogue access tools (provided by CDS, Strasbourg, France), Astropy (Astropy Collaboration et al., 2013) and TOPCAT (Taylor, 2005).
9 Data Availability
The data underlying this article, both the spectroscopic parameters for observed targets and the astrometric parameters for confirmed PMS members will be available at CDS via https://cdsarc.unistra.fr/viz-bin/cat/J/MNRAS.
References
- AAO Software Team (2015) AAO Software Team 2015, p. ascl:1505.015
- Ahumada et al. (2020) Ahumada R., et al., 2020, ApJS, 249, 3
- Ambartsumian (1947) Ambartsumian V., 1947, Acad. Sci. Armenian SSR, Yerevan
- Armstrong & Tan (2024) Armstrong J. J., Tan J. C., 2024, A&A, 692, A166
- Armstrong et al. (2022) Armstrong J. J., Wright N. J., Jeffries R. D., Jackson R. J., Cantat-Gaudin T., 2022, MNRAS, 517, 5704
- Astropy Collaboration et al. (2013) Astropy Collaboration et al., 2013, A&A, 558, A33
- Bailer-Jones et al. (2021) Bailer-Jones C. A. L., Rybizki J., Fouesneau M., Demleitner M., Andrae R., 2021, AJ, 161, 147
- Baraffe et al. (2015) Baraffe I., Homeier D., Allard F., Chabrier G., 2015, A&A, 577, A42
- Blaauw (1964) Blaauw A., 1964, ARA&A, 2, 213
- Buder et al. (2021) Buder S., et al., 2021, MNRAS,
- Buder et al. (2024) Buder S., et al., 2024, arXiv e-prints, p. arXiv:2409.19858
- Cantat-Gaudin et al. (2019a) Cantat-Gaudin T., Mapelli M., Balaguer-Núñez L., Jordi C., Sacco G., Vallenari A., 2019a, A&A, 621, A115
- Cantat-Gaudin et al. (2019b) Cantat-Gaudin T., Mapelli M., Balaguer-Núñez L., Jordi C., Sacco G., Vallenari A., 2019b, A&A, 621, A115
- Chabrier (2003) Chabrier G., 2003, PASP, 115, 763
- Damiani et al. (2014) Damiani F., et al., 2014, A&A, 566, A50
- Damiani et al. (2019) Damiani F., Prisinzano L., Pillitteri I., Micela G., Sciortino S., 2019, A&A, 623, A112
- Elmegreen & Lada (1976) Elmegreen B. G., Lada C. J., 1976, in Bulletin of the American Astronomical Society. p. 334
- Elmegreen & Lada (1977) Elmegreen B. G., Lada C. J., 1977, ApJ, 214, 725
- Fabricius et al. (2021) Fabricius C., et al., 2021, A&A, 649, A5
- Farias et al. (2024) Farias J. P., Offner S. S. R., Grudić M. Y., Guszejnov D., Rosen A. L., 2024, MNRAS, 527, 6732
- Feast & Whitelock (1997) Feast M., Whitelock P., 1997, MNRAS, 291, 683
- Fiorellino et al. (2024) Fiorellino E., et al., 2024, A&A, 686, A160
- Foreman-Mackey et al. (2013) Foreman-Mackey D., Hogg D. W., Lang D., Goodman J., 2013, Publications of the Astronomical Society of the Pacific, 125, 306
- Fortune-Bashee et al. (2024) Fortune-Bashee X., Sun J., Tan J. C., 2024, ApJ, 977, L6
- Frasca et al. (2017) Frasca A., Biazzo K., Alcalá J. M., Manara C. F., Stelzer B., Covino E., Antoniucci S., 2017, A&A, 602, A33
- Fuchs et al. (2006) Fuchs B., Breitschwerdt D., de Avillez M. A., Dettbarn C., Flynn C., 2006, MNRAS, 373, 993
- Gaia Collaboration et al. (2016) Gaia Collaboration et al., 2016, A&A, 595, A1
- Gaia Collaboration et al. (2021) Gaia Collaboration et al., 2021, A&A, 649, A1
- Gilmore et al. (2012) Gilmore G., et al., 2012, The Messenger, 147, 25
- Gilmore et al. (2022) Gilmore G., et al., 2022, A&A, 666, A120
- Goodwin & Bastian (2006) Goodwin S. P., Bastian N., 2006, MNRAS, 373, 752
- Grudić et al. (2021) Grudić M. Y., Guszejnov D., Hopkins P. F., Offner S. S. R., Faucher-Giguère C.-A., 2021, MNRAS, 506, 2199
- Guszejnov et al. (2022) Guszejnov D., Markey C., Offner S. S. R., Grudić M. Y., Faucher-Giguère C.-A., Rosen A. L., Hopkins P. F., 2022, MNRAS, 515, 167
- Hennebelle & Chabrier (2011) Hennebelle P., Chabrier G., 2011, ApJ, 743, L29
- Hills (1980) Hills J. G., 1980, ApJ, 235, 986
- Holmberg & Flynn (2004) Holmberg J., Flynn C., 2004, MNRAS, 352, 440
- Inutsuka et al. (2015) Inutsuka S.-i., Inoue T., Iwasaki K., Hosokawa T., 2015, A&A, 580, A49
- Jackson et al. (2018) Jackson R. J., Deliyannis C. P., Jeffries R. D., 2018, MNRAS, 476, 3245
- Jeffries et al. (2021) Jeffries R. D., Jackson R. J., Sun Q., Deliyannis C. P., 2021, MNRAS, 500, 1158
- Johnson & Soderblom (1987) Johnson D. R. H., Soderblom D. R., 1987, AJ, 93, 864
- Karim & Mamajek (2017) Karim M. T., Mamajek E. E., 2017, MNRAS, 465, 472
- Kerr et al. (2025) Kerr R., Farias J. P., Prato L., Rector T. A., Speagle J. S., Kraus A. L., 2025, arXiv e-prints, p. arXiv:2503.02002
- Kos et al. (2019) Kos J., et al., 2019, A&A, 631, A166
- Kounkel et al. (2018) Kounkel M., et al., 2018, AJ, 156, 84
- Krause et al. (2018) Krause M. G. H., et al., 2018, A&A, 619, A120
- Kroupa (2001) Kroupa P., 2001, MNRAS, 322, 231
- Kroupa et al. (2001) Kroupa P., Aarseth S., Hurley J., 2001, MNRAS, 321, 699
- Krumholz & McKee (2005) Krumholz M. R., McKee C. F., 2005, ApJ, 630, 250
- Kuhn et al. (2019) Kuhn M. A., Hillenbrand L. A., Sills A., Feigelson E. D., Getman K. V., 2019, ApJ, 870, 32
- Kurucz (1992) Kurucz R. L., 1992, in Barbuy B., Renzini A., eds, IAU Symposium Vol. 149, The Stellar Populations of Galaxies. p. 225
- Lada & Lada (2003) Lada C. J., Lada E. A., 2003, araa, 41, 57
- Lewis et al. (2002) Lewis I. J., et al., 2002, MNRAS, 333, 279
- Li et al. (2018) Li Q., Tan J. C., Christie D., Bisbas T. G., Wu B., 2018, PASJ, 70, S56
- Loren (1989) Loren R. B., 1989, ApJ, 338, 902
- Luhman (2022) Luhman K. L., 2022, AJ, 163, 24
- Luhman & Esplin (2020) Luhman K. L., Esplin T. L., 2020, AJ, 160, 44
- Majewski et al. (2017) Majewski S. R., et al., 2017, AJ, 154, 94
- Mapelli (2017) Mapelli M., 2017, MNRAS, 467, 3255
- Marigo et al. (2017) Marigo P., et al., 2017, ApJ, 835, 77
- Marton et al. (2023) Marton G., et al., 2023, A&A, 674, A21
- Maschberger (2013) Maschberger T., 2013, MNRAS, 429, 1725
- Miao et al. (2006) Miao J., White G. J., Nelson R., Thompson M., Morgan L., 2006, MNRAS, 369, 143
- Miret-Roig et al. (2022a) Miret-Roig N., et al., 2022a, Nature Astronomy, 6, 89
- Miret-Roig et al. (2022b) Miret-Roig N., Galli P. A. B., Olivares J., Bouy H., Alves J., Barrado D., 2022b, A&A, 667, A163
- Miret-Roig et al. (2024) Miret-Roig N., Alves J., Barrado D., Burkert A., Ratzenböck S., Konietzka R., 2024, Nature Astronomy, 8, 216
- Padoan & Nordlund (2011) Padoan P., Nordlund Å., 2011, ApJ, 730, 40
- Palla et al. (2005) Palla F., Randich S., Flaccomio E., Pallavicini R., 2005, ApJ, 626, L49
- Pang et al. (2021) Pang X., Yu Z., Tang S.-Y., Hong J., Yuan Z., Pasquato M., Kouwenhoven M. B. N., 2021, ApJ, 923, 20
- Parker et al. (2009) Parker R. J., Goodwin S. P., Kroupa P., Kouwenhoven M. B. N., 2009, MNRAS, 397, 1577
- Pecaut & Mamajek (2016) Pecaut M. J., Mamajek E. E., 2016, MNRAS, 461, 794
- Posch et al. (2023) Posch L., Miret-Roig N., Alves J., Ratzenböck S., Großschedl J., Meingast S., Zucker C., Burkert A., 2023, Astronomy & Astrophysics, 679, L10
- Posch et al. (2025) Posch L., Alves J., Miret-Roig N., Ratzenböck S., Großschedl J., Meingast S., Swiggum C., Konietzka R., 2025, A&A, 693, A175
- Preibisch & Mamajek (2008) Preibisch T., Mamajek E., 2008, in Reipurth B., ed., , Vol. 5, Handbook of Star Forming Regions, Volume II. p. 235, doi:10.48550/arXiv.0809.0407
- Quintana & Wright (2022) Quintana A. L., Wright N. J., 2022, MNRAS, 515, 687
- Raghavan et al. (2010) Raghavan D., et al., 2010, ApJS, 190, 1
- Randich et al. (2022) Randich S., et al., 2022, A&A, 666, A121
- Ratzenböck et al. (2023a) Ratzenböck S., Großschedl J. E., Möller T., Alves J., Bomze I., Meingast S., 2023a, A&A, 677, A59
- Ratzenböck et al. (2023b) Ratzenböck S., et al., 2023b, A&A, 678, A71
- Rigliaco et al. (2016) Rigliaco E., et al., 2016, A&A, 588, A123
- Schönrich et al. (2010) Schönrich R., Binney J., Dehnen W., 2010, MNRAS, 403, 1829
- Scoville et al. (1986) Scoville N. Z., Sanders D. B., Clemens D. P., 1986, ApJ, 310, L77
- Sheinis et al. (2015) Sheinis A., et al., 2015, Journal of Astronomical Telescopes, Instruments, and Systems, 1, 035002
- Sills et al. (2018) Sills A., Rieder S., Scora J., McCloskey J., Jaffa S., 2018, MNRAS, 477, 1903
- Sneden et al. (2012) Sneden C., Bean J., Ivans I., Lucatello S., Sobeck J., 2012, p. ascl:1202.009
- Soderblom (2010) Soderblom D. R., 2010, araa, 48, 581
- Squicciarini et al. (2021) Squicciarini V., Gratton R., Bonavita M., Mesa D., 2021, MNRAS, 507, 1381
- Suwannajak et al. (2014) Suwannajak C., Tan J. C., Leroy A. K., 2014, ApJ, 787, 68
- Tan (2000) Tan J. C., 2000, ApJ, 536, 173
- Tan (2010) Tan J. C., 2010, ApJ, 710, L88
- Tan et al. (2013) Tan J. C., Shaske S. N., Van Loo S., 2013, in Wong T., Ott J., eds, IAU Symposium Vol. 292, Molecular Gas, Dust, and Star Formation in Galaxies. pp 19–28 (arXiv:1211.0198), doi:10.1017/S1743921313000173
- Tasker & Tan (2009) Tasker E. J., Tan J. C., 2009, ApJ, 700, 358
- Taylor (2005) Taylor M. B., 2005, in Shopbell P., Britton M., Ebert R., eds, Astronomical Society of the Pacific Conference Series Vol. 347, Astronomical Data Analysis Software and Systems XIV. p. 29
- Tsantaki et al. (2022) Tsantaki M., et al., 2022, A&A, 659, A95
- Tutukov (1978) Tutukov A. V., 1978, A&A, 70, 57
- Wright (2020) Wright N. J., 2020, New Astron. Rev., 90, 101549
- Wright & Mamajek (2018) Wright N. J., Mamajek E. E., 2018, MNRAS, 476, 381
- Wright et al. (2014) Wright N. J., Parker R. J., Goodwin S. P., Drake J. J., 2014, MNRAS, 438, 639
- Wright et al. (2016) Wright N. J., Bouy H., Drew J. E., Sarro L. M., Bertin E., Cuillandre J.-C., Barrado D., 2016, MNRAS, 460, 2593
- Wright et al. (2023) Wright N. J., Kounkel M., Zari E., Goodwin S., Jeffries R. D., 2023, in Inutsuka S., Aikawa Y., Muto T., Tomida K., Tamura M., eds, Astronomical Society of the Pacific Conference Series Vol. 534, Protostars and Planets VII. p. 129
- Wright et al. (2024) Wright N. J., et al., 2024, MNRAS, 533, 705
- Wu et al. (2017) Wu B., Tan J. C., Christie D., Nakamura F., Van Loo S., Collins D., 2017, ApJ, 841, 88
- Wu et al. (2018) Wu B., Tan J. C., Nakamura F., Christie D., Li Q., 2018, PASJ, 70, S57
- Wu et al. (2020) Wu B., Tan J. C., Christie D., Nakamura F., 2020, ApJ, 891, 168
- Zari et al. (2019) Zari E., Brown A. G. A., de Zeeuw P. T., 2019, A&A, 628, A123
- Zwart et al. (2010) Zwart S. P., McMillan S., Gieles M., 2010, arXiv preprint arXiv:1002.1961
- de Zeeuw et al. (1999) de Zeeuw P. T., Hoogerwerf R., de Bruijne J. H. J., Brown A. G. A., Blaauw A., 1999, AJ, 117, 354
Appendix A Appendix: Inter-group kinematics
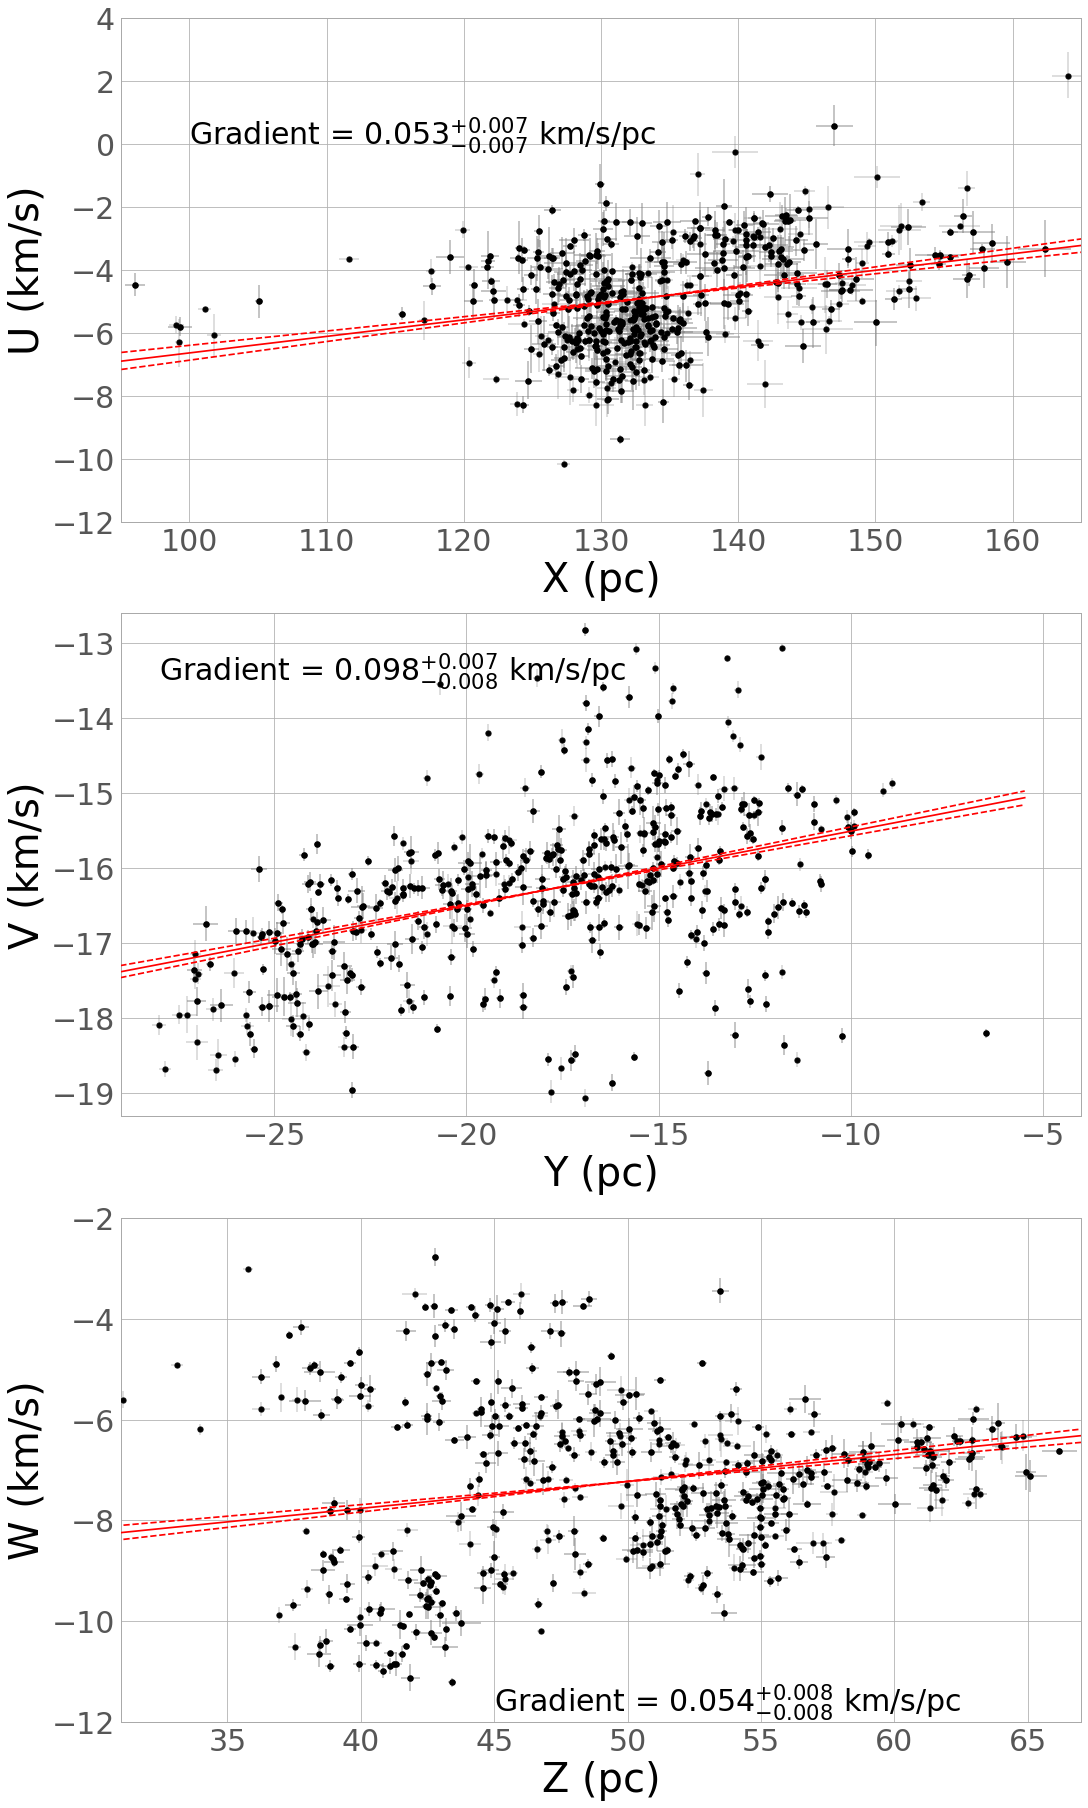
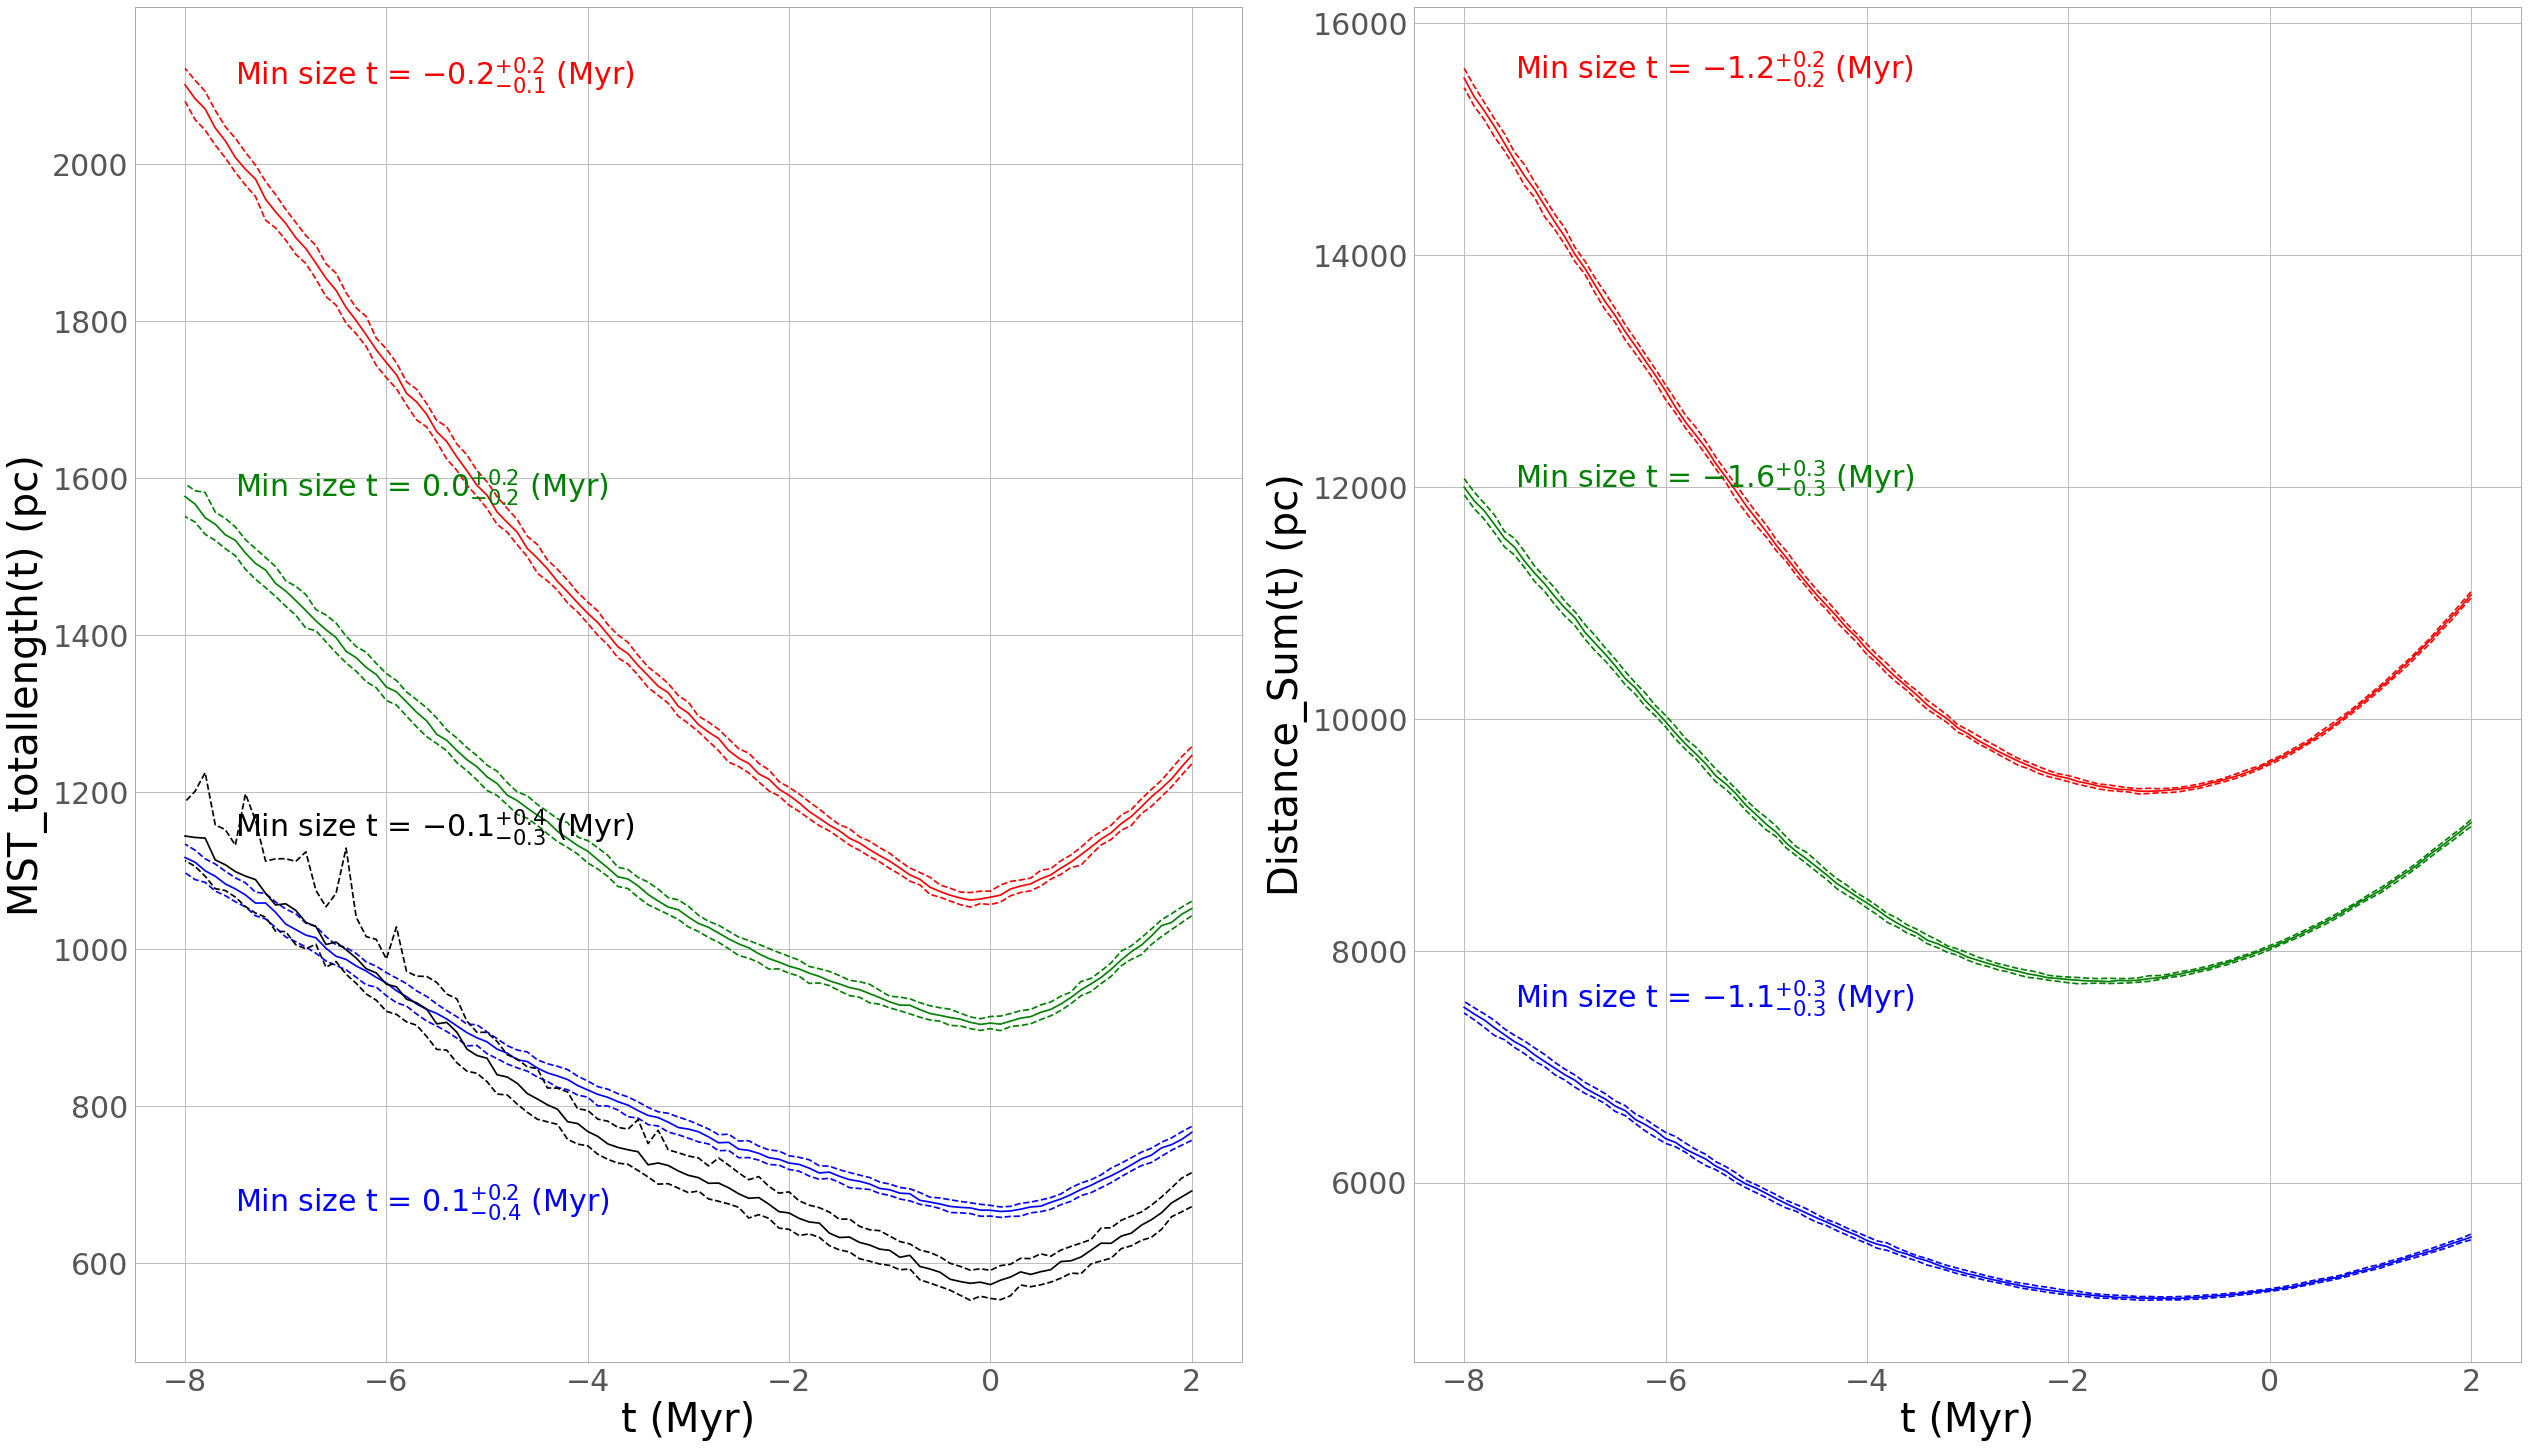
As well as the internal kinematics of each separate subgroup we can also consider the kinematic trends between subgroups.
We calculate the component of 3D velocity directed away from the combined center of Upper Sco () for each subgroup, using the median subgroup Cartesian positions and velocities and their respective uncertainties as given in Table. 2, and using the median Cartesian position and velocity of all YSOs in our sample as the combined center of Upper Sco.
We find = for Sco, = for Sco, = for Sco, = for Sco, = for Sco, = for Oph and = for Sco.
Despite the evidence we have presented that most of these subgroups are expanding from their initial configurations, albeit anisotropically (see Section 5.4), we find that the large-scale motions of Upper Sco are not consistent with simple radial expansion of all subgroups relative to one another. Indeed, Sco, Sco and Sco are moving toward the combined center of Upper Sco on average, as indicated by their significantly ( in all cases) negative values.
We also calculate the inter-subgroup velocity dispersion, again using the median velocities of each subgroup as given in Table. 2. The inter-subgroup velocity dispersion in the X direction () = kms-1, in the Y direction () = kms-1 and in the Z direction () = kms-1.
If we calculate the inter-subgroup velocity dispersions with the velocity components attributed to radial expansion () subtracted, we find kms-1, kms-1 and kms-1.
We also note that, despite the significant expansion trends seen across the entire Upper Sco YSO sample (Fig. 18) the greatest of which ( kms-1pc-1) indicates an expansion timescale of Myr, traceback calculations performed for the entire sample following the approach described in Section. 5.7 do not provide strong evidence that the region as a whole was significantly more compact in the past. According to the size metric the distribution of Upper Sco YSOs becomes sparser back in time, with the minimum MST total-length being found consistently in the present configuration, regardless of the level of filtering. According to the metric the distribution of Upper Sco YSOs may be considered to be more compact Myr in the past, but then becomes sparser for earlier times. We also plot the relative positions of all YSOs in our sample at the present time, at Myr in the past and at Myr in the past in Fig. 20 as a visualisation of this traceback.
A possible reason for this difference may be the sensitivity of the traceback to minimum configuration approach to kinematic outliers and, in this case, a potential interloper subgroup. The large negative of Sco, as well as its older isochronal age relative to most other subgroups, indicates its likely origin outside of Upper Sco as it is commonly defined, or at least that its formation was not directly related to the subgroups considered part of the Upper Sco ’cluster-chain’ by Posch et al. (2025). This is similar to the conclusion of Armstrong et al. (2022) that the NGC 2547 cluster is presently interloping in the younger population of Vela OB2. The linear expansion analysis is less sensitive to kinematic outliers and so still produces significant expansion gradients for Upper Sco as a whole despite the inclusion of Sco.
If the traceback calculations are performed on the YSOs sample with Sco removed, then the traceback time to the most compact configuration becomes Myr, Myr and Myr, according to the metric with no filter for outliers, 3 velocity outliers removed and 2 velocity outliers removed, respectively.


