Mapping Nearby Galaxies with Apache Point Observatory: Group and field galaxies’ morphologies in the colour-magnitude plane
Abstract
This study involves the use of integral field spectroscopy (IFS) data from Mapping Nearby Galaxies at Apache Point Observatory (MaNGA) to investigate whether the morphology influences the environmental dependence of galaxies’ colours and the colour-magnitude planes. The galaxies are classified into six morphologies (Elliptical, Lenticular, Early-type, Intermediate-type, Late-type spirals and Irregular) and further in field and group environments. The distributions of colours ( and ) are compared between field and group environments and then the colour-magnitude planes are analysed. It is observed that Intermediate and Late-types spirals preferentially exist in field environments while Early-type spirals exist in groups. The colours and colour-magnitude planes of Elliptical, Lenticular, Early-type and Intermediate-type spirals depend on the environment while for the Late-type and Irregular galaxies, their dependence on the environment is very weak. The study concludes that the dependence of colours and colour-magnitude planes on the environment is influenced by morphology.
I Introduction
Morphology and colour are two among the fundamental properties in galaxy evolution, with which galaxies are classified into late-type (with disk-dominated, spiral arms and old stellar populations) in blue colour and early-type (with bulge-dominated, elliptical and young stellar populations) in red colour [1, 2, 3, 4, 5]. Ref. [1] observed the existence of a strong correlation between colour and morphology, due to which elliptical and lenticular tend to be redder than spiral and irregular galaxies. The findings by Ref. [4] pointed out that late-type display blue colour than early-type galaxies, using a Deep Learning (DL) based morphological catalogue built from images obtained by the third release of Southern Photometric Local Universe Survey (S-PLUS) [5]. The morphological changes are usually accompanied by colour transformation, however it should be kept in mind that it is not necessarily a case of vice versa as spiral galaxies may transform from blue cloud to red sequence without changing from late-type to early-type [6, 7]. Furthermore, the study by Ref. [8] observed that the use of colour alone as a reliable indicator of galaxy morphology, leads to significant contamination and misclassification, hence it is not valid to use colour as the only factor for galaxies’ morphological classification.
A number of studies have shown galaxy morphology to depend on the environment using morphology-density relation, with early-type galaxies located in dense, while late-type galaxies in low-density environments [9, 10, 15, 11, 12, 13, 14]. The study by Ref. [9] observed that the galaxy morphology to be highly influenced by the environment pointing out quenching at which the star formation of galaxies decreases and mergers to be significantly dense when compared to low-density regions which are responsible for morphological changes [10]. Ref. [11], studying the impact of local density on the morphology for star forming and quiescent galaxies concluded that the process affecting a galaxy’s star formation must also affect the morphology. Similarly, Ref. [12], exploring the influence of environment on star formation and morphology using the sample from the Cosmic Assembly Near-infrared Deep Extragalactic Legacy Survey (CANDELS) as detailed in Refs. [16, 17], within the redshift of range observed that the morphology is connected to galaxy’s star formation.
However, the study by Ref. [18], investigating the relationship between the morphology, star formation rate (SFR) and environment using the sample from the Cosmic Evolution Survey (COSMOS) as detailed in Ref. [19], found that the shape of the main sequence in the relation of colour against colour and colour against specific star formation rate (SSFR) including the turnover at higher stellar mass does not depend on the environment for the redshift range . Ref. [20] mention the environment to play a significant role in shaping the morphology of galaxies, so should be taken into account to pinpoint the mechanism driving the influence of clusters in galaxy evolution further insisted that the morphology should be taken into account when discussing the influence of the environment on galaxy evolution. Using a limited sample in volume and stellar mass from the sixteen release of the Sloan Digital Sky Survey (SDSS) Ref. [21] obtained that the existing relations of morphology-stellar mass and again environment-stellar mass are not adequate in explaining the relation between morphology and environment since the factors responsible to alter morphology are not always necessary to have a direct effect on stellar mass and the vice versa, despite of the widely accepted possibility of a relation between morphology and environment to be linked with stellar mass.
On the other hand, a number of studies using single-fibre spectroscopy have shown galaxy colours to depend on the environment, with blue galaxies found in the low-density environment while red is located in a dense environment [31, 23, 22, 29, 28, 24, 25, 26, 27, 30]. Ref. [22] used the colour selection to study the clustering of galaxies within the redshift range , obtained that clustering strongly depends on the environment with blue galaxies weakly clustered than the red ones suggesting that galaxy clustering strongly correlate with colour than morphology. Ref. [23] using the data from SDSS, concluded that colour is the most predictive physical property of the local environment. The results of this reference suggest that galaxy structural properties are less correlated with the galaxy’s environment than the stellar mass (M) and SFR. In the study on the galaxy colours in different environments obtained by considering the galaxy’s local dimension using a volume limited sample constructed from SDSS, Ref. [30] obtained that the red galaxies are preferentially found in filament with high fraction when compared to sheet environment no matter the luminosity of a particular galaxy. Making the local density fixed authors observed the same trend meaning that the colours of galaxies depend on the environment even if the local density is fixed. Furthermore, it was found that the fraction of red galaxies increases with the local density. From this, they concluded the existence of colour bimodality in all environments and luminosities implying that the blue cloud to red sequence transformation exists in all environments. Similarly, Ref. [31] concluded that blue galaxies dominate the isolated and small groups, while red galaxies dominate dense groups and clusters.
The study by Ref. [32], using the data from the galaxy zoo project as detailed in Ref. [33], found that a galaxy’s colour depends on the environment at a fixed morphology although they further obtained that the relation between morphology and environment is very weak when colour is kept fixed. Analysing the correlation between galaxy morphology, colour, stellar mass and environment using the density approach, Ref. [34] observed that morphology and colour are different functions of environment and both depend on stellar mass. Authors further observed that once stellar mass is fixed morphology weakly depends on the environment while galaxy colour strongly depends on the environment. They pointed out that galaxies with higher stellar mass are redder than the ones with lower stellar mass irrespective of their morphology in all environments. The galaxies having low M are most cases bluer and found in low-density then become redder in high-density environments again irrespective of their morphology. In this sense they concluded that galaxy colour strongly depends on the environment rather than the morphology. Studying nearby massive galaxies specifically on the existence of a relation between the star formation, morphology and environment, Ref. [35] observed the existence of a correlation between morphology and SSFR. On the other hand, authors observed a weak dependence of morphology and SFR on the environment. The study concluded that the responsible physical process that shapes galaxy morphology also determines the rate of forming stars in a particular galaxy. Ref. [36], studying the evolution of Luminosity () of elliptical galaxies using a sample of galaxies from the SDSS where ellipticals were selected with blue cloud, green valley and red sequence ellipticals, observed that galaxy colour is related to star formation keeping the morphology constant as they concluded that most of the red sequence and green valley ellipticals are still forming stars or have been quenched recently while the blue cloud ellipticals are vigorously forming stars, which is not concentrated only at the centre but extend over the entire dimensions of a particular galaxy.
Using a sample of galaxies obtained from Galaxy And Mass Assembly survey (GAMA) as detailed in Refs. [37, 38, 39, 40] with a redshift range between and , to investigate how red galaxies fraction varies with environmental measurements, Ref. [41] found that the fraction varies with environment, however different density measurement results to variation in information. Analysing the galaxy’s properties and their dependence on the environment for luminous and non-luminous (separated by a characteristic magnitude M mag), Ref. [42] compared the properties in lowest and highest density regime using the radius to the fifth nearest neighbour to characterize galaxy environment. Authors observed luminosity-environment variations as a strong dependence on the environment was observed for luminous galaxies having luminosity above the characteristic magnitude while for the case of non-luminous galaxies that are having luminosity below the characteristic magnitude, a weak dependence on the environment was observed. Authors further concluded that colour, morphology and concentration index (ci) strongly depend on the environment no matter the value of luminosity. This implies that the characteristic magnitude is the parameter guiding only the dependence of luminosity on the environment.
Ref. [43], studying colours of early-type galaxies selected from SDSS at observed that when a relation connecting the galaxy’s effective radius, mean surface brightness, and central velocity dispersion (the fundamental plane) is considered, the galaxies in a less dense environment are not significantly different from dense environment. Furthermore, the colour magnitude diagram of a dense region is not statistically different from that of less dense regions which implies that colour magnitude diagram is not influenced by density. The study by Ref. [44] found that the galaxy colours depend on the environment using a sample of galaxies from SDSS opposite to Ref. [45], which used a sample of galaxies from SDSS also to study the dependence colour of active galactic nuclei (AGNs), concluded that all five colours ( and ) of AGNs weakly depend on the environment. On other side the colours of galaxies are related with the cosmic-web environment where the green-valley ellipticals are found in either of the environment, the blue cloud preferring low density region while the red sequence ellipticals reside in dense environment [46]. The existence of contradictory results draws attention to studying these relations in a concise manner using different samples and approaches.
In this study we aim to use integral field spectroscopy (IFS) data from the Mapping Nearby Galaxies survey at Apache Point Observatory (MaNGA) Ref. [47, 48] to investigate if morphology influences the dependence of galaxy colours and the colour-magnitude plane on the environment. The layout of this paper is as follows. We present the method of getting data in Section II. Our findings are presented in Section III and in Section IV we discuss the findings. The summary and conclusion of the study are presented in Section V. Throughout this paper we adopt a standard cosmology with the Hubble constant km s-1 Mpc-1, density of matter , and dark energy density .
II Data
II.1 MaNGA survey
The Mapping Nearby Galaxies at Apache Point Observatory (MaNGA) survey Ref. [48] is one of the currently available integral-field spectroscopy (IFS) surveys containing the largest sample of galaxies. The spatially resolved spectroscopic measurements contains galaxies, employing seventeen fiber-Integrated Field Unit (IFU) operating in the range from to arcseconds ( fiber per IFU), covering the wavelength range of at a resolution of [47, 48, 49]. The target for the MaNGA survey was chosen considering the mass ranges and galaxy colours whereby the sample is laying within the redshift between to . The survey involves three subsamples where the primary sample has optimised spatial coverage out to of effective radius of galaxies (Re) making of the total sample. The secondary sample extends the radial coverage to Re making of the total sample and the colour-enhanced subsample making of total [51, 50]. It is very important to remember the statistical effects produced by the use of flux-limited samples where at higher redshift the brighter galaxies obscure the fainter one (Malmquist bias) [52]. Thus to mitigate the Malmquist bias we use the volume-limited sample with redshift not exceeding , with km/s line-of-sight velocity difference up to Mpc projected distance [53, 54].
II.2 Galaxies morphologies
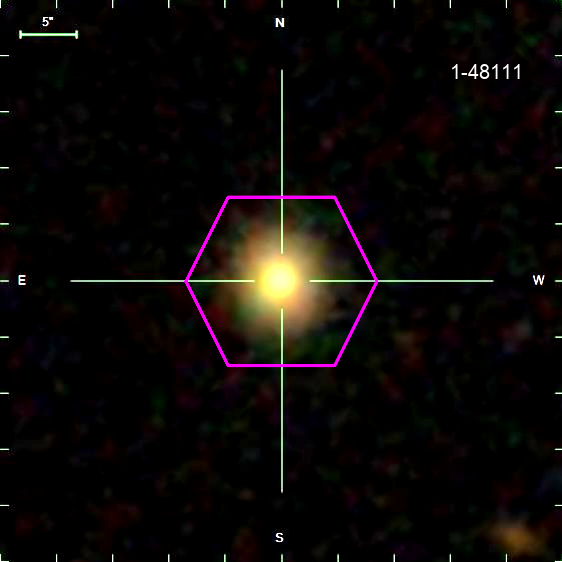
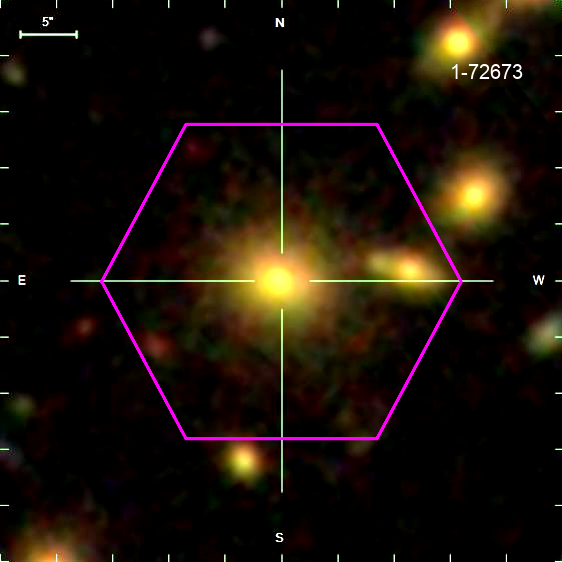
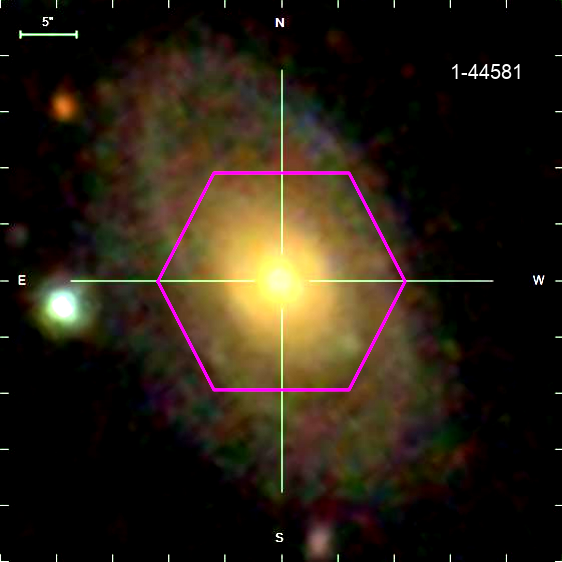
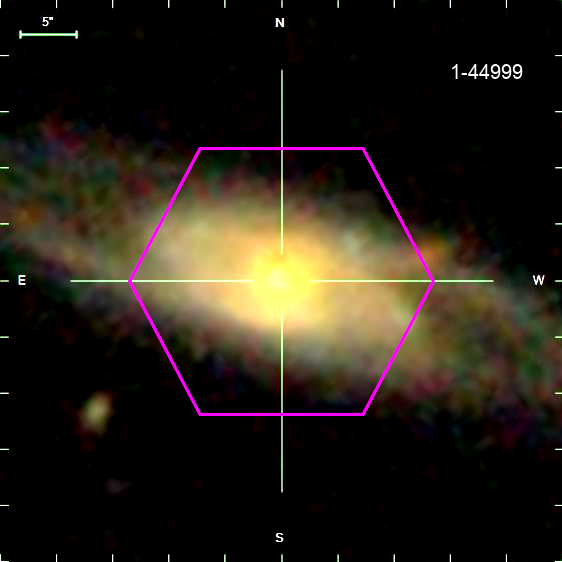
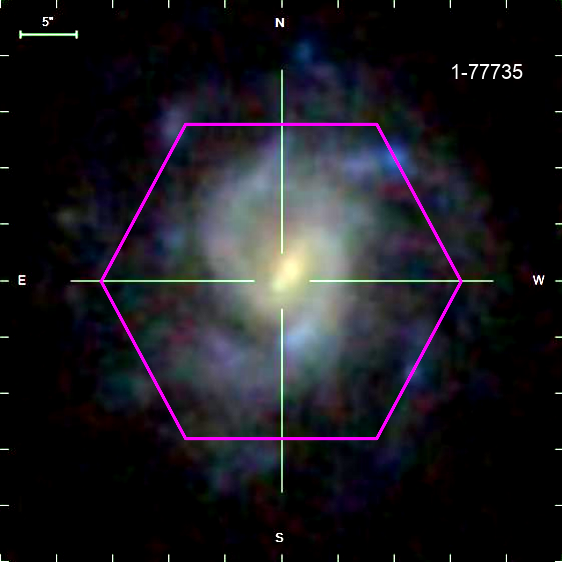
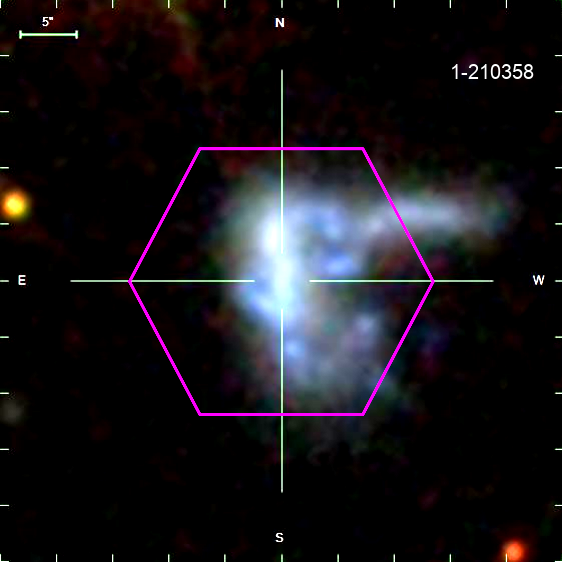
In this study we use the accurate visual morphology as detailed in Ref. [55], which follows the basic Hubble classification scheme [56]. The probability of a galaxy falling in one of the classes of the classification scheme for galaxies is given in Ref. [57]. The best morphological type (best-type-n) is given by integers ( and ) arranged from early-type to late-type morphologies that are central dominant galaxies which are massive elliptical (cD) to Irregular (Irr). We classified the galaxies into six morphologies: cD and E (Elliptical), SO (Lenticular), Sa, Sab and Sb (Early-type spirals), Sbc and Sc (Intermediate-type spirals), Scd and Sd (Late-type spirals), Sdm, Sm and Irr (Irregular). A total number of , , , , , for Elliptical (EL), Lenticular (LE), Early-type spirals (ES), Intermediate-type spirals (IS), Late-type spirals (LS) and Irregular galaxies (IR), respectively were obtained. The sample images for each of the six classified morphologies used in this study are shown in Fig. 1.
II.3 Galaxy environment
The galaxy environments were quantified using the Galaxy Environment for MaNGA Value Added Catalogue (GEMA-VAC) as detailed in Refs. [58, 59]. Based on the information provided in GEMA-VAC, the galaxies are assigned in groups by means of a halo-based group finder as detailed in Ref. [60]. Some galaxies have more than one neighbour (Group size (GS) ) while others have no nearby galaxy (GS ). Throughout this study the galaxies with GS criteria are considered as group (G) galaxies, while the ones with GS criteria are taken as field (F) galaxies. Using the stated conditions the following numbers of galaxies were obtained. For Elliptical: and , for Lenticular: and , for Early-type spiral: and , for Intermediate-type spiral: and , for Late-type spiral: and , for Irregular: and as field and group galaxies, respectively. The classified subsamples were used for the analysis in the next sections unless otherwise stated.
III Results
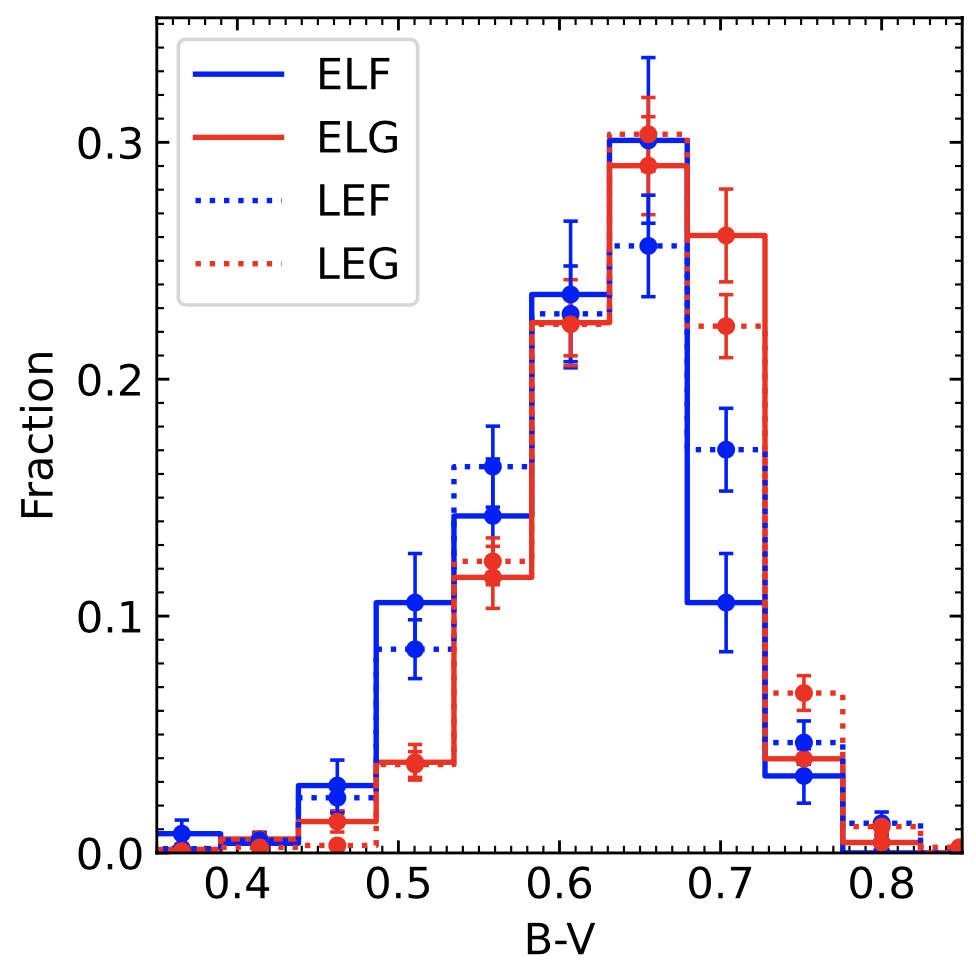
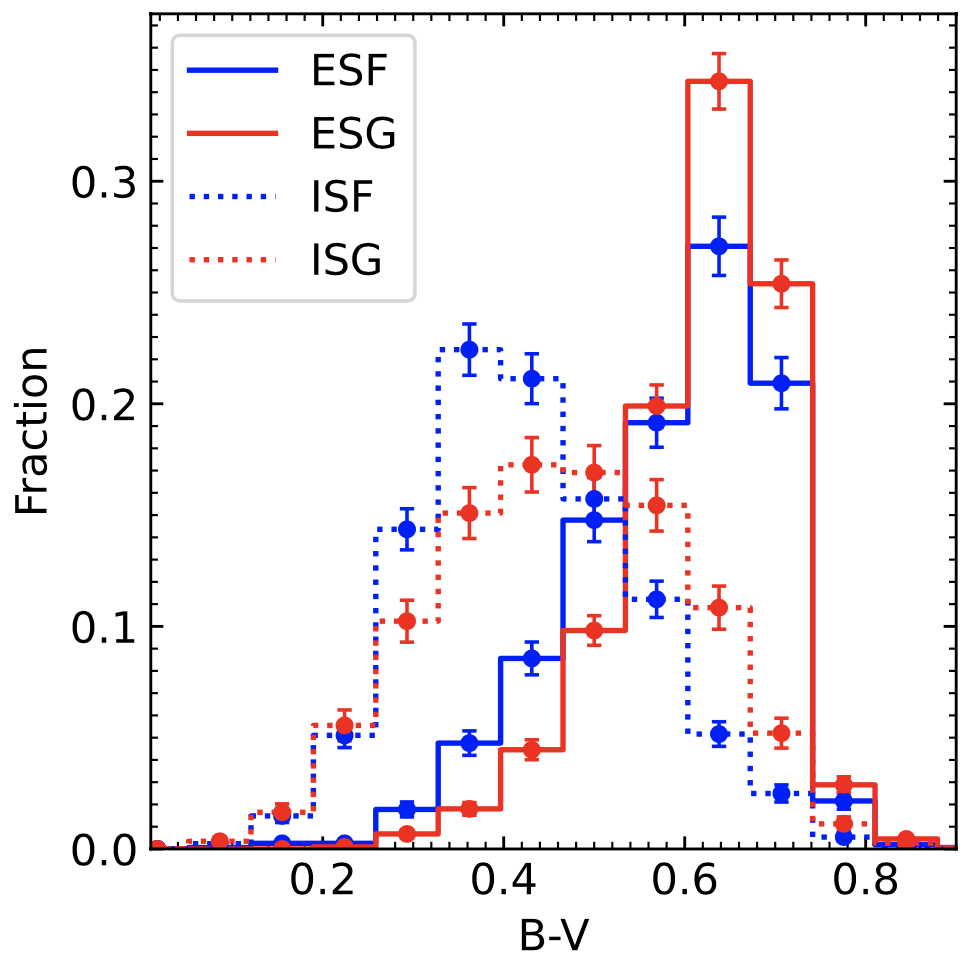
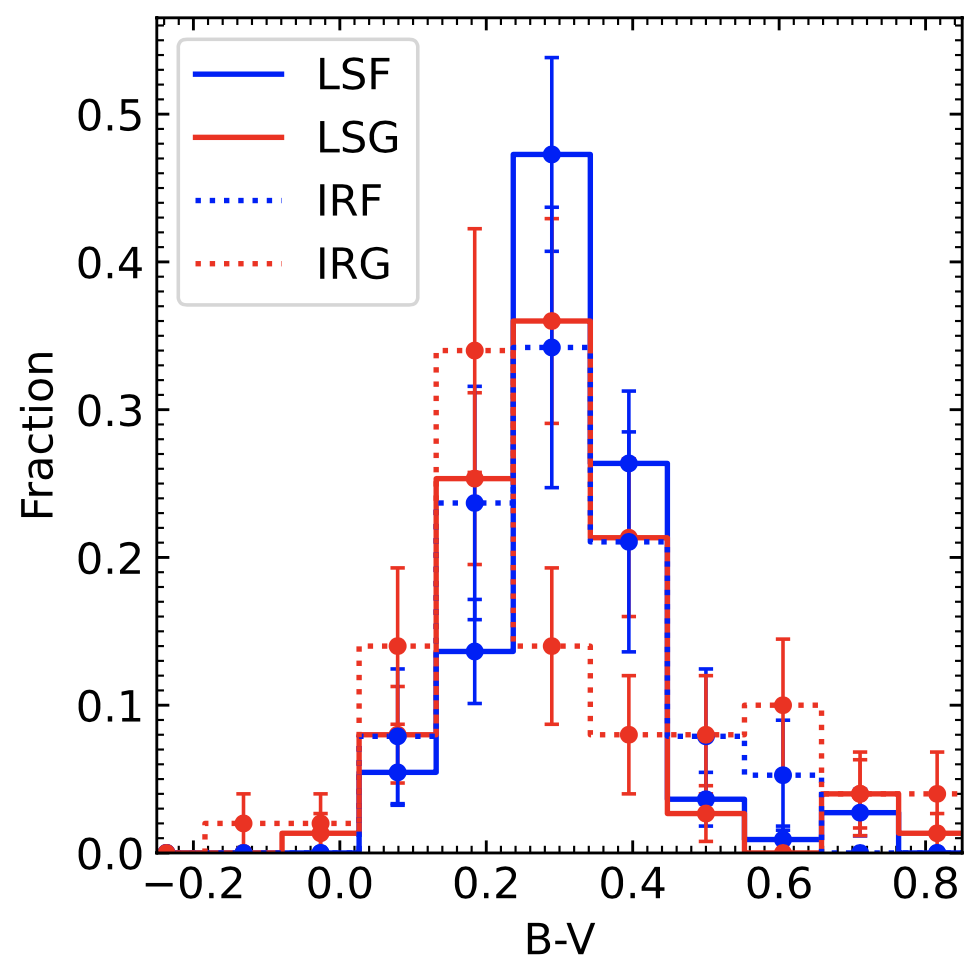
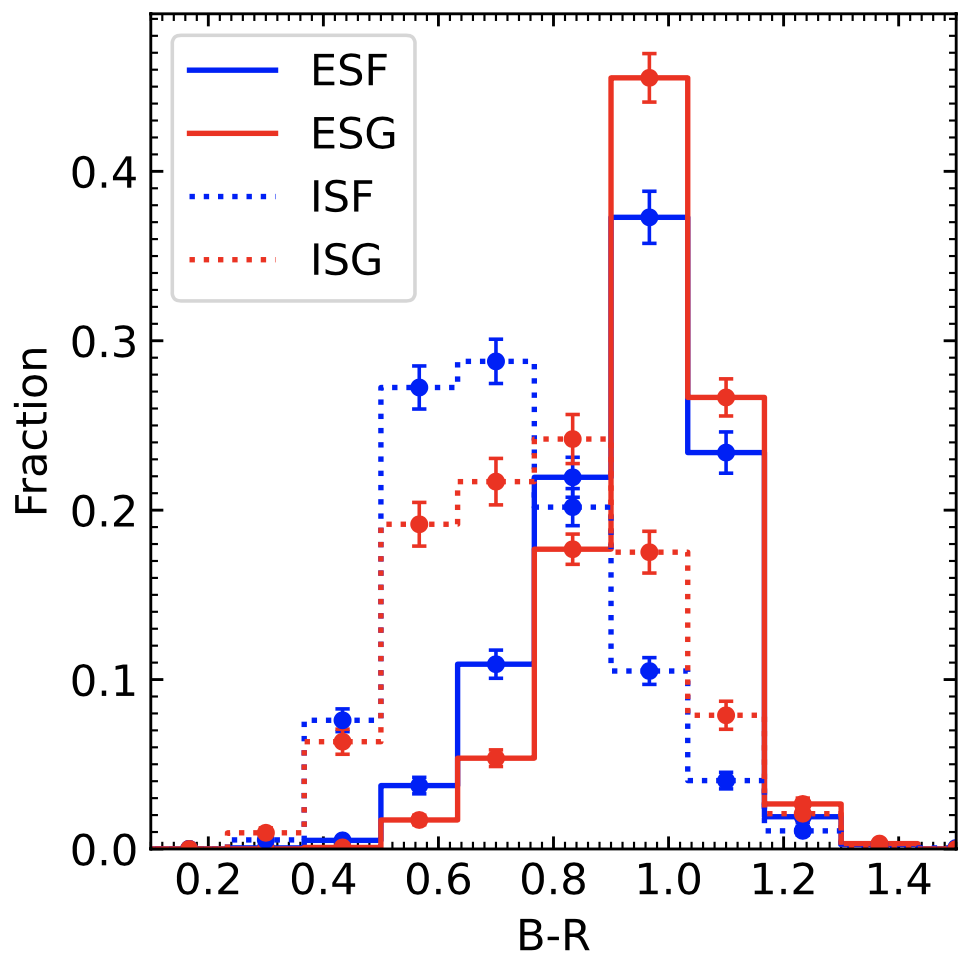
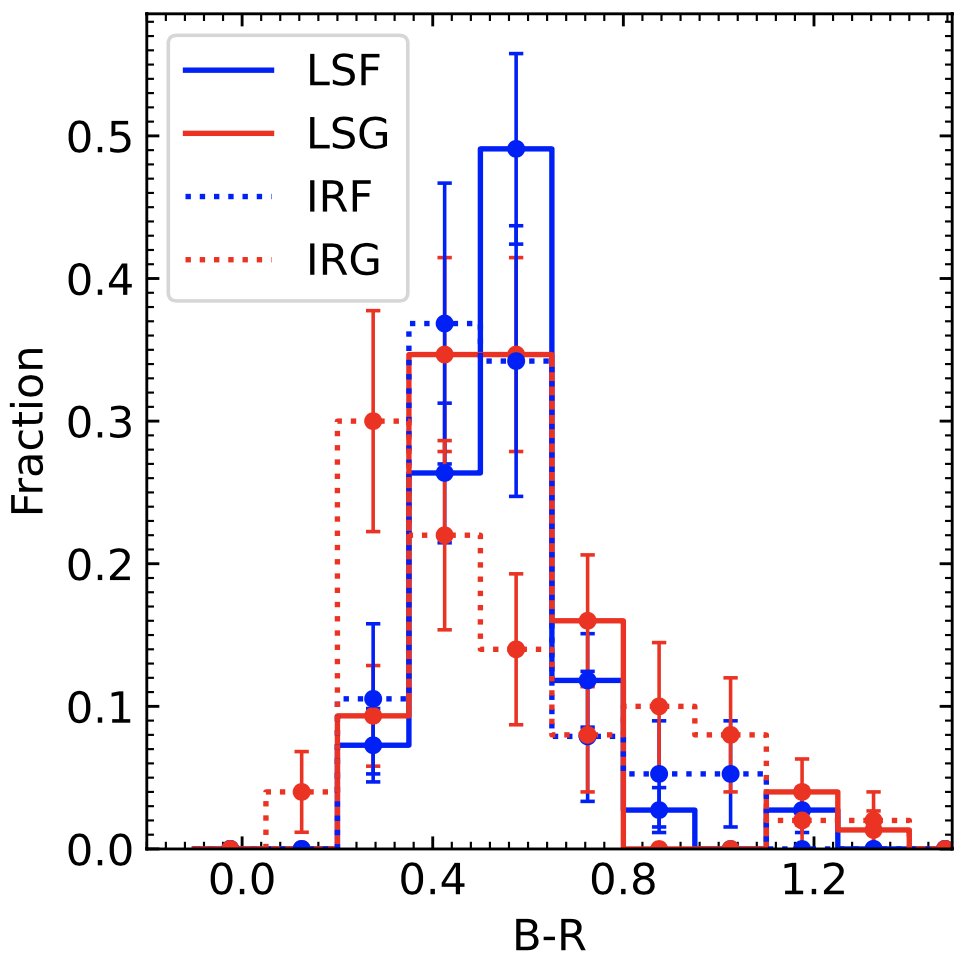
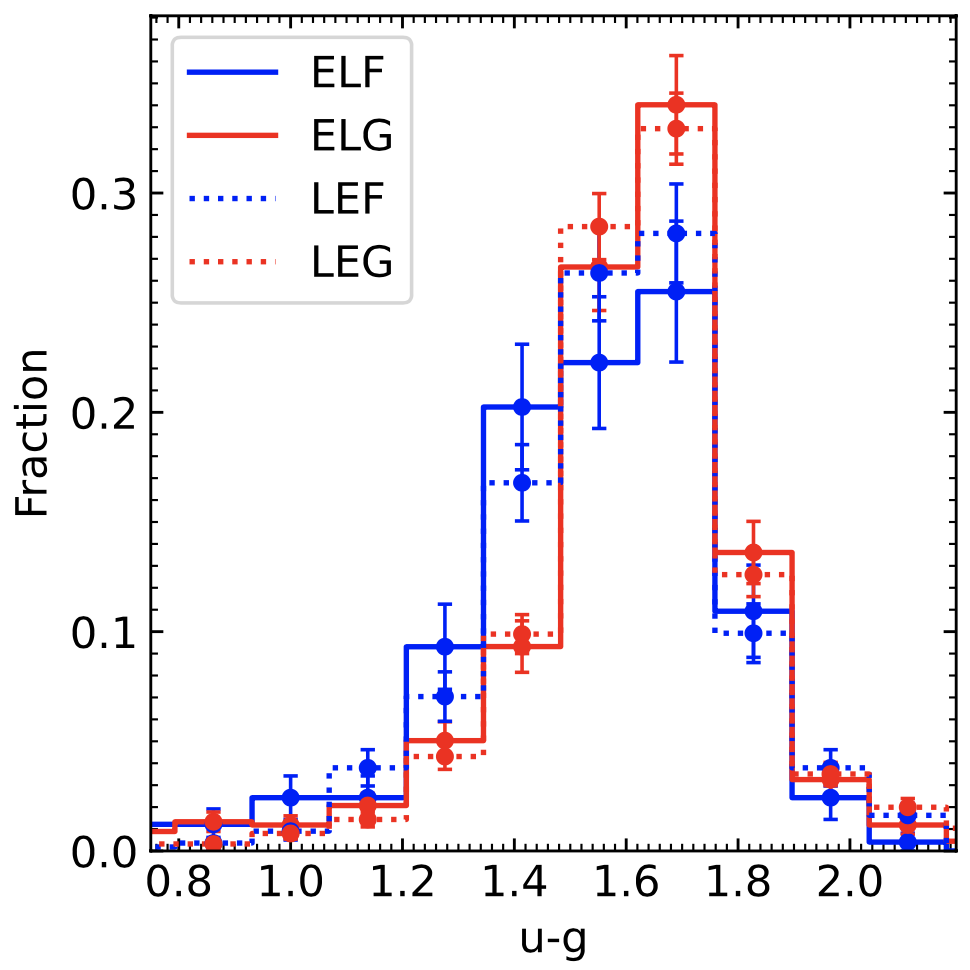
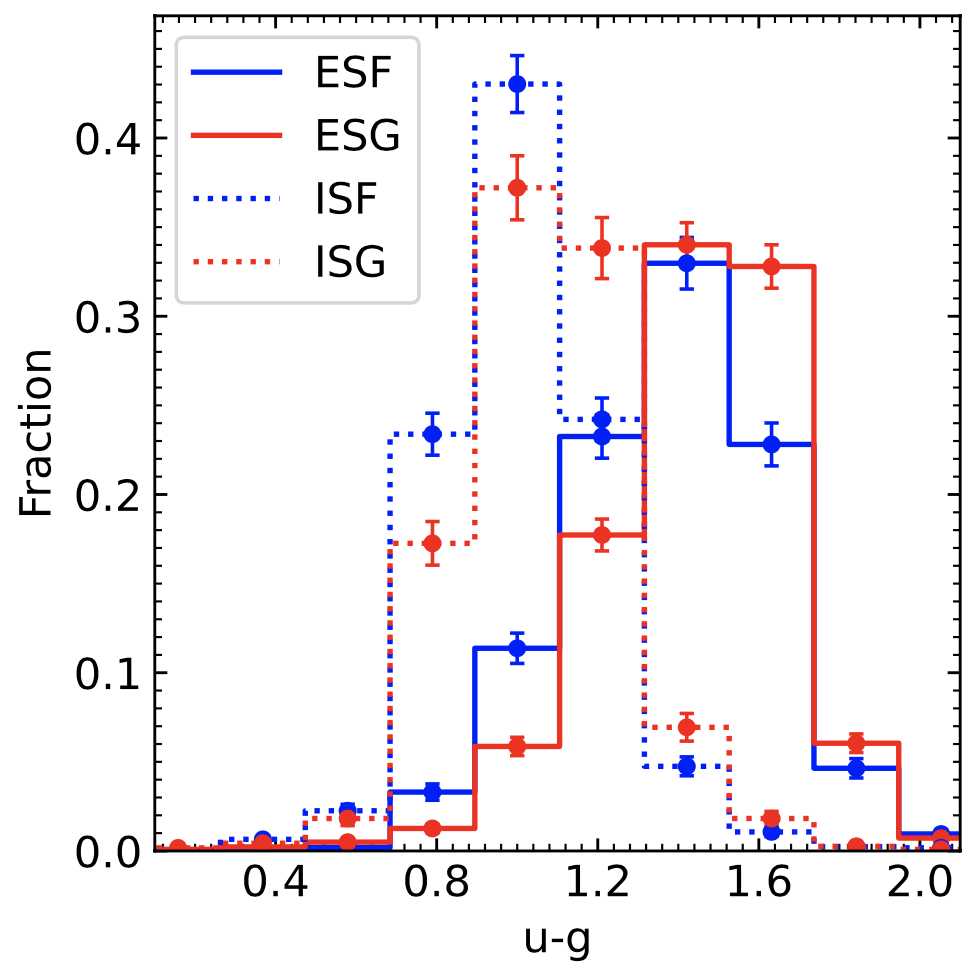
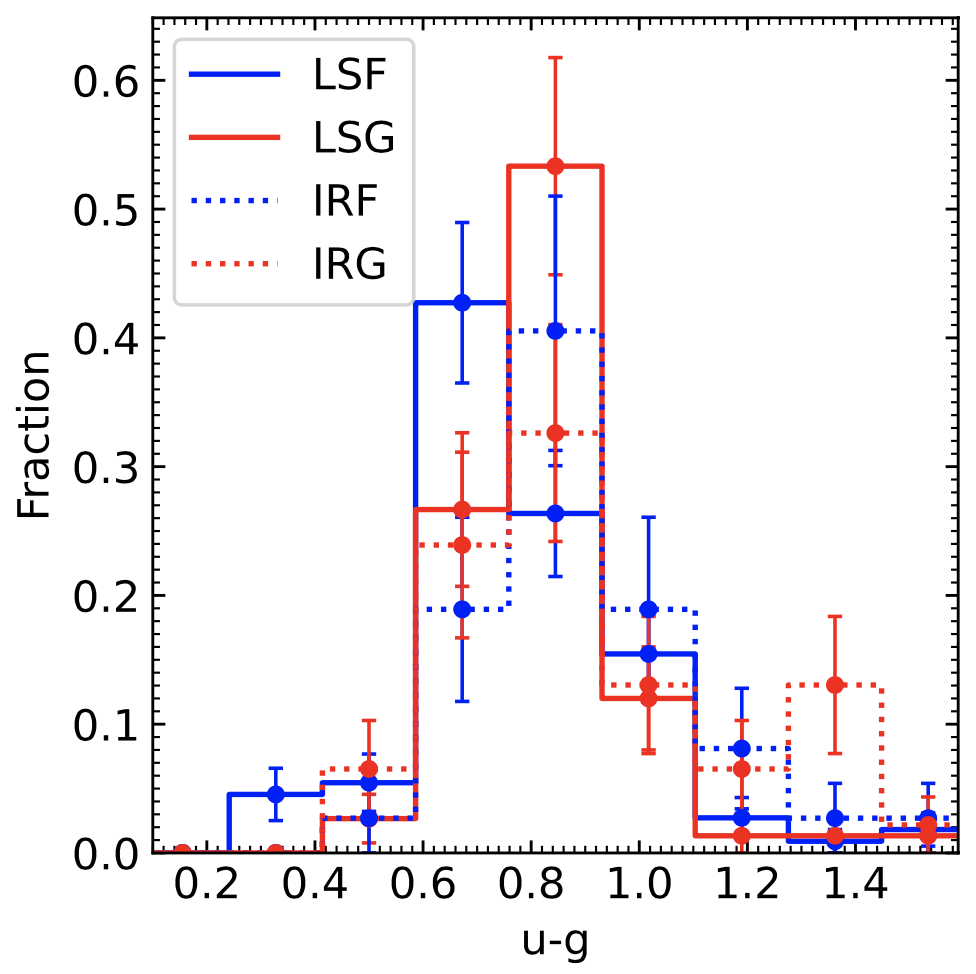
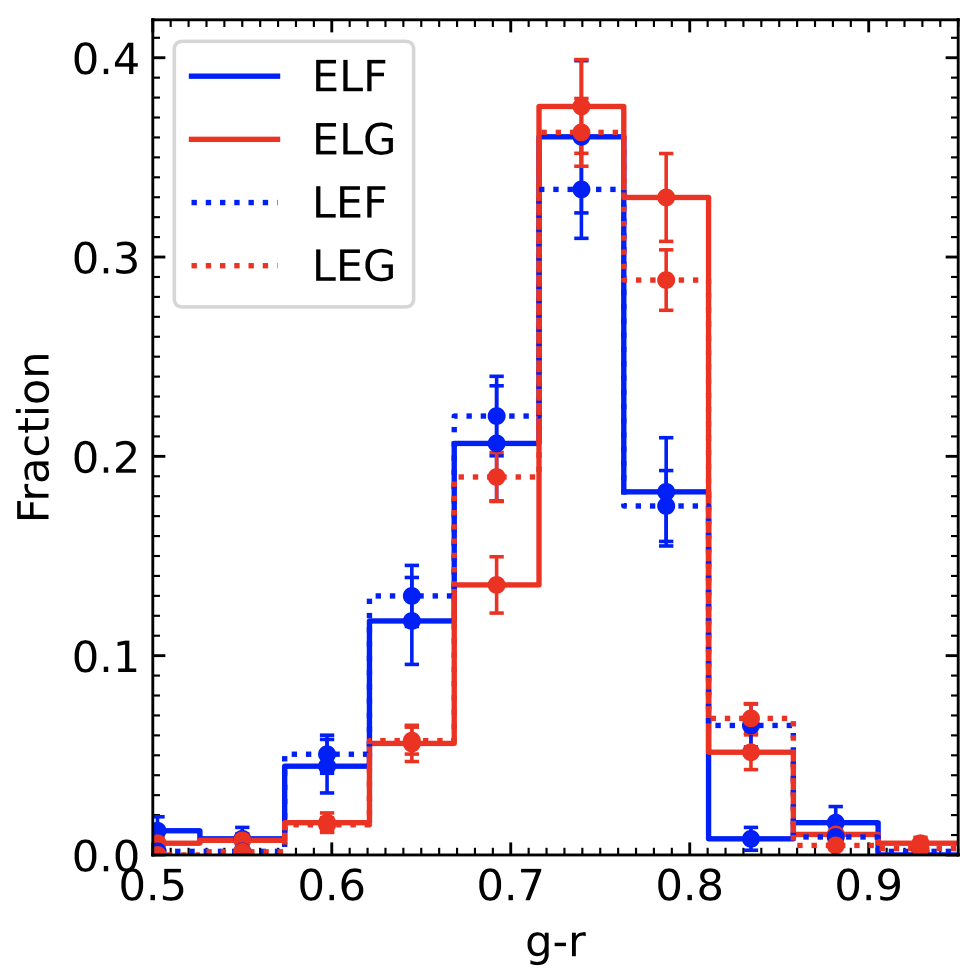
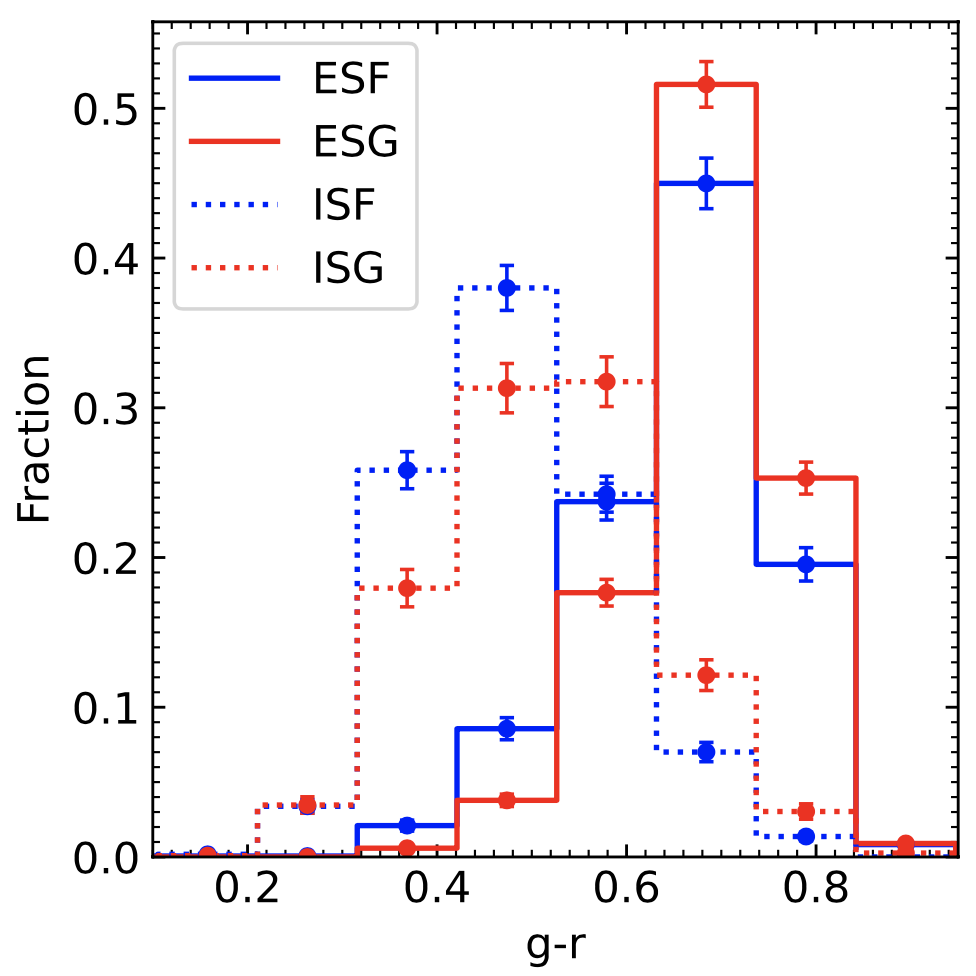
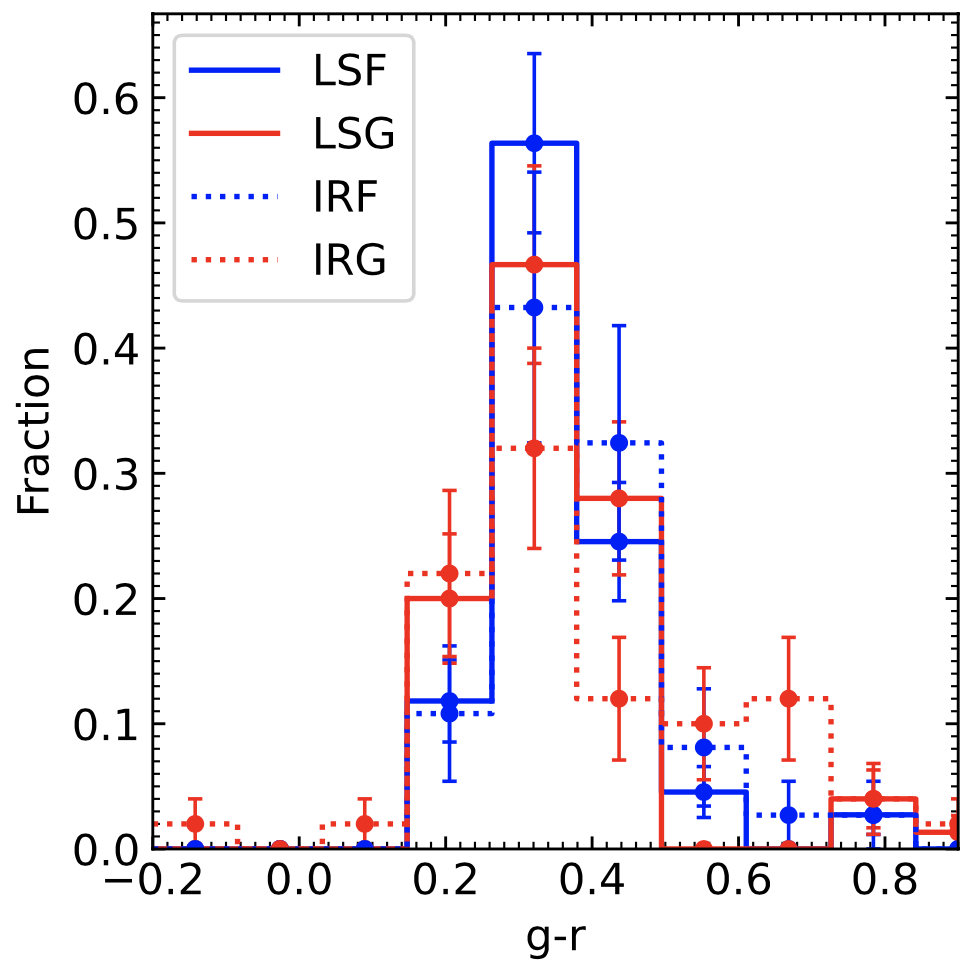
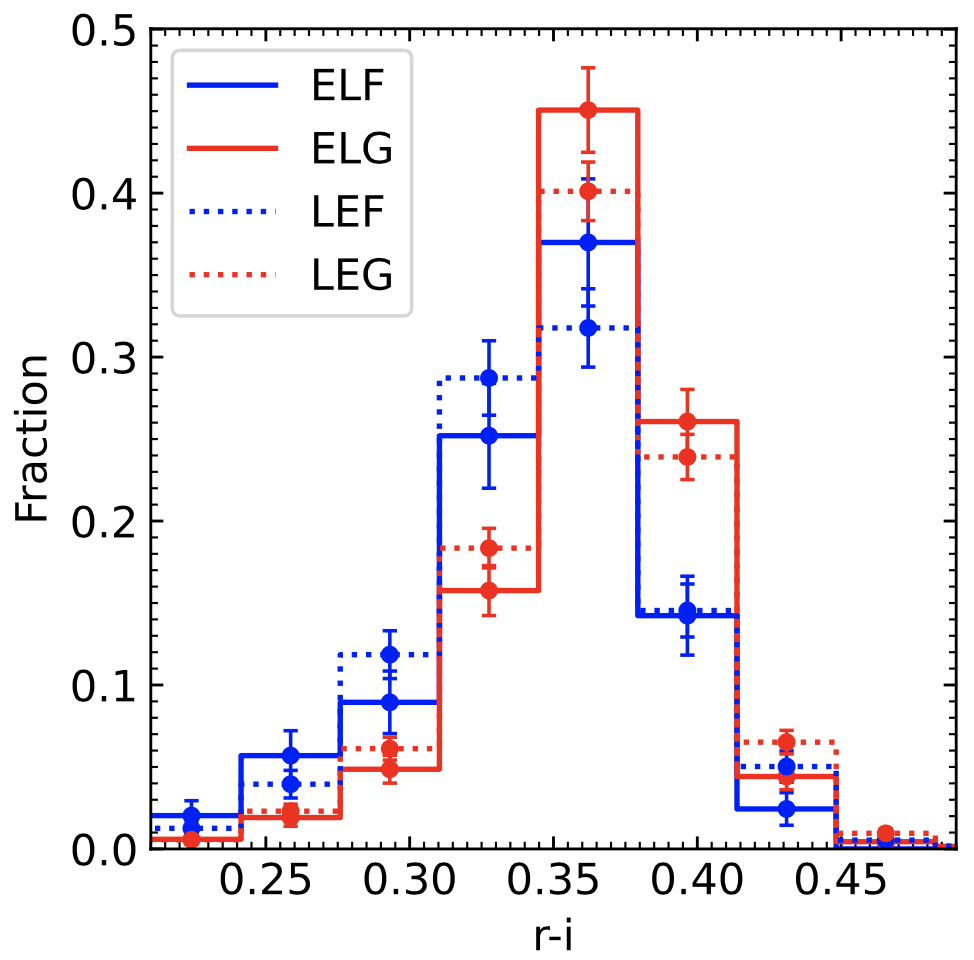
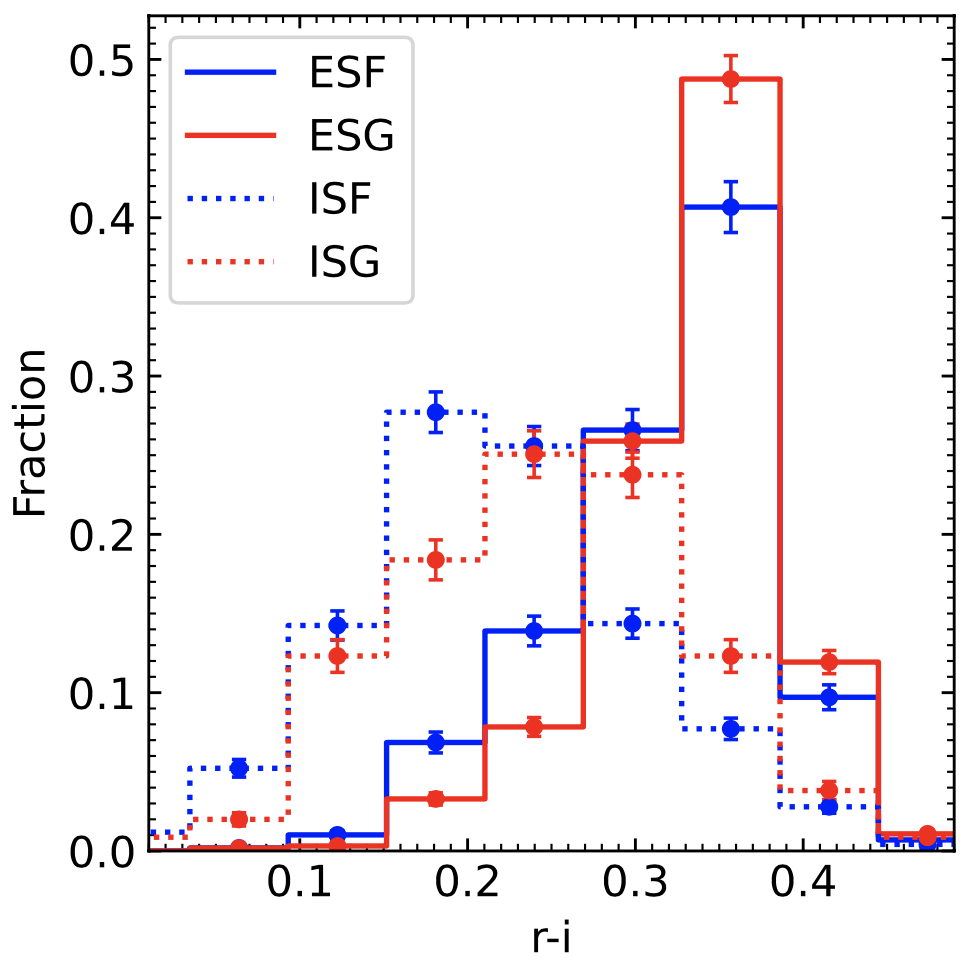
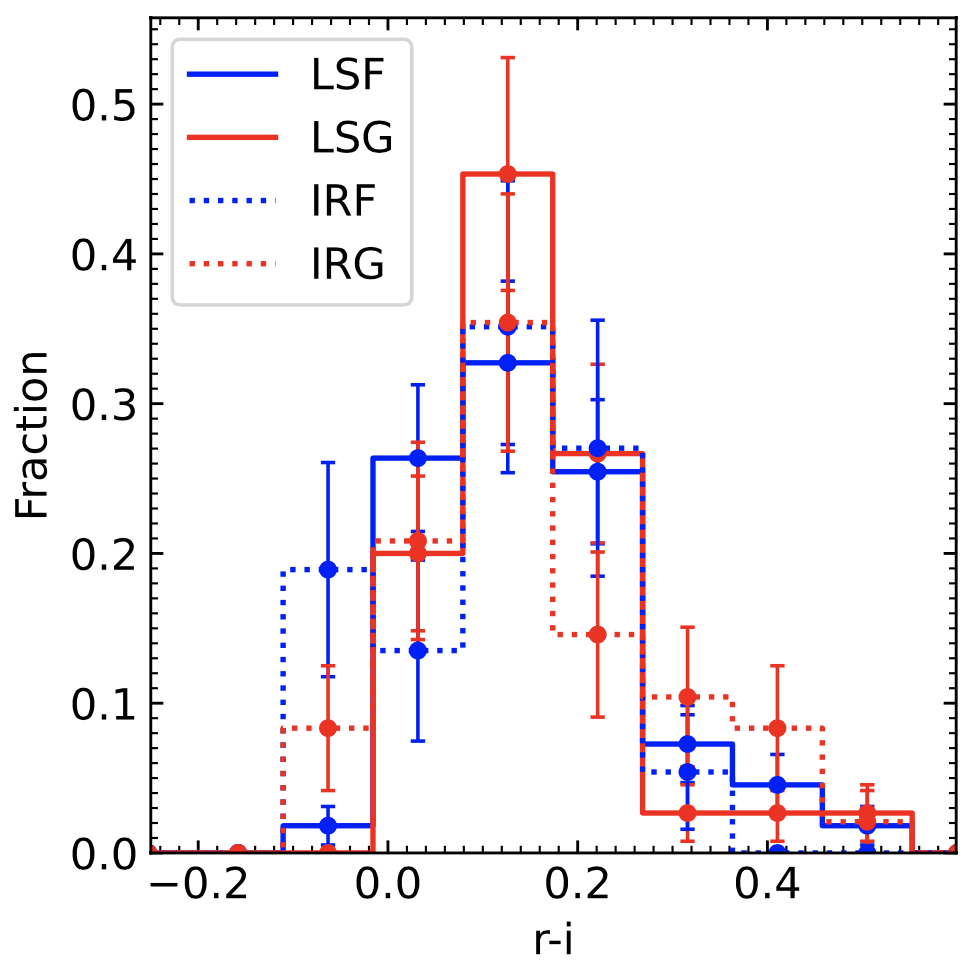
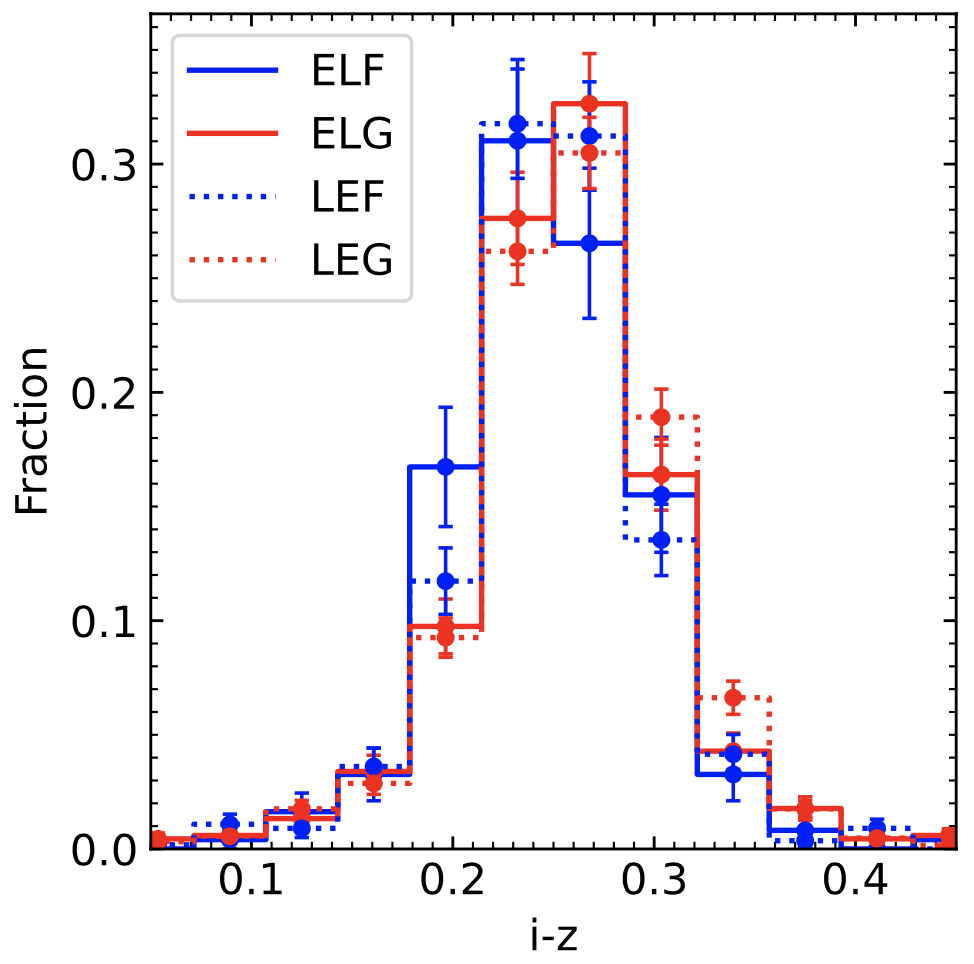
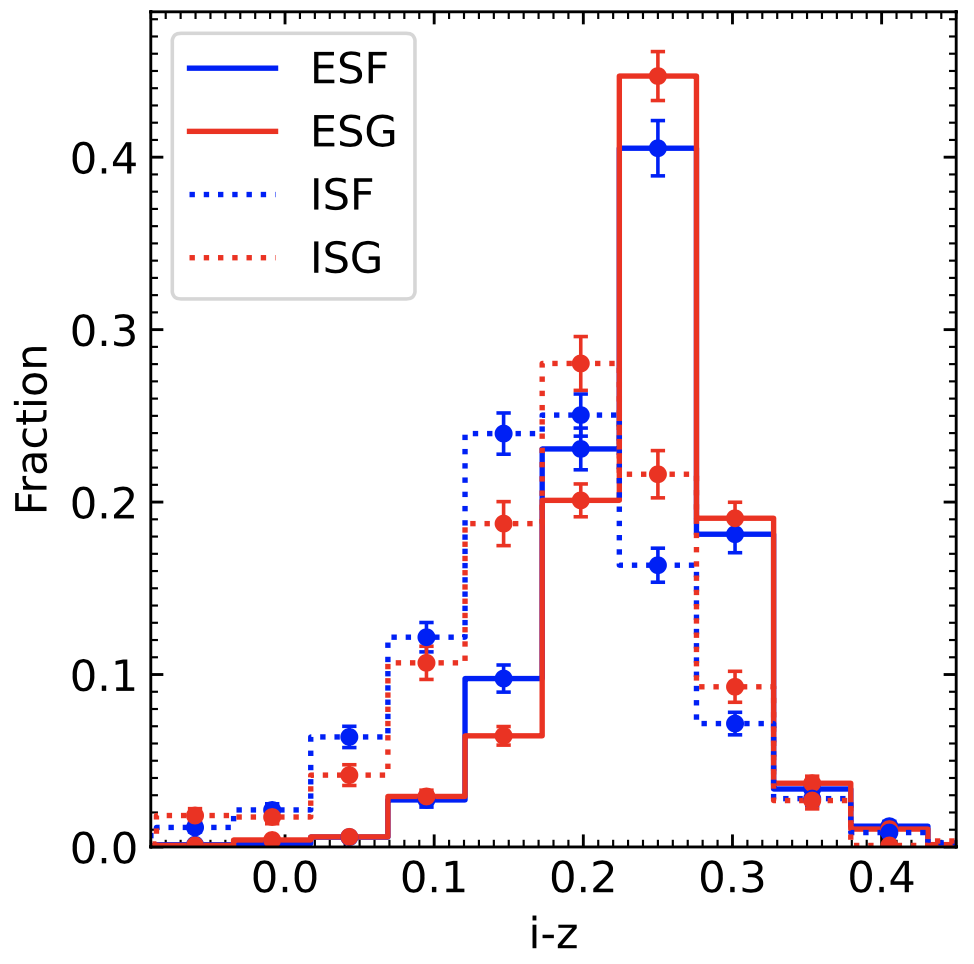
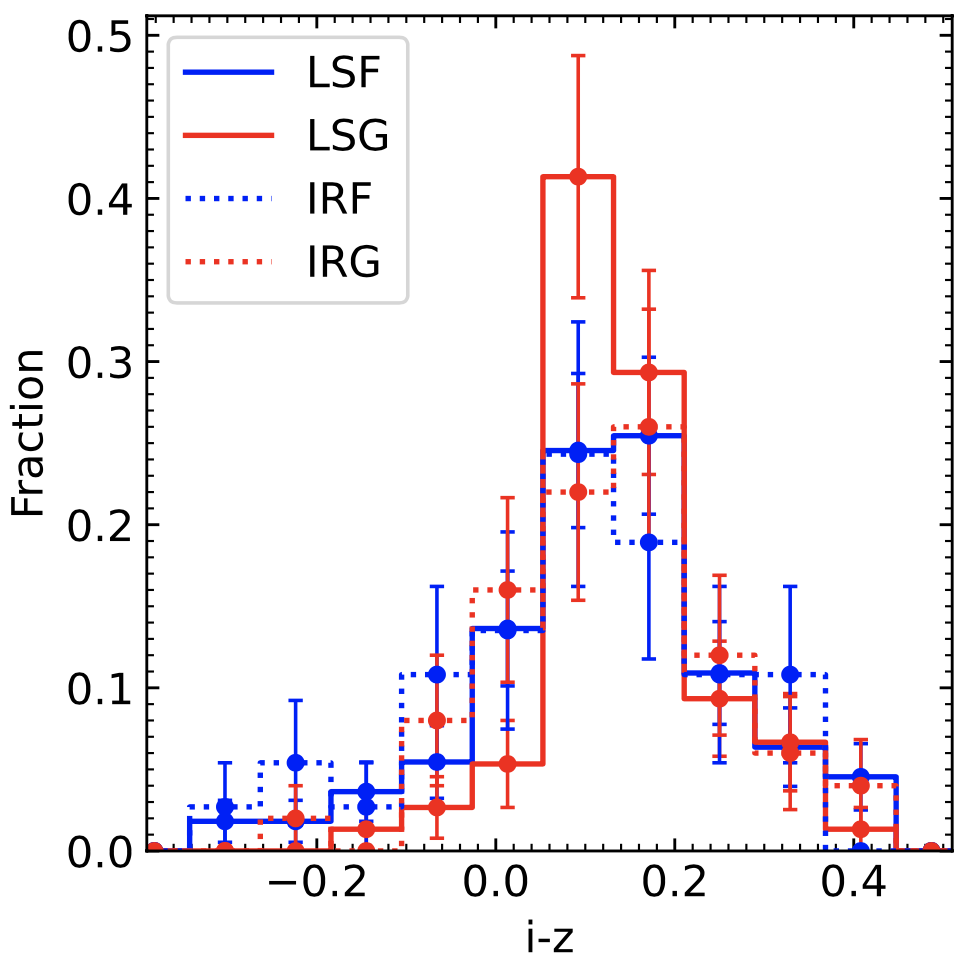
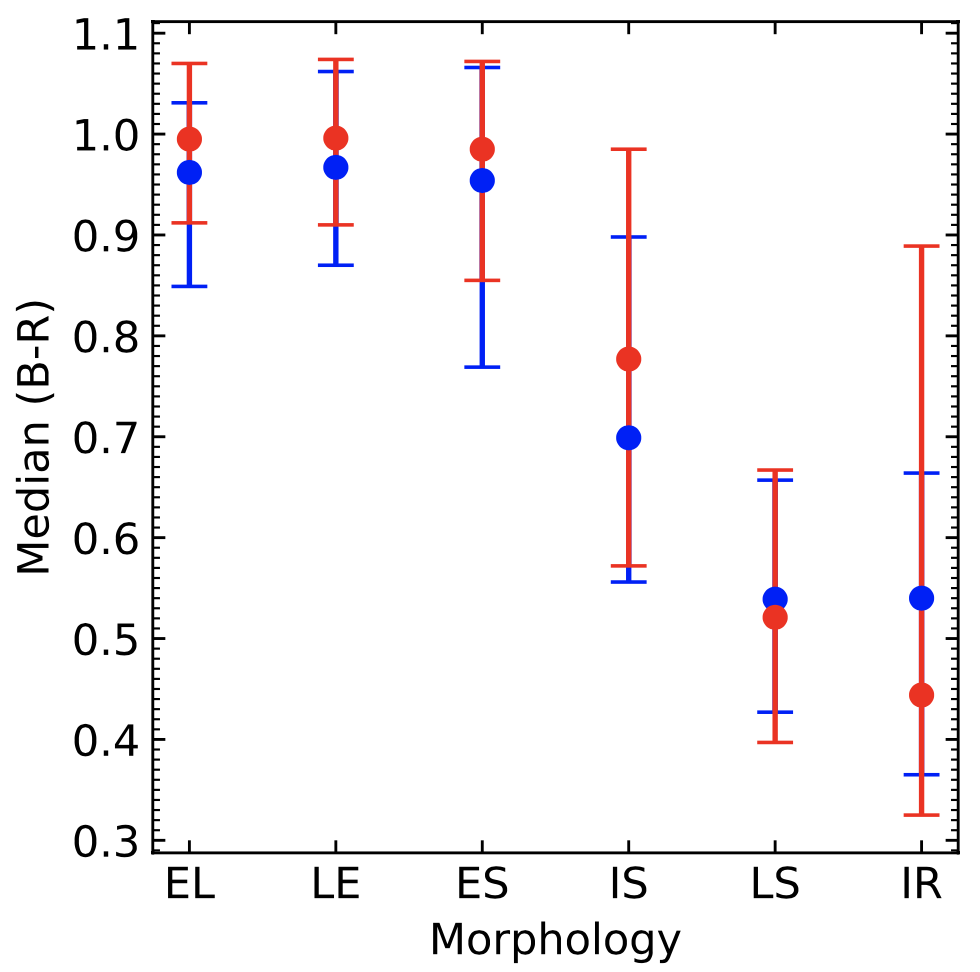
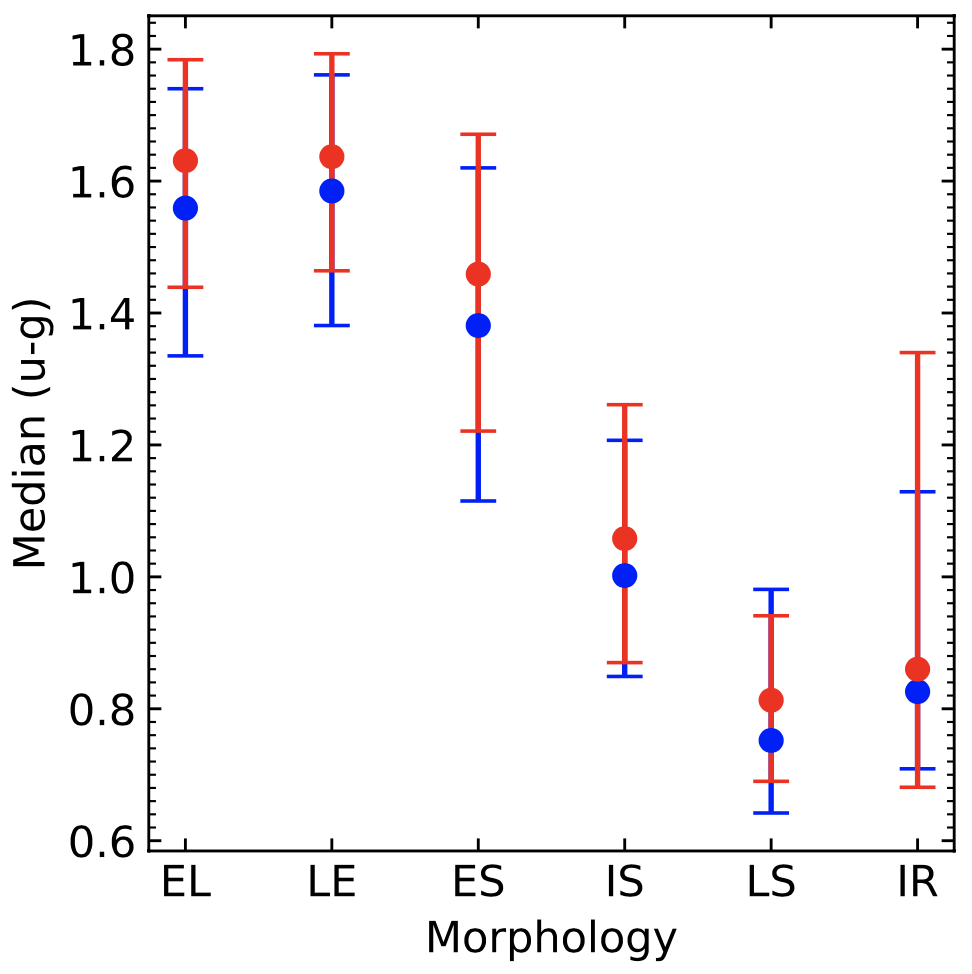
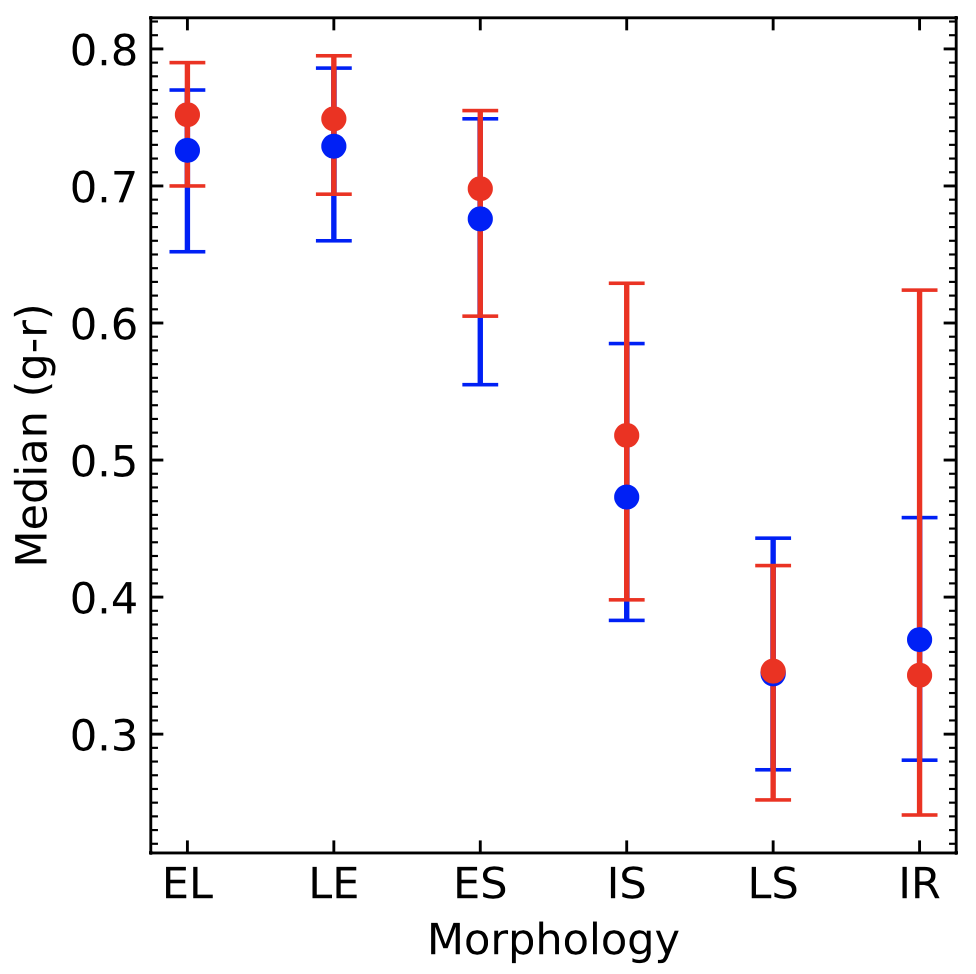
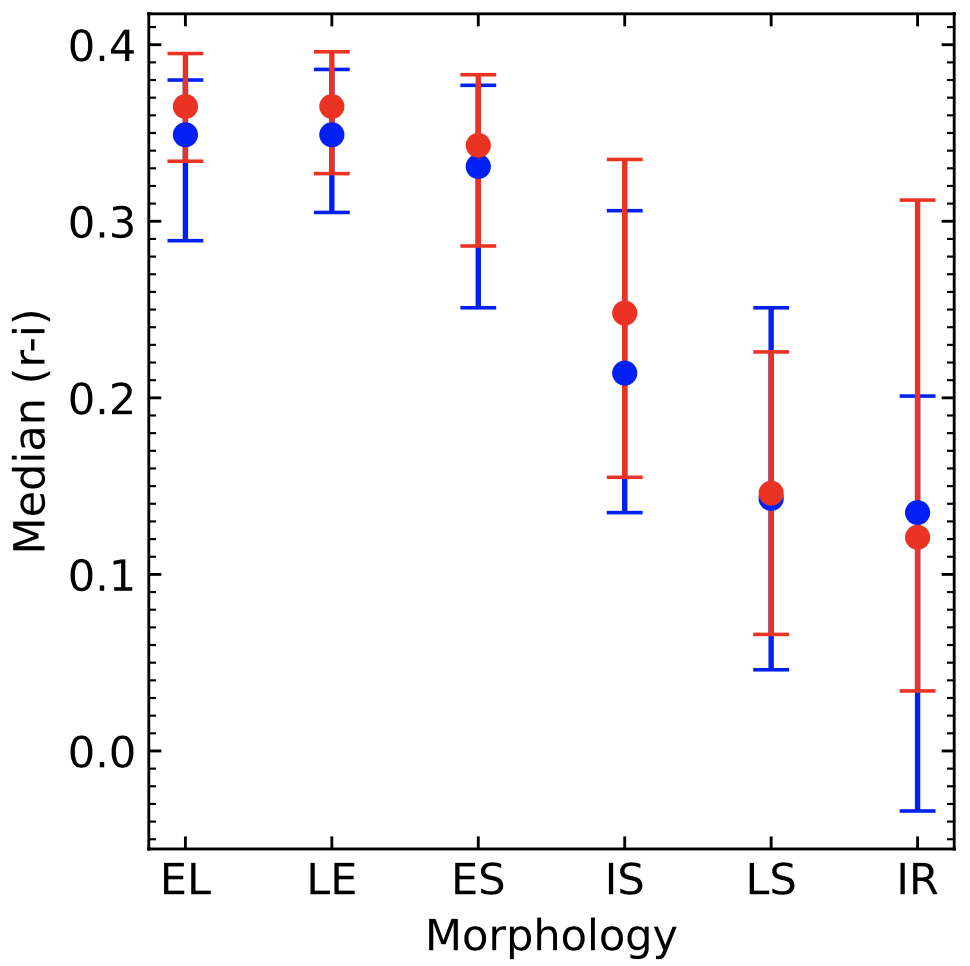
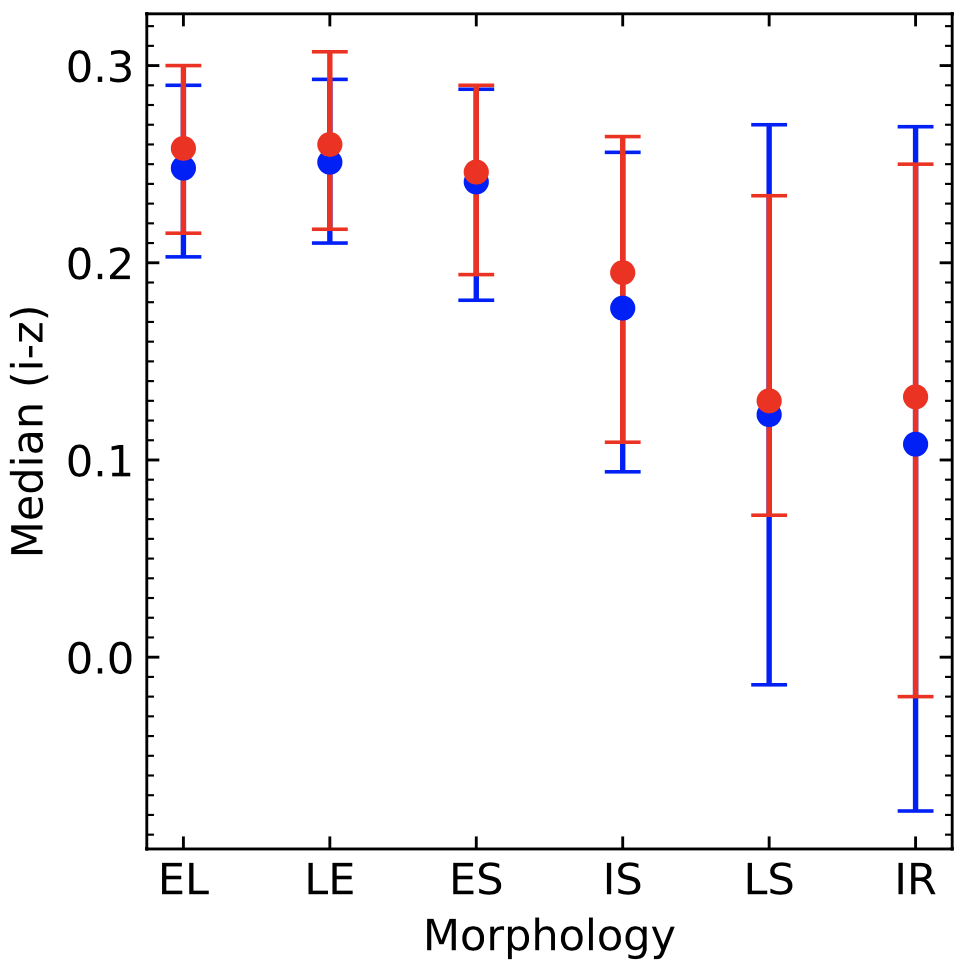
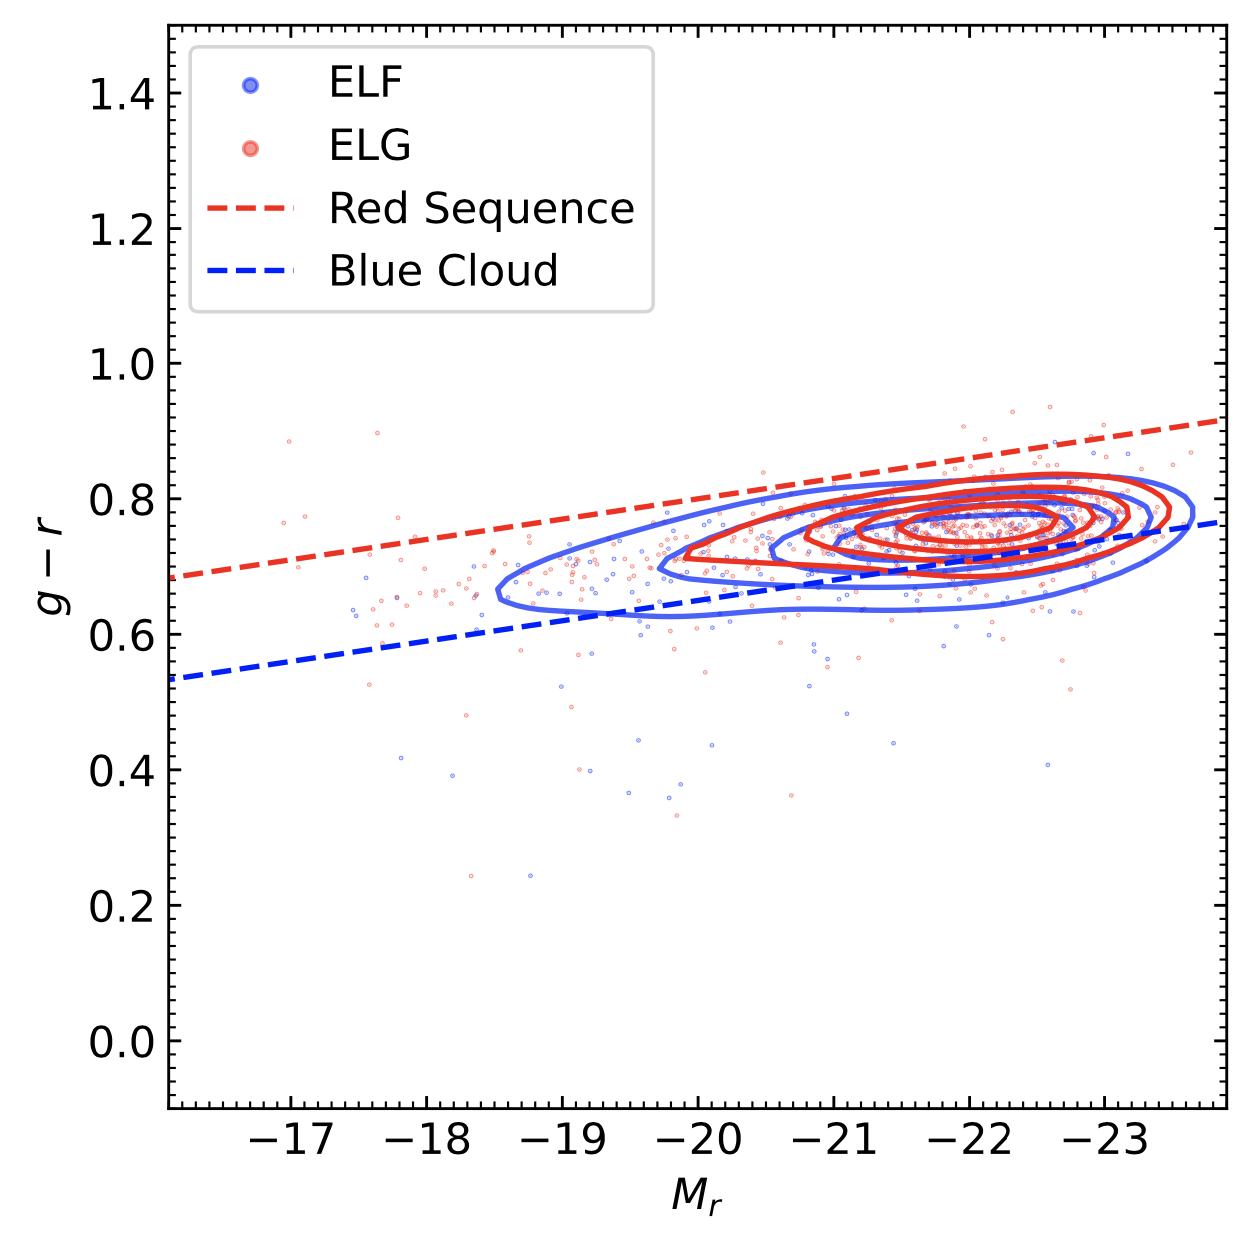
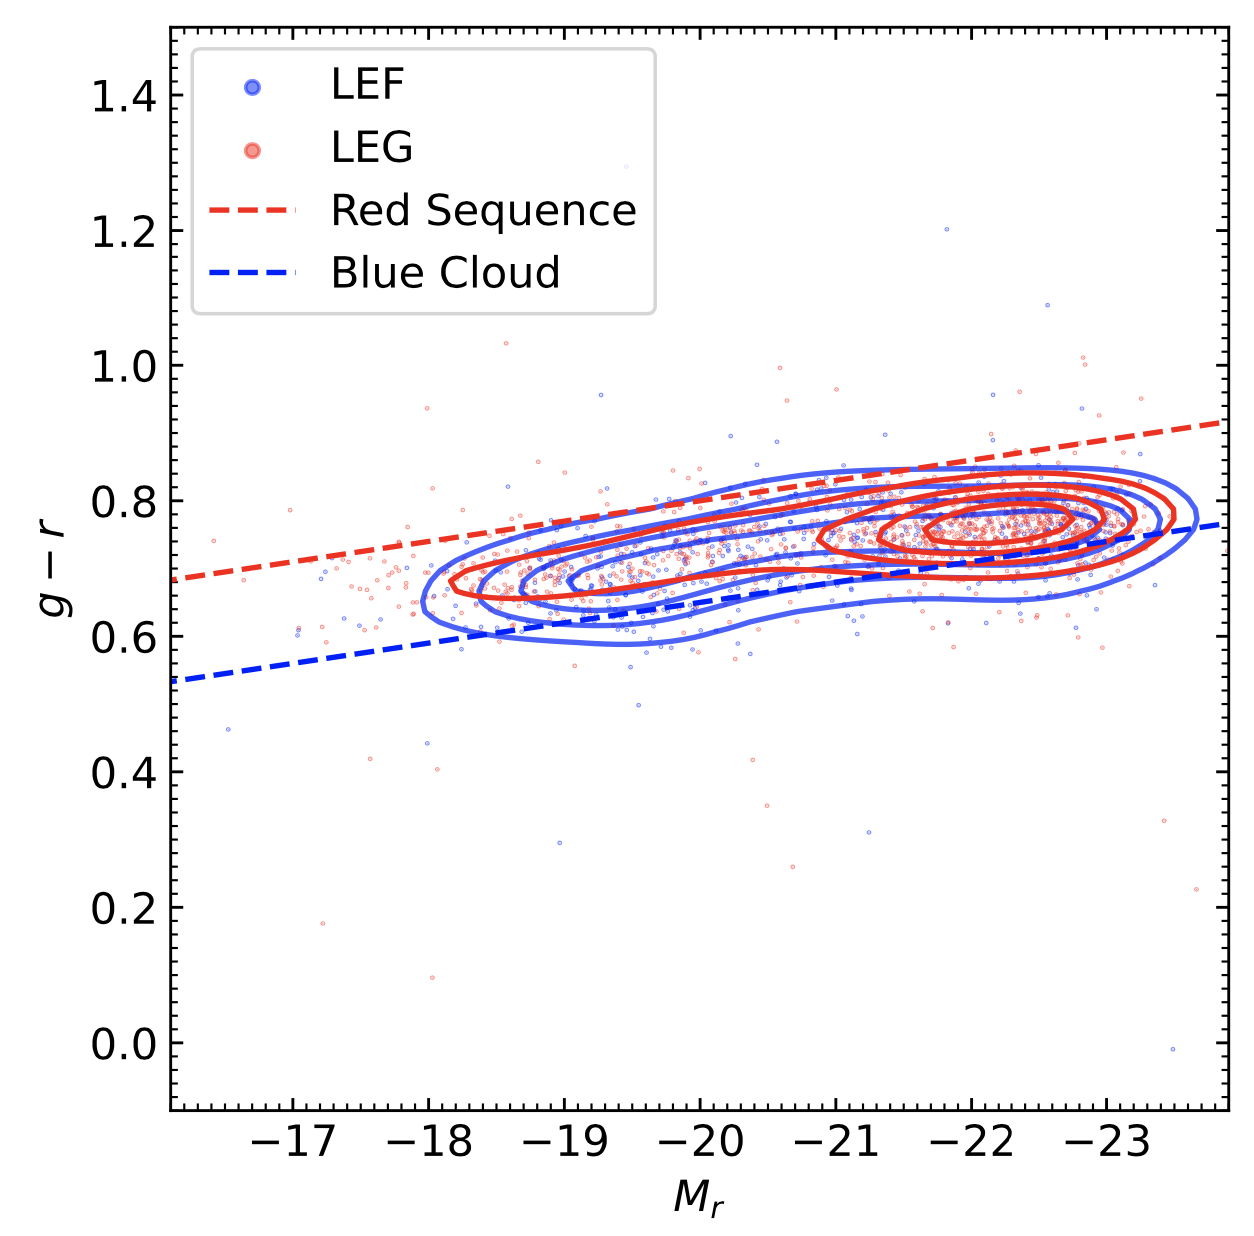
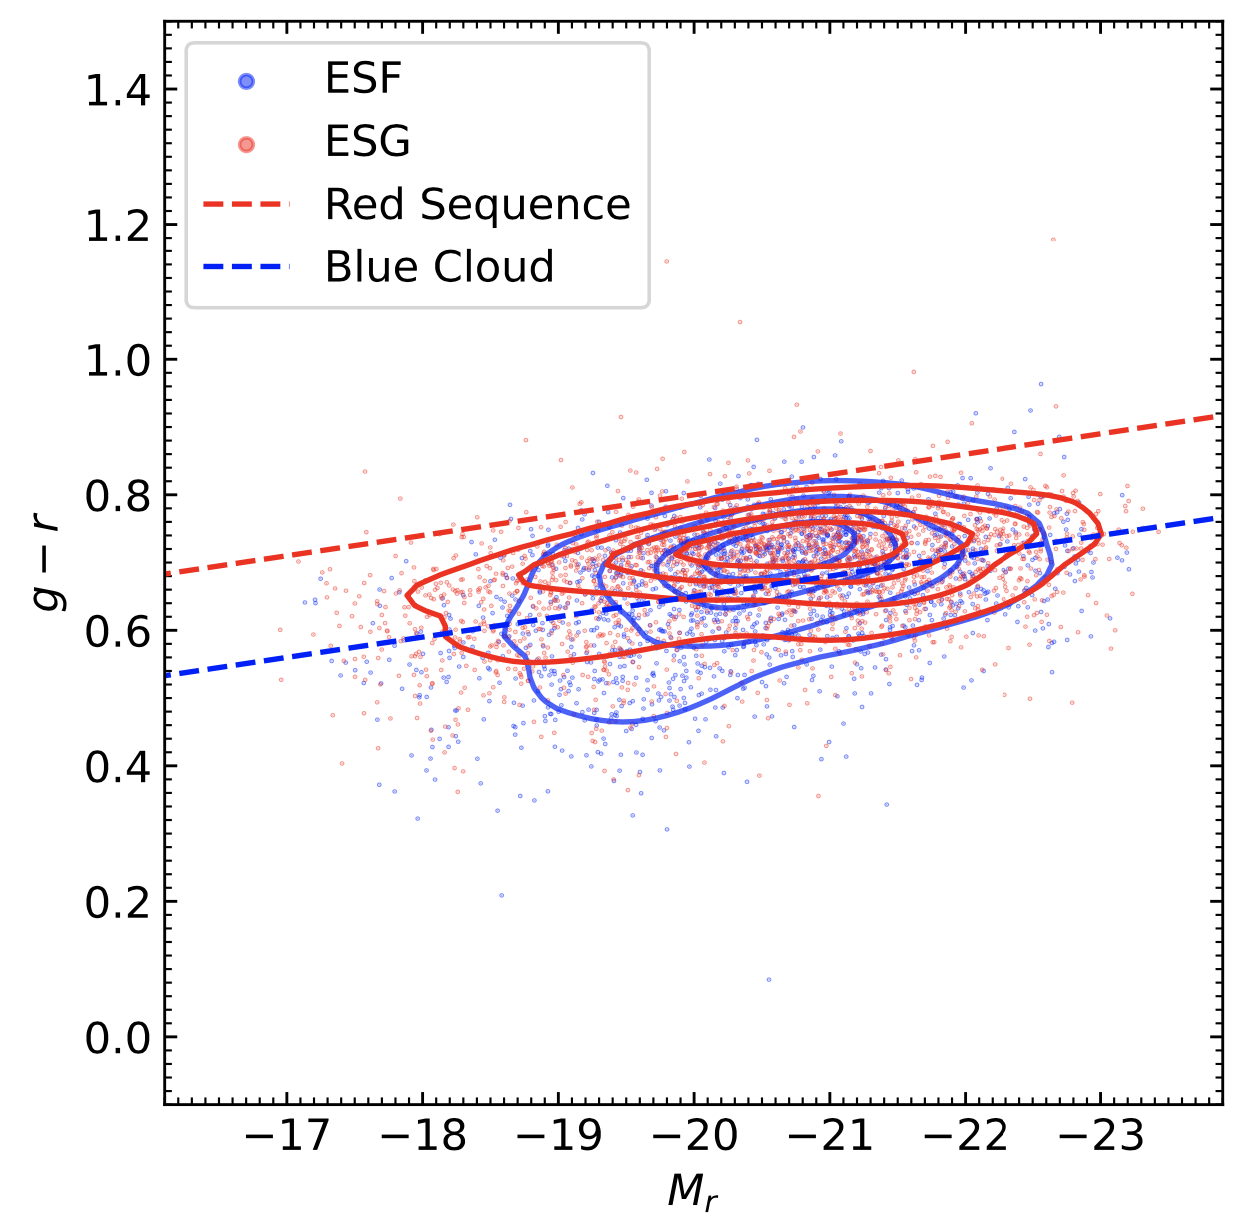
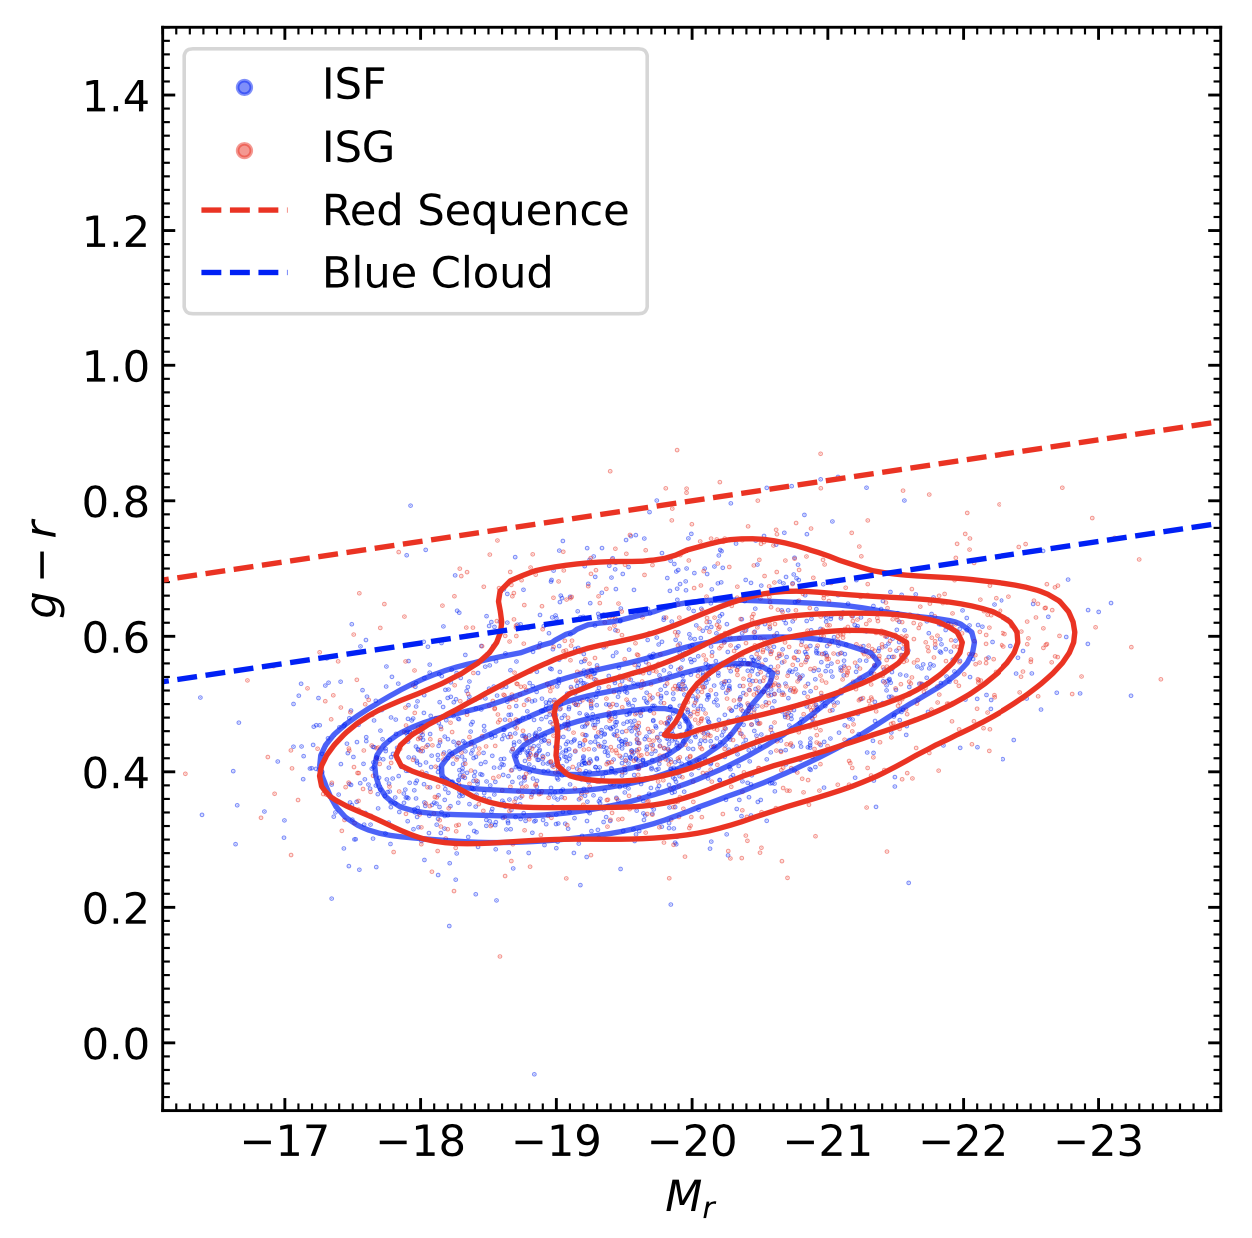
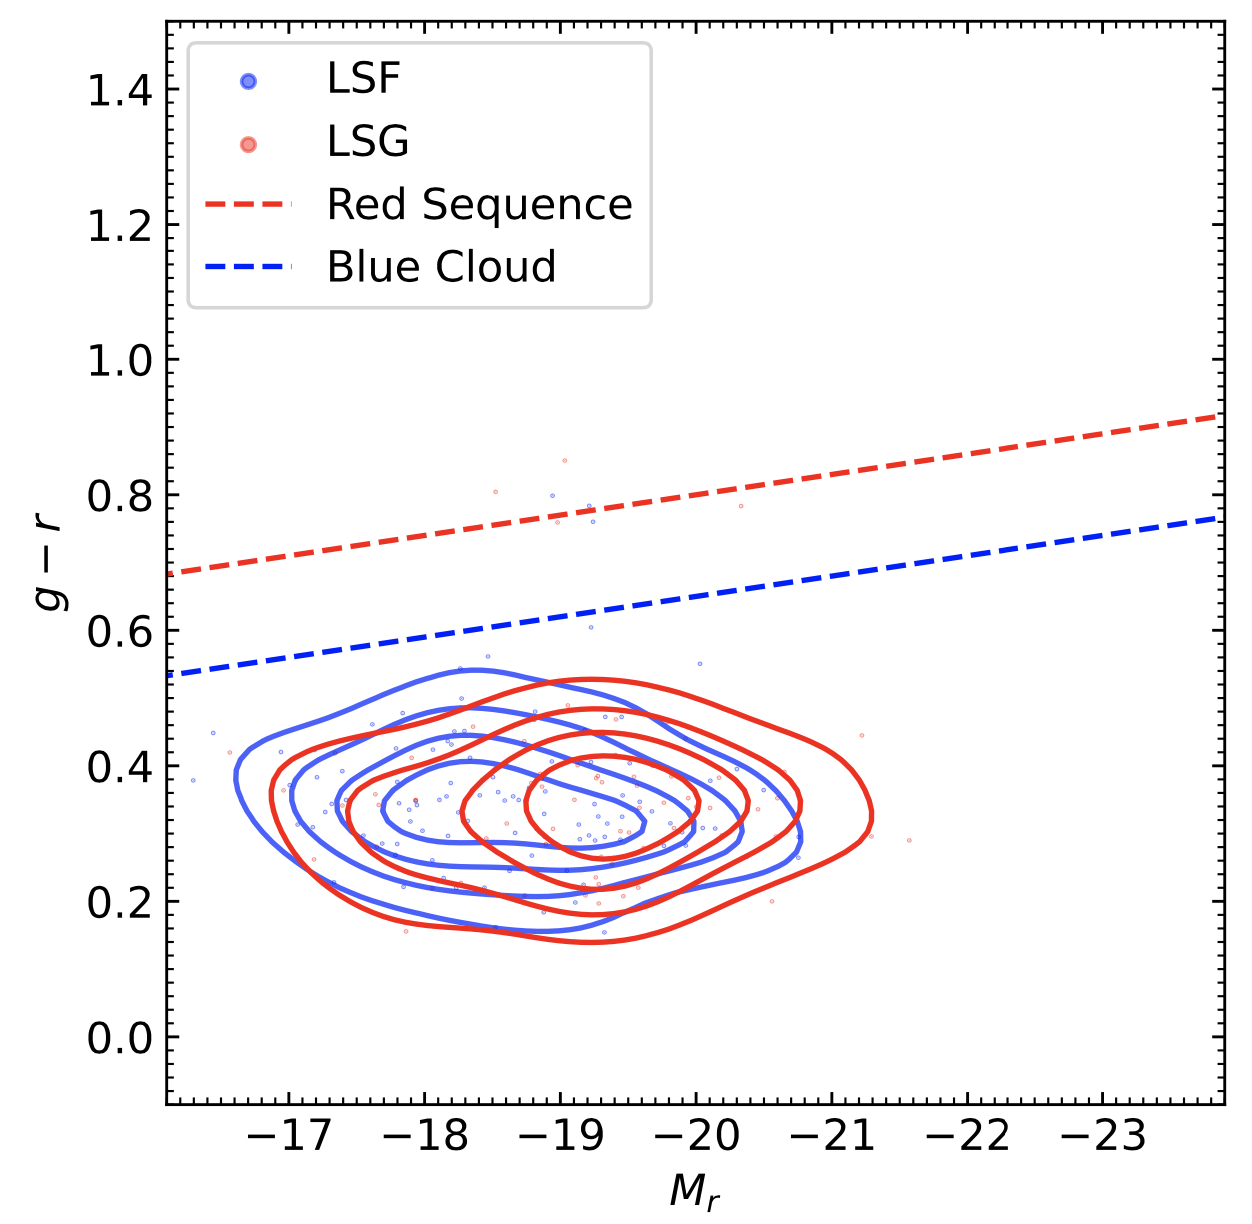
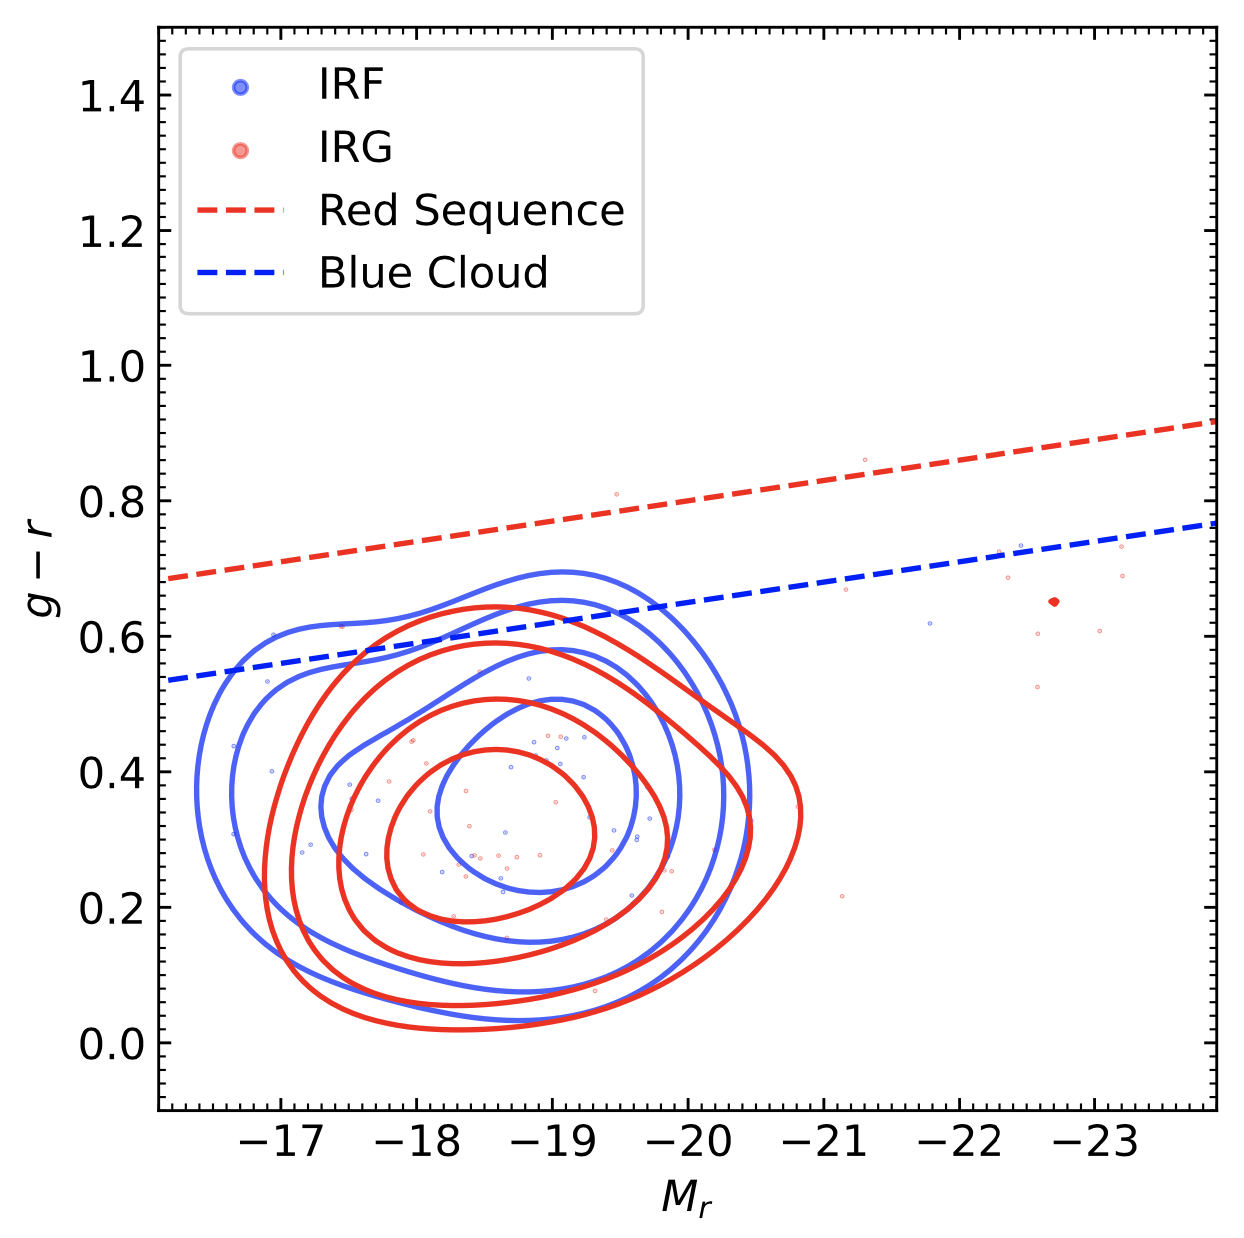
In this section, we compare the distributions of galaxy colours (, , , , , ) between the field and group galaxies as shown by Figs. 2, 3, 4, 5, 6 and 7 respectively. The Johnson , and filters were computed by pypipe3D from the MaNGA data cubes [57], following the Vega photometric system and employing the filter parameters specified in Ref. [61], while the , , and were obtained from the NASA-Sloan Atlas (NSA) [62]. We performed the Kolmogorov-Smirnov (KS) test [63, 64] as shown in Table 1 and Anderson–Darling (AD) [65, 66, 67, 68] statistical test as shown in Table 2, to assess the degree of similarity of field and group galaxies’ colours distributions keeping in mind that the lower (close to zero) KS, AD statistics values and the higher p-values () indicate that the two distributions are similar so there is weak dependence on environment, while the higher KS, AD statistics values and the lower p-values () indicate that the two distributions are different which implies that there is a strong dependence on environment [64, 67, 68]. Further, we compare the colour-magnitude diagrams between field and group galaxies for EL, LE, ES, IS, LS and IR as shown by Fig. 9 wherein the Blue cloud and Red sequence galaxies are defined by criteria (1) and (2) respectively, obtained from Refs. [69, 36] as follows:
| (1) | |||
| (2) |
where is the -band absolute magnitude.

| KS statistics (p-values) | ||||||
| Colour | EL | LE | ES | IS | LS | IR |
| (1) | (2) | (3) | (4) | (5) | (6) | (7) |
| () | () | () | () | () | () | |
| () | () | () | () | () | () | |
| () | () | () | () | () | () | |
| () | () | () | () | () | () | |
| () | () | () | () | () | () | |
| () | () | () | () | () | () | |
| AD statistics (p-values) | ||||||
| Colour | EL | LE | ES | IS | LS | IR |
| (1) | (2) | (3) | (4) | (5) | (6) | (7) |
| () | () | () | () | () | () | |
| () | () | () | () | () | () | |
| () | () | () | () | () | () | |
| () | () | () | () | () | () | |
| () | () | () | () | () | () | |
| () | () | () | () | () | () | |
| EL | LE | ES | IS | LS | IR | |||||||
| Colour | F | G | F | G | F | G | F | G | F | G | F | G |
| (1) | (2) | (3) | (4) | (5) | (6) | (7) | (8) | (9) | (10) | (11) | (12) | (13) |
| EL | LE | ES | IS | LS | IR | |||||||
| Position | F | G | F | G | F | G | F | G | F | G | F | G |
| (1) | (2) | (3) | (4) | (5) | (6) | (7) | (8) | (9) | (10) | (11) | (12) | (13) |
| Red sequence | ||||||||||||
| Blue cloud | ||||||||||||
| Green valley | ||||||||||||
| Total | ||||||||||||
IV Discussion
From Section II.2 it is observed that the Early-type spiral galaxies dominate the galaxy population () followed by the intermediate-type spiral (), Lenticular (), Elliptical (), Late-type spiral () and Irregular () galaxies. This supports the results of Ref. [55] in which it was obtained that spiral galaxies dominate the galaxy population using a sample of galaxies from the MaNGA survey. Similarly, this is in line with the studies by Refs. [70, 71] presenting the MaNGA PyMorph photometric Value Added Catalogue (MPP-VAC-DR17) and the MaNGA Deep Learning Morphological VAC (MDLM-VAC-DR17) as detailed in Ref. [71], as they obtained that Late-type galaxies (in this case ES, IS, LS, and IR) dominate the galaxies population than the Early-type galaxies (in this case EL and LE).
From Section II.3, it is well established that , , , and of EL, LE, ES and IR are in a group environment while and of IS and LS reside in the field environment. This result is in line with the findings by Refs. [72, 73], in which one side of the existence of a relation between environment and galaxy morphology was established when studying galaxies in 55 rich clusters. They further obtained that the elliptical galaxies tend to live in a dense environment while spirals in a less dense environment. Similarly, the majority of studies observed a varying fractions of spiral and elliptical galaxies in different environment obtaining of elliptical galaxies to be in group environment when compared to of spiral galaxies, again of spirals to be in the field environment while less than for the case of elliptical galaxies [74, 75, 76, 77, 78, 79, 80]. We observe that not all spiral galaxies exist preferentially in the field environment but the Intermediate-type and Late-types spirals while Early-type spirals exist preferentially in the group environment.
The observations from KS and AD statistical tests in Tables 1 and 2 respectively indicate that the galaxies’ colours have the average KS statistics (p-value) of (), (), (), (), () and () for EL, LE, ES, IS, LS and IR respectively as well as average AD statistics of (), (), (), (), () and () for EL, LE, ES, IS, LS and IR respectively. Since the average KS and AD statistics are much greater than zero and the p-values are less than , this implies that the colours of EL, LE, ES and IS depend on the environment. In contrast, as the average KS and AD statistics are closer to zero and the p-values are greater than , there is a weak dependence of LS and IR’s colours on the environment. This is in consistence with the observations from the distributions in Figs. 2, 3, 4, 5, 6, and 7.
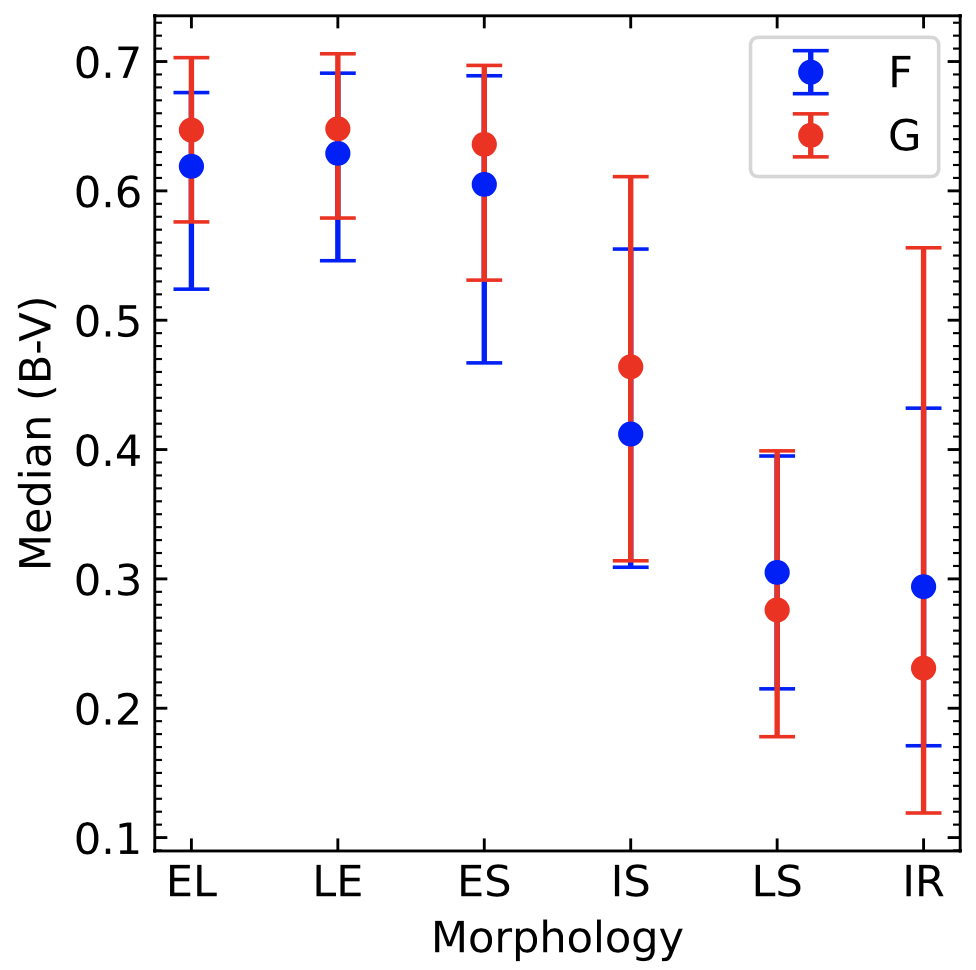
From Table 3 and Fig. 8, it is well observed that group EL, LE, IS and SE are redder than the field ones. This implies that group early types are redder than field galaxies, supporting the results from Refs. [81, 82, 30, 83, 84]. Ref. [81] pointed out that early-type galaxies in groups are redder than field ones when analysing the galaxy sample from Nearby Optical Galaxy (NOG) catalogue [85]. For the case of LS and IR there is no clear trend. This observation is made from the associated overlapping of uncertainty which does not make any significant difference. These results imply that the dependence of galaxies’ colours on the environment is influenced by morphology.
Observations from the colour-magnitude planes in Fig. 9 and Table 4 are that the EL, LE and ES galaxies populate the green valley while the IS, LS and IR populate the blue sequence supporting the results by Refs. [86, 87, 88], that morphological changes is associated with colour transformations. It is observed that group galaxies are more found in green valley and red sequence than field galaxies which are more found in blue cloud. Using the chi-square statistical test () the following statistics and p-values were obtained: (), (), (), (), (), () for EL, LE, ES, IS, LS and IR respectively. Since the p-values are less than the standard p-value in statistics () for EL, LE, ES and IS the difference in number of galaxies between field and group is significant. On the other hand, for the case of LS and IR the difference is insignificant since the p-values are greater than . It is obvious that the blue cloud to red sequence transformation depends on the environment for the Elliptical, Lenticular, Early-type spiral and Intermediate-type while for Late-type and Irregular galaxies the transformation is not influenced by the environment. The study revealed that the dependence of the colour-magnitude planes on the environment is influenced by morphology.
V Summary and Conclusion
In this study, we used integral field spectroscopy (IFS) data from Mapping Nearby Galaxies at Apache Point Observatory (MaNGA) to investigate if morphology influences the environmental dependence of galaxy colours and the colour-magnitude planes. The galaxies were classified into six morphologies where the images are shown in Fig. 1 at which cD and E (Elliptical), SO (Lenticular), Sa, Sab, and Sb (Early-type spiral), Sbc and Sc (Intermediate-type spiral), Scd and Sd (Late-type spirals), Sdm, Sm and Irr (Irregular) detailed in Refs. [55, 57] which follow Ref. [56] classification scheme. The galaxy environments are quantified for all six morphologies that are Elliptical (EL), Lenticular (LE), Early-type spirals (ES), Intermediate-type spirals (IS), Late-type spirals (LS) and Irregular (IR) using the Galaxy Environment for MaNGA Value Added Catalogue (GEMA-VAC) as detailed in Refs. [54, 58, 59] where galaxies having no nearby galaxy (GS ) are field and the ones with more than one neighbour (GS ) are group galaxies. The following numbers of galaxies were obtained, EL: , , LE: , , ES: , , IS: , , LS: , , IR: , for field, group galaxies. These numbers were used to compare the distributions between field (F) and group (G) environments for six colour indices (, , , , , ) as shown by Figs. 2, 3, 4, 5, 6 and 7. We employed the Kolmogorov-Smirnov (KS) [63, 64] and Anderson–Darling (AD) [65, 66, 67, 68] statistical tests to assess of the degree of similarities or differences between field and group environments, shown by Tables 1 and 2 respectively and the median colours were compared in Fig. 8 and Table 3. Further, the colour-magnitude planes in Fig. 9 were analysed, in which the red sequence and blue cloud were defined based on Refs. [69, 36, 4] criteria given by Eqs. (1) and (2). Table 4 shows the positioning of galaxies on the colour-magnitude diagram in which we employed the statistical test to assess the significance of the difference obtained between field and group environment. Together with the already established results this study revealed the following:
-
•
Not all spiral galaxies exist preferentially in field environments but the Intermediate-type and Late-type spirals while Early-type exist preferentially in group environments.
-
•
The galaxy colours depend on the environment when Elliptical, Lenticular, Early-type and Intermediate-type spirals are considered, but for Late-type spiral and Irregular galaxies, the dependence of colour on the environment is very weak.
-
•
The blue cloud to red sequence transformation of Elliptical, Lenticular, Early-type and Intermediate-type spirals depends on the environment while for Late-type and Irregular galaxies, there is a weak dependence.
This study revealed that the dependence of colours and colour-magnitude planes on the environment is influenced by morphology. In the future, the study will be extended to high redshift to analyse if the redshift influences the observed relations.
Acknowledgements
PP acknowledges support from The Government of Tanzania through the India Embassy, Mbeya University of Science and Technology (MUST) for Funding. UDG is thankful to the Inter-University Centre for Astronomy and Astrophysics (IUCAA), Pune, India for the Visiting Associateship of the institute. Funding for the Sloan Digital Sky Survey IV has been provided by the Alfred P. Sloan Foundation, the U.S. Department of Energy Office of Science, and the Participating Institutions. SDSS-IV acknowledges support and resources from the Center for High-Performance Computing at the University of Utah. SDSS-IV is managed by the Astrophysical Research Consortium for the Participating Institutions of the SDSS Collaboration, including the Brazilian Participation Group, the Carnegie Institution for Science, Carnegie Mellon University, Center for Astrophysics – Harvard & Smithsonian, the Chilean Participation Group, the French Participation Group, Instituto de Astrofísica de Canarias, The Johns Hopkins University, Kavli Institute for the Physics and Mathematics of the Universe (IPMU)/University of Tokyo, the Korean Participation Group, Lawrence Berkeley National Laboratory, Leibniz Institut für Astrophysik Potsdam (AIP), Max-Planck-Institut für Astronomie (MPIA Heidelberg), Max-Planck-Institut für Astrophysik (MPA Garching), Max- Planck-Institut für Extraterrestrische Physik (MPE), National Astronomical Observatories of China, New Mexico State University, New York University, University of Notre Dame, Observatário Nacional/MCTI, The Ohio State University, Pennsylvania State University, Shanghai Astronomical Observatory, United Kingdom Participation Group, Universidad Nacional Autónoma de México, University of Arizona, University of Colorado Boulder, University of Oxford, University of Portsmouth, University of Utah, University of Virginia, University of Washington, University of Wisconsin, Vanderbilt University, and Yale University.
References
- [1] I. Strateva, Ž. Ivezić, G. Knapp, V. Narayanan, et al., Color separation of galaxy types in the Sloan Digital Sky Survey imaging data, ApJ 122, 1861 (2001) [arXiv:astro-ph/0107201].
- [2] C. Correa, J. Schaye, B. Clauwens, R. Bower, et al., The relation between galaxy morphology and colour in the EAGLE simulation, MNRAS 472, L45 (2017) [arXiv:1704.06283].
- [3] B. Dullo, A. Bouquin, A. De Paz, J. Knapen, et al., The Black Hole Mass-Color Relations for Early- and Late-type Galaxies: Red and Blue Sequences, ApJ 898, 83 (2020) [arXiv:2006.10128].
- [4] C. Bom, A. Cortesi, U. Ribeiro, L. Dias, et al., An extended catalogue of galaxy morphology using deep learning in southern photometric local universe survey data release 3 , MNRAS 528, 4188 (2024) [arXiv:2306.08684].
- [5] C. Mendes de Oliveira, T. Ribeiro, W. Schoenell, A. Kanaan, et al., The Southern Photometric Local Universe Survey (S-PLUS): improved SEDs, morphologies, and redshifts with 12 optical filters, MNRAS 489, 241 (2019) [arXiv:1907.01567].
- [6] C. Liu, L. Hao, H. Wang, X. Yang, The morphological transformation and the quenching of galaxies, ApJ 878, 69 (2019) [arXiv:1905.11008 ].
- [7] C. Correa, J. Schaye, J. Trayford, The origin of the red-sequence galaxy population in the EAGLE simulation, MNRAS 484, 4401 (2019) [arXiv:1810.07189].
- [8] R. Smethurst, K. Masters, B. Simmons, I. Garland, et al., Quantifying the poor purity and completeness of morphological samples selected by galaxy colour, MNRAS 510, 4126 (2022) [arXiv:2112.04507].
- [9] S. Mei, N. Hatch, S. Amodeo, A. Afanasiev, et al., Morphology-density relation, quenching, and mergers in CARLA clusters and protoclusters at , A&A 670, A58 (2023) [arXiv:2209.02078].
- [10] E. Sazonova, K. Alatalo, J. Lotz, K. Rowlands, et al., The Morphology–Density Relationship in Clusters, ApJ 899, 85 (2020) [arXiv:2007.03698].
- [11] A. Paulino-Afonso, D. Sobral, B. Darvish, B. Ribeiro, et al., VIS3COS-II. Nature and nurture in galaxy structure and morphology, A&A 630, A57 (2019) [arXiv:1907.10062].
- [12] Y. Gu, G. Fang, Q. Yuan, S. Lu, et al., The Effect of Environment on Star Formation Activity and Morphology at in CANDELS, ApJ 921, 60 (2021) [arXiv:2109.11261].
- [13] M. Postman, M. Geller, The morphology-density relation - The group connection, ApJ 281, 95 (1984).
- [14] T. Goto, C. Yamauchi, Y. Fujita, S. Okamura, et al., The morphology—density relation in the Sloan Digital Sky Survey, MNRAS 346, 601 (2003).
- [15] N. Ball, J. Loveday, R. Brunner, Galaxy colour, morphology and environment in the Sloan Digital Sky Survey, MNRAS 383, 907 (2008).
- [16] N. Grogin, D. Kocevski, S. Faber, H. Ferguson, et al., CANDELS: The Cosmic Assembly Near-infrared Deep Extragalactic Legacy Survey, ApJS 197, 35 (2011) [arXiv:1105.3753].
- [17] A. Koekemoer, S. Faber, H. Ferguson, N. Grogin, et al., CANDELS: the cosmic assembly near-infrared deep extragalactic legacy survey-the Hubble Space Telescope observations, imaging data products, and mosaics, ApJS 197, 36 (2011) [arXiv:1105.3754].
- [18] K. Cooke, J. Kartaltepe, C. Rose, K. Tyler, et al., The Roles of Morphology and Environment on the Star Formation Rate–Stellar Mass Relation in COSMOS from , ApJ 942, 49 (2023) [arXiv:2211.16527].
- [19] N. Scoville, H. Aussel, M. Brusa, P. Capak, et al., The cosmic evolution survey (COSMOS): overview, ApJSS 172, 1 (2007).
- [20] D. Pérez-Millán, J. Fritz, R. González-Lópezlira, A. Moretti, et al., The relation between morphology, star formation history, and environment in local Universe galaxies, MNRAS 521, 1292 (2023) [arXiv:2302.06687].
- [21] S. Bhattacharjee, B. Pandey, S. Sarkar, et al., Can a conditioning on stellar mass explain the mutual information between morphology and environment?, JCAP 2020, 039 (2020) [arXiv:2004.05016].
- [22] M. Brown, R. Webster, B. Boyle, The clustering of colour-selected galaxies, MNRAS 317, 782 (2000).
- [23] M. Blanton, D. Eisenstein, D. Hogg, D. Schlegel, et al., Relationship between environment and the broadband optical properties of galaxies in the Sloan Digital Sky Survey, ApJ 629, 143 (2005) [arXiv:astro-ph/0310453].
- [24] X. Deng, The environmental dependence of different colors in the CMASS sample of the SDSS DR9, RAA 14, 553 (2014) [arXiv:1401.0344].
- [25] S. Bamford, A. Rojas, R. Nichol, C. Miller, et al., Revealing components of the galaxy population through non-parametric techniques, MNRAS 391, 607 (2008).
- [26] R. Skibba, R. Sheth, A halo model of galaxy colours and clustering in the Sloan Digital Sky Survey, MNRAS 392, 1080 (2009).
- [27] J. Tinker, C. Conroy, P. Norberg, S. Patiri, et al., Void statistics in large galaxy redshift surveys: does halo occupation of field galaxies depend on environment?, ApJ 686, 53 (2008) [arXiv:0707.3445 ].
- [28] S. Weinmann, F. Van-Den-Bosch, X. Yang, H. Mo, Properties of galaxy groups in the Sloan Digital Sky Survey—I. The dependence of colour, star formation and morphology on halo mass, MNRAS 366, 2 (2006).
- [29] I. Zehavi, Z. Zheng, D. Weinberg, J. Frieman, et al., The luminosity and color dependence of the galaxy correlation function, ApJ 630, 1 (2005) [arXiv:astro-ph/0408569].
- [30] B. Pandey, S. Sarkar, Exploring galaxy colour in different environments of the cosmic web with SDSS, MNRAS 498, 6069 (2020). [arXiv:2002.08400].
- [31] F. Zhang, X. Deng, color dependence of galaxy clustering in the main galaxy sample of SDSS DR10, Astrophysics 58, 21 (2015).
- [32] R. Skibba, S. Bamford, R. Nichol, C. Lintott, et al., Galaxy Zoo: disentangling the environmental dependence of morphology and colour, MNRAS 399, 966 (2009) [arXiv:0811.3970].
- [33] C. Lintott, K. Schawinski, S. Bamford, A. Slosar et al. Galaxy Zoo 1: data release of morphological classifications for nearly 900 000 galaxies, MNRAS 410, 166 (2011) [arXiv:1007.3265].
- [34] S. Bamford, R. Nichol, I. Baldry, K. Land, et al., Galaxy Zoo: the dependence of morphology and colour on environment, MNRAS 393, 1324 (2009).
- [35] O. Bait, S. Barway, Y. Wadadekar, On the interdependence of galaxy morphology, star formation and environment in massive galaxies in the nearby Universe, MNRAS 471, 2687 (2017) [arXiv:1707.00568].
- [36] S. Dhiwar, K. Saha, A. Dekel, A. Paswan, et al., Witnessing the star formation quenching in L ellipticals, MNRAS 518, 4943 (2023) [arXiv:2211.08884].
- [37] S. Driver, S. Bellstedt, A. Robotham, I. Baldry, et al., Galaxy And Mass Assembly (GAMA): Data Release 4 and the total and morphological galaxy stellar mass functions, MNRAS 513, 439 (2022) [arXiv:2203.08539].
- [38] I. Baldry, J. Liske, M. Brown, A. Robotham, S. Driver, et al., Galaxy And Mass Assembly: the G02 field, Herschel–ATLAS target selection and data release 3, MNRAS 474, 3875 (2018) [arXiv:1711.09139].
- [39] S. Driver, D. Hill, L. Kelvin, A. Robotham, et al., Galaxy and Mass Assembly (GAMA): survey diagnostics and core data release, MNRAS 413, 971 (2011).
- [40] S. Driver, D. Hill, L. Kelvin, A. Robotham, et al., GAMA: towards a physical understanding of galaxy formation, A&G 50, 5 (2009).
- [41] P. Bhambhani, I. Baldry, S. Brough, A. Hill, et al., Red riding on hood: exploring how galaxy colour depends on environment, MNRAS 522, 4116 (2023) [arXiv:2210.16112].
- [42] X. Deng, J. He, X. Wen, X. Tang, et al., Comparisons of the environmental dependence of galaxy properties between galaxies above and below M⋆, MNRAS 395, L90 (2009).
- [43] M. Bernardi, R. Sheth, J. Annis, S. Burles, et al., Early-type galaxies in the Sloan Digital Sky Survey. IV. Colors and chemical evolution, AJ 125, 1882 (2003) [arXiv:astro-ph/0301629].
- [44] X. Deng, C. Luo, Y. Xin, P. Wu, Environmental Dependence of Different Colors for the Apparent Magnitude-Limited Main Galaxy Sample of the SDSS DR7, Open Astronomy 2, 133 (2013).
- [45] X. Deng, Z. Wu, Environmental Dependence of Different Colors of Active Galactic Nucleus (AGN) Host Galaxies, Astrophysics 66, 173 (2023).
- [46] C. O’Kane, U. Kuchner, M. Gray, A. Aragón-Salamanca, The effect of cosmic web filaments on galaxy evolution, MNRAS 534, 1682 (2024) [arXiv:2409.09028].
- [47] K. Bundy, M. Bershady, D. Law, R. Yan, et al., Overview of the sdss-iv manga survey: mapping nearby galaxies at apache point observatory, ApJ 798, 7 (2014) [arXiv:1412.1482].
- [48] M. Blanton, M. Bershady, B. Abolfathi, F. Albareti, et al., Sloan Digital Sky Survey IV: Mapping the Milky Way, nearby galaxies, and the distant universe, AJ 154, 28 (2017) [arXiv:1703.00052].
- [49] N. Drory, N. MacDonald, MA. Bershady, K. Bundy, et al., The MaNGA integral field unit fiber feed system for the Sloan 2.5 m telescope, AJ 149, 77 (2015) [arXiv:1412.1535].
- [50] R. Yan, K. Bundy, D. Law, M. Bershady, B. Andrews, et al., SDSS-IV MaNGA IFS galaxy survey—Survey design, execution, and initial data quality, AJ 152, 197 (2016) [arXiv:1607.08613].
- [51] D. Wake, K. Bundy, A. Diamond-Stanic, R. Yan, et al., The SDSS-IV MaNGA sample: design, optimization, and usage considerations, AJ 154, 86 (2017) [arXiv:1707.02989].
- [52] P. Teerikorp, Eddington-Malmquist bias in a cosmological context, A & A 576, A75 (2015) [arXiv:1503.02812].
- [53] N. Abdurro’uf, K. Accetta, C. Aerts, V. Silva Aguirre, et al., The seventeenth data release of the Sloan Digital Sky Surveys: Complete release of MaNGA, MaStar, and APOGEE-2 data, AJ 259, 35 (2022) [arXiv:2112.0202].
- [54] M. Argudo-Fernández, S. Verley, G. Bergond, S. Puertas, et al., Catalogues of isolated galaxies, isolated pairs, and isolated triplets in the local Universe, A&A 578, A110 (2015) [arXiv:1504.00117].
- [55] J. Vázquez-Mata, H. Hernández-Toledo, V. Avila-Reese, M. Herrera-Endoqui, et al., SDSS IV MaNGA: visual morphological and statistical characterization of the DR15 sample, MNRAS 512, 2222 (2022) [arXiv:2203.02565].
- [56] E. Hubble, Extra-galactic nebulae, ApJ 64, 326 (1926).
- [57] S. Sánchez, J. Barrera-Ballesteros, E. Lacerda, A. Mejía-Narvaez, et al., SDSS-IV MaNGA: pyPipe3D analysis release for 10000 galaxies, ApJ 262, 32 (2022) [arXiv:2206.0706].
- [58] J. Etherington, D. Thomas, Measuring galaxy environments in large-scale photometric surveys, MNRAS 451, 660 (2015) [arXiv:1505.01171].
- [59] H. Wang, H. Mo, X. Yang, Y. Zhang, et al., ELUCID—exploring the local universe with reconstructed initial density field. III. Constrained simulation in the SDSS volume, ApJ 831,164 (2016) [arXiv:1608.01763].
- [60] X. Yang, H. Mo, F. Van den Bosch, A. Pasquali, et al., Galaxy groups in the SDSS DR4. I. The catalog and basic properties, AJ 671, 153 (2007) [arXiv:0707.4640].
- [61] M. Fukugita, K. Shimasaku, T. Ichikawa, Galaxy colors in various photometric band systems, PASP 107, 945 (1995).
- [62] M. Blanton, E. Kazin, D. Muna, B. Weaver, et al., Improved background subtraction for the sloan digital sky survey images, AJ 142, 31 (2011) [arXiv:1105.1960].
- Hodges. [1958] J. Hodges, The significance probability of the Smirnov two-sample test, Arkiv för matematik 3, 469 (1958).
- Harari and Mollerach. [2009] D. Harari, S. Mollerach, Kolmogorov-Smirnov test as a tool to study the distribution of ultra-high energy cosmic ray sources, A & A 394, 916 (2009) [arXiv:0811.0008].
- [65] T. Anderson, D. Darling, Asymptotic theory of certain” goodness of fit” criteria based on stochastic processes, The Annals of Mathematical Statistics 23, 193 (1952).
- [66] A. Pettitt, A two-sample Anderson-Darling rank statistic, Biometrika 63, 161 (1976).
- [67] F. Scholz, M. Stephens, K-Sample Anderson–Darling Tests, J. Am. Stat. Assoc 82, 918 (1987).
- [68] G. Babu, E. Feigelson, Astrostatistics: Goodness-of-fit and all that, ASPCS 351, 127 (2006).
- [69] M. Blanton, R. Lupton, D. Schlegel, M. Strauss, et al., The Properties and Luminosity Function of Extremely Low Luminosity Galaxies, ApJ 631, 208 (2005) [arXiv:astro-ph/0410164].
- [70] J. Fischer, H. Domínguez-Sánchez, M. Bernardi, SDSS-IV MaNGA PyMorph Photometric and Deep Learning Morphological Catalogues and implications for bulge properties and stellar angular momentum, MNRAS 483, 2057 (2019) [arXiv:1811.02580].
- [71] H. Domínguez-Sánchez, B. Margalef, M. Bernardi, M. Huertas-Company, SDSS-IV DR17: final release of MaNGA PyMorph photometric and deep-learning morphological catalogues, MNRAS 509, 4024 (2021) [arXiv:2110.10694].
- [72] A. Dressler, Galaxy morphology in rich clusters-Implications for the formation and evolution of galaxies, ApJ 236, 351 (1980).
- [73] C. Park, Y. Choi, M. Vogeley, .R Gott III, et al., Environmental dependence of properties of galaxies in the Sloan Digital Sky Survey, ApJ 658, 898 (2007) [arXiv:astro-ph/0611610].
- [74] R. Calvi, B. Vulcani, B. Poggianti, A. Moretti, et al., Galaxy and Mass Assembly (GAMA): Demonstrating the Power of WISE in the Study of Galaxy Groups to , ApJ 898, 20 (2020) [arXiv:2006.07535].
- [75] J. Nantais, H. Flores, R. Demarco, C. Lidman, et al., Morphology with light profile fitting of confirmed cluster galaxies at , A&A 555, A5 (2013) [arXiv:1305.0826].
- [76] D. Wilman, P Erwin, The Relation between Galaxy Morphology and Environment in the Local Universe: An RC3-SDSS Picture, ApJ 746, 160 (2012) [arXiv:1112.3990].
- [77] A. van der Wel, P. Holden, M. Franx, D. Illingworth et al., The evolution of the field and cluster morphology-density relation for mass-selected samples of galaxies, ApJ 670, 206 (2007) [arXiv:0707.2787].
- [78] W. Pearson, L. Wang, S. Brough, B. Holwerda, et al., Galaxy and Mass Assembly: Group and field galaxy morphologies in the star-formation rate - stellar mass plane, A&A 646, A151 (2021) [arXiv:2101.03804].
- [79] P. van-Dokkum, M. Franx, D. Fabricant, G. Illingworth, et al., Hubble Space Telescope Photometry and Keck Spectroscopy of the Rich Cluster MS 1054-03: Morphologies, Butcher-Oemler Effect, and the Color-Magnitude Relation at , ApJ 541, 95 (2000) [arXiv:astro-ph/0002507].
- [80] R. Bouwens, G. Illingworth, M. Franx, H. Ford, UV luminosity functions at and from the Hubble ultra deep field and other deep Hubble space telescope ACS fields: evolution and star formation history, ApJ 670, 928 (2007) [arXiv:0707.2080].
- [81] M. Girardi, F. Mardirossian, C. Marinoni, M. Mezzetti, et al., Galaxies in group and field environments: A comparison of optical–NIR luminosities and colors, A&A 410, 461 (2003) [arXiv:astro-ph/0308139].
- [82] M. Balogh, S. McGee, D. Wilman, R. Bower, et al., The colour of galaxies in distant groups, MNRAS 398, 754 (2009) [arXiv:0905.3401].
- [83] W. Cramer, A. Noble, G Rudnick, A. Pigarelli, et al., Resolved UV and Optical Color Gradients Reveal Environmental Influence on Galaxy Evolution at Redshift , ApJ 975, 144 (2024) [arXiv:2404.07355].
- [84] V. Coenda, D. Mast, H. Muriel, H. Martínez, Effects of environment on stellar metallicity profiles of late-type galaxies in the CALIFA survey, A&A 642, A132 (2020) [arXiv:2008.06012].
- [85] G. Giuricin, C. Marinoni, L. Ceriani, A. Pisani, Nearby Optical Galaxies: Selection of the Sample andIdentification of Groups, ApJ 543, 178 (2000) [arXiv:astro-ph/0001140].
- [86] V. Sampaio, R. de-Carvalho, I. Ferreras, A. Aragón-Salamanca, et al., From blue cloud to red sequence: evidence of morphological transition prior to star formation quenching, MNRAS 509, 567 (2022) [arXiv:2110.04342].
- [87] S. Eales, M. Baes, N. Bourne, M. Bremer, et al., The causes of the red sequence, the blue cloud, the green valley, and the green mountain, MNRAS 481, 1183 (2018) [arXiv:1809.01171].
- [88] S. Eales, M. Baes, N. Bourne, M. Bremer, et al., The green valley is a red herring: Galaxy Zoo reveals two evolutionary pathways towards quenching of star formation in early-and late-type galaxies, MNRAS 440, 889 (2014) [arXiv:1402.4814].