Design, analysis, and experimental validation of a stepped plate parametric array loudspeaker
Abstract
This study investigates the design and analysis of a stepped plate parametric array loudspeaker (SPPAL) as an alternative to conventional array-based parametric loudspeakers. The SPPAL utilizes a single Langevin-type ultrasonic transducer coupled with a flexural stepped plate to generate narrow-beam audible sound via nonlinear acoustic interaction. To evaluate and optimize the performance of the SPPAL, an integrated modeling framework is developed, consisting of an approximate analytical 3D model for transducer dynamics, an equivalence ratio formulation to relate stepped plate and rigid piston behavior, and a spherical wave expansion method for nonlinear sound field simulation. The dual-resonance behavior of the transducer is optimized through multi-objective analysis to enhance low-frequency audio performance. Experimental validation includes frequency response and modal analysis of the transducer, as well as sound field measurements. The analytical methods are further verified through comparison with experimental data. Furthermore, combination resonance–an unintended structural excitation resulting from intermodulation–is identified as an inherent phenomenon in SPPAL operation. The findings offer practical guidance for the development of efficient, compact, and manufacturable parametric array loudspeakers employing plate-based flexural vibration.
I Introduction
Parametric array loudspeakers (PALs) utilize the nonlinear interaction of high-frequency ultrasonic waves in air to produce audible sound through self-demodulation. Since Westervelt’s seminal work,[1] this principle has offered a fundamentally different approach to sound reproduction–enabling audio beams of exceptional directivity from apertures far smaller than those required by conventional loudspeakers. Such capabilities have positioned PA technology as an attractive solution for targeted audio delivery in applications ranging from museum exhibits and digital signage to personal listening zones and quiet zones.[2, 3, 4, 5, 6] Nonetheless, realizing sufficient sound pressure levels for practical use remains a persistent challenge, owing to the intrinsically low efficiency of nonlinear conversion,[7] thereby motivating continued innovation in transducer design and system architecture.
Traditional PAL configurations employ arrays of single-resonance ultrasonic transducers, which offer practical advantages such as flexible array geometries and the ability to implement advanced control techniques like beam steering or focusing. Commercially available emitters such as Murata’s MA40S4S are widely used due to their stable phase response and compact form factor.[8] In addition, micro-machined ultrasonic transducers (MUTs), including capacitive (CMUTs)[9] and piezoelectric (PMUTs) types,[10, 11] have also been actively investigated for PAL applications to enable miniaturized, high-frequency arrays with improved integration capability. However, these array-based systems are often constrained by increased system complexity, phase-matching requirements among multiple elements, and high implementation costs, especially when precise phase and amplitude matching is required to preserve beam quality.
To address these limitations, a promising alternative has emerged in the form of the stepped plate parametric array loudspeaker (SPPAL),[12] which eliminates the need for complex transducer arrays by employing a single ultrasonic transducer. Initially developed to achieve phase-compensated ultrasonic radiation,[13] the SPPAL incorporates annular steps into a flat plate (FP), allowing it to approximate the coherent output of a rigid piston (RP) radiator. This phase compensation mechanism enables spatially coherent wavefronts despite the use of a flexural structure. By combining this simplified architecture with a single Langevin-type transducer, the SPPAL offers several advantages, including reduced system complexity, a significantly enlarged aperture, and lower implementation cost. These advantages position the SPPAL as a compelling solution to the practical challenges that have thus far limited the commercialization of array-based PAL systems.
Despite the promising advantages of the SPPAL concept, a systematic evaluation of its performance across a wide range of design parameters has not yet been fully explored. This is primarily due to the lack of analytical models that simultaneously offer both high fidelity and computational efficiency–features essential for navigating the complex design space of SPPALs.
To begin with, accurate modeling of the ultrasonic transducer is critical. The SPPAL employs close dual-resonance (DR) operation to amplify both the carrier and sideband components, enhancing the low-frequency audio output of parametric arrays. However, the conventional 1D Langevin model[14] lacks the ability to capture radial-longitudinal coupling and is thus insufficient for exploring extended design parameters. To overcome this limitation, this study adopts an approximate analytical three-dimensional (Approx. 3D) model that incorporates Poisson coupling,[15] allowing for efficient DR prediction without full FEM. Similar modeling approaches have been reported in the literature, highlighting the significance of radial effects in piezoelectric transducers.[16, 17, 18] The present model builds on this foundation to enable broader parametric exploration. In particular, this model facilitates the evaluation of feasible horn-end radii for stepped horn structures. Extremely small radii lead to thin-neck geometries that are difficult and costly to fabricate, making such modeling essential for maintaining the SPPAL’s cost-efficiency.
Second, the stepped plate (SP) structure introduces significant variation in mechanical characteristics due to the addition of annular steps.[19] To mitigate this effect, the steps are constructed from a polymer material with lower density and Young’s modulus than the base plate, thereby minimizing their influence on the plate’s natural frequency and mode shape.[20] Furthermore, due to the high modal sensitivity of higher-order modes in thin plates, classical plate theory (CPT) proves inadequate for accurate modeling. This work instead employs the modified Mindlin plate theory (MMPT) to obtain reliable initial estimates of the structural dimensions.[21] Using this formulation, the plate geometry is designed with respect to the first local maximum distance, the nominal ultrasonic frequency, and the vibrational mode number, allowing global trends to be identified for a wide range of design conditions.
Lastly, the prediction of parametric audio fields requires nonlinear acoustic modeling, which is computationally demanding. Traditional simulation tools, such as the time-domain KZK (Texas code)[22] and frequency-domain KZK (Bergen code)[23, 24] solvers, offer accurate results within the paraxial region, but are limited by high computational cost and directional constraints. In recent years, alternative approaches–such as the Gaussian Beam Expansion (GBE)[25] and Spherical Wave Expansion (SWE)[26, 27] methods derived from the Westervelt equation, as well as extended King integral formulations[28]–have emerged to overcome these limitations. In addition, numerical simulations based on the finite element method (FEM) have also been employed to model nonlinear acoustic propagation, particularly when complex boundary conditions must be considered.[29, 30, 31] Moreover, Kuznetsov equation-based methods that incorporate local nonlinearity have shown promise for capturing complex acoustic phenomena.[32, 33, 28] In this study, the SWE and FEM-based method are employed to conduct efficient and reliable simulations of the audible sound field generated by the SPPAL across a wide set of design parameters.
This study presents a comprehensive evaluation of the SPPAL design framework by integrating accurate transducer modeling, mechanically robust SP design, and efficient nonlinear acoustic field analysis. Emphasis is placed on identifying key design parameters that enable DR operation and on validating the acoustic equivalence between SPs and RPs. By employing Approx. 3D transducer models and SWE-based acoustic simulations, the proposed approach enables rapid yet reliable exploration of a broad design space. Furthermore, a series of rigorous experiments were conducted to validate the proposed modeling methods and to investigate the practical behavior of the SPPAL. These measurements not only confirmed the predictive accuracy of the analysis framework, but also revealed the presence of combination resonance (CR)[34]–an inherent structural phenomenon not previously reported nor captured by existing models.
The insights derived from this work not only deepen the understanding of structural-acoustic interactions in flexural ultrasonic radiators but also offer practical guidance for the implementation of high-performance PAL systems using compact and cost-effective transducer configurations.
II Parametric array loudspeakers with stepped plates
This section examines the SP as a viable radiator for directional audio applications. The acoustic performance of the SP is compared against that of a RP, focusing on the propagation curve (PC) and beam pattern (BP) characteristics. The equivalence ratio (ER) is introduced to quantify the similarity between the SP and RP in terms of axial propagation. Finally, the role of DR transducer design is discussed to address the SPL drop-off at low audio frequencies.
II.1 Acoustic characterstics of rigid piston for parametric array loudspeakers
Since baffled circular RPs are the most well-known acoustic source even in PALs, the preliminary investigation begins with this type of radiator. In the following section, the circular SP is examined by leveraging its similarity to the circular RP to explore an optimal design strategy for the SPPAL at a given receiver location.
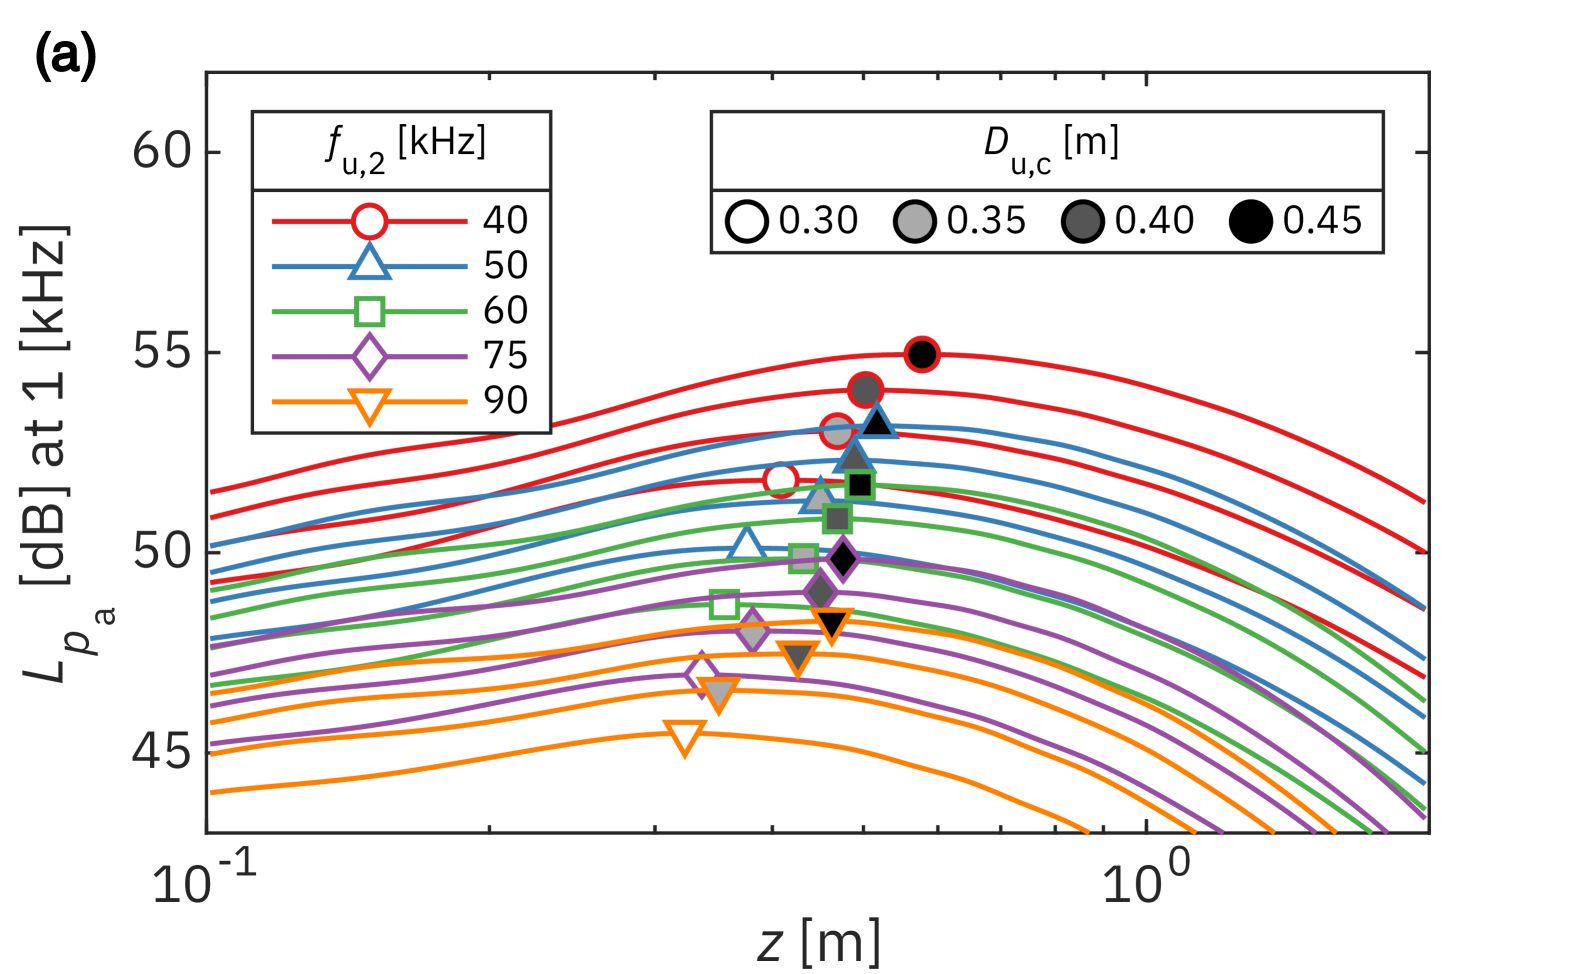
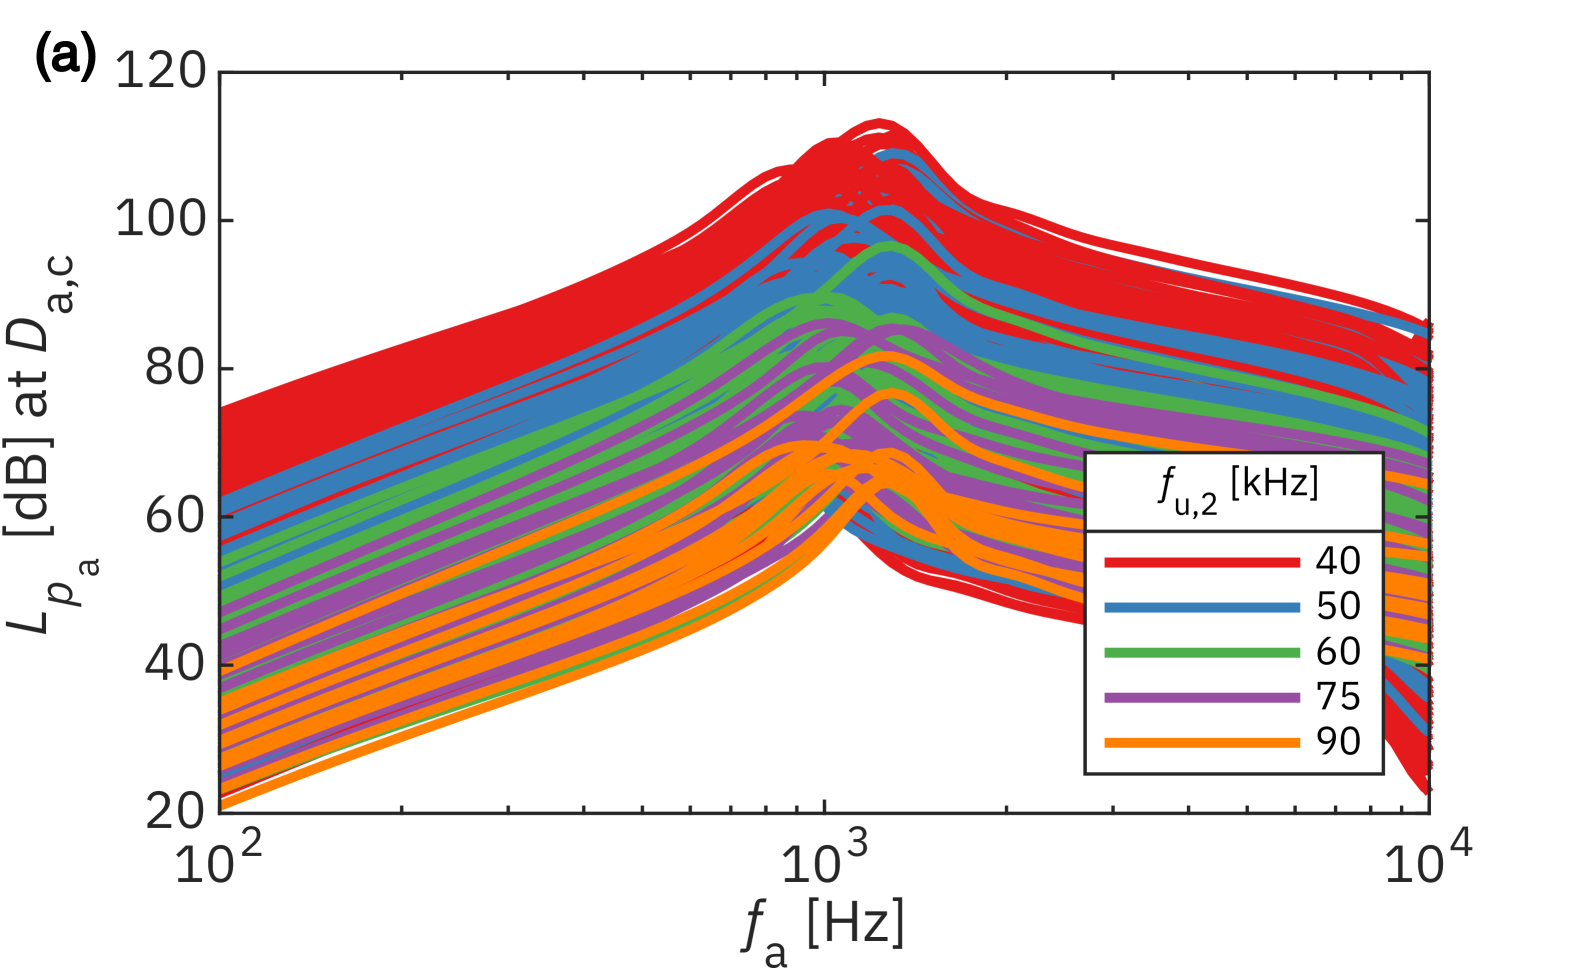
For PAL with a baffled circular RP, the audio sound power is approximately proportional to , aperture size, , and inversely proportional to ultrasound frequency, in the inverse-law far field.[35, 7] Similarly but, the following analysis focuses on the critical distance for audio sound (audio CD), , defined as the location at which the on-axis audio pressure reaches its maximum as marked in Fig. 1(a). The resulting relationship provides a guideline for selecting the carrier frequency and aperture radius to maximize the audio sound pressure at a given receiver location.
First, the aperture radius, is determined based on the nominal ultrasound frequency, kHz, corresponding to the first local maximum distance, m, hereafter referred to as the critical distance of ultrasound (ultra CD), . The parameter is used either as the actual carrier frequency, , or as a reference design parameter for the SPPAL. This study adopts a finite set of design parameter combinations to ensure computational feasibility, as nonlinear acoustic effects–unlike linear ones–lack tractable analytical solutions and require numerically intensive simulations. To model the nonlinear field, the spherical wave expansion (SWE) method is employed, offering an efficient and rigorous solution to the Westervelt equation under the quasilinear approximation.[26] Atmospheric absorption is modeled according to ISO 9613-1,[36] assuming a relative humidity of % and a temperature of ℃. The surface normal velocities for the carrier and sideband components, and , are each set to m/s. The modulation scheme used is lower sideband amplitude modulation (LSB-AM), with the audio frequency defined as . The rationale for this choice will be discussed in Sec. IV.2.2.
Again, Fig. 1(a) shows the PCs of the audio sound at kHz generated by circular RPs, evaluated for different combinations of design parameters, including the carrier frequencies, , and the ultra CD, . The marked points indicate the critical audio SPL, , with different marker styles distinguishing the applied design parameters. At each , a decrease in or an increase in results in a higher . This relationship enables the determination of the optimal combination of and that maximizes at a given receiver location–that is, at a specific . In this analysis, the surface normal velocity of the circular RP is fixed, as this represents an idealized scenario. However, this assumption does not hold in practical situations, where the transducer characteristics must be considered in detail, as further discussed in Sec. II.3.
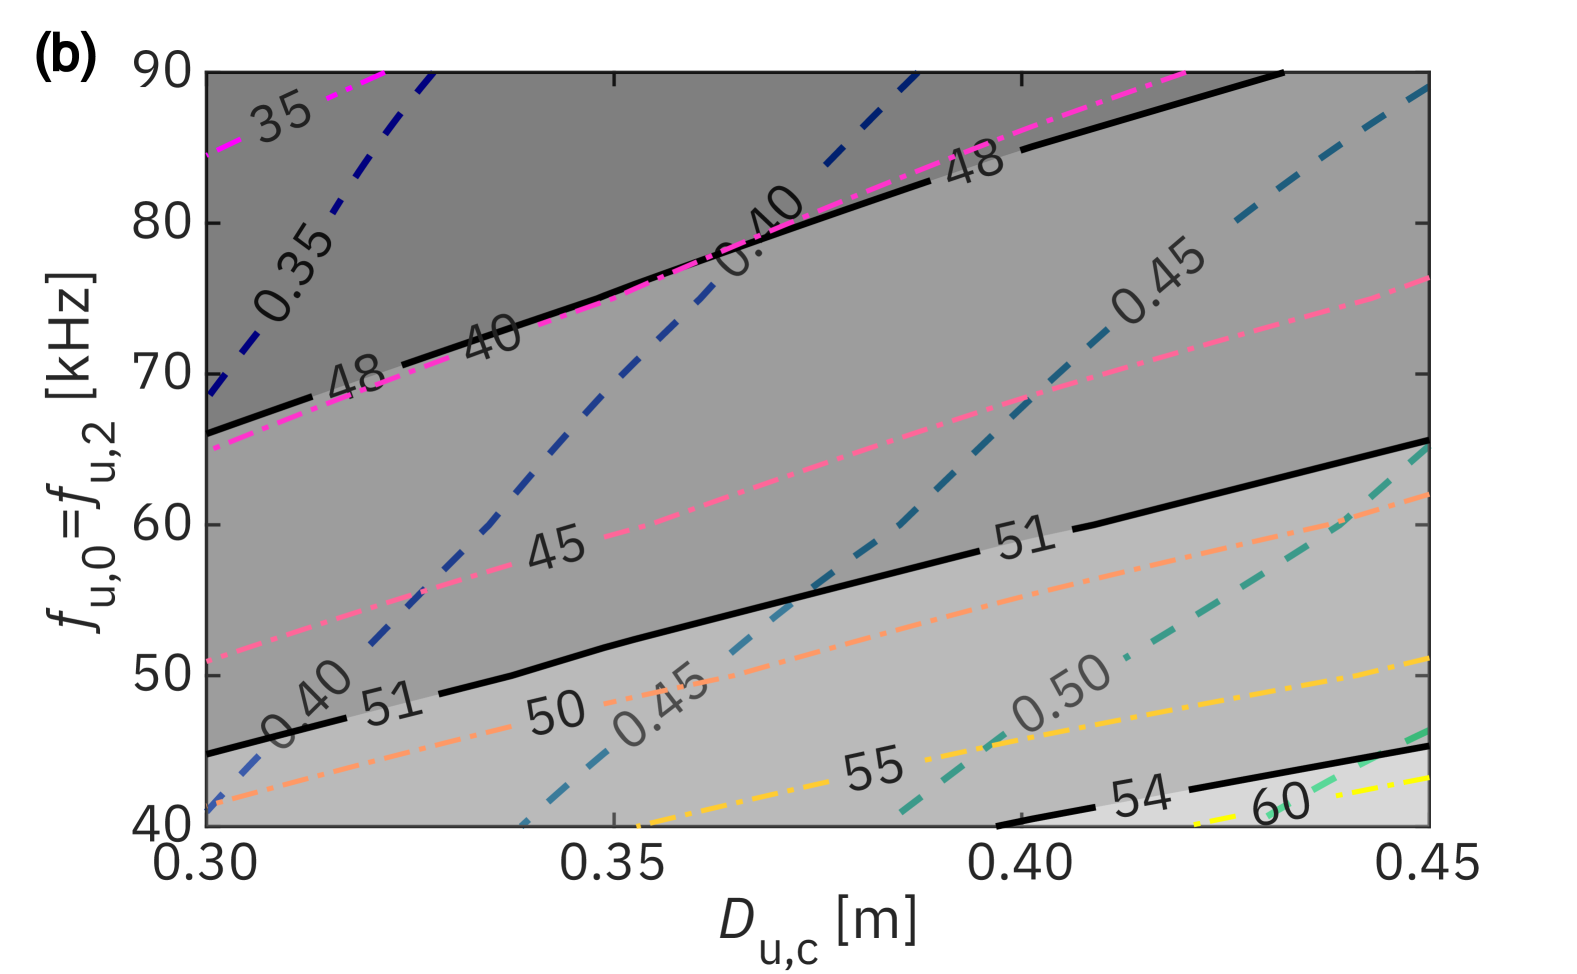
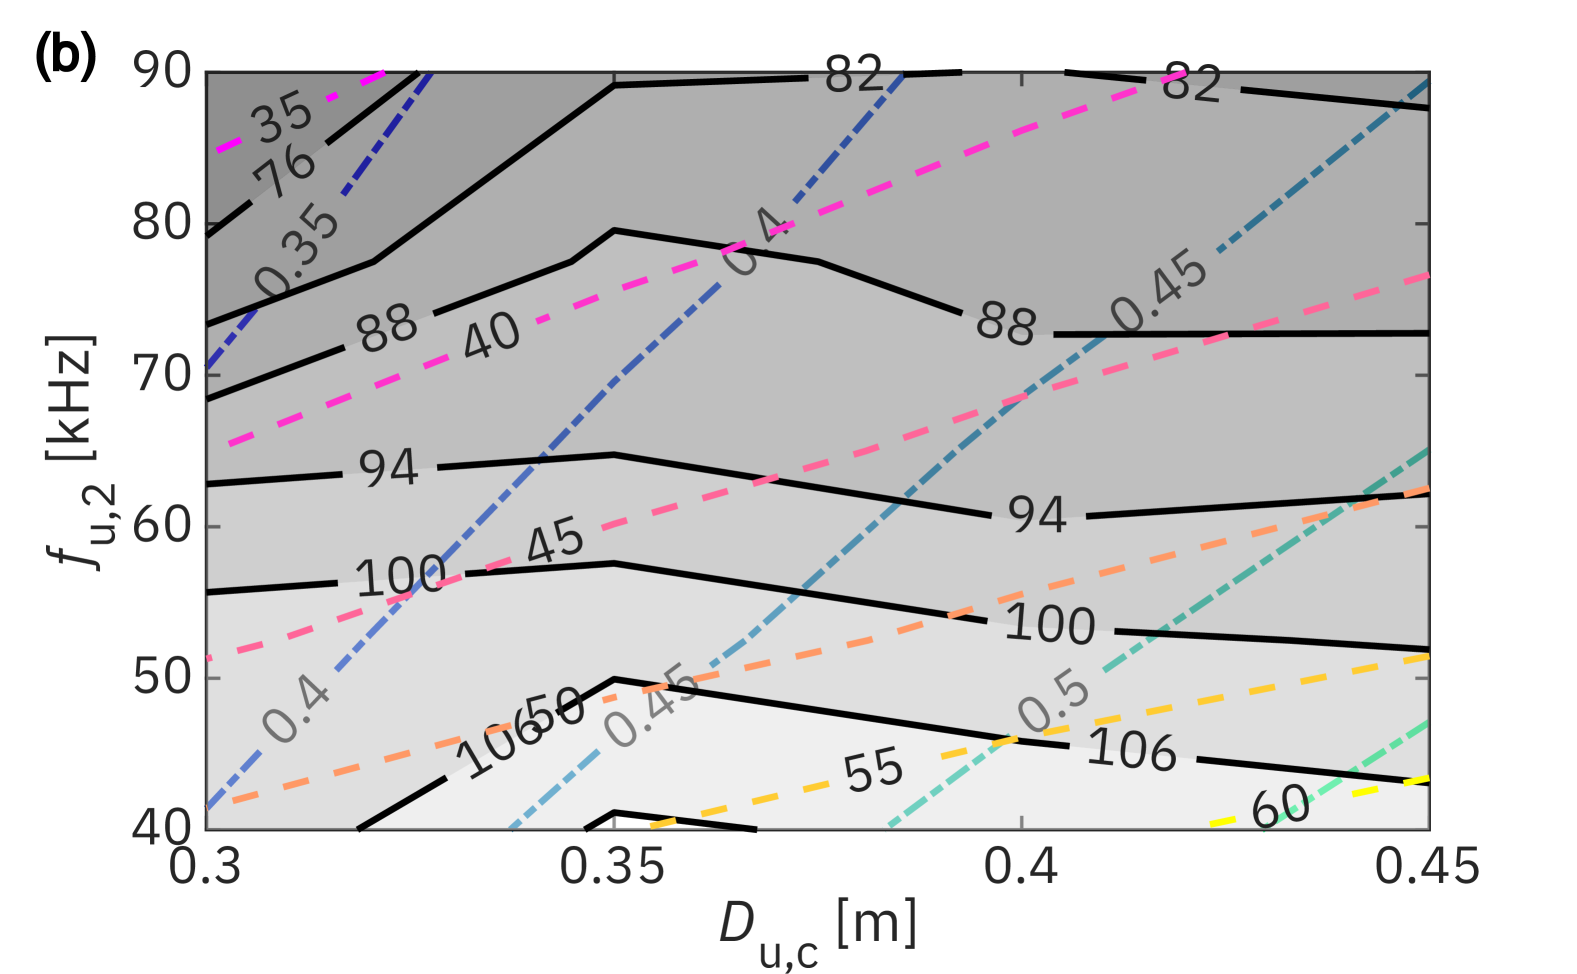
Figure 1(b) outlines the results of Fig. 1(a) in that the solid contour lines mean ; the dashed contour lines indicate ; the dash-dotted lines are . For the same audio CD, as the carrier frequency decreases, the audio SPL increases. For example, along the m dashed contour line, as decreases from to kHz, increases approximately from to dB. For the same aperture radius, the audio SPL remains similar, but the audio CD varies with the carrier frequency. In the case of mm, increasing from to kHz results in an increase in from to m. These relationships are further supported by the correlation matrix in Fig. LABEL:fig:s6[37].
II.2 Acoustic characteristics of stepped plate
II.2.1 Principle of stepped plate and its impedance characteristics
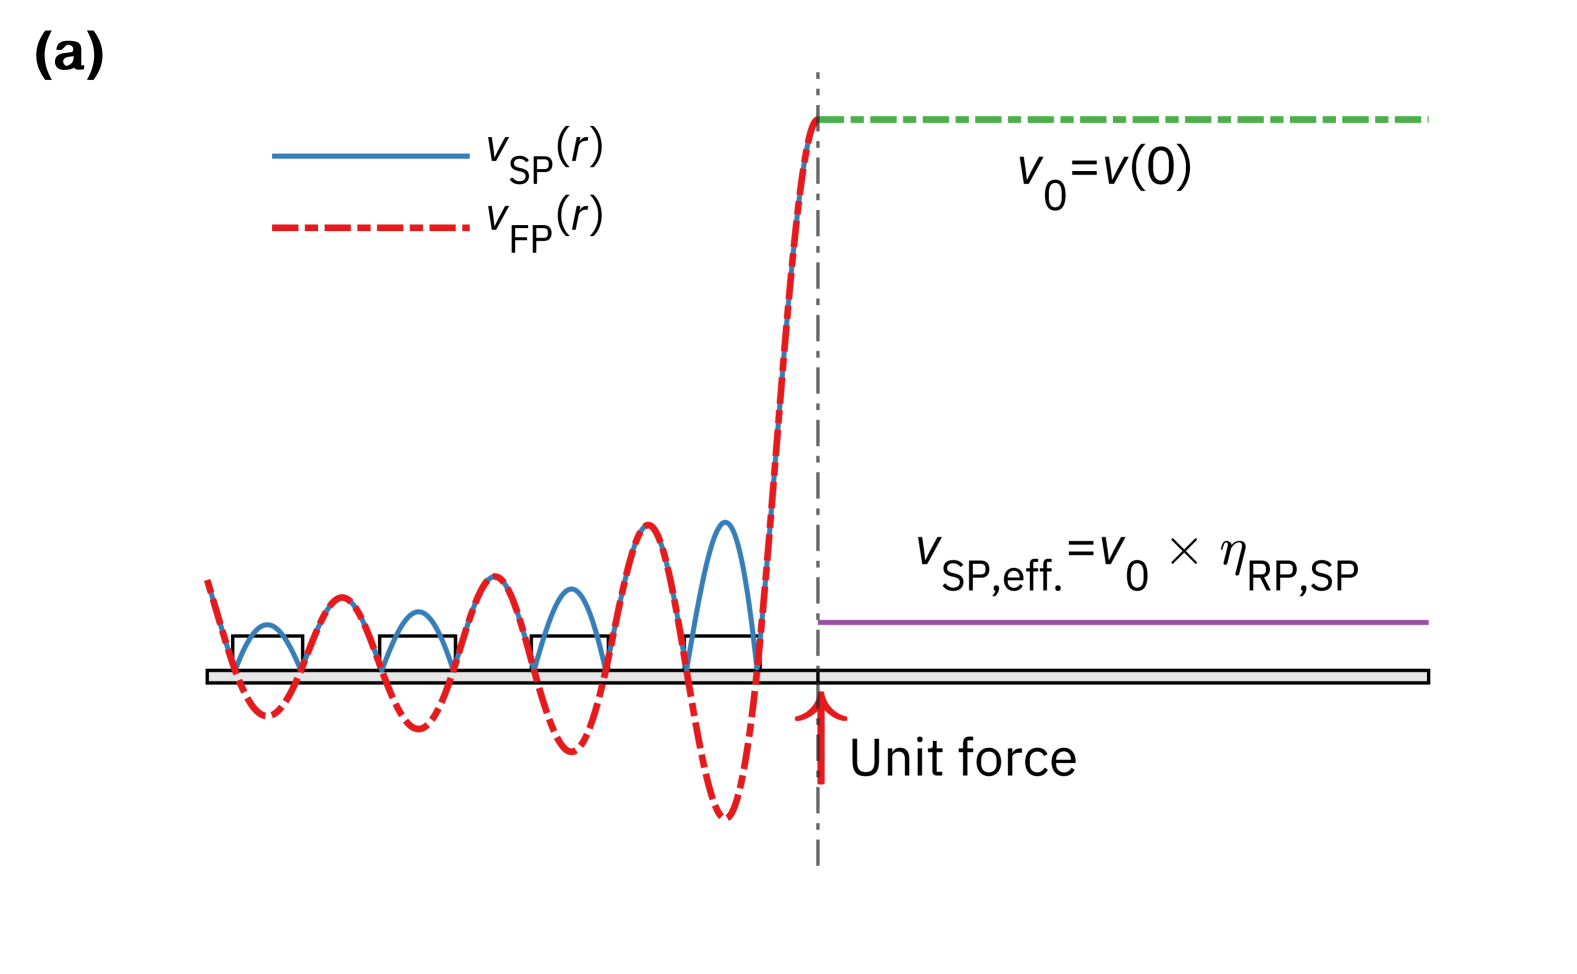
The SP, which is a circular FP modified with annular ring steps of half-wavelength height, , is designed to approximate the coherent acoustic field of a uniformly vibrating RP.[13] As shown in Fig. 2(a), the dash-dotted line represents the SP’s vibration mode shape, while the solid line approximates the surface particle velocity when phase-compensating steps are applied. If the center velocity of the SP is , and its radiated field matches that of an RP, the equivalent RP surface velocity is given by , where denotes the ER. This section investigates the conditions under which the SP acoustically resembles the RP in axial propagation.
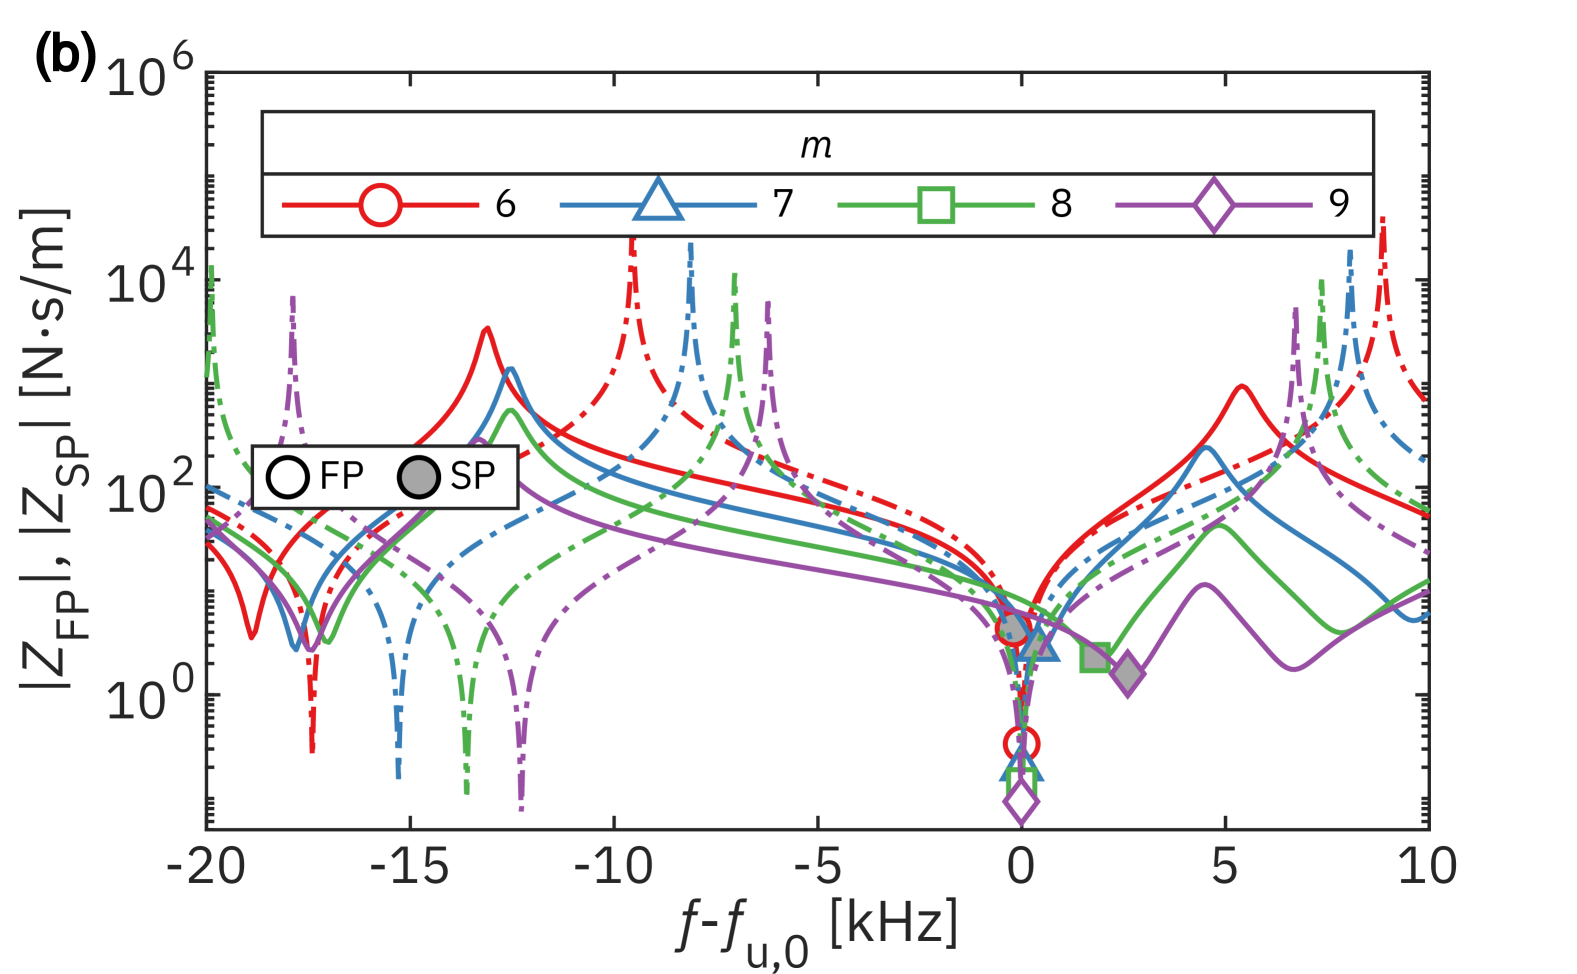
Figure 2(b) presents the mechanical impedance at the center of the FP () and SP () from the 6th to 9th vibration modes, assuming a fixed FP resonance at kHz and an ultra CD of m, including radiation impedance in air. While the FP’s resonance remains unchanged across modes, the addition of annular steps in the SP shifts the resonance–an effect more pronounced in higher-order modes–resulting in . In thin plates operating at higher-order modes, resonance shifts persist even after design refinement of the annular steps, suggesting that the added steps inevitably affect the resonance characteristics,[19] despite the use of polymer materials with relatively low density and stiffness.[20] By contrast, thicker plates associated with lower-order modes exhibit reduced sensitivity to such modifications. Although not shown in full, similar trends were observed across all combinations of design parameters ( m, kHz, and ), simulated using COMSOL Multiphysics via LiveLink for MATLAB with frequency-domain acoustic-structure interaction analysis. For each case, the initial plate geometry was determined based on the target vibration mode using MMPT.[21]
II.2.2 Evaluation of equivalence ratio at the stepped plate’s resonant frequency
As a next step, the PCs generated by the SP and the RP are compared. In the SP case, a unit force is applied at the center to excite the desired mode, and the resulting center velocity, , is determined by the total mechanical impedance, including both structural and radiation components. For a fair comparison, the RP is assigned the same radius, and its surface velocity is set to match the center velocity of the SP, such that .
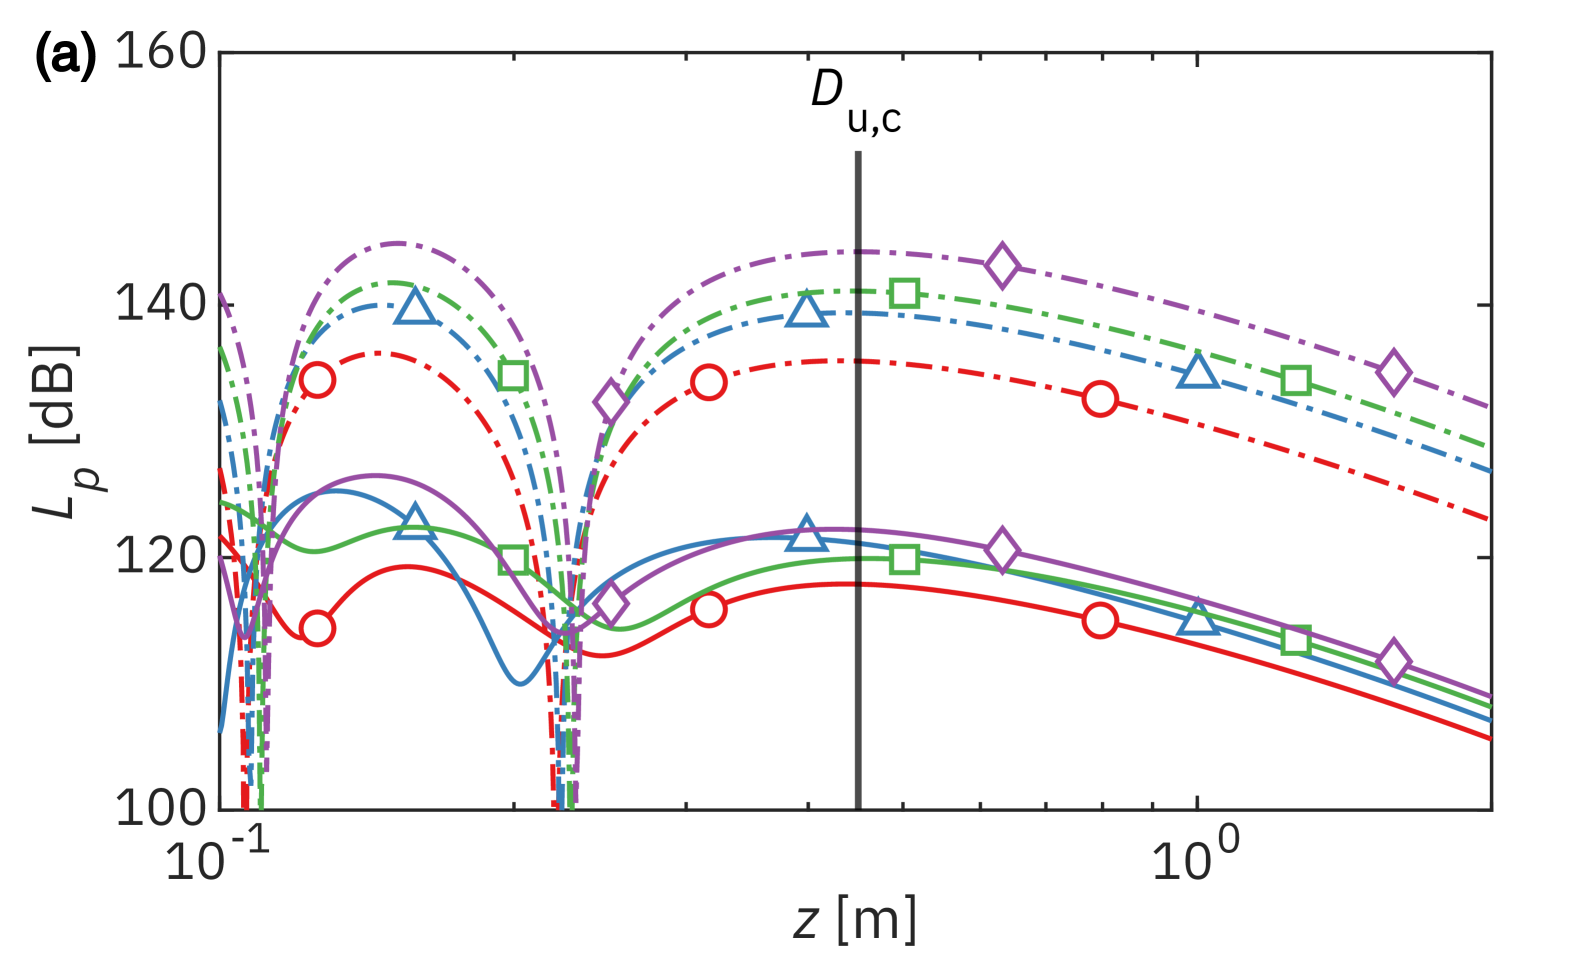
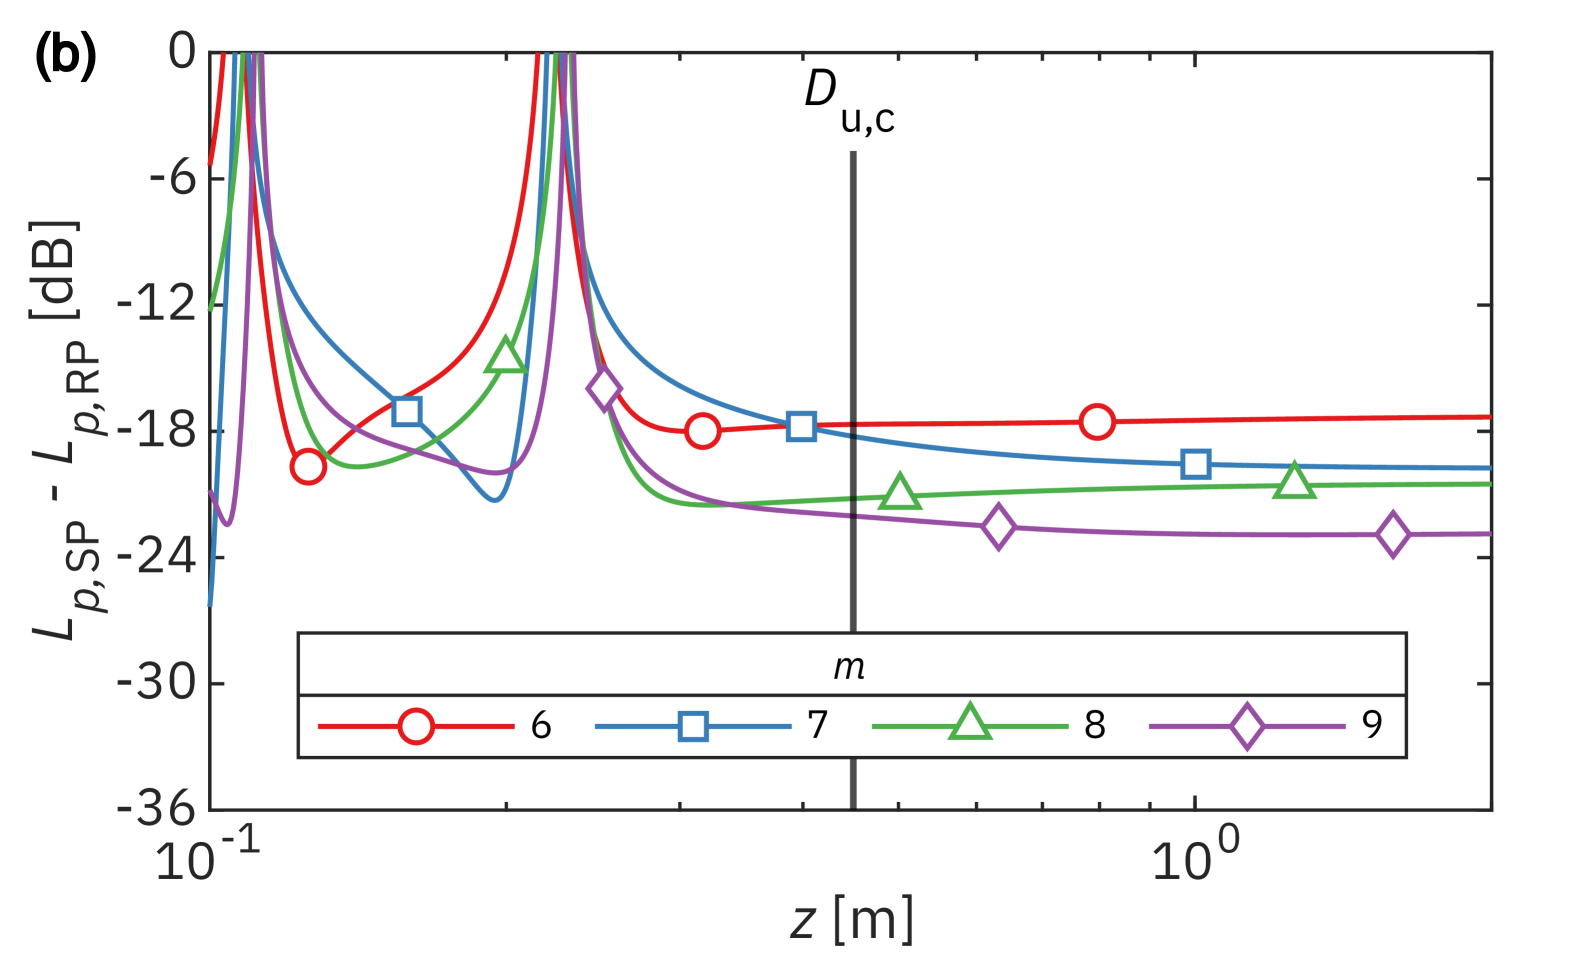
Figure 3(a) presents the PCs of the acoustic fields produced by the SP and RP at the SP’s resonant frequency, , which reflects the frequency shift introduced by the annular steps. Although the SP exhibits irregular behavior in the near field, both SP and RP PCs converge beyond . The SPL difference at this distance defines the ER, , which quantifies the relative radiation efficiency. As shown in Fig. 3(b), the ER depends on the ultra CD, , the nominal ultrasound frequency , and the vibration mode .
For instance, the ER at the 8th mode is approximately dB, implying that the RP must operate at a center velocity ten times lower than the SP to achieve similar far-field performance. Notably, even-mode SPs show consistent ER behavior along the acoustic axis beyond , whereas odd-mode SPs exhibit fluctuations. This inconsistency is attributed to the absence of the outermost step in odd-mode designs due to fabrication difficulties. Moreover, the central region of the SP is left bare to avoid thermal degradation of the polymer steps during continuous operation.
II.2.3 Bandwidth characteristics of stepped plate
For PAL applications, it is essential to evaluate whether the acoustic behavior of the SP aligns with that of a RP not only at the SP’s resonant frequency, , but also over a practical frequency bandwidth. This ensures consistent directional performance across the audio band. The present analysis focuses on the 8th vibration mode, with kHz and m. Although omitted here for brevity, similar trends were observed across other combinations of design parameters, particularly for even-order modes (for addtional ressults, Figs. LABEL:fig:ERbandwidthOfSP and LABEL:fig:BPbandwidthOfSP[37]).
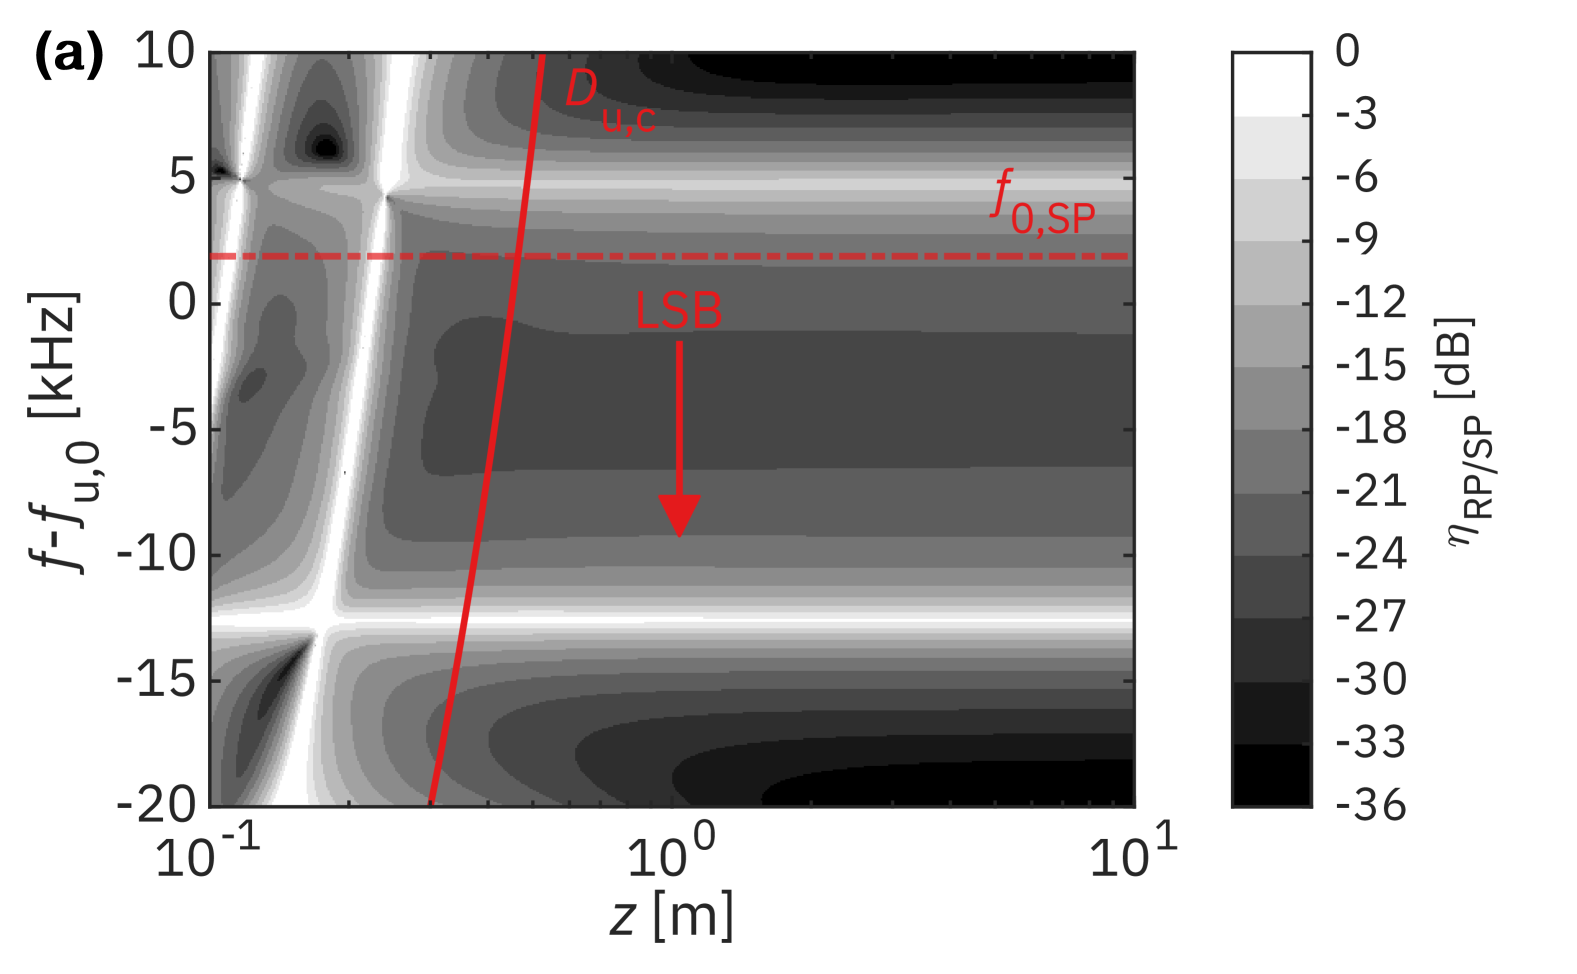
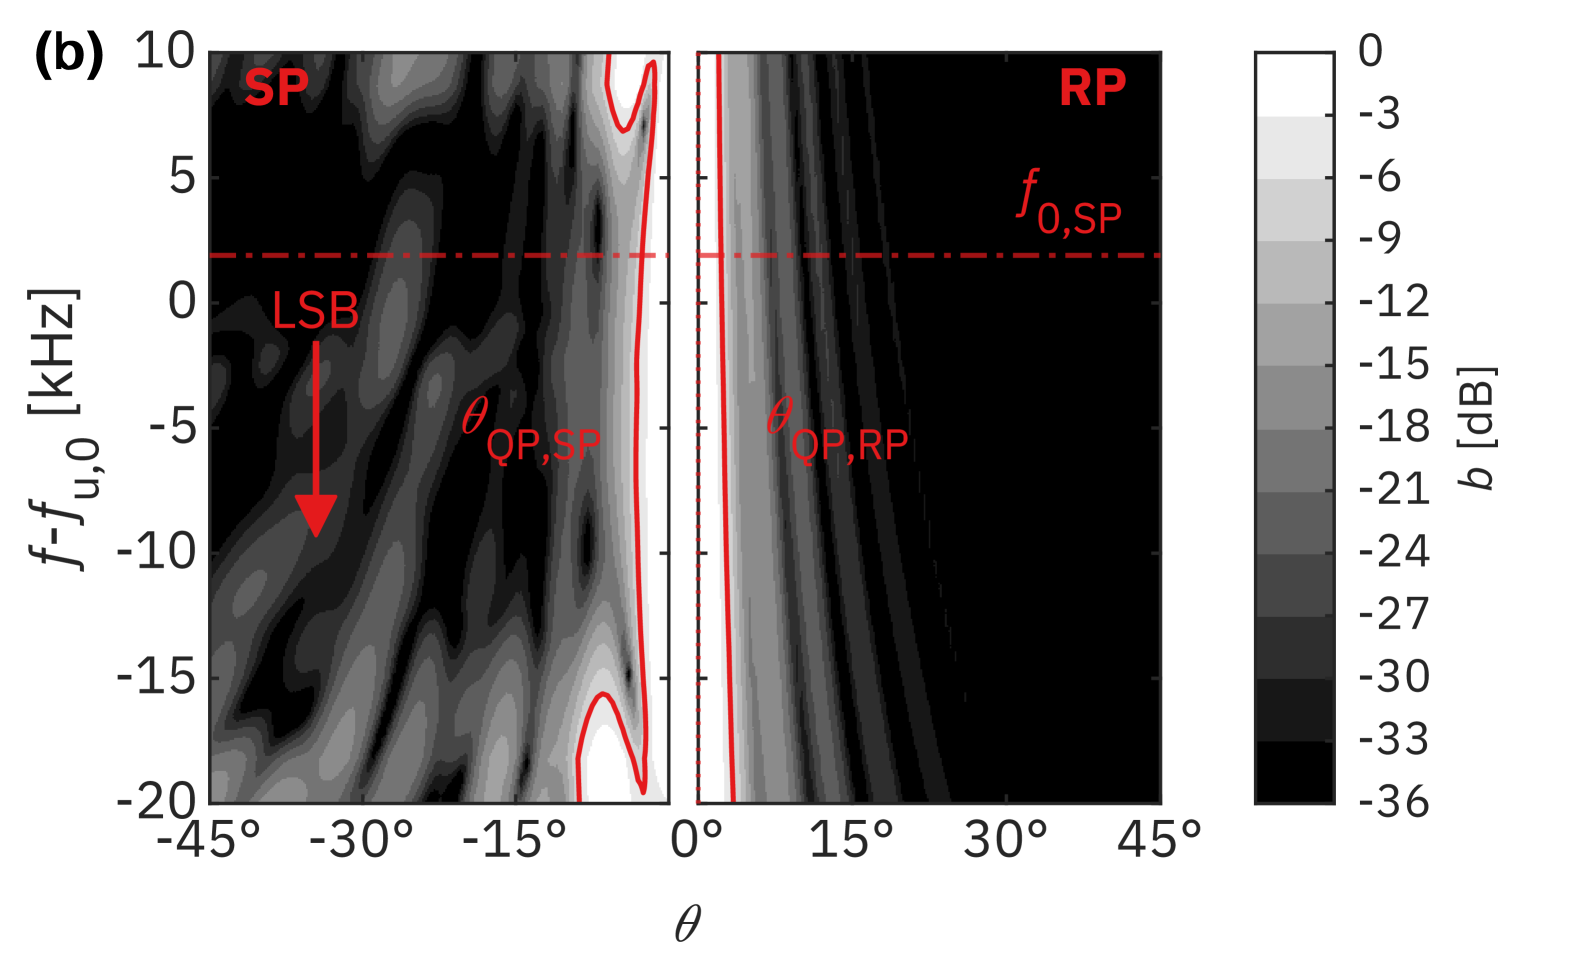
With LSB-AM modulation, the relevant frequency bandwidth extends approximately kHz below . As shown in Fig. 4(a), the ER varies within dB across this range, indicating robust axial field consistency. Additionally, although the BP of an SP at its design frequency is known to closely mimic that of an RP,[13] its frequency-dependent behavior has not been thoroughly examined. Figure 4(b) presents BPs at m, with the left side representing the SP and the right side the RP. The SP maintains high directivity with a quarter-power angle, , of approximately ° throughout the bandwidth. Sidelobe levels remain below dB, but begin to rise outside the range, approaching the main lobe level. This degradation is attributed to two main factors: frequency-dependent shifts in nodal circle locations that misalign the annular steps, and phase mismatch resulting from step heights optimized specifically for .
These findings confirm that the ultrasonic acoustic fields generated by the RP and SP are comparable when both share the same radius and operating frequency. Although their surface velocity profiles differ, the similarity in PCs beyond and BPs suggests that the phase-compensating annular steps of the SP function effectively. Therefore, the preliminary design of an SP radiator can be guided using the well-established design principles of the RP.
II.3 Transducer characteristics of stepped plate for parametric array loudspeakers
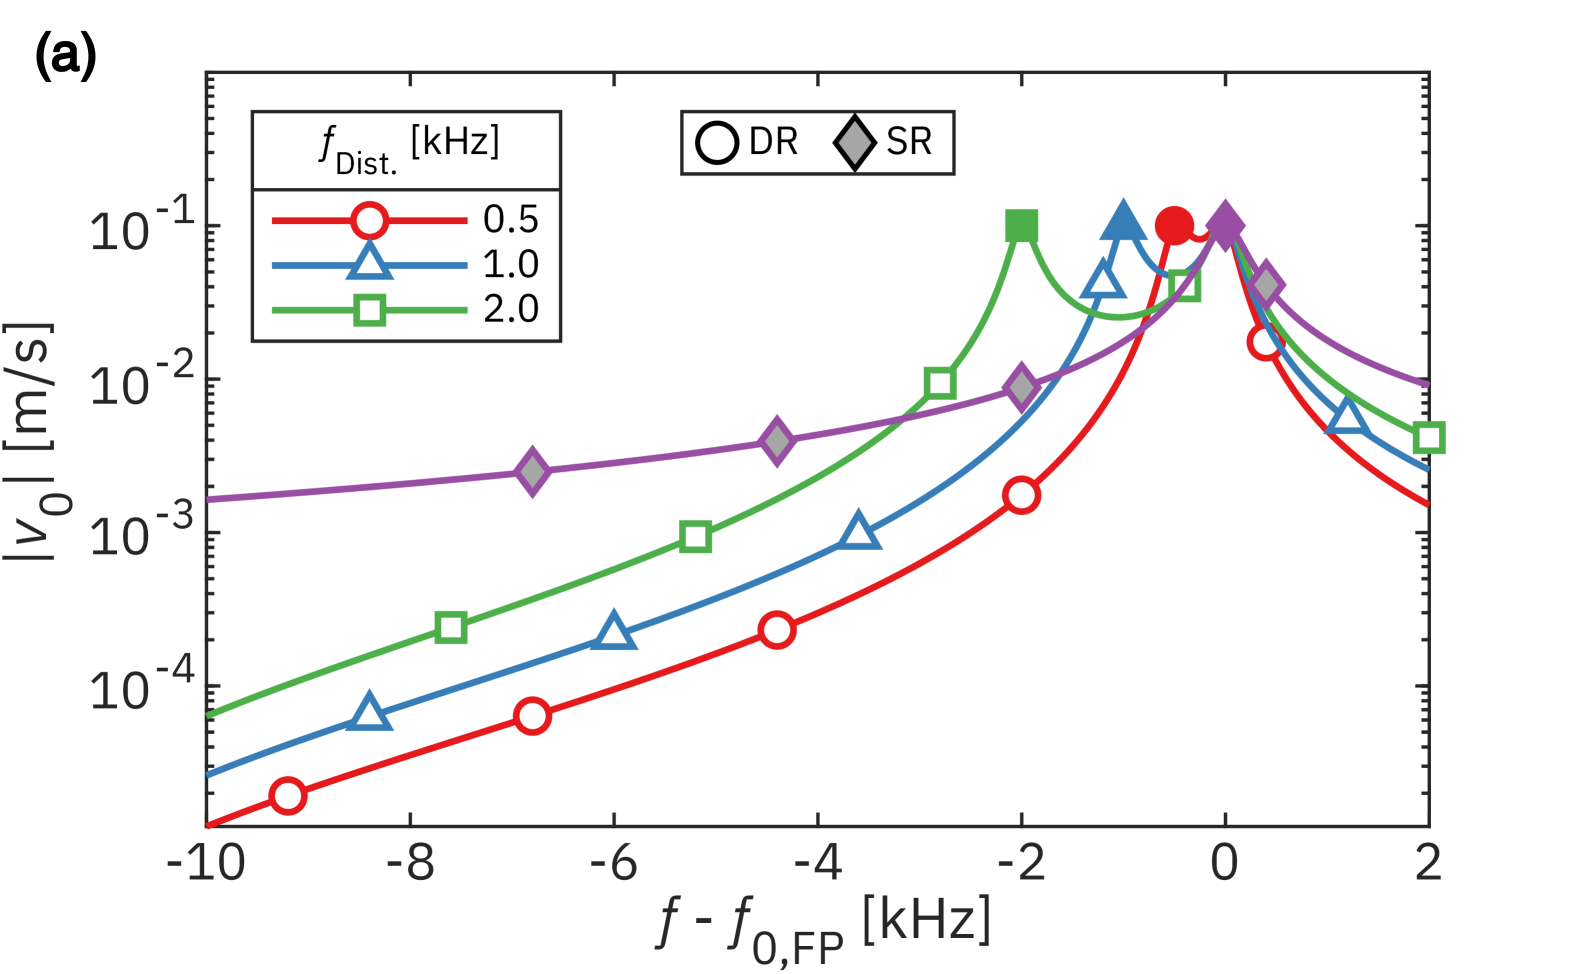
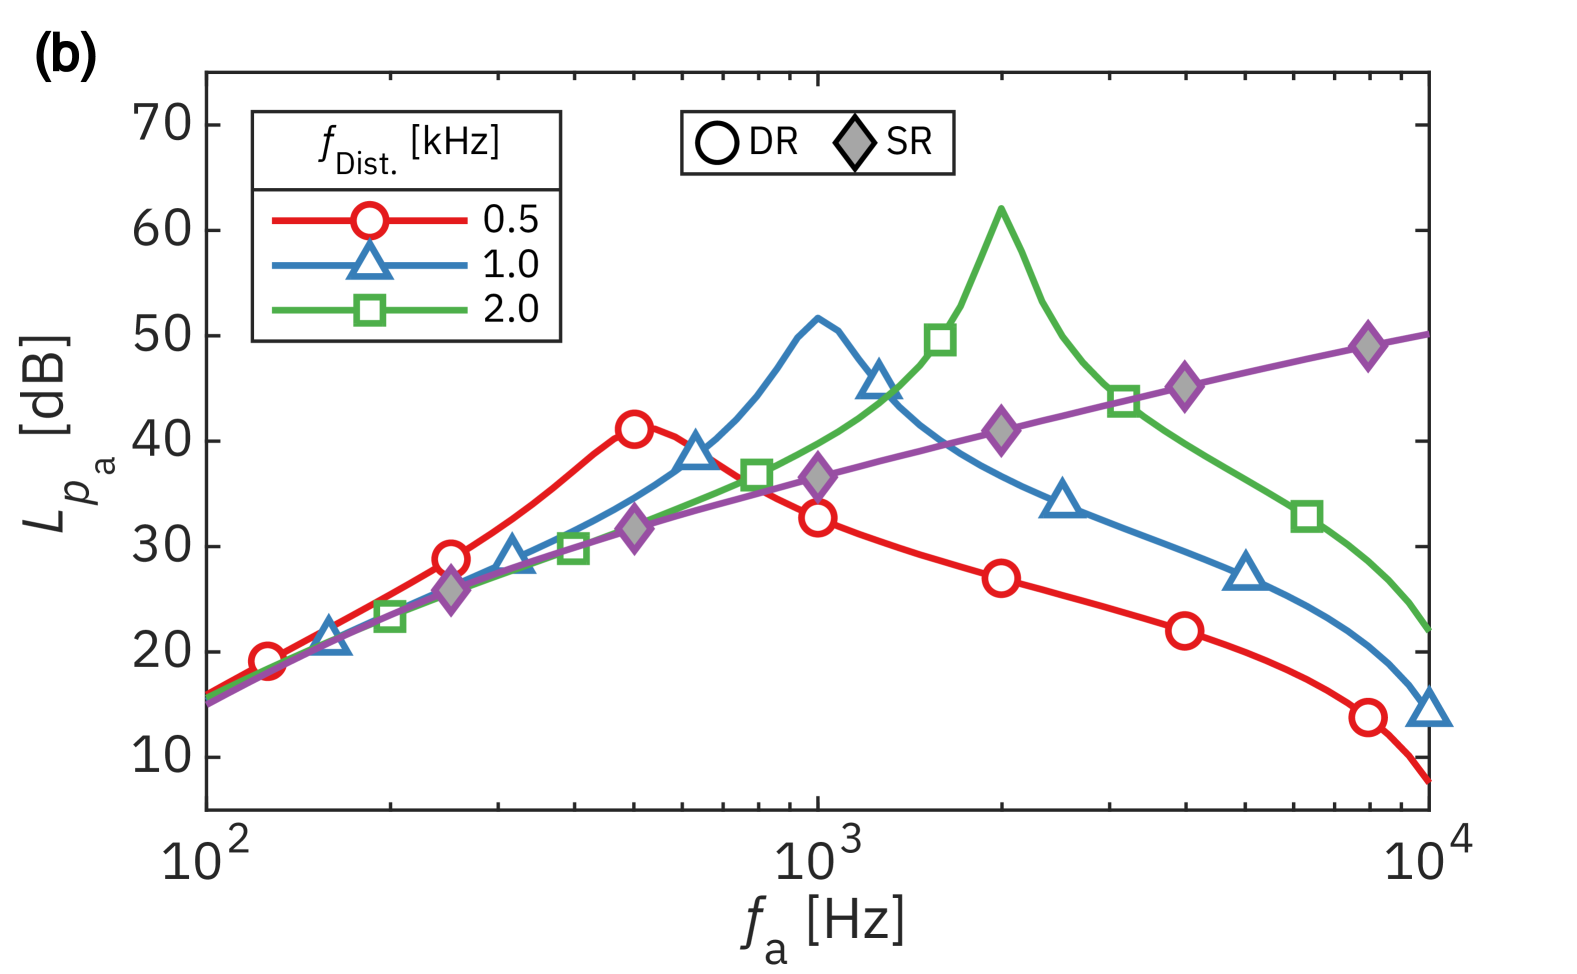
For PAL applications requiring a flat audio SPL response, an ideal approach involves employing an ultrasonic transducer with a flat frequency response and a dB/oct. equalizer, as suggested by Berktay’s far-field solution.[38] In practice, however, such transducers are difficult to realize, as most exhibit single resonance (SR) and lack broadband response.[8] The steep roll-off near resonance often exceeds dB/oct., causing poor low-frequency reproduction.[7, 39] To overcome this limitation, the SPPAL adopts a dual-resonance (DR) design that reinforces both carrier and sideband frequencies.[20, 21] The hypothetical velocity frequency responses of SR and DR transducers are modeled using a pole-zero-gain formulation:
| (1) | ||||
| (2) |
where and denote the angular frequencies of the carrier and sideband resonances, respectively; is the anti-resonance angular frequency; and is the damping loss factor. These parameters are adjusted to reflect typical SPPAL behavior, as illustrated in Fig. 5(a).
As shown in Fig. 5(b), compared to the SR transducer, the DR configuration exhibits noticeable amplification in the low audio band. The SPL curves, calculated using the SWE method for a RP with kHz and m, confirm that DR design can compensate for low-frequency roll-off. Prior studies achieved a resonance spacing of about kHz,[20, 21] but achieving narrower spacing remains a challenge in practical implementation.
III Design
In the previous section, the foundational design principles for PALs based on RPs were examined, followed by an exploration of the acoustic radiation characteristics of SPs, which approximate the behavior of RPs under certain conditions. This analysis highlighted the importance of carrier frequency, aperture size, and resonance mode selection in achieving optimal audio performance at a designated receiver location. Furthermore, the necessity of introducing DR in the ultrasonic velocity response of the transducer was emphasized to enhance low-frequency audio SPL. This section presents the design process of the SPPAL, where the SP is coupled with a Langevin-type transducer. Key design parameters are explored through multi-objective optimization, and their influence on audio performance is analyzed. Efficient simulation frameworks for nonlinear acoustic fields are introduced, followed by design-for-manufacturing considerations for practical implementation.
III.1 Prelminary design
III.1.1 Design parameters and objective function behavior
When the frequency distance between the fundamental mode and its secondary mode of the horn-coupled Langevin transducer is small and those resonant frequencies are also close to the intended mode’s resonant frequency of the stepped plate, DR occurs closely. Thus, the key to causing DR is the modal transition that occurs with small frequency variations. To realize this effect in the SPPAL design, various design parameters, denoted by , were considered:
-
•
Transducer configuration:
-
•
Radial dimension of the transducer’s piezo stack:
where -
•
Length of the transducer’s piezo stack:
where -
•
Horn-end radius of the stepped horn:
mm
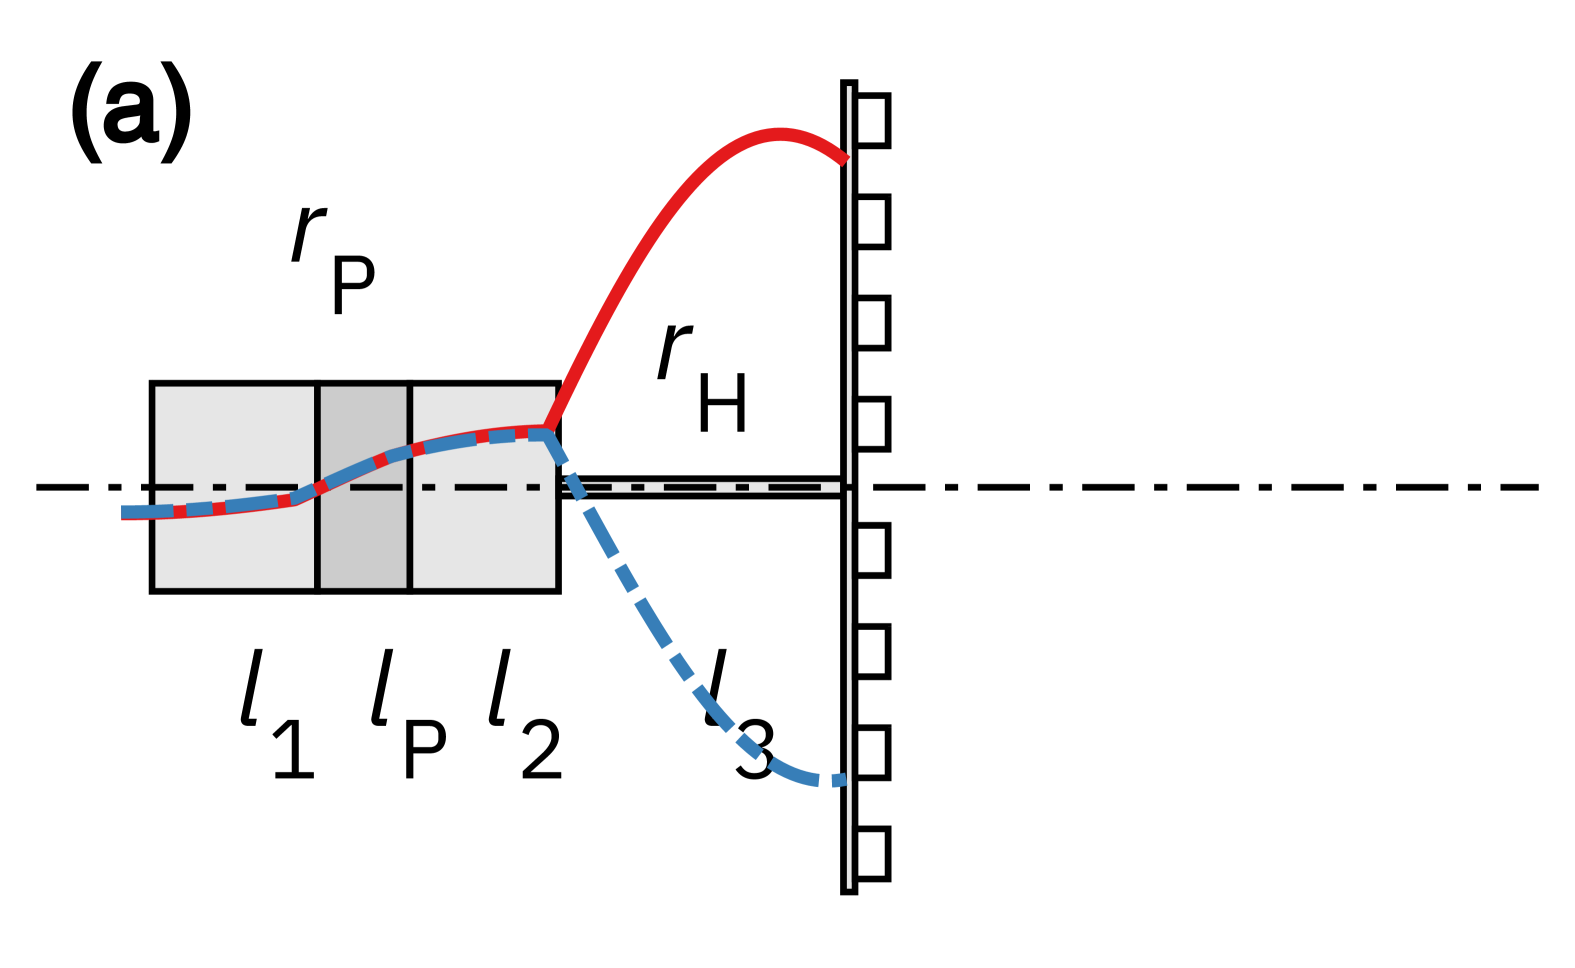
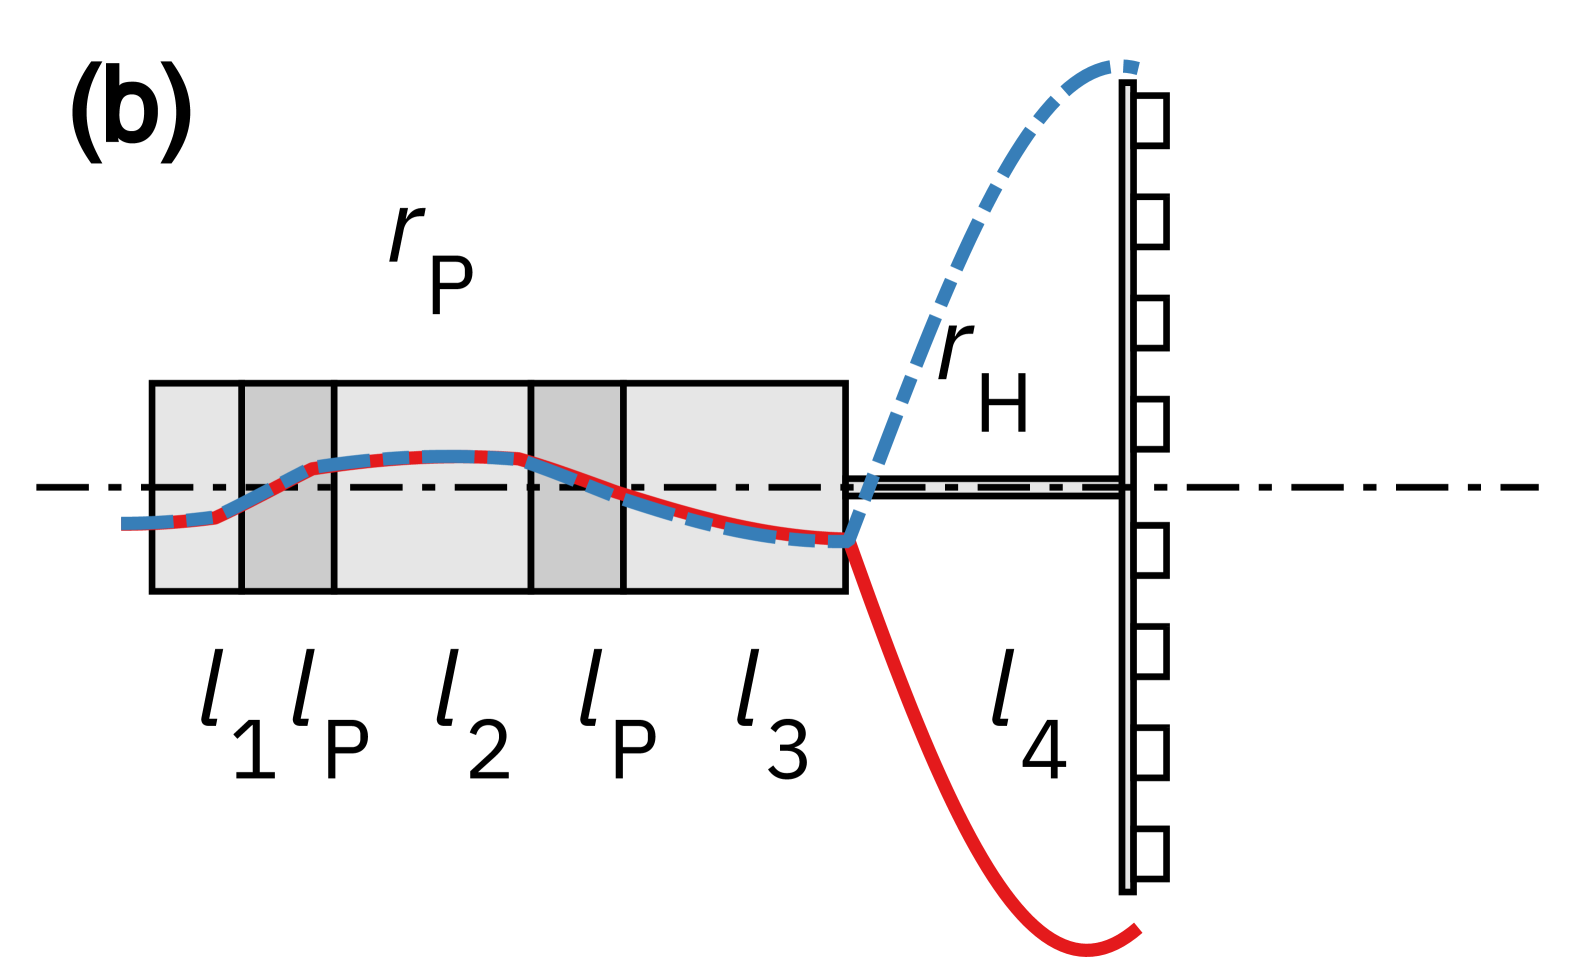
Here, specifies the transducer’s fundamental mode configuration. The half-wavelength transducer uses a single piezoelectric stack (Fig. 6(a)), whereas the full-wavelength configuration consists of a cascaded double-stack (Fig. 6(b)). In both schematics, the red solid line indicates the fundamental mode (), and the blue dash-dotted line represents the secondary mode (). The parameters and are normalized to the material-dependent wavelengths in the radial and longitudinal directions, respectively, with wave speeds defined as , where is the material density and is the elastic compliance under a constant electric field for direction (1: radial, 3: longitudinal). The horn-end radius is constrained by manufacturability–smaller values yield thin-neck geometries that are challenging to fabricate.
At the preliminary design stage, a forward design approach is adopted to assess how transducer design parameters and configurations affect key characteristics such as the frequency spacing of DR () and the corresponding modal velocities ( and ), using multi-objective optimization. Since this process is computationally intensive, the objective function must be both efficient to evaluate and physically meaningful.
For transducer sections with diameters smaller than a quarter wavelength, longitudinal motion dominates, and the 1D Langevin model provides sufficient accuracy.[40, 14] However, to achieve tighter frequency spacing (e.g., kHz), larger-diameter sections are often necessary, where the 1D model becomes inadequate due to radial-longitudinal coupling. To address this, an approximate three-dimensional (Approx. 3D) model incorporating Poisson effects was employed, enabling accurate mode prediction without resorting to full FEM modeling.[15]
In the multi-objective optimization process, the design parameters, , are listed above and the design variables, , to be optimized are the length of each part of the transducers, , its lower and upper bounds are set to to times those of Langevin’s equation,[40, 14] also two objective functions are defined:
-
•
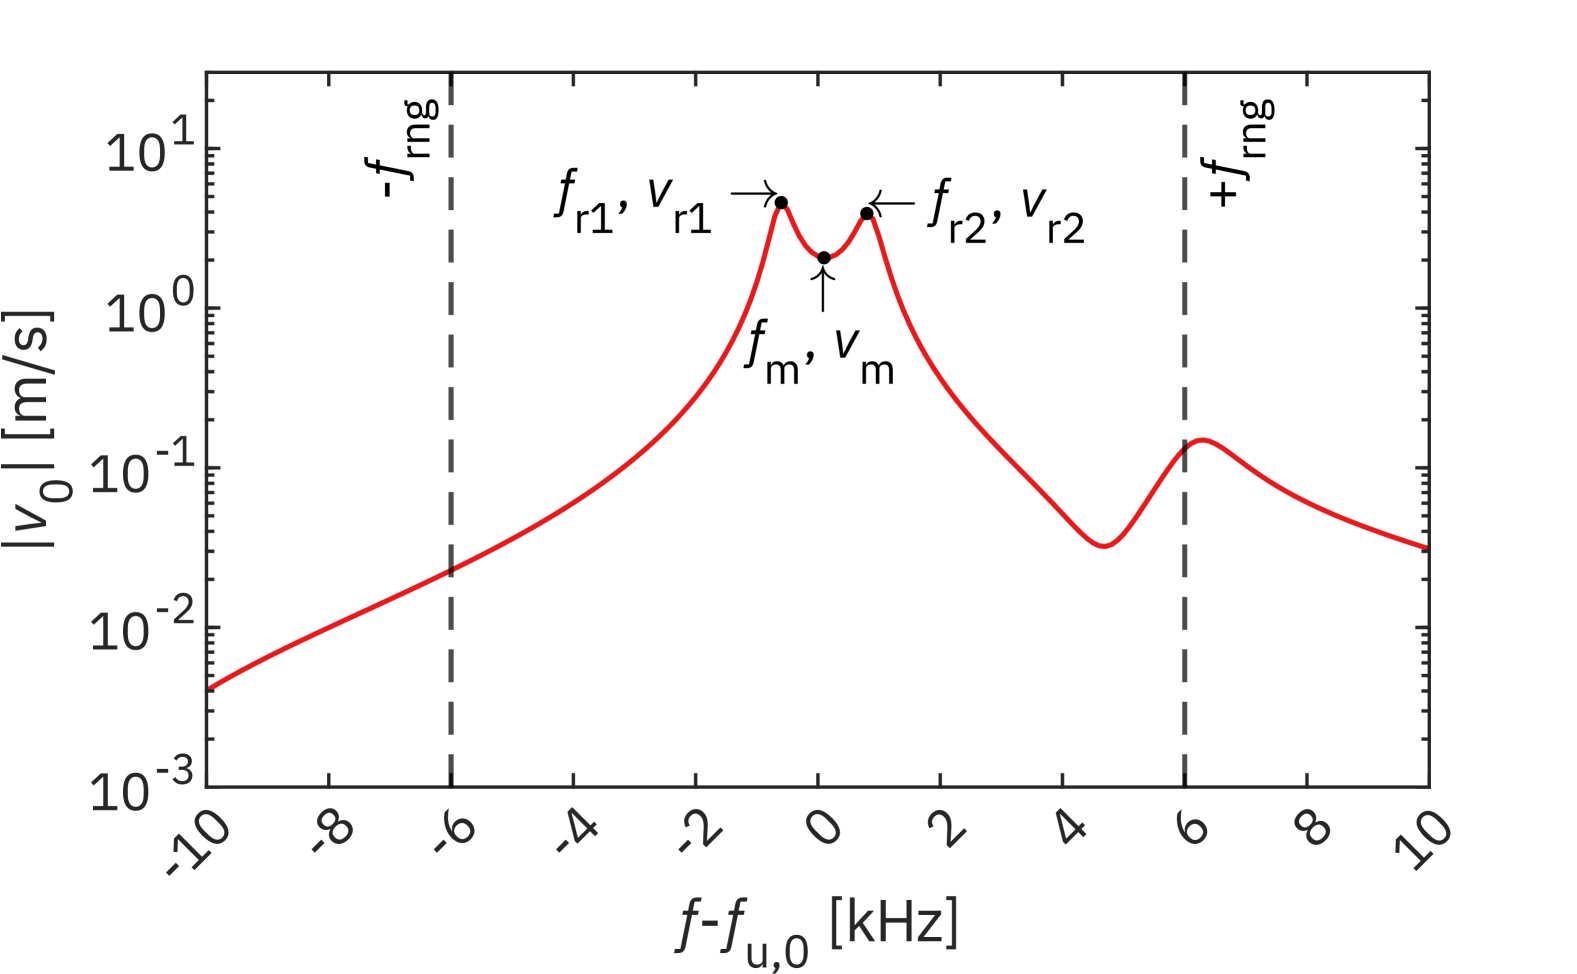
Objective function 1,
, is the negative geometric mean of the two highest peaks, and , and the local minimum between them in the plate’s center velocity. -
•
Objective function 2,
, is the frequency difference between the two largest peaks.
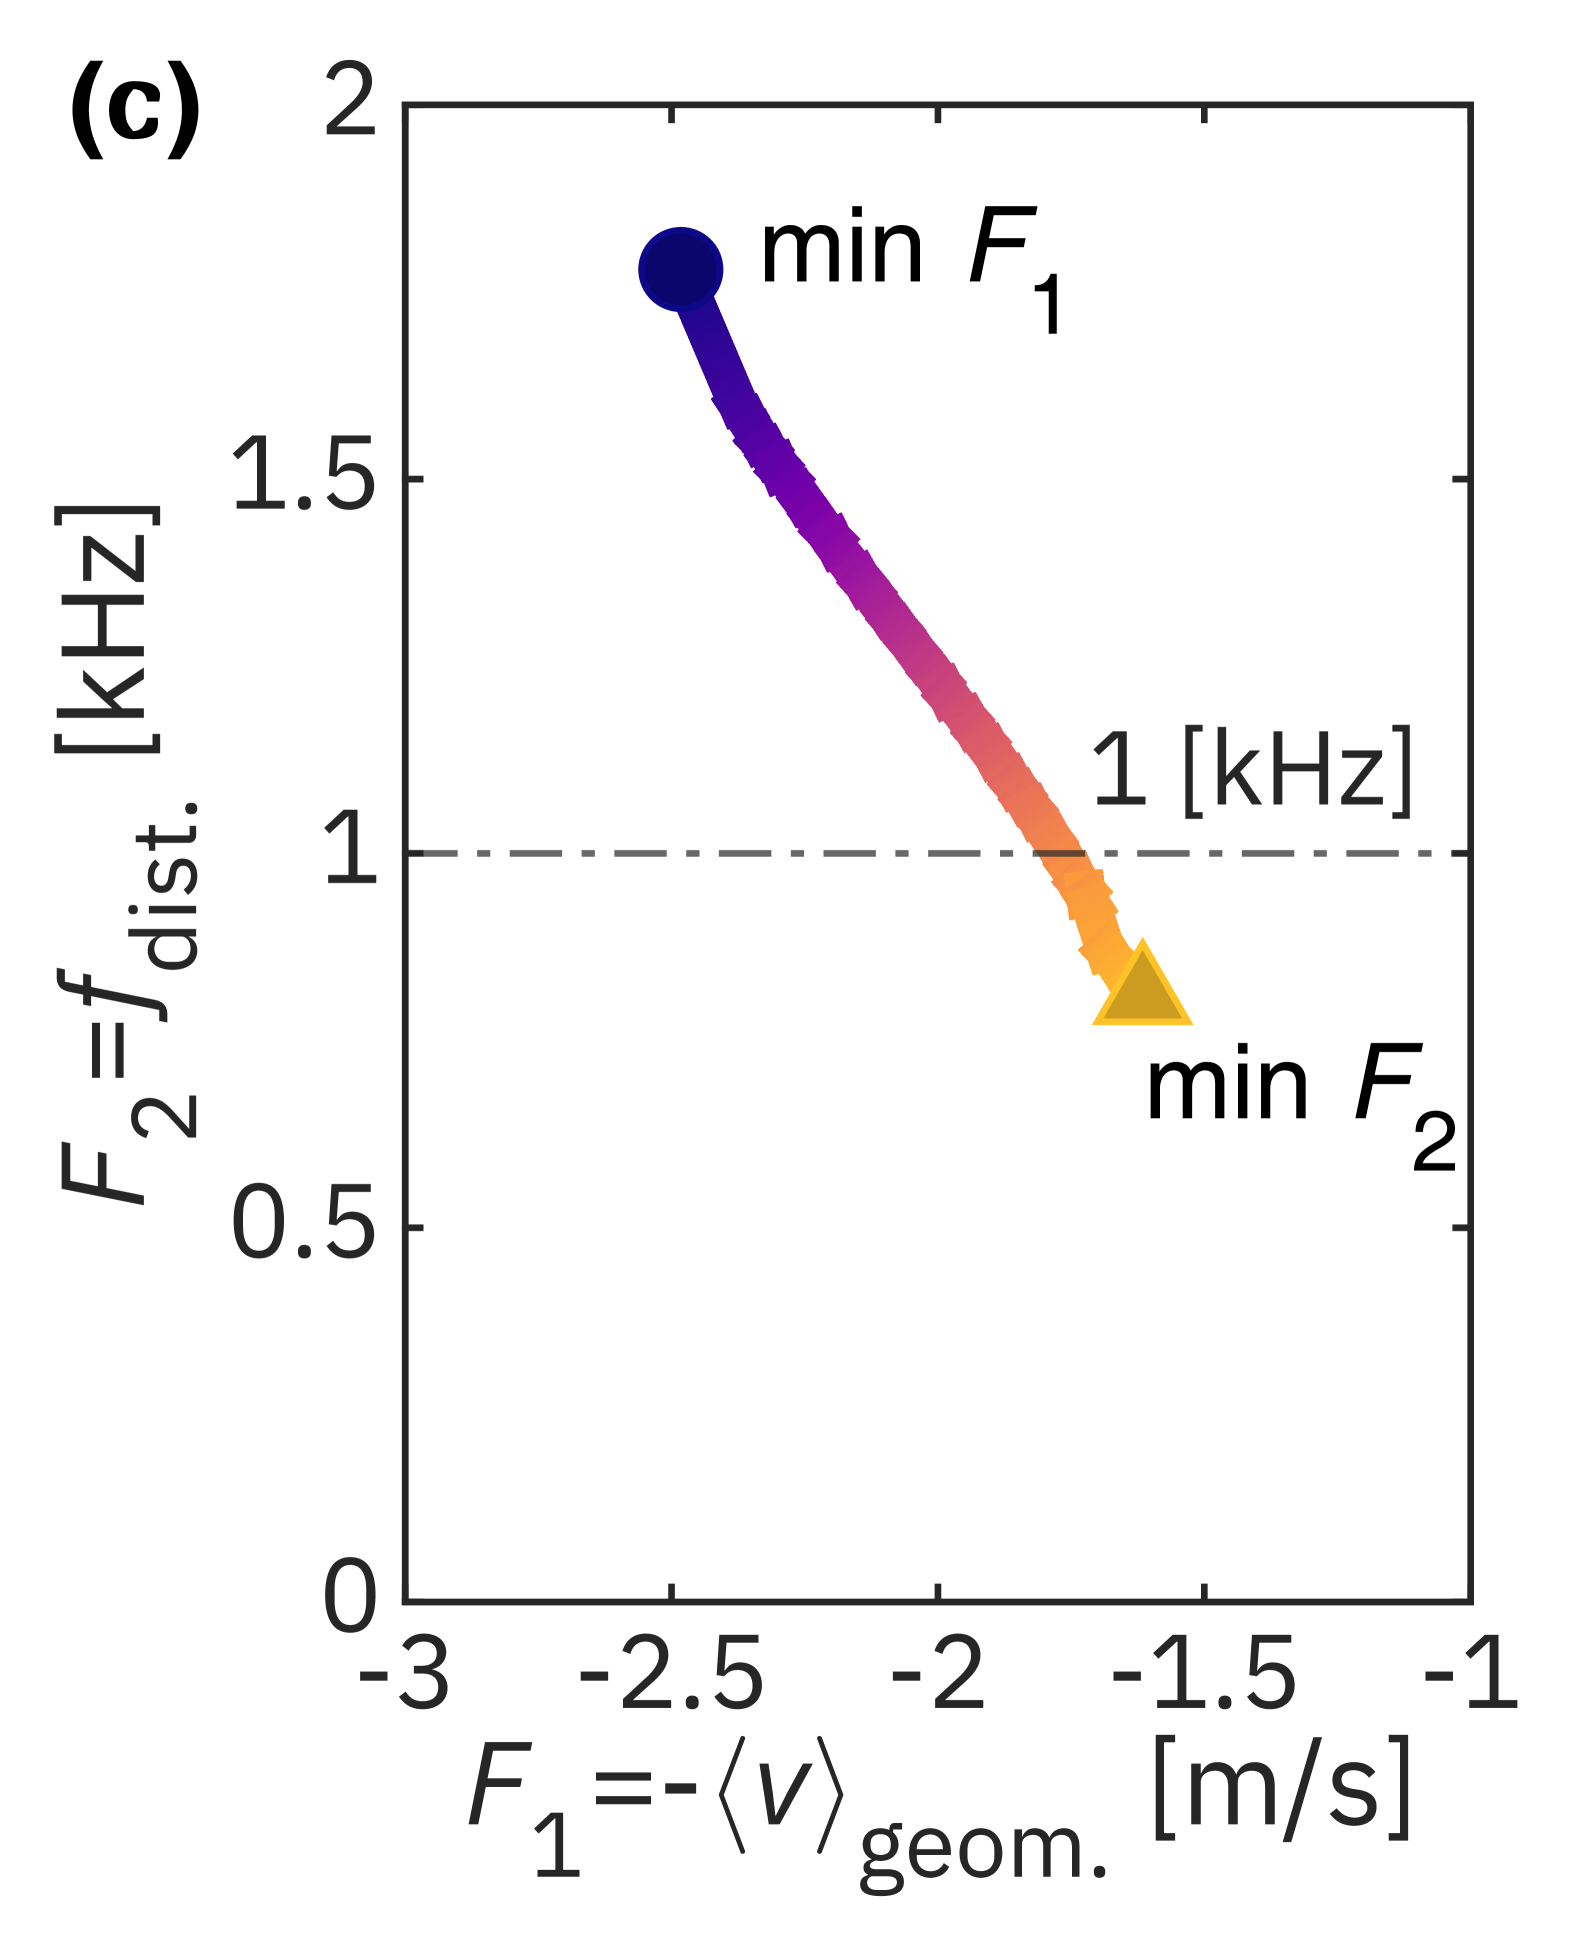
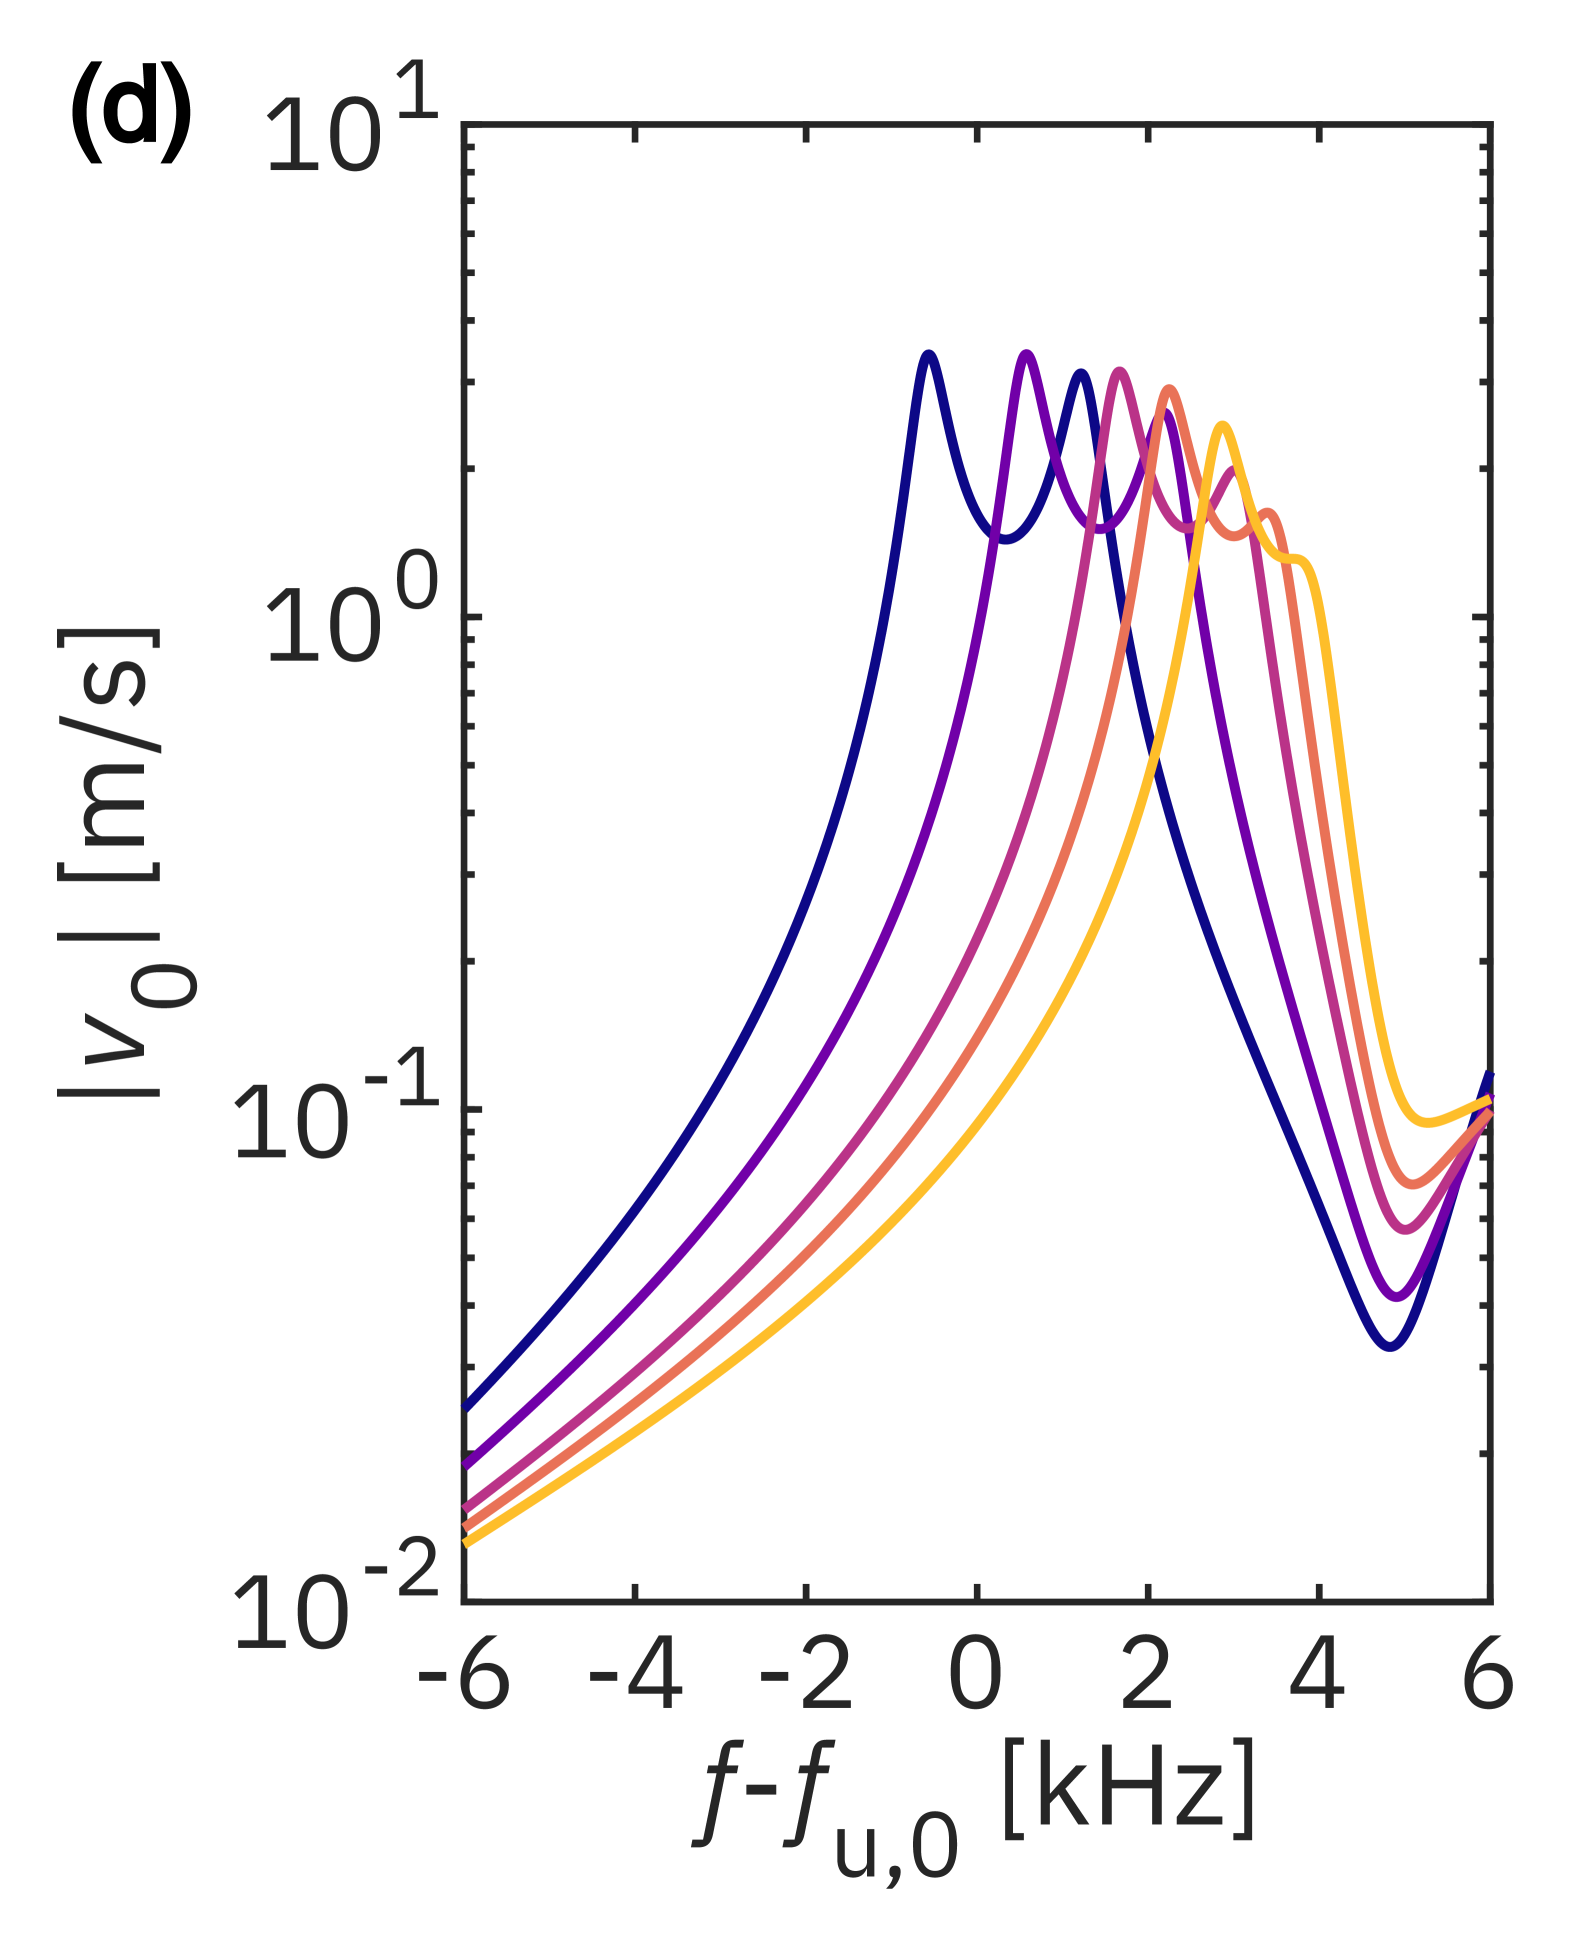
Multi-objective optimization was performed through the gamultiobj function, with useParallel=true set by Global Optimization Toolbox and Parallel Computing Toolbox in MATLAB 2024b. The specific procedure used for this process is summarized in Algorithm LABEL:alg:multiopt[37]. The optimization produced a Pareto front, illustrating the trade-offs between the two objectives as shown in Fig. 6(c). Figure 6(d) presents the frequency responses of the plate’s center velocity when either or is minimized. When the minimization of is prioritized, the velocity amplitudes at both resonances become comparable (), as depicted by the darkest line. In contrast, minimizing yields a smaller frequency difference, but the velocity amplitude at is generally lower than at (), as indicated by the lightest line. While only five representative cases are shown, the frequency response gradually changes along the Pareto front as the optimization objective shifts from to .
In summary, when is minimized, decreases, but decreases, so the audio SPL of the PAL decreases overall due to the low carrier velocity magnitude in the case of employing LSB-AM. In contrast, when is minimized, the velocity of the DR is maximized and is minimized as possible for the corresponding design parameter. Therefore, considering the characteristics of the frequency response curve of SPPAL, is the most optimal choice. The design parameters corresponding to the results shown in Fig. 6(c)-6(d) are as follows: the stepped plate of m, kHz, and 8th mode is coupled to the half-wavelength transducer of mm, mm, and mm, and the results as not shown here follow similar trends for the other design parameters.
III.1.2 Feasibility of dual-resonance across design parameter combinations
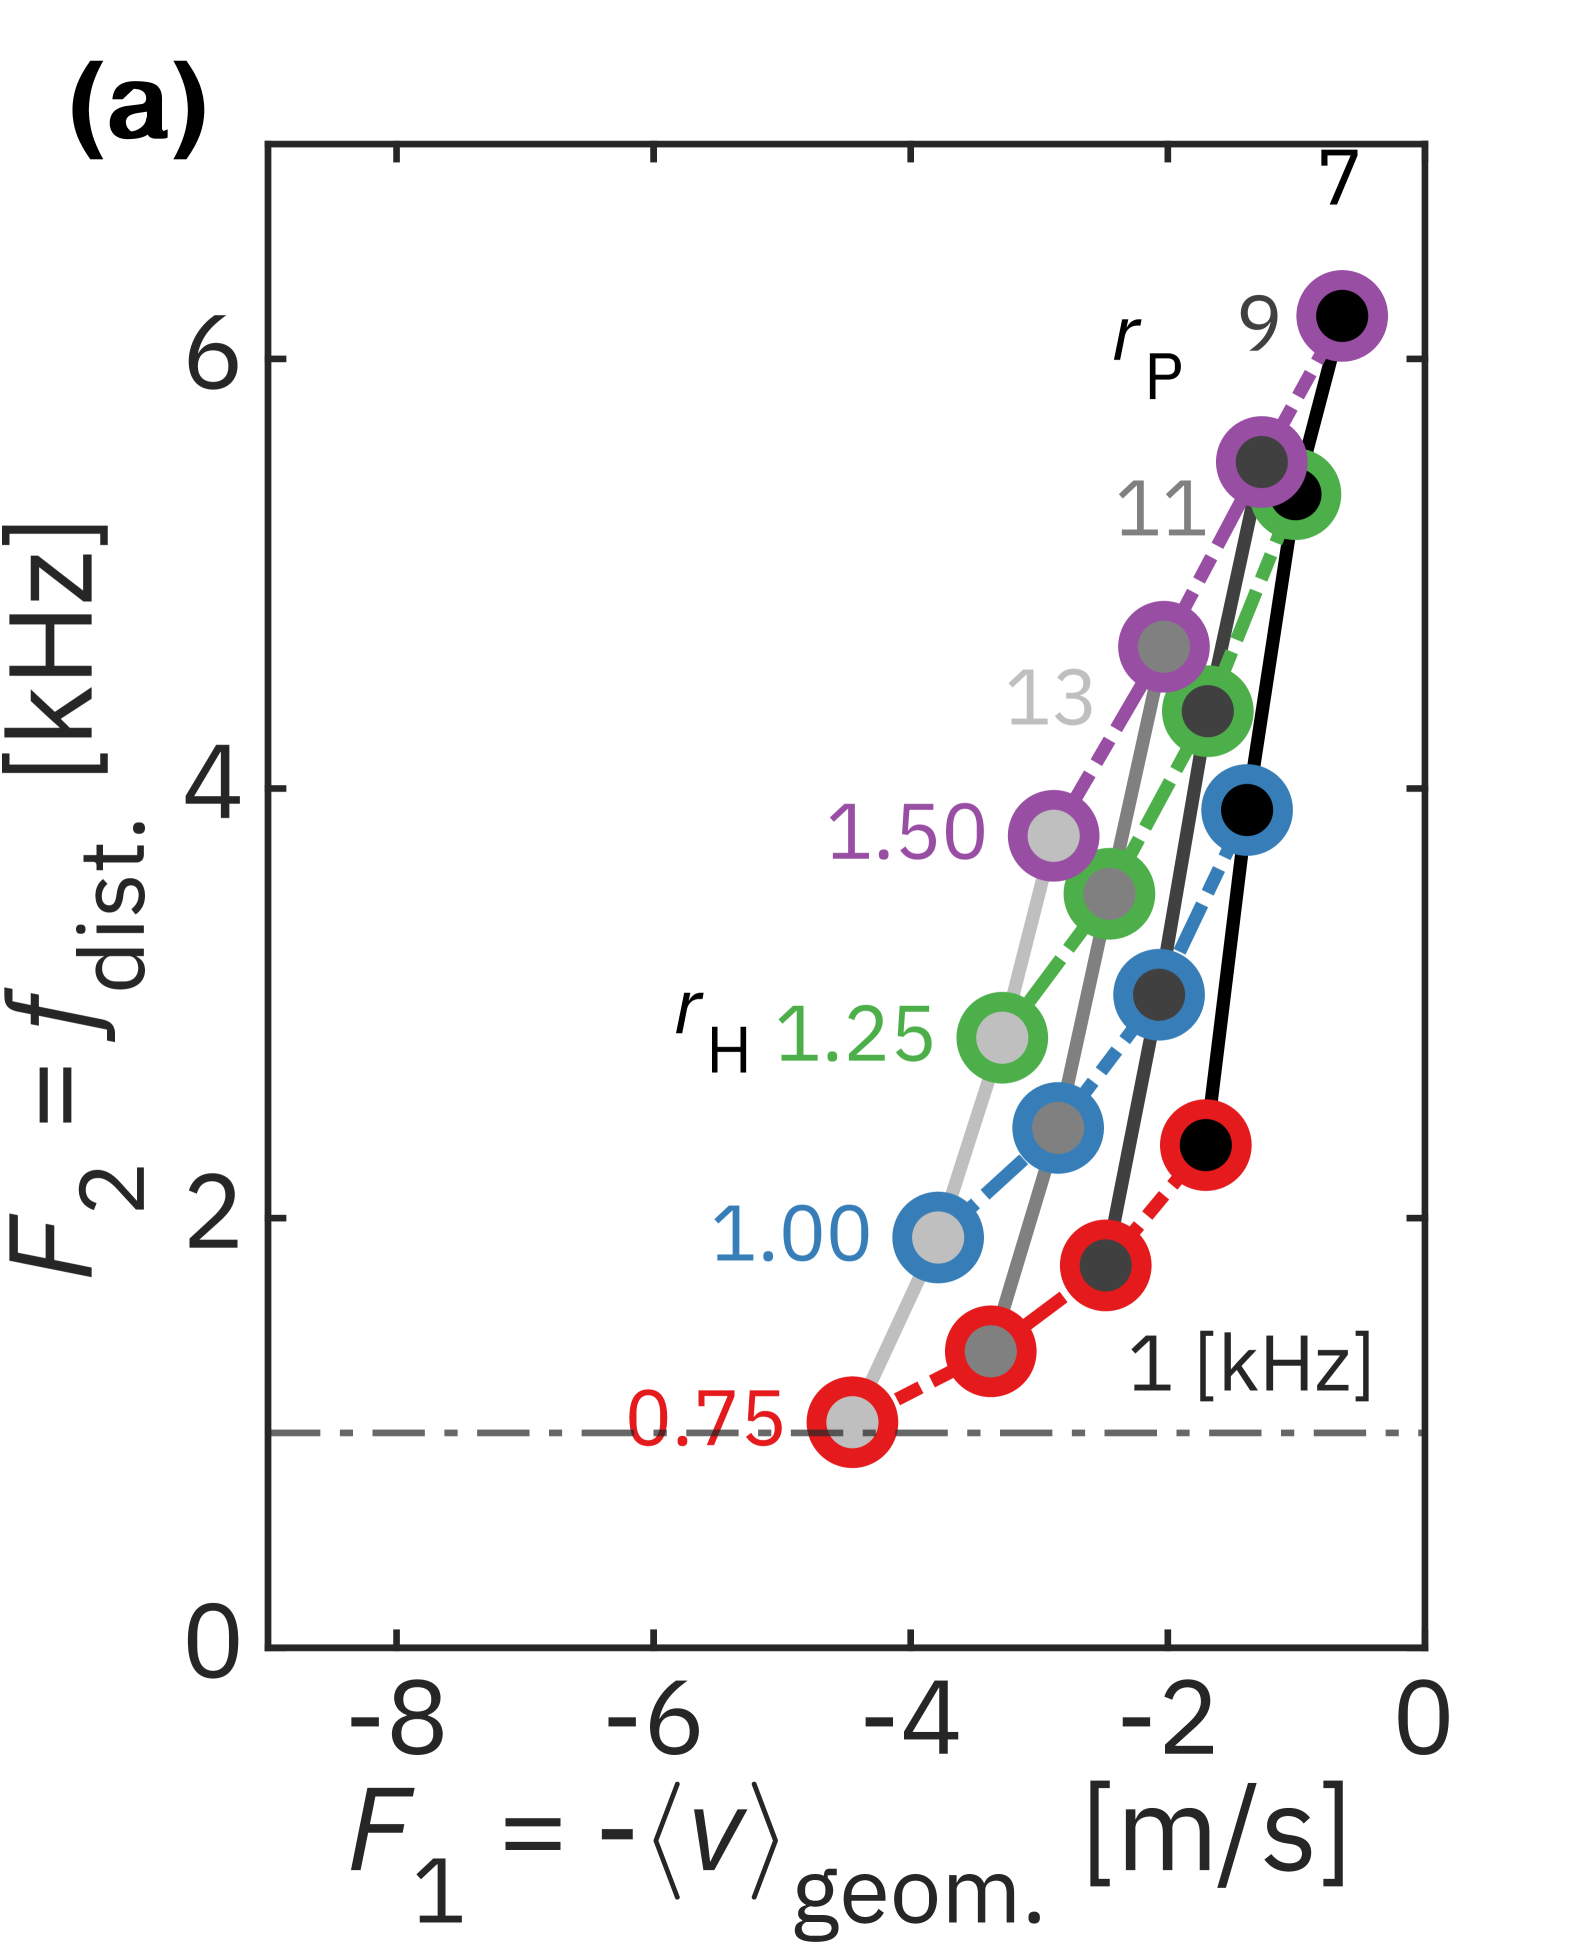
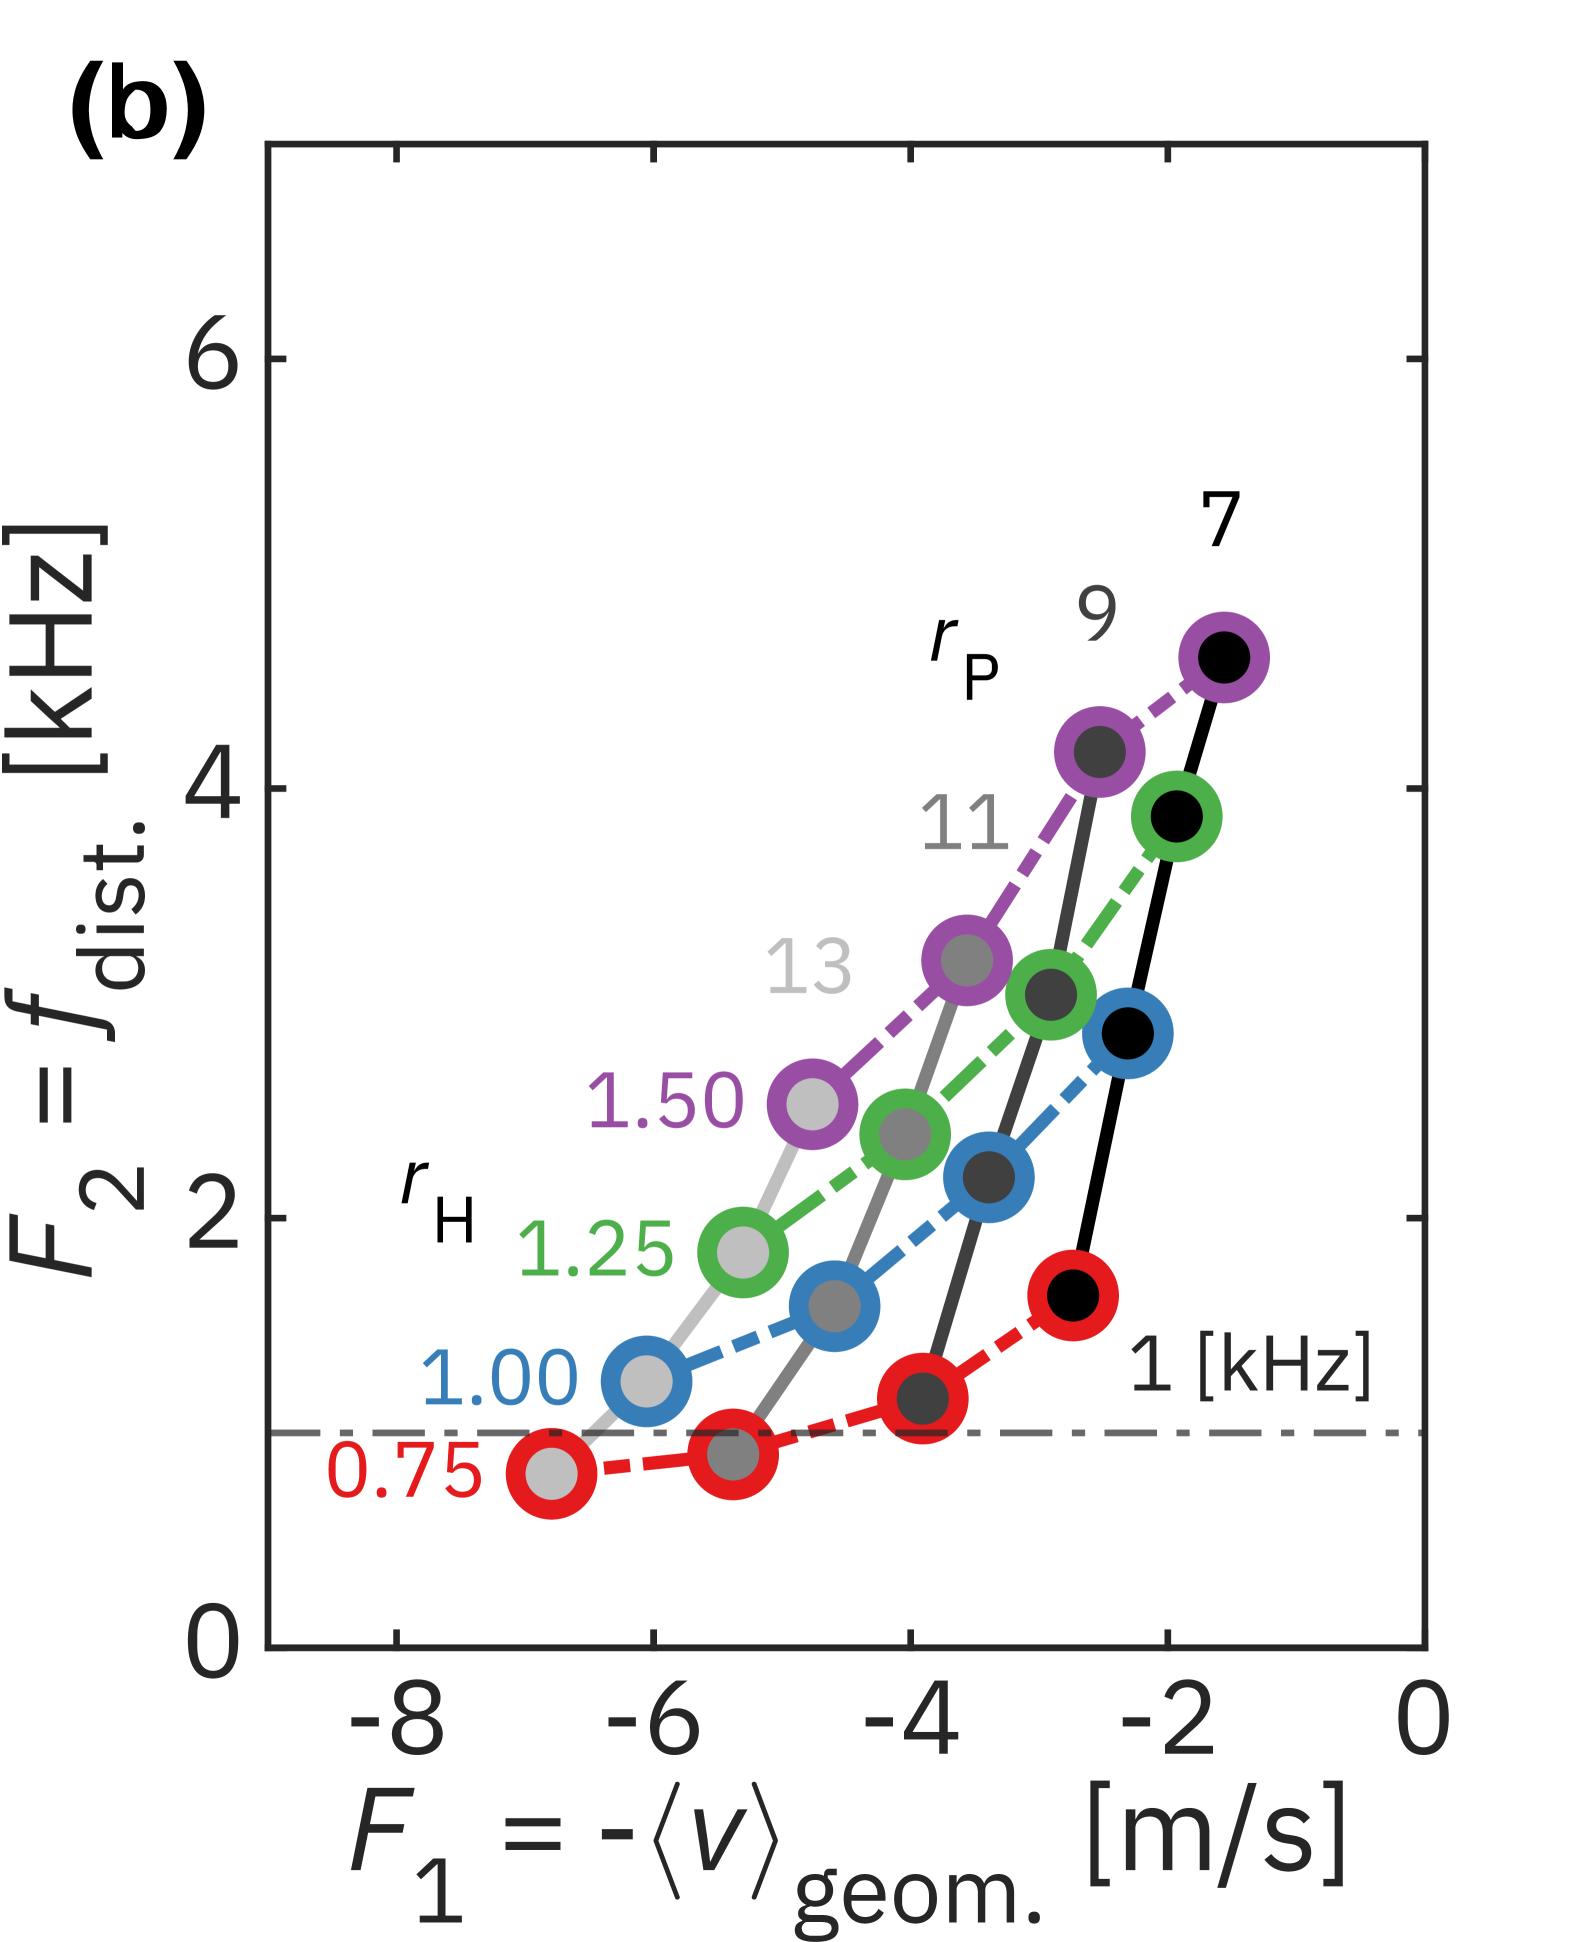
The design parameter range for the transducer coupled to the stepped plate considered above is defined as , mm, mm, and mm. The corresponding multi-objective optimization results are summarized in Fig. 7. Solid lines connect points sharing the same , while dash-dotted lines connect those with the same . As and vary, both and show monotonic trends, suggesting that interpolation may be used to estimate intermediate values despite the discrete sampling of parameters.
Certain combinations of parameters satisfy the target condition kHz, while others do not. For example, in the half-wavelength configuration, this condition is only satisfied when mm and mm. In comparison, the full-wavelength configuration achieves similar results for mm with mm, or mm with mm. However, a small horn-end radius –especially in thin-necked geometries as illustrated in Figs. 6(a) and 6(b)–can present fabrication challenges due to potential structural weakness. Therefore, manufacturability must be considered in selecting feasible design combinations.
In summary, DR operation with kHz is more easily achieved with the full-wavelength configuration than with the half-wavelength configuration. This condition tends to be met when is small and is large.
III.2 Capability of SPPAL for audio sound pressure level
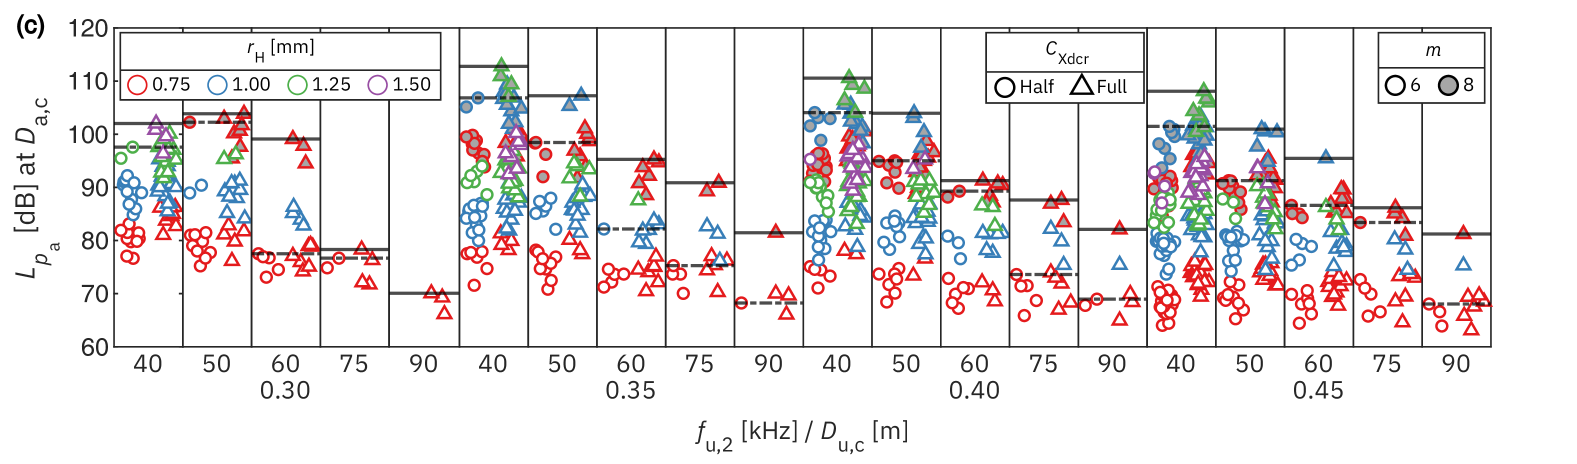
The center velocity frequency response of the plate, , in Fig. 6(d), is converted to the effective surface normal velocity of the stepped plate, , using the ER, . Among the DR SPPALs designed via multi-objective optimization, the audio SPL at the audio CD is predicted using the SWE method, as further detailed in Sec. LABEL:subsec:s21[37]. The simulation time per case is approximately seconds, enabling rapid exploration across a broad parameter space. Figure 8(a) presents the results for cases with Hz.
Figure 8(c) summarizes these results by presenting the peak audio SPL at audio CD as a representative performance metric, offering a compact visualization of how the design parameters influence acoustic output. Each box corresponds to a specific combination of and . White and gray-faced markers indicate the 6th and 8th modes, respectively, while circular and triangular markers represent half- and full-wavelength transducer. Within each box, solid and dash-dotted horizontal lines indicate the maximum audio SPL for the full- and half-wavelength configurations, respectively. The color of each marker encodes the horn-end radius, . This summary plot facilitates an intuitive understanding of the performance landscape across the design space and provides practical guidance for SPPAL design. Although certain design parameters were expected to involve trade-offs, the evaluated parameter space shows generally monotonic trends without clear evidence of internal optima.
Several such trade-offs can be anticipated. For example, with a fixed , increasing reduces the aperture radius , which decreases the mechanical impedance and increases –enhancing primary wave radiation. However, the resulting reductions in both aperture size and absorption length lead to a smaller effective volume of the parametric array, thereby limiting the generation of difference-frequency components and potentially lowering the audio SPL. Similarly, increasing the plate’s mode number reduces its thickness, which lowers and may improve , but at the expense of a reduced ER–again potentially diminishing the overall audio SPL.
Furthermore, Fig. 8(c) allows estimation of the maximum horn-end radius that can satisfy the kHz condition for various design parameter combinations. The results suggest that full-wavelength configurations can generally accommodate slightly larger values than half-wavelength ones, improving manufacturability without compromising acoustic performance. As directly affects the ease and cost of fabrication–particularly in avoiding thin-necked horns–identifying the upper bound of is critical for cost-effective implementation.
It is noted that some simulation results may exhibit reduced accuracy due to the limitations of the Westervelt-based SWE model, which excludes effects such as Lagrangian density considered in the Kuznetsov equation. However, these findings should thus be interpreted as indicative trends rather than precise quantitative predictions.
Finally, Fig. 8(b) visualizes a contour map summarizing the results in Fig. 8(c), overlaid on the parameter space of and . This representation corresponds to the SPPAL version shown in Fig. 1(b), offering a compact overview of design trends. Solid contour lines indicate , dash-dotted lines show constant , and dashed lines denote the aperture radius . For example, at m, decreasing from to kHz raises from approximately to dB, guiding appropriate SPPAL configurations for target receiver locations. These interdependencies among design parameters and performance metrics can be further understood by referring to the correlation matrix in Fig.LABEL:fig:s7[37].
III.3 Design for manufacturing
The design guide developed in Sec. III.2 serves as a basis for selecting appropriate parameters according to target audio performance and receiver placement. This section focuses on a design-for-manufacturing (DFM) approach, in which the selected parameters are refined with practical constraints in mind. In addition to performance considerations, DFM requires attention to structural integrity under assembly and operational loads, including factors such as thread stripping during piezoelectric prestressing and the linear elastic limit of the preload bolt.[41, 42] Accordingly, key aspects such as thread engagement length, piezoelectric ring geometry, and fastener dimensions must be optimized.[40]
III.3.1 Design through global optimization
Based on the discussion in Sec. III.1.1, global optimization was conducted under the premise that minimizing only objective function 1, , is sufficient to achieve the desired velocity frequency response of the SPPAL. Although surrogate optimization algorithms do not require the objective function to be smooth, they perform optimally when the function is continuous.[43] Additionally, because reducing computational cost is prioritized in FEM-based optimization, objective function evaluations were conducted according to Algorithm LABEL:alg:globalopt[37], which introduces intentional discontinuities without significantly impairing optimization performance. Additionally, acoustic loading was excluded during optimization to further reduce computational effort. Instead, acoustic simulations were conducted afterward to evaluate the optimized design.
The final design parameters selected from global optimization are as follows: m, kHz, , , mm, mm, and mm. The piezoelectric ring was fabricated using C-21 material (Fuji Ceramics), with an inner diameter mm, thickness mm, and a copper electrode thickness µm. An M40.7 metric fastener was employed, with a counterbore depth mm, complete thread length mm, incomplete thread length mm, and minimum remaining wall thickness mm. The optimized SPPAL’s center velocity frequency response under acoustic loading conditions is shown in Fig. 9, with m/s and kHz.
Global optimization was performed using the surrogateopt function from the Global Optimization Toolbox in MATLAB 2024b. Design variables and simulation results were exchanged with COMSOL Multiphysics via LiveLink for MATLAB. Each objective function evaluation involved eigenfrequency and frequency-domain analyses incorporating piezoelectric-solid and electrostatic coupling. The entire process took approximately three hours on a workstation equipped with dual Intel Xeon Silver 4210 processors ( GHz) and GB of RAM.
III.3.2 Framework for nonlinear acoustic simulation
To further evaluate the nonlinear acoustic performance of the DFM-optimized SPPAL, two numerical frameworks were considered: a hybrid approach combining FEM with the SWE method (Method B), and a full-domain FEM simulation (Method C). Both are based on successive approximations of the Westervelt equation but differ significantly in computational cost and spatial coverage. Method B enables efficient evaluation of the audio beam pattern by using the FEM-computed velocity distribution of the stepped plate as the boundary condition for SWE, whereas Method C directly simulates the full nonlinear field, requiring high spatial resolution and large computational domains. A detailed comparison between these methods is provided in Sec. LABEL:sec:s2[37], demonstrating that Method B offers a favorable trade-off between accuracy and efficiency, particularly for modeling directional audio fields in resource-constrained environments.
IV Experiment
IV.1 Realization
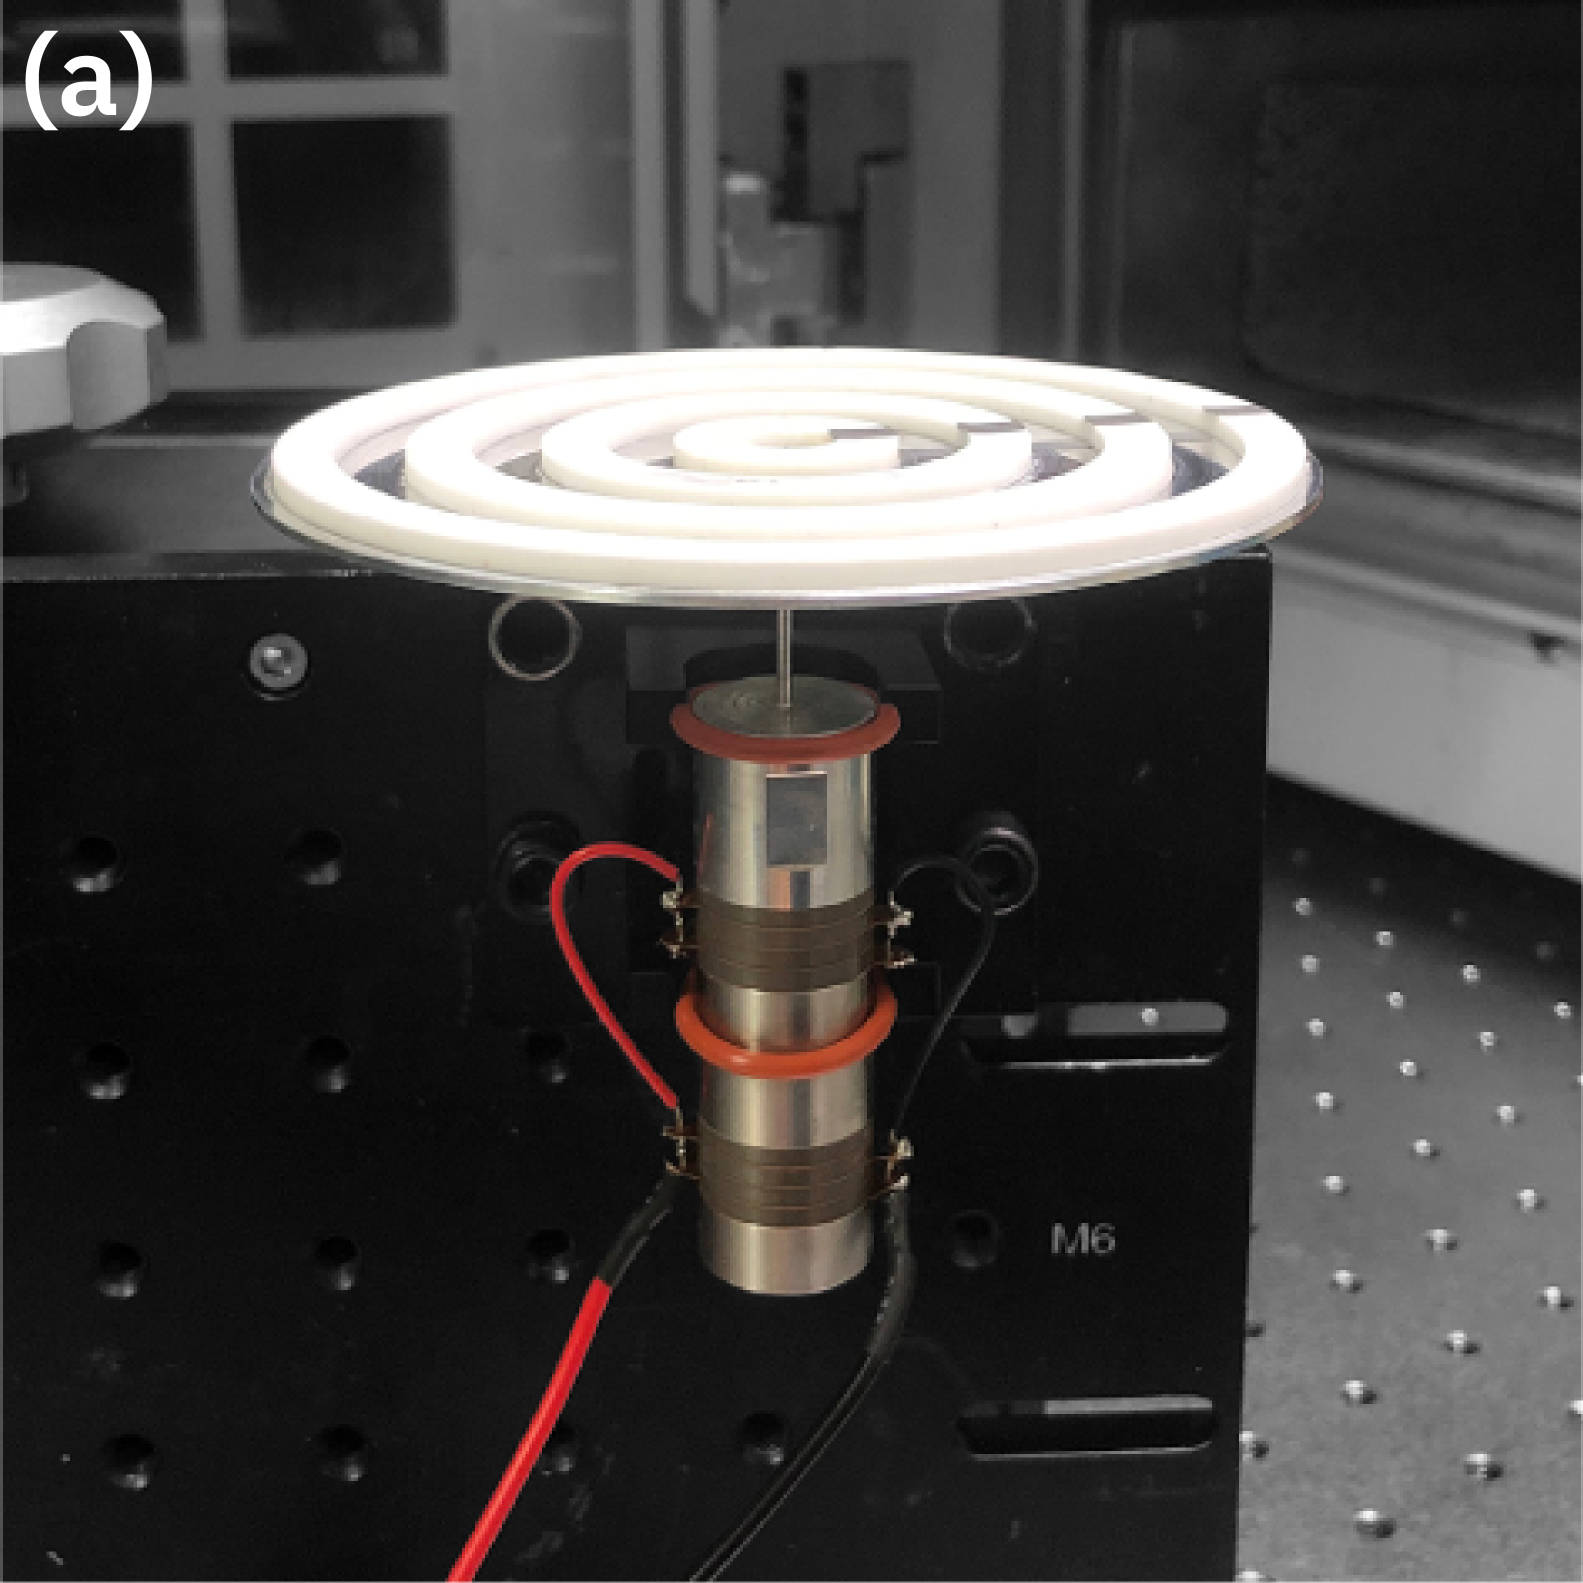
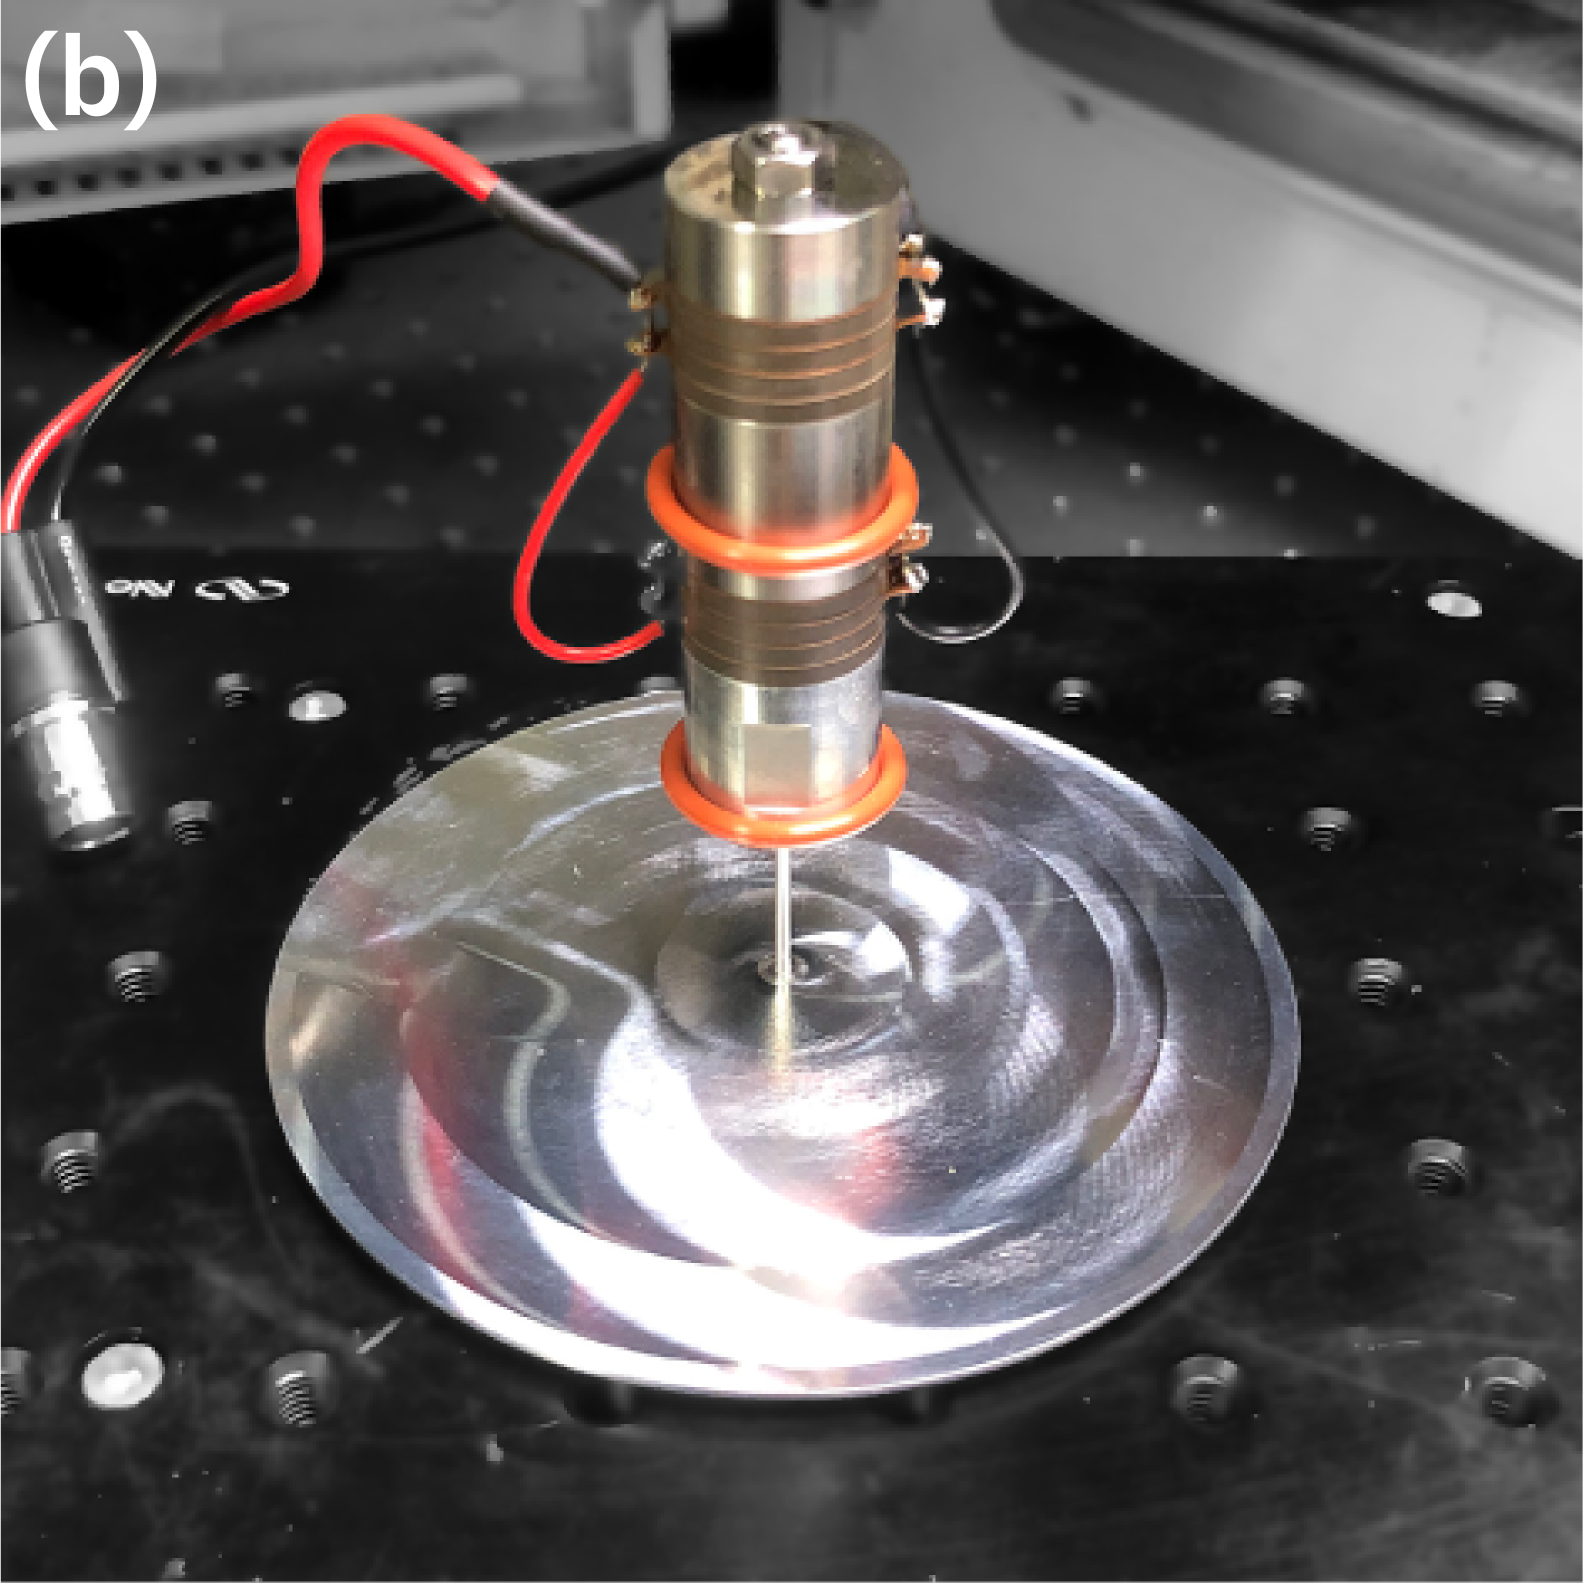
Figure 10 shows photographs of the fabricated SPPAL from top and bottom views. The transducer components were machined from aluminum and stainless steel. During assembly, a custom-designed clamping jig was used to hold the transducer in place under bias, while a dedicated aligner ensured accurate coaxial alignment between the piezoelectric rings and the transducer body. The preload on the bolt was controlled using a Tohnichi CL15NX8D torque wrench to maintain consistent mechanical prestress. The polymer annular step ring was fabricated following the procedure detailed in previous studies.[20, 21] Specifically, the polymer step was cast using a silicone mold shaped as an annular ring. The mold was filled with a mixture of Henkel Loctite Stycast 1266 epoxy encapsulant and PB-725, a micro-shell-type ultralight filler supplied by Seokyung CMT, at a volume mixing ratio of 1:3.
IV.2 Vibrational characteristics
IV.2.1 Frequency response of plate’s center velocity
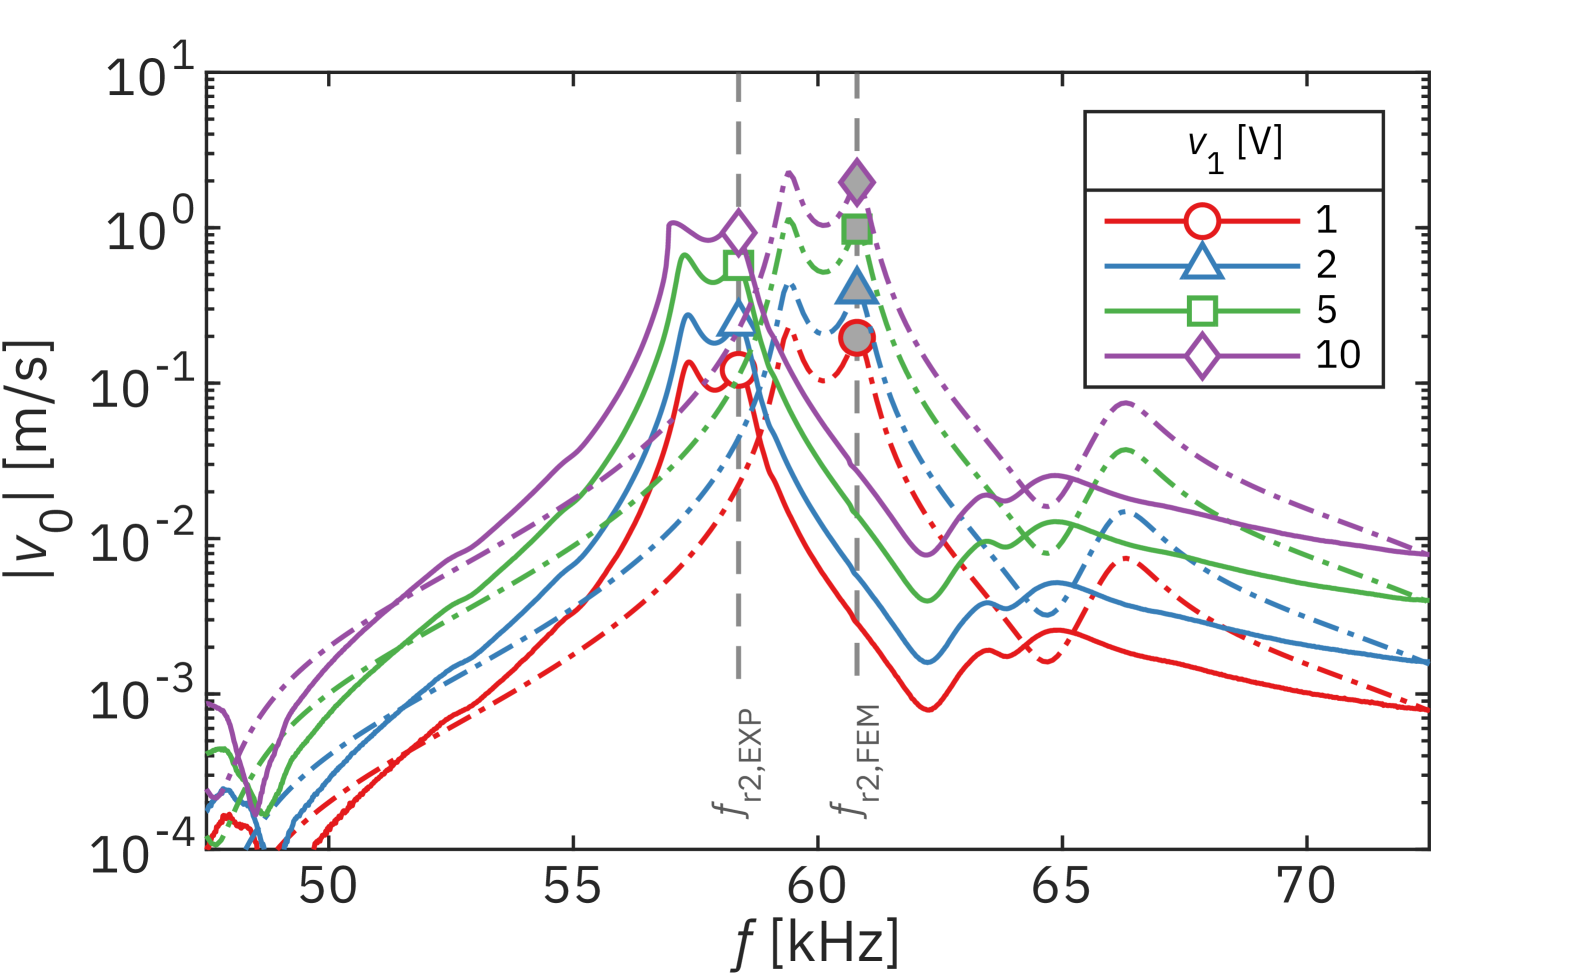
Figure 11 presents the measured frequency response of the plate’s center velocity under driving voltages of , , , and V, spanning the kHz range. Solid lines represent experimental data, while dash-dotted lines correspond to FEM results based on the DFM-optimized design. The simulations assumed an applied voltage of V (equivalent to kV/m), whereas in practice, the transducer was driven up to V due to the onset of nonlinear effects.
The measurements clearly demonstrate DR behavior near kHz, in qualitative agreement with FEM predictions. Quantitatively, reached approximately m/s at the maximum driving voltage of V, while was around kHz, with resonance peaks between kHz and kHz. Vertical dashed lines labeled and indicate the simulated and measured carrier frequencies for LSB-AM operation. A downward frequency shift was observed due to fabrication tolerances, which resulted in a thinner-than-designed plate. At voltages above V, nonlinear effects emerged, including amplitude growth and resonance shifts. These results highlight the need to consider both nonlinear dynamics and manufacturing accuracy in practical implementation. Further refinement of the piezoelectric ring and preload bolt design is recommended to reduce such discrepancies.
IV.2.2 Experimental modal analysis
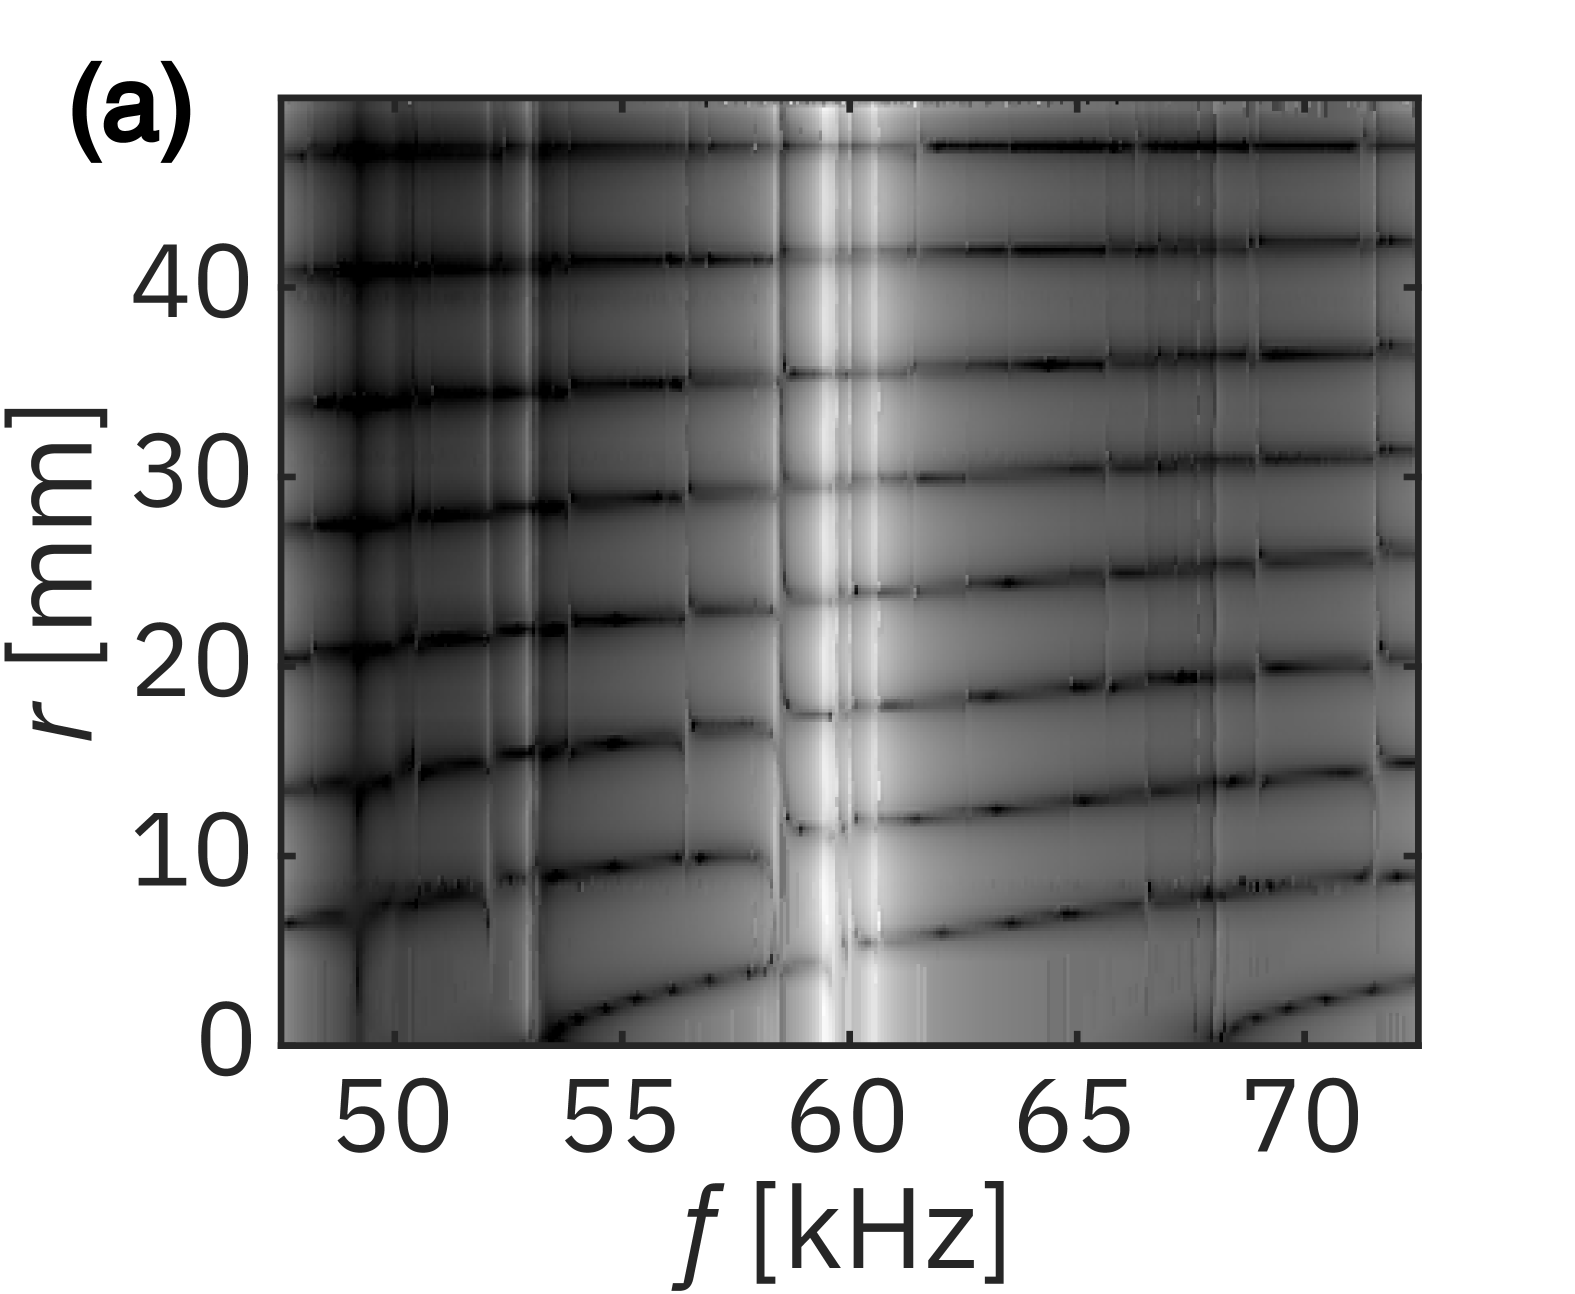
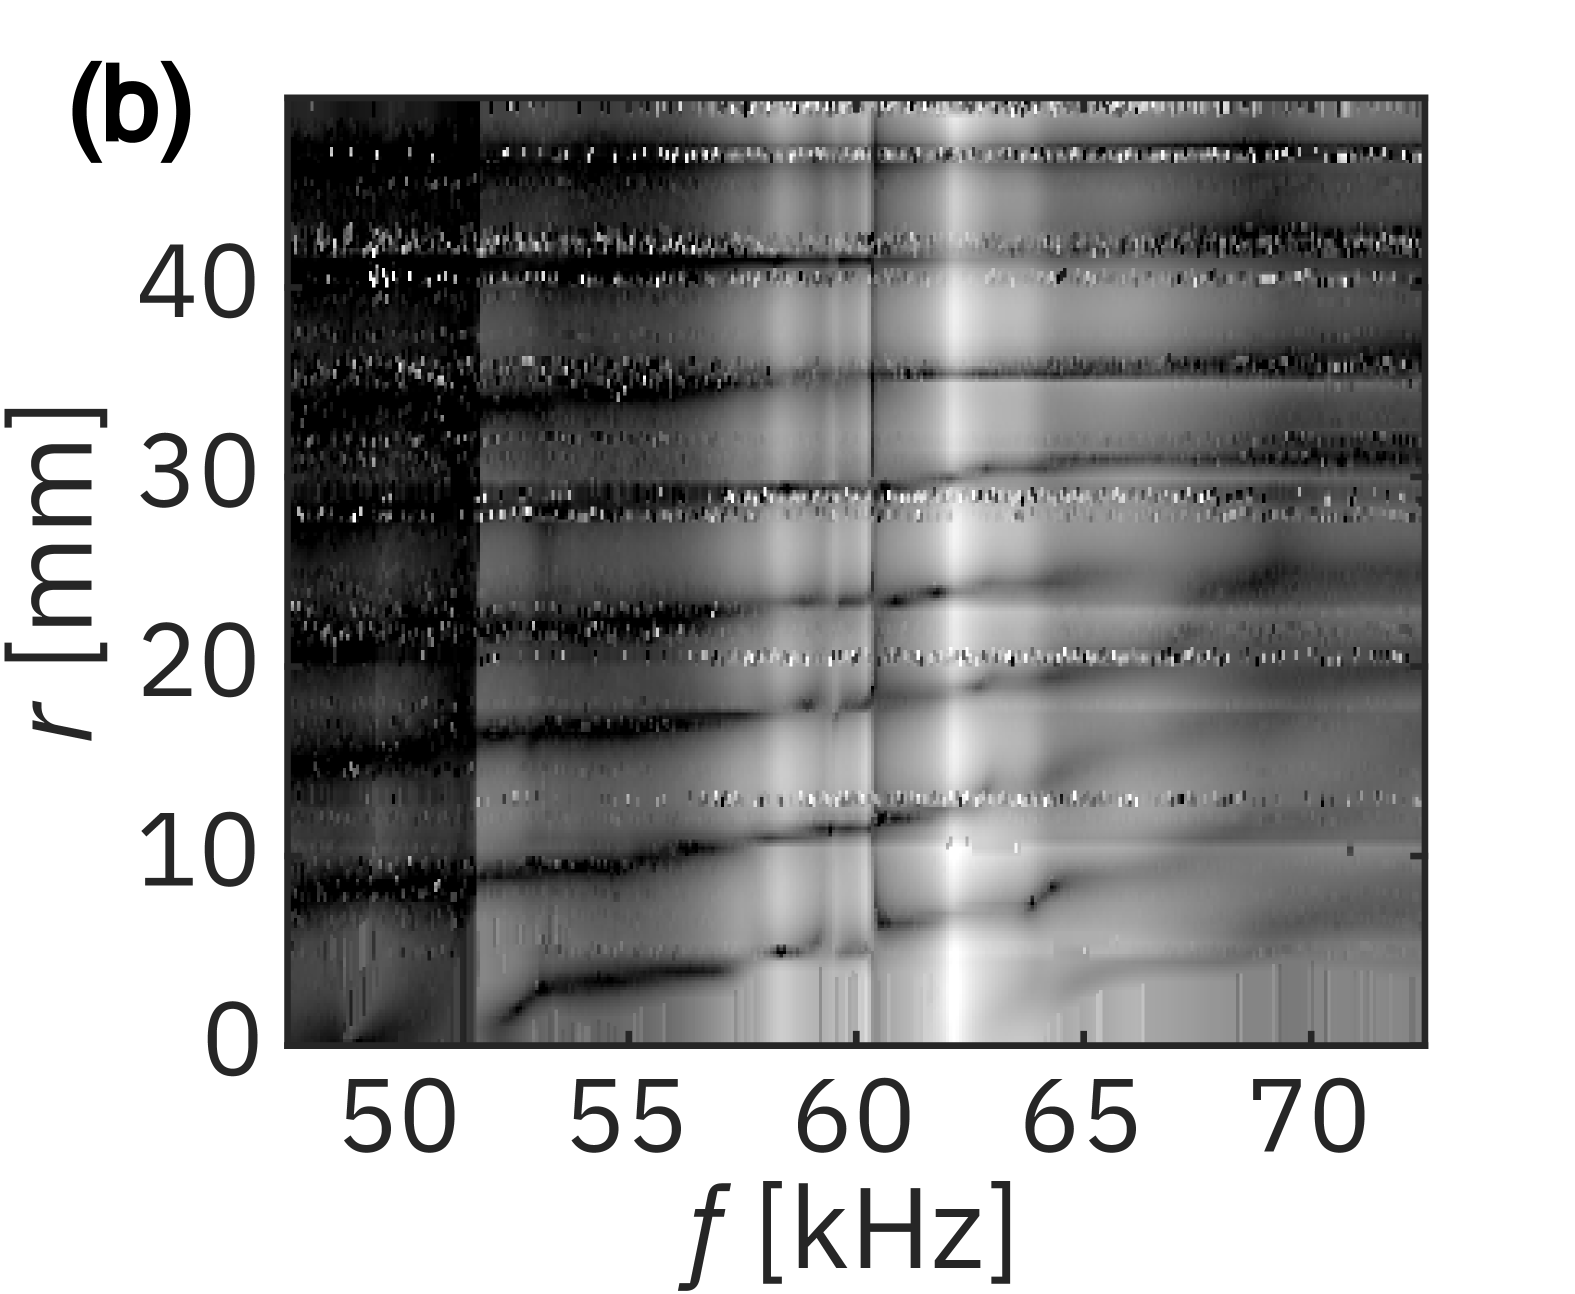
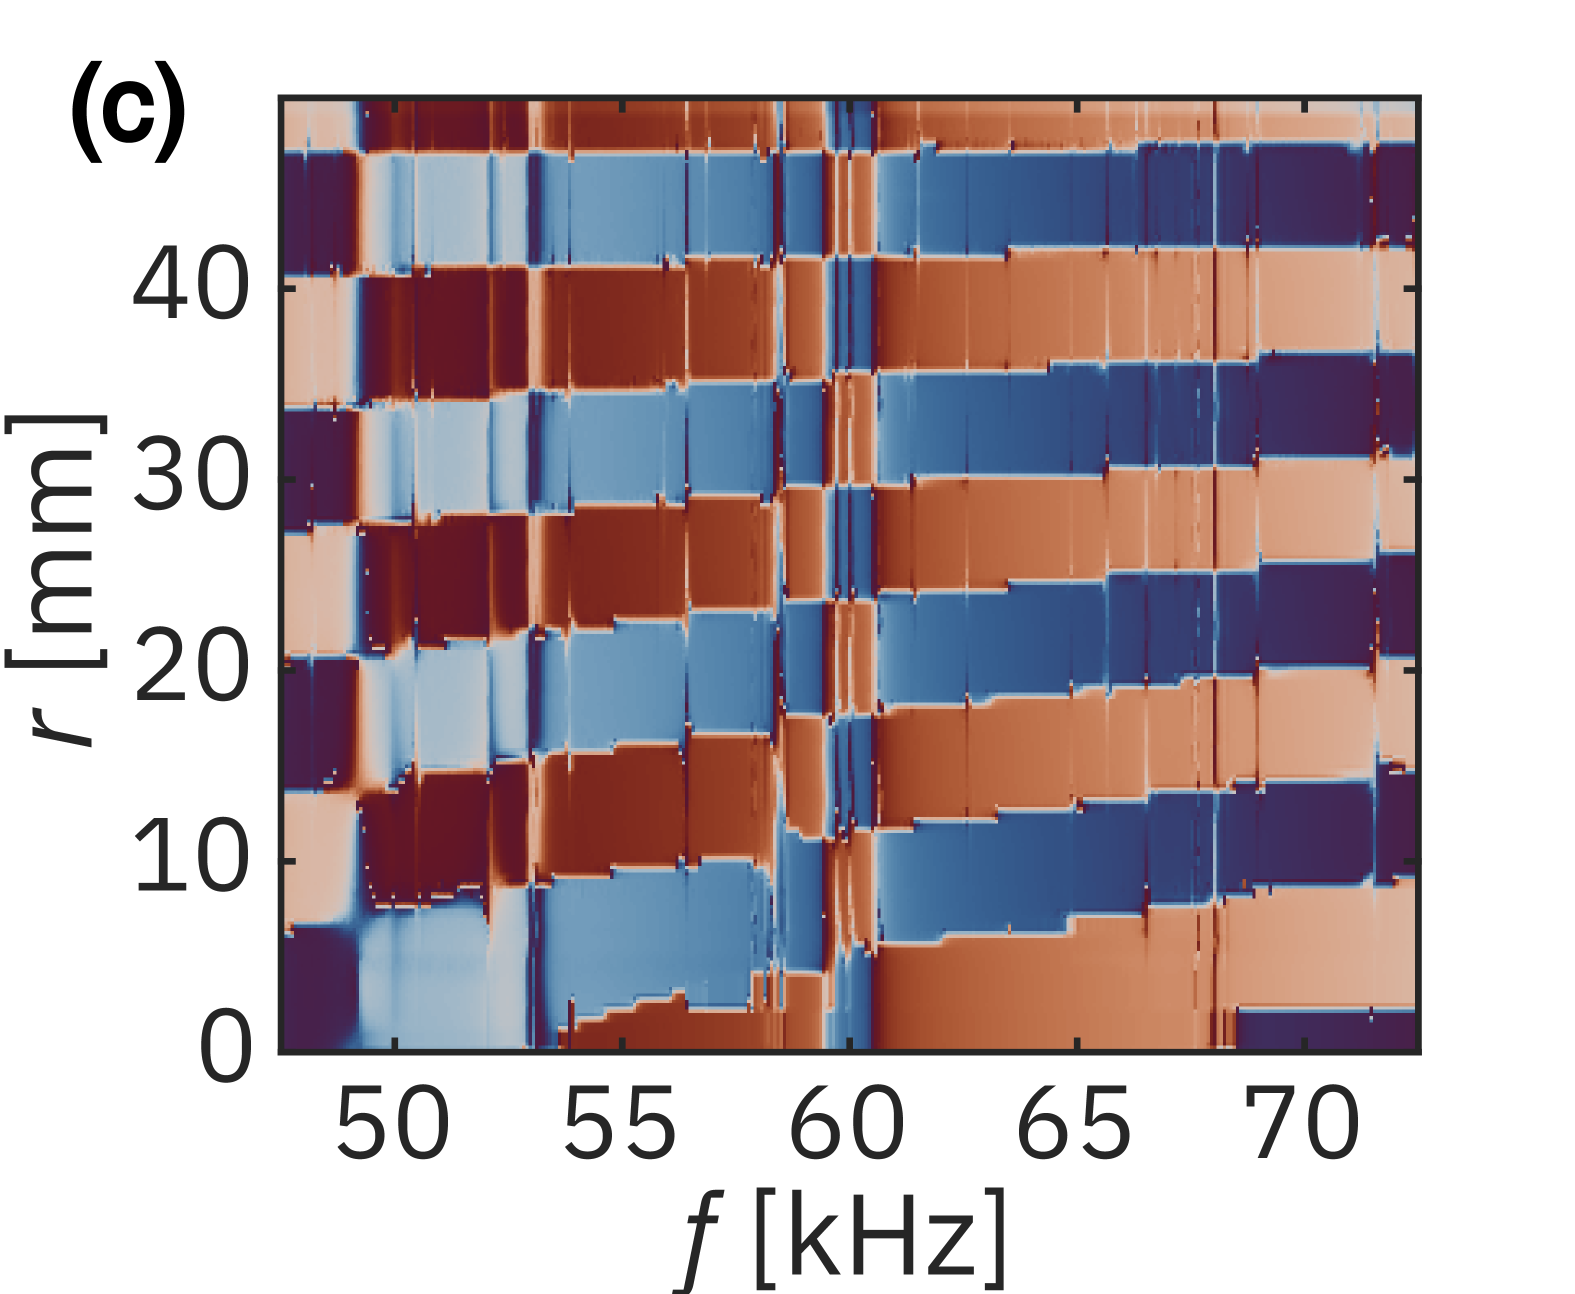
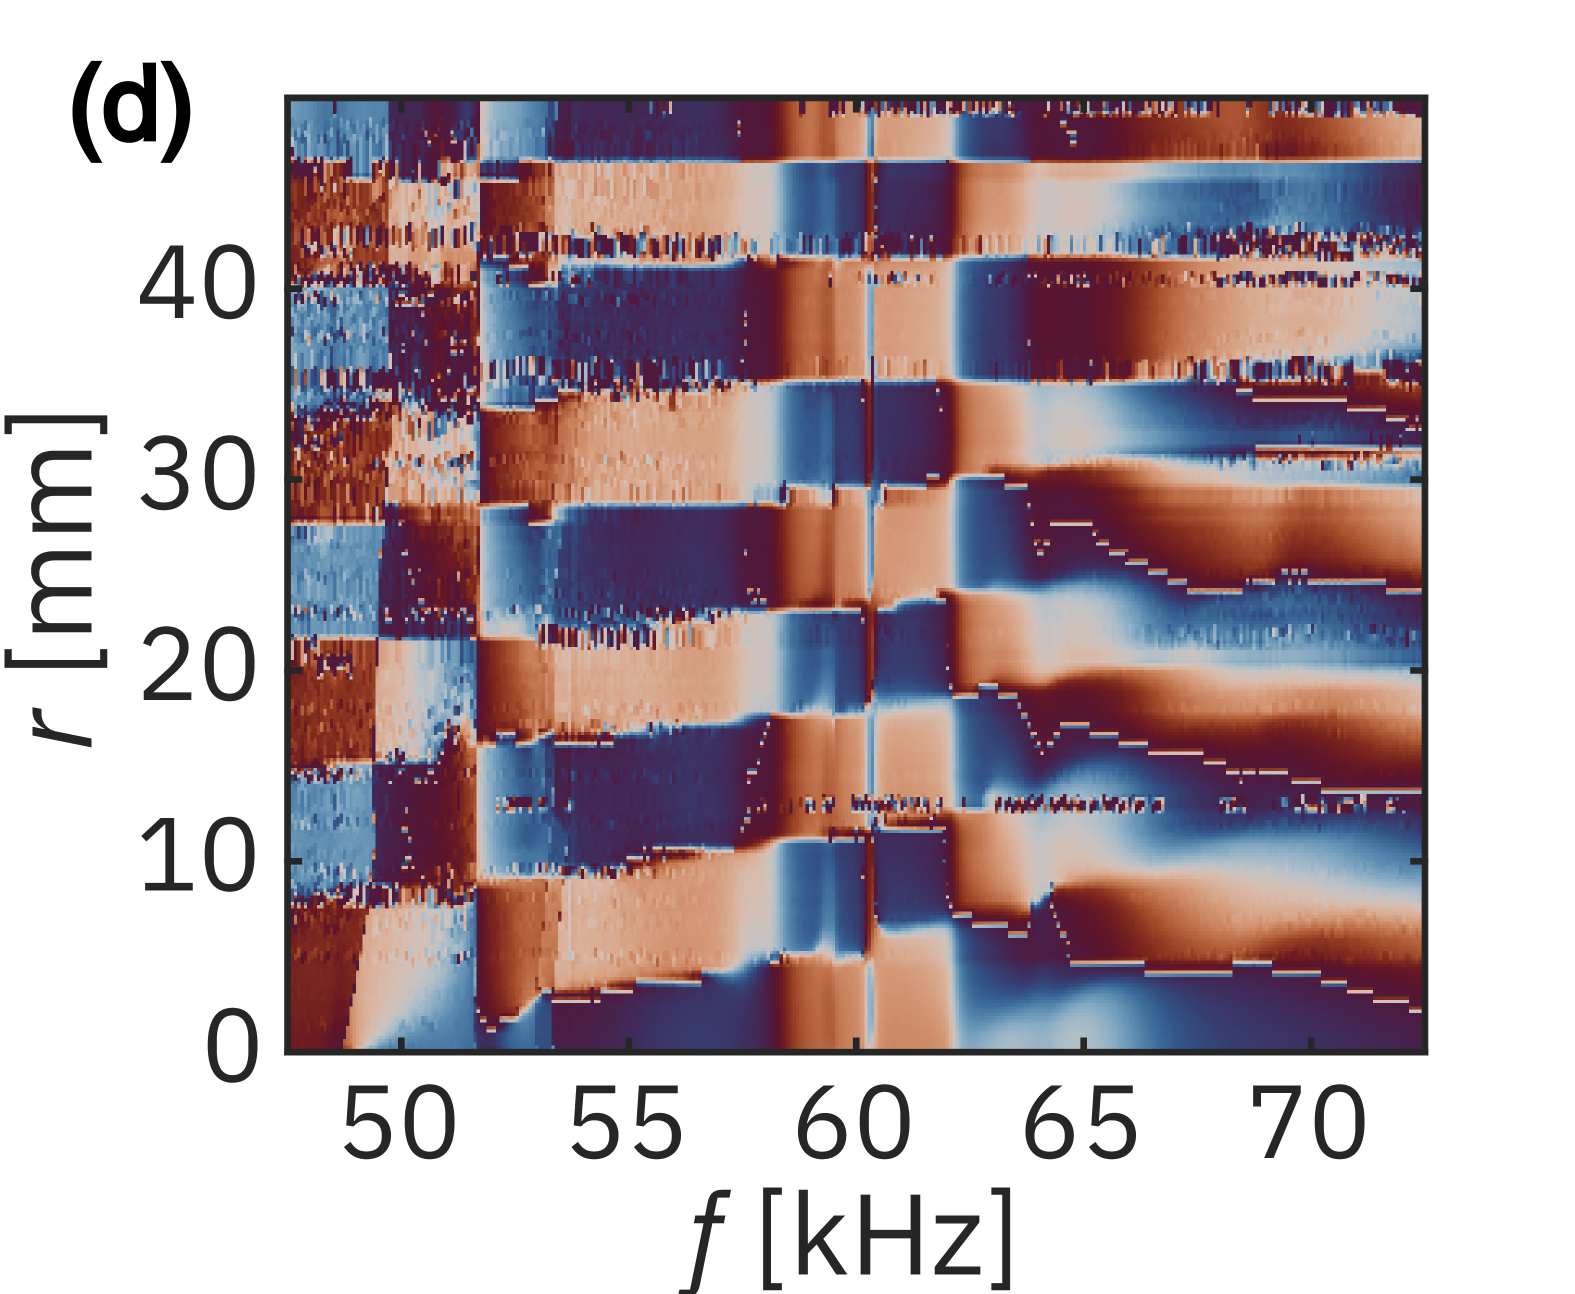
Figure 12 presents the experimental modal analysis (EMA) results of the SPPAL, showing amplitude and phase distributions along the radial direction. Figures 12(a) and 12(c) depict the response of a FP without annular steps, while Figs. 12(b) and 12(d) correspond to the SP. The FP vibrates clearly in the 8th flexural mode between approximately and kHz, with eight distinct phase reversals. Mode transitions to the 7th and 9th modes occur below and above this range, respectively. In contrast, the SP exhibits an earlier shift to the 9th mode near kHz, attributed to the mechanical impedance changes introduced by the annular steps. The frequency span of the 8th mode defines the effective operational bandwidth of the SPPAL, over which it approximates the coherent radiation of a RP. While the specimen used for EMA was a different sample from the one analyzed earlier, it followed the same design; thus, despite slight frequency shifts, the modal behavior and step-induced effects remain consistent.
These modal characteristics play a crucial role in selecting the modulation algorithm for SPPAL operation. In particular, LSB-AM is identified as the optimal strategy. By selecting the higher resonance (approximately kHz) as the carrier, LSB-AM ensures a broader usable LSB, compared to the upper sideband (USB). In contrast, modulation schemes such as double-sideband amplitude modulation (DSB-AM) suffer from poor USB bandwidth. Wideband approaches like square-root and modified amplitude modulation (SRT-AM, MAM)[8] are also unsuitable due to the limited radiation bandwidth inherent to SPPAL.
IV.3 Acoustic characteristics
IV.3.1 Ultrasound
Frequency response
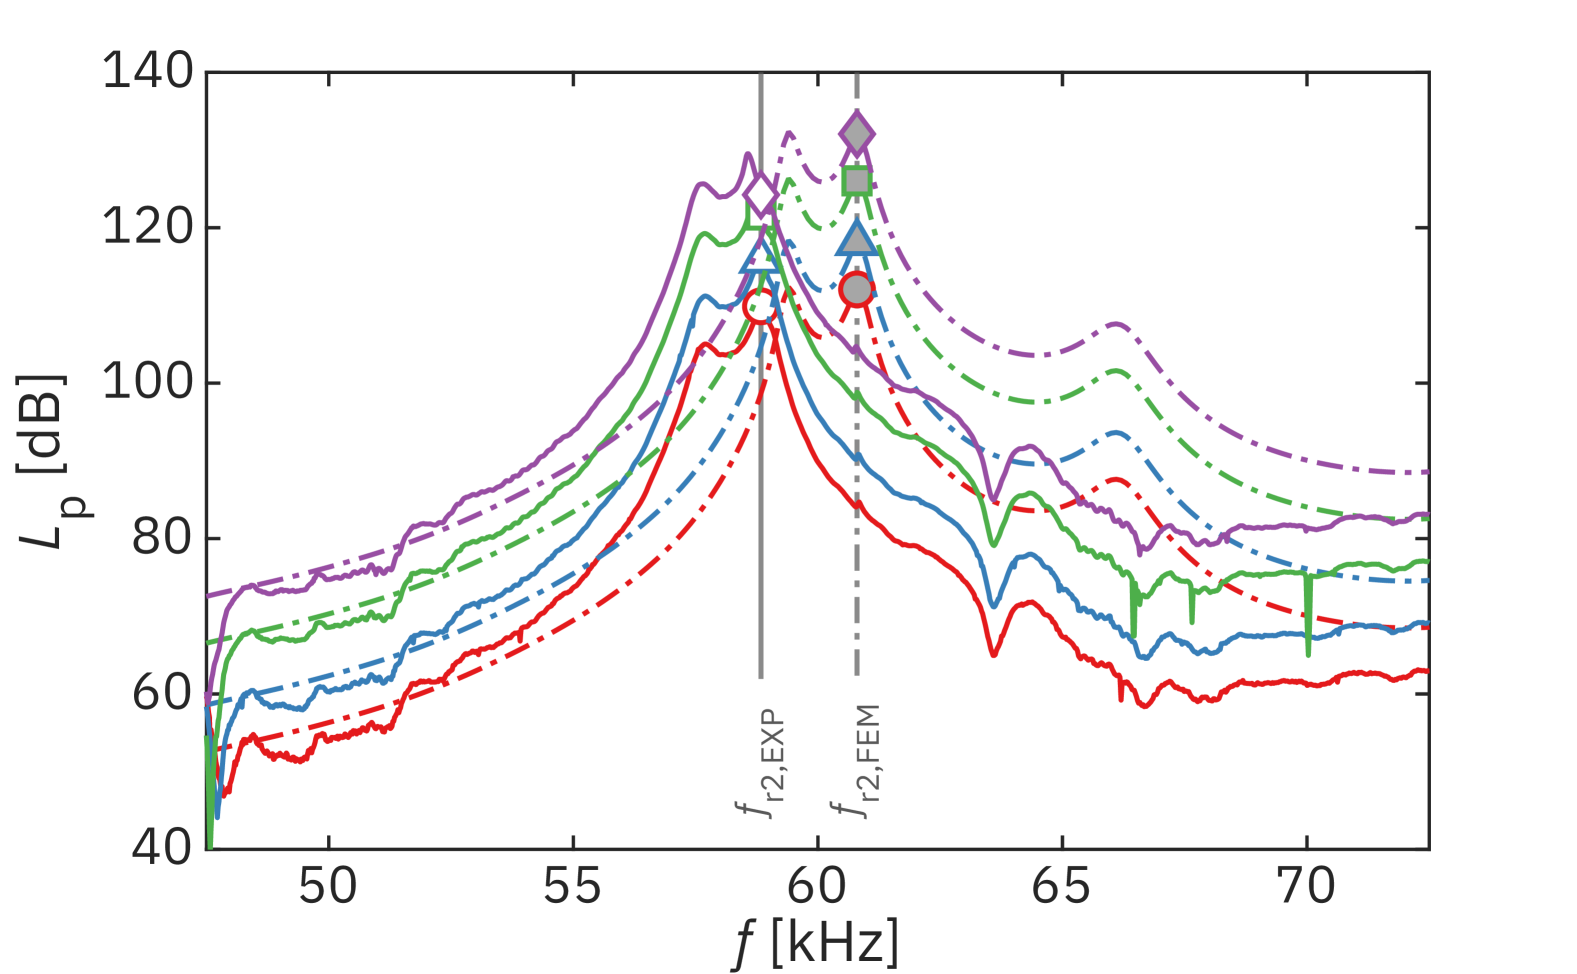
Figure 13 presents the measured ultrasound frequency responses of SPPAL at driving voltages of , , , and V, recorded at m. Solid lines represent experimental data, while dash-dotted lines indicate FEM simulation results from Method B. Similar to Fig. 11, the ultrasound acoustic responses exhibit pronounced DR peaks around the experimentally determined carrier frequency kHz.
Propagation curve
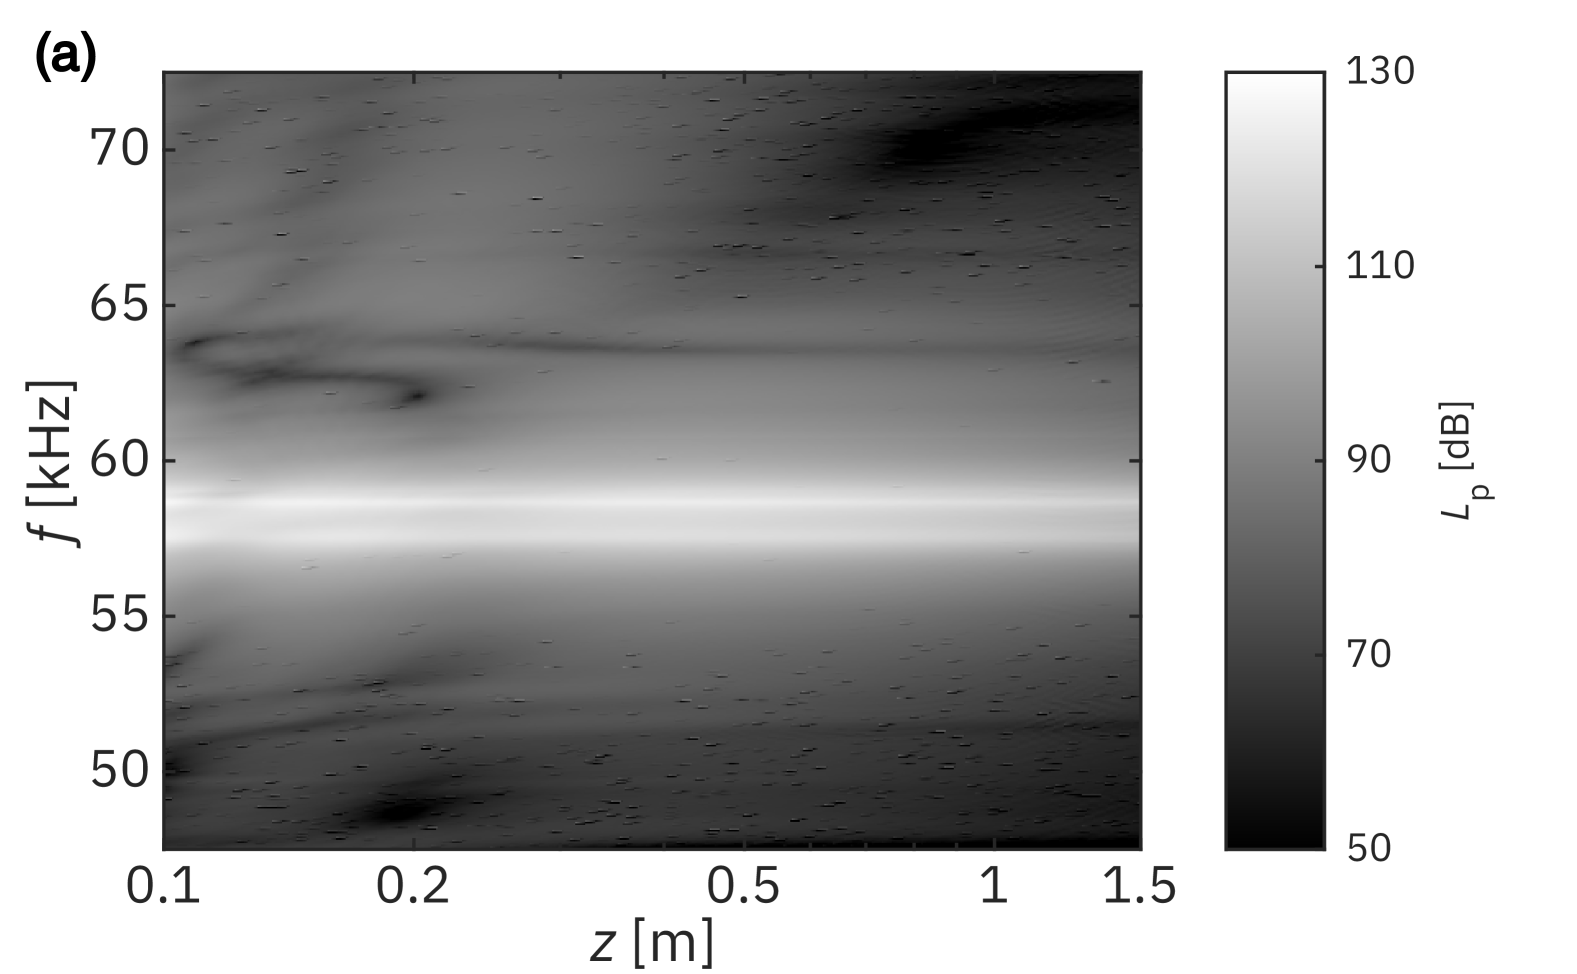
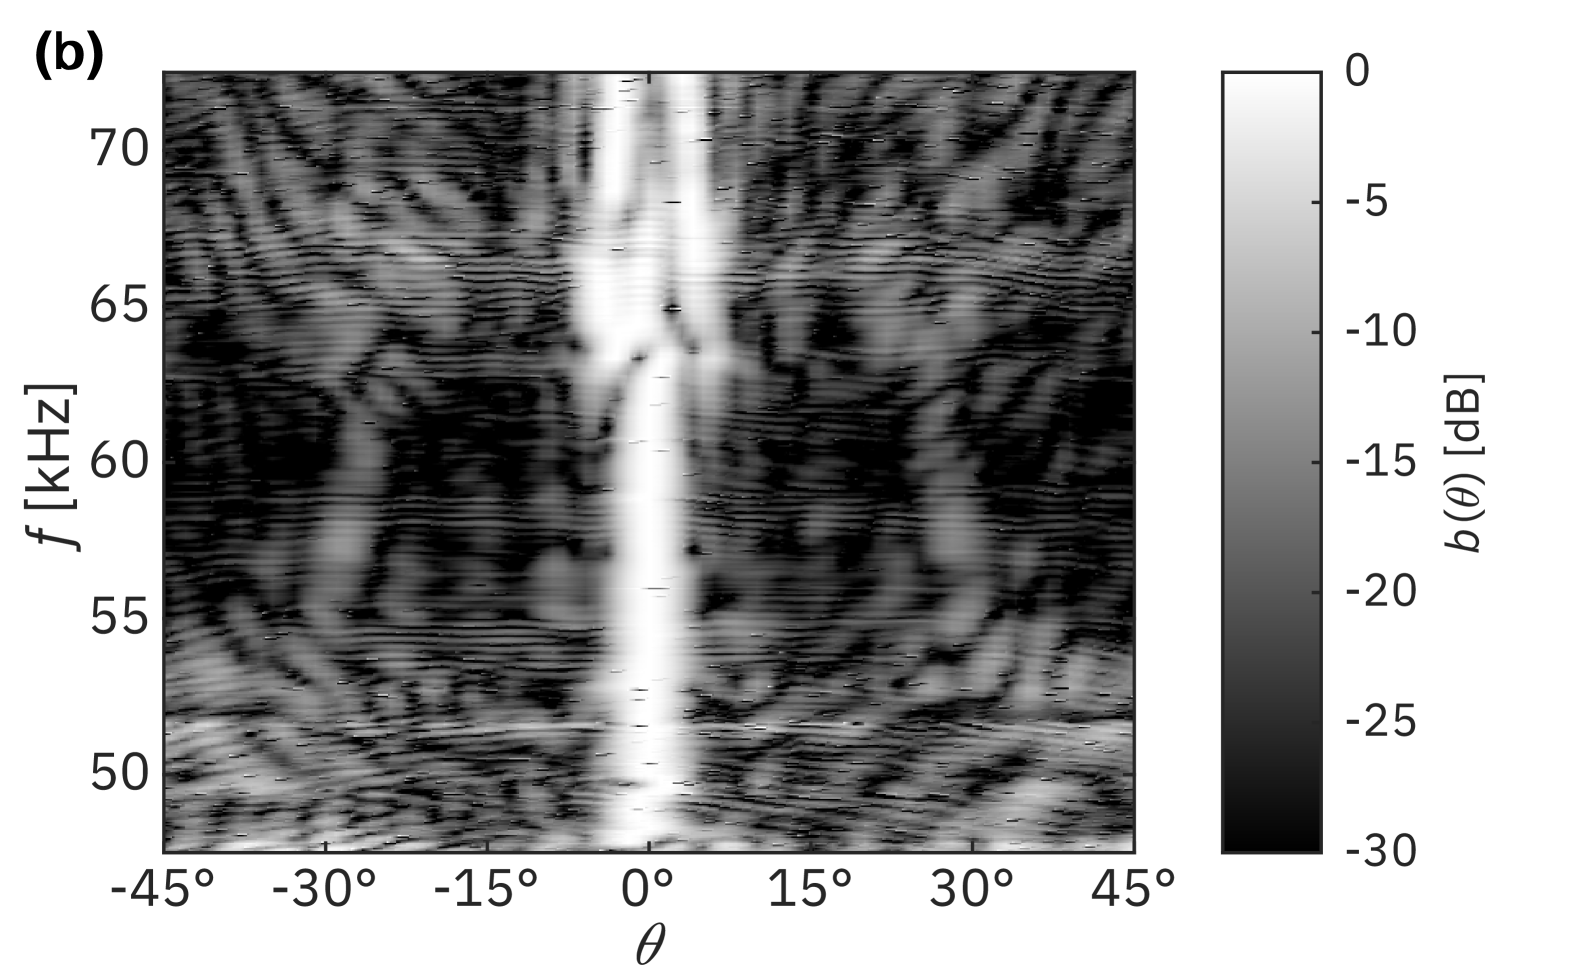
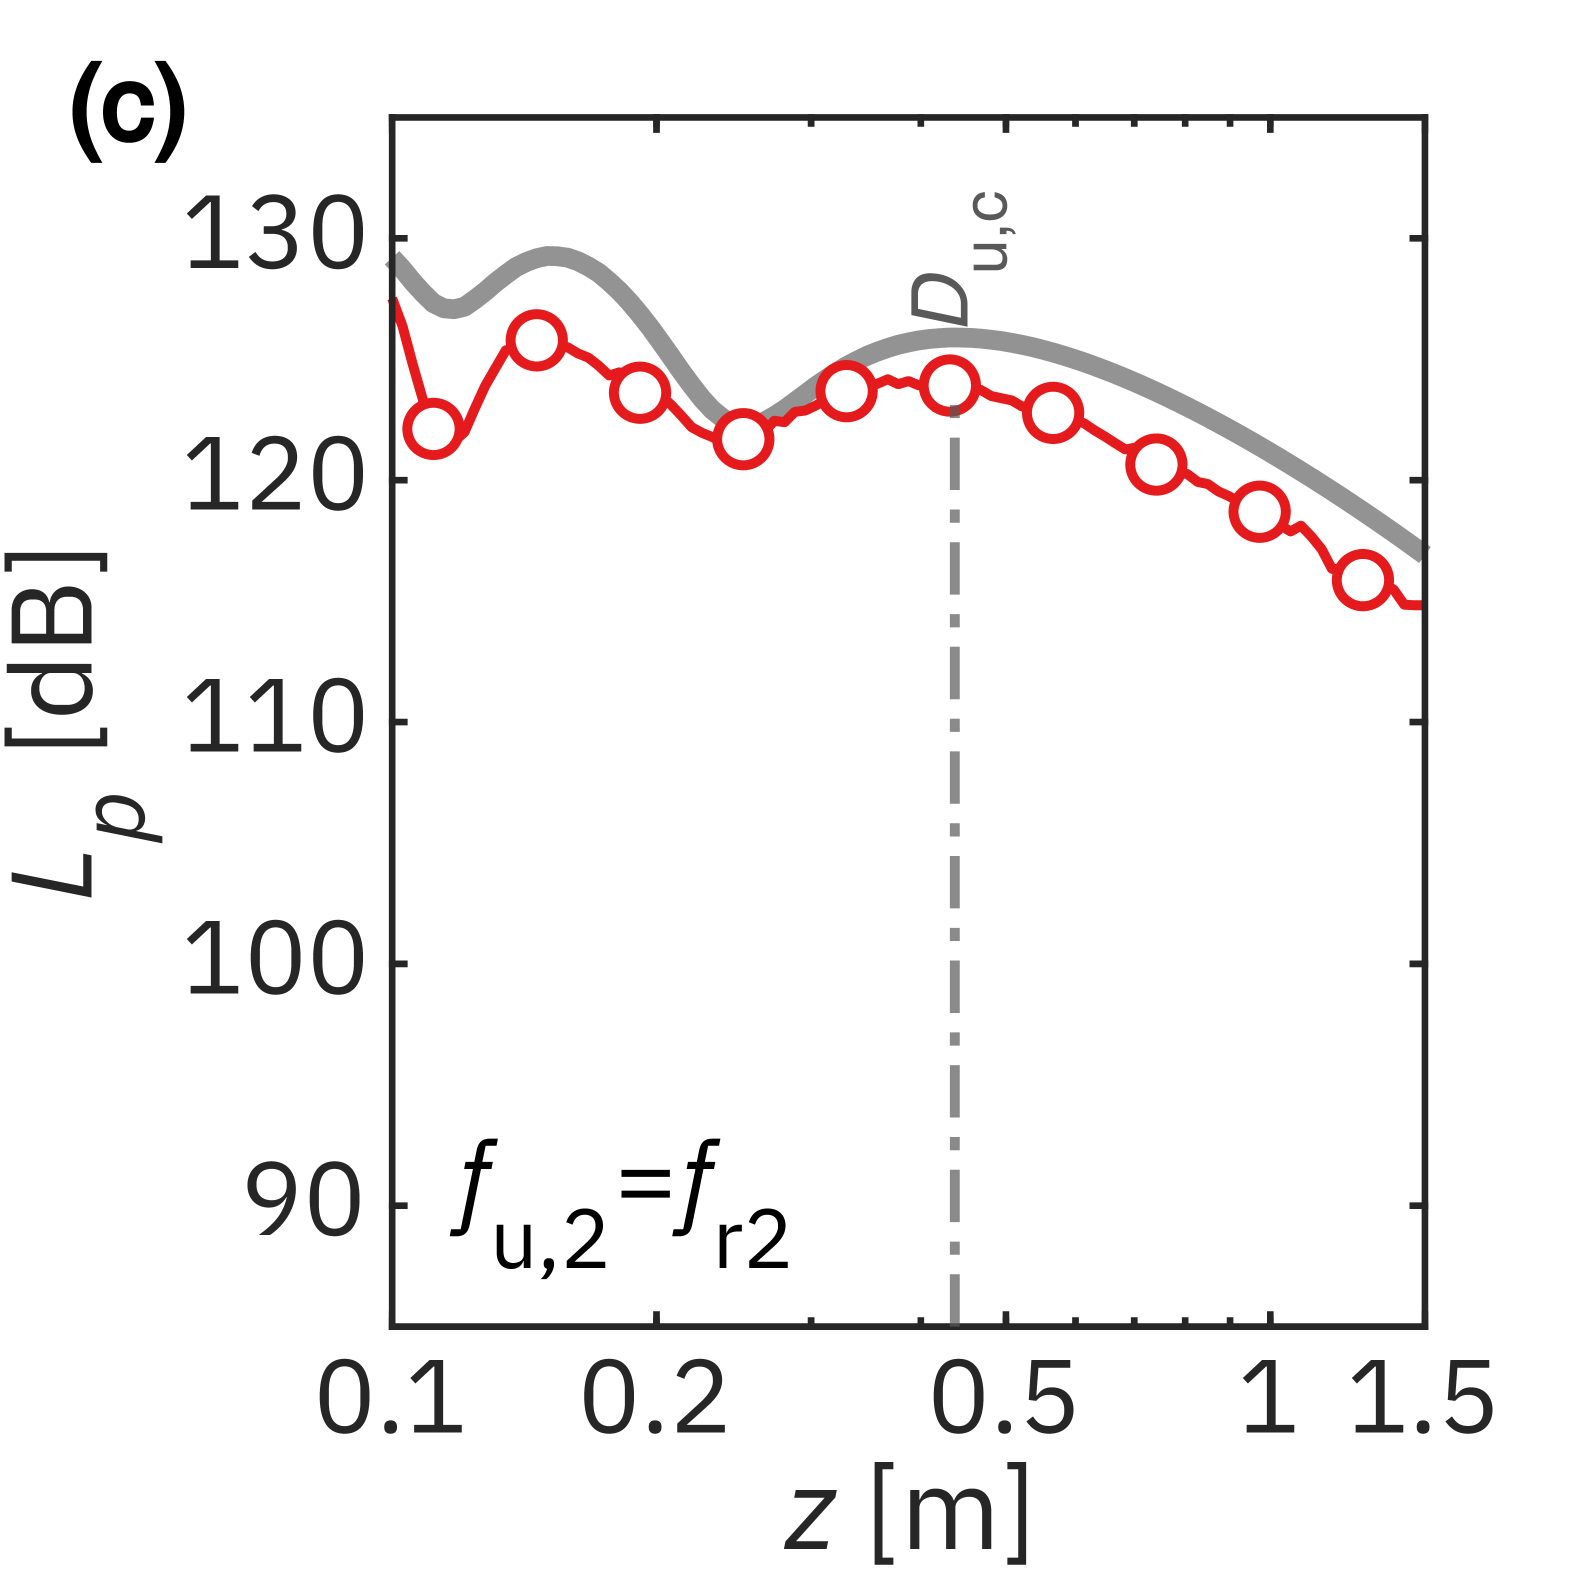
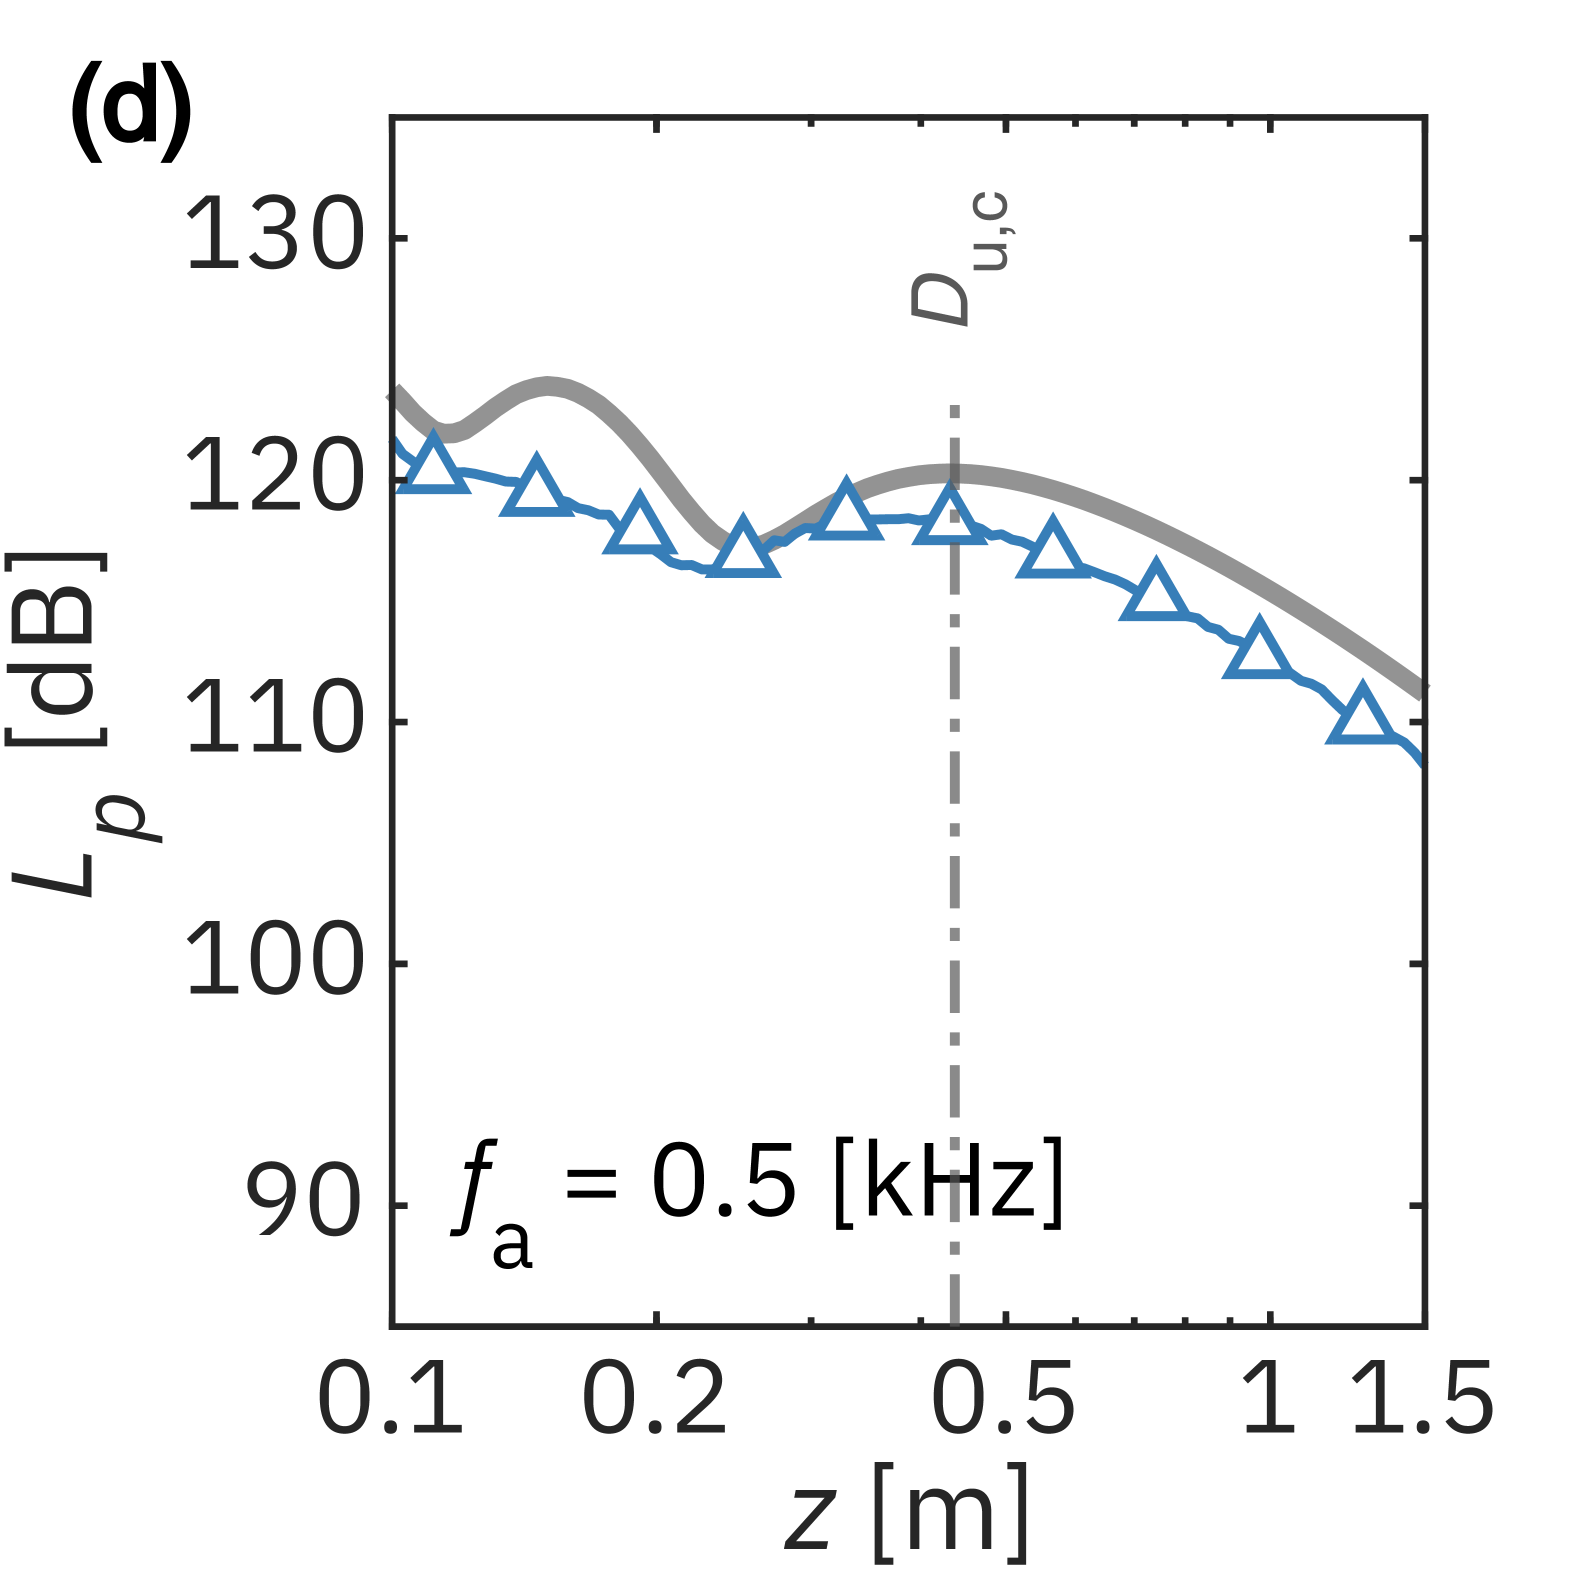
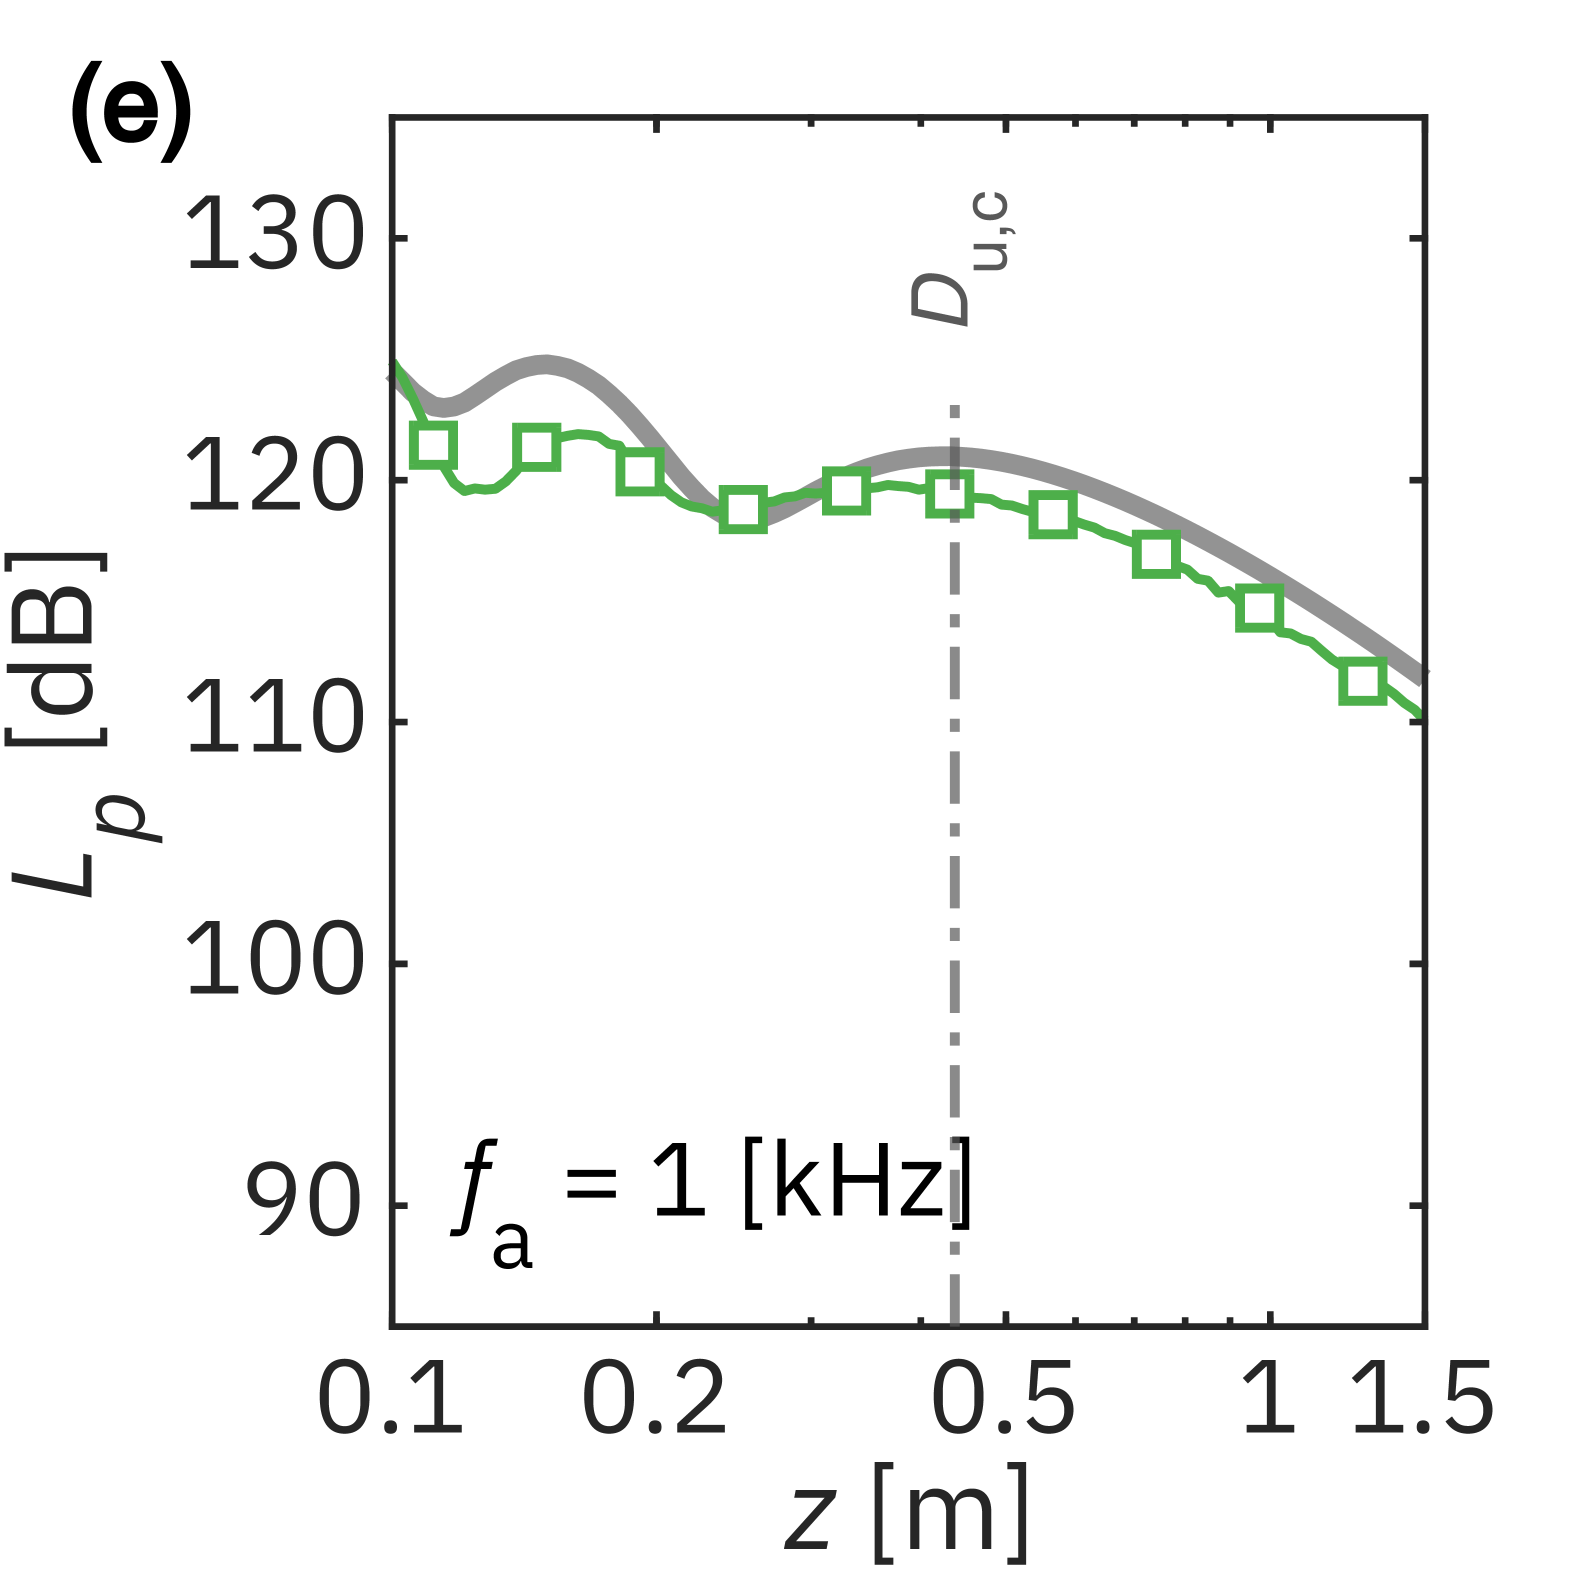
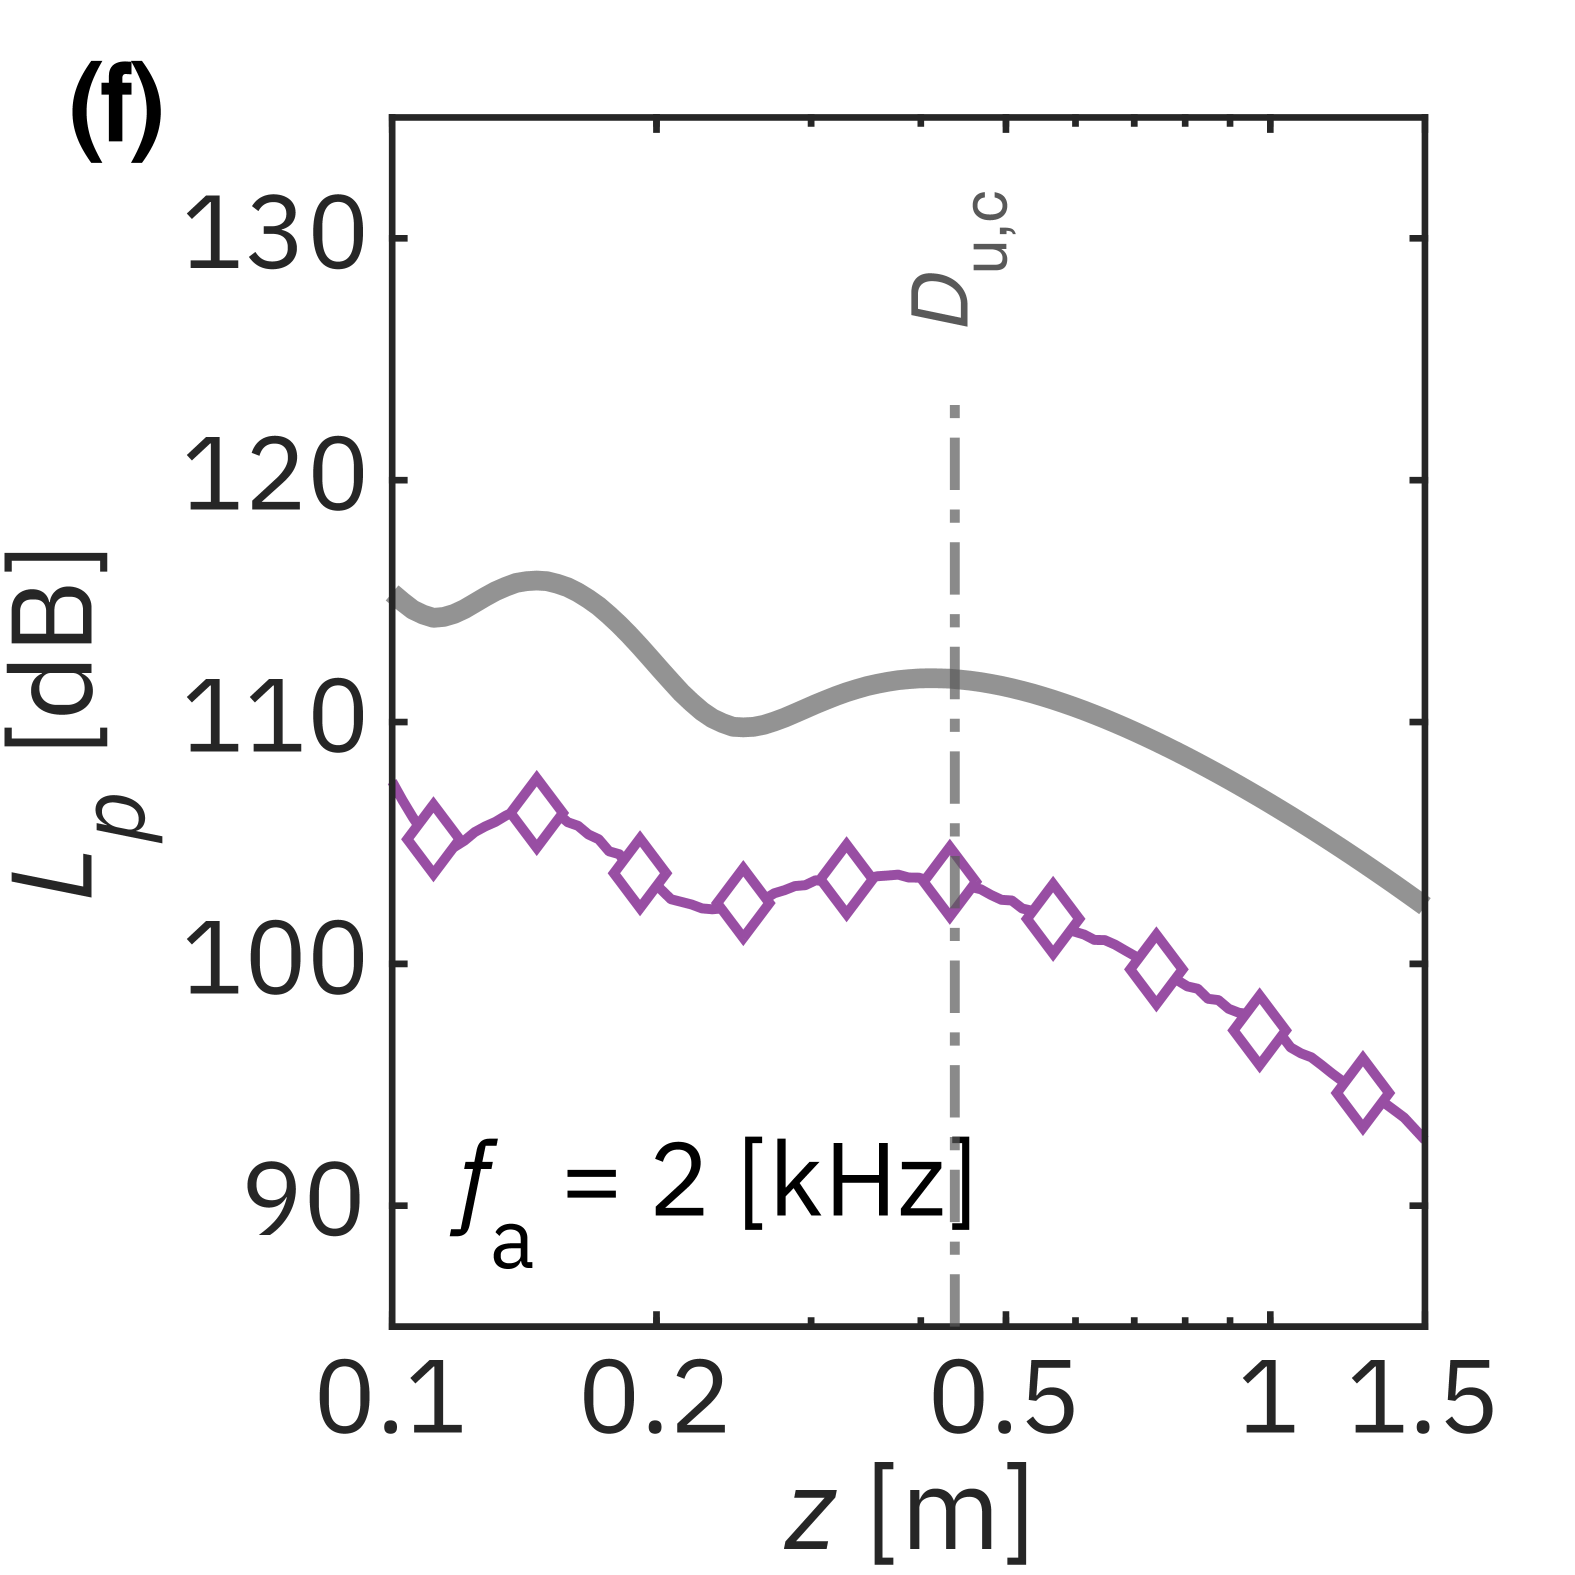
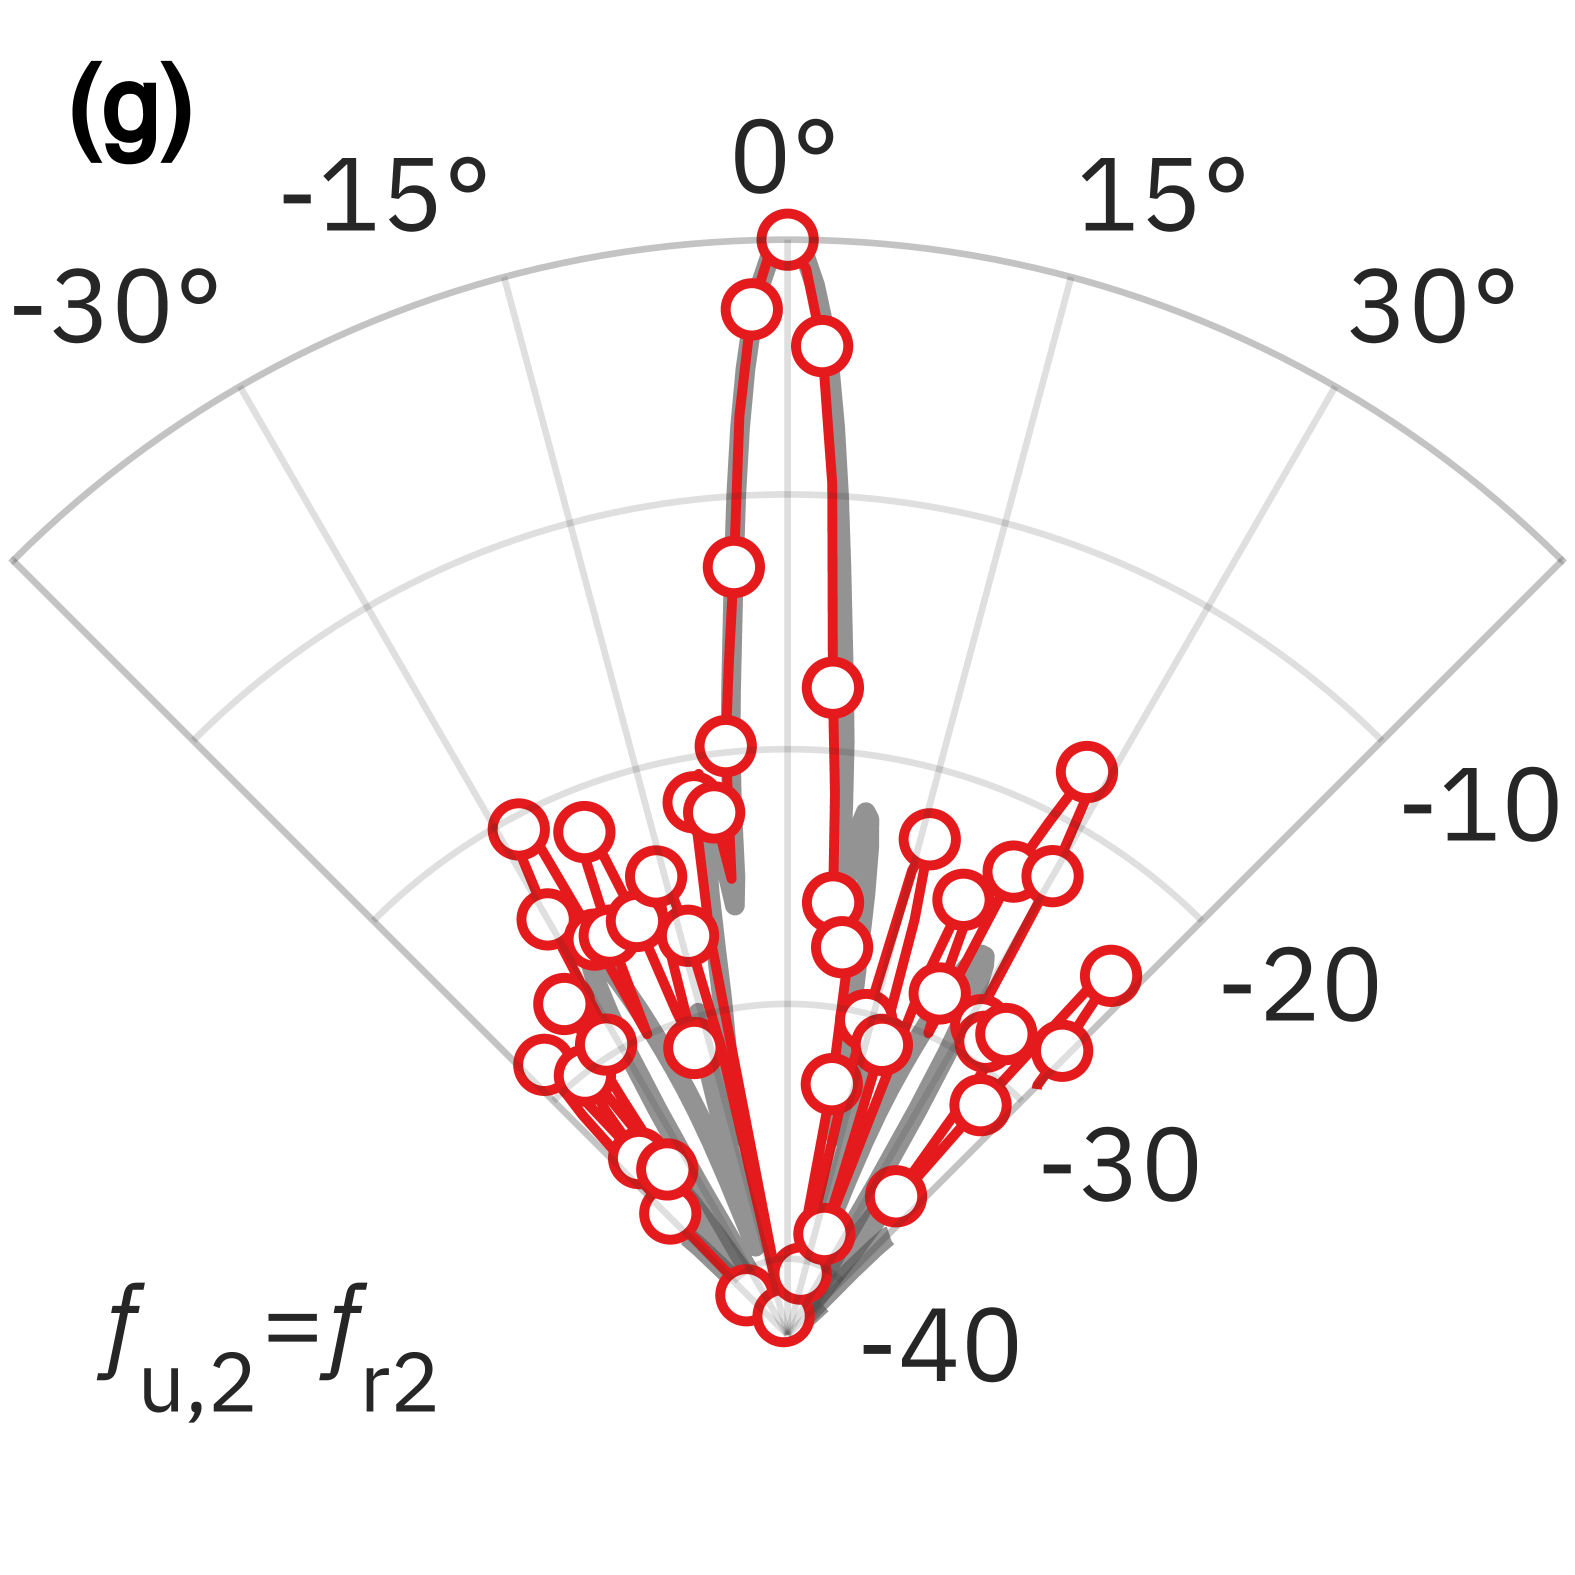
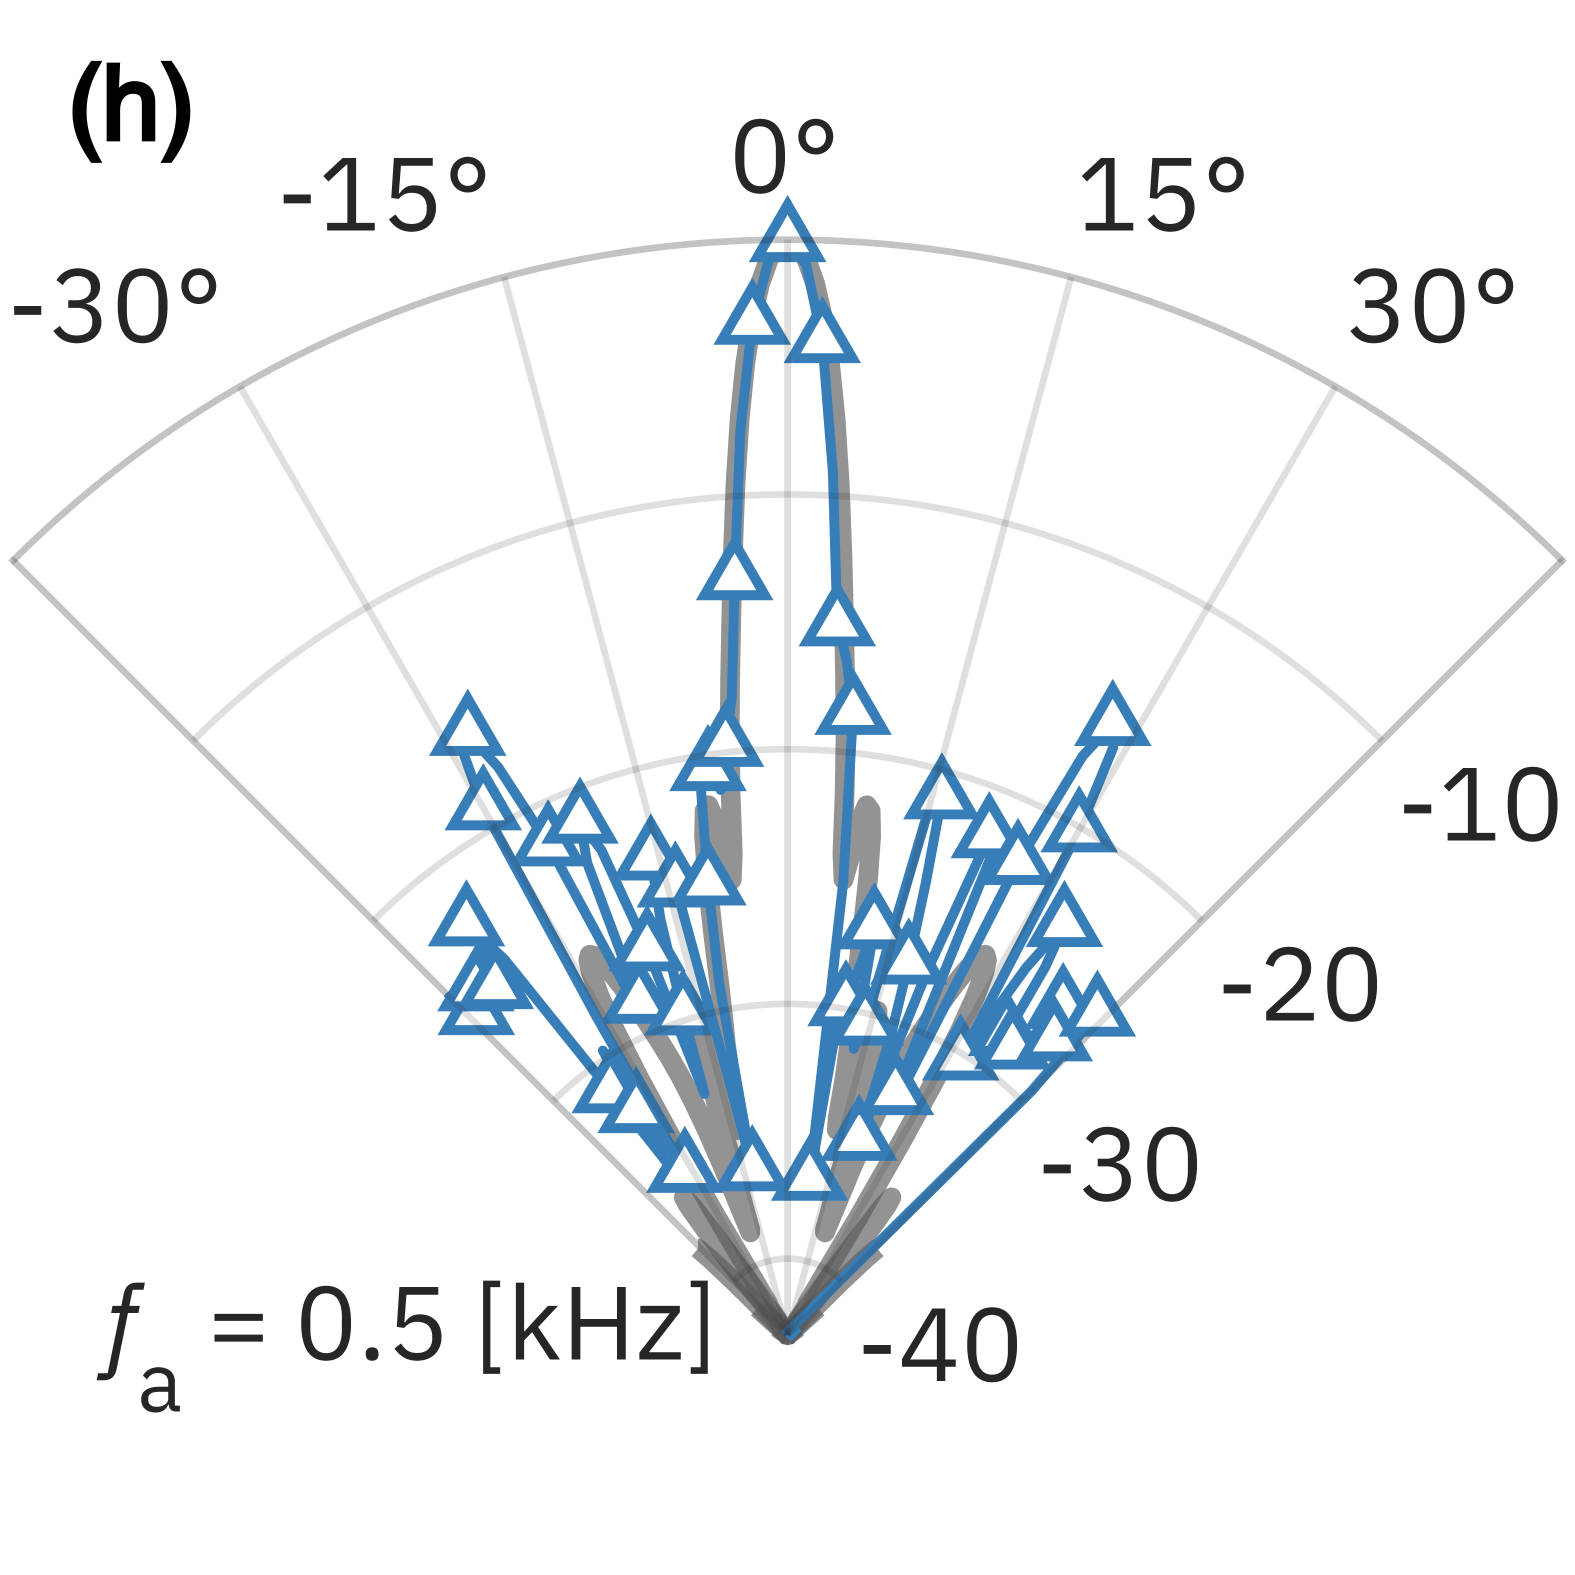
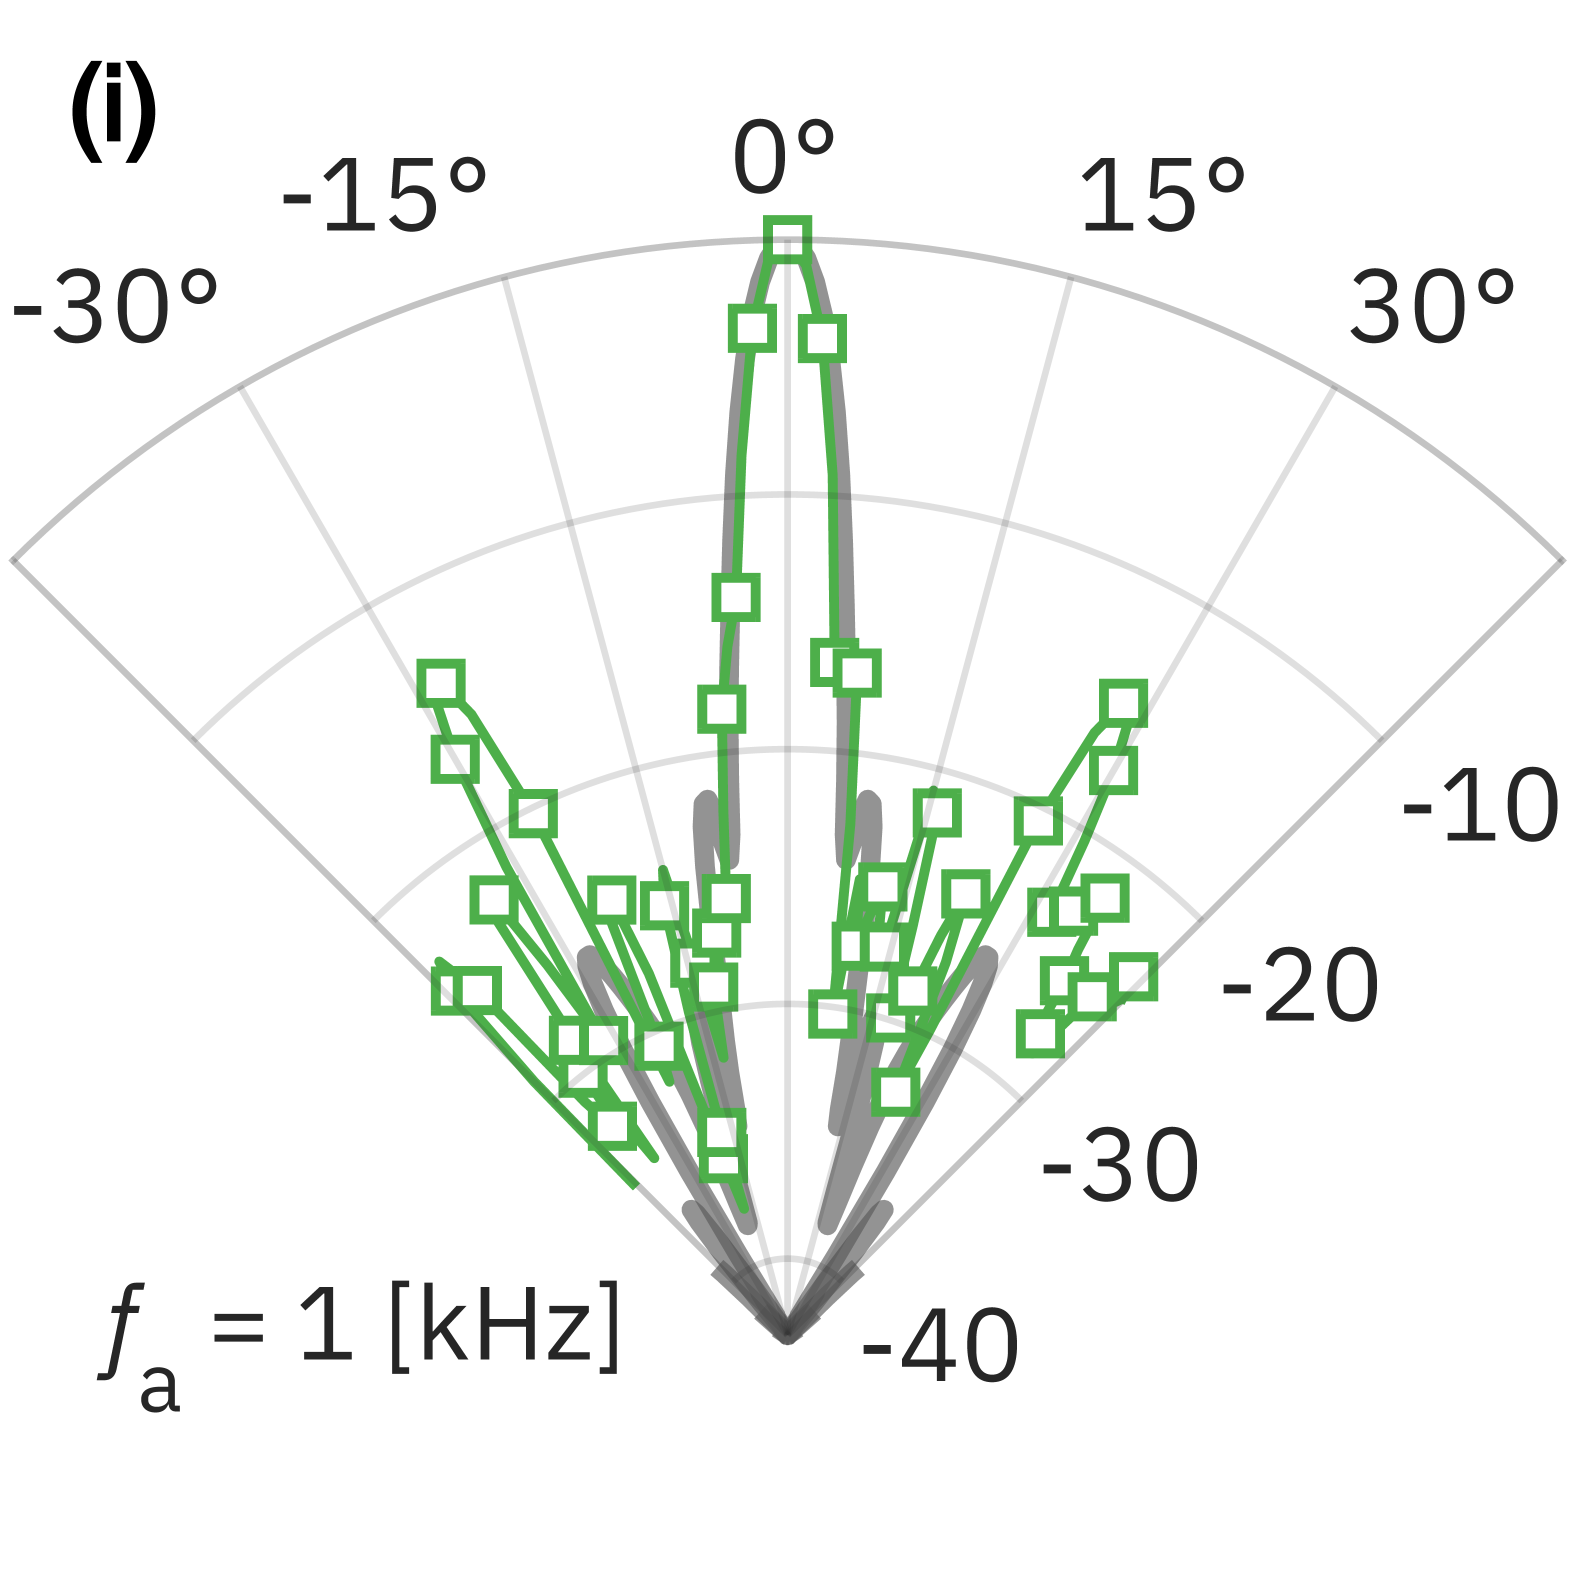
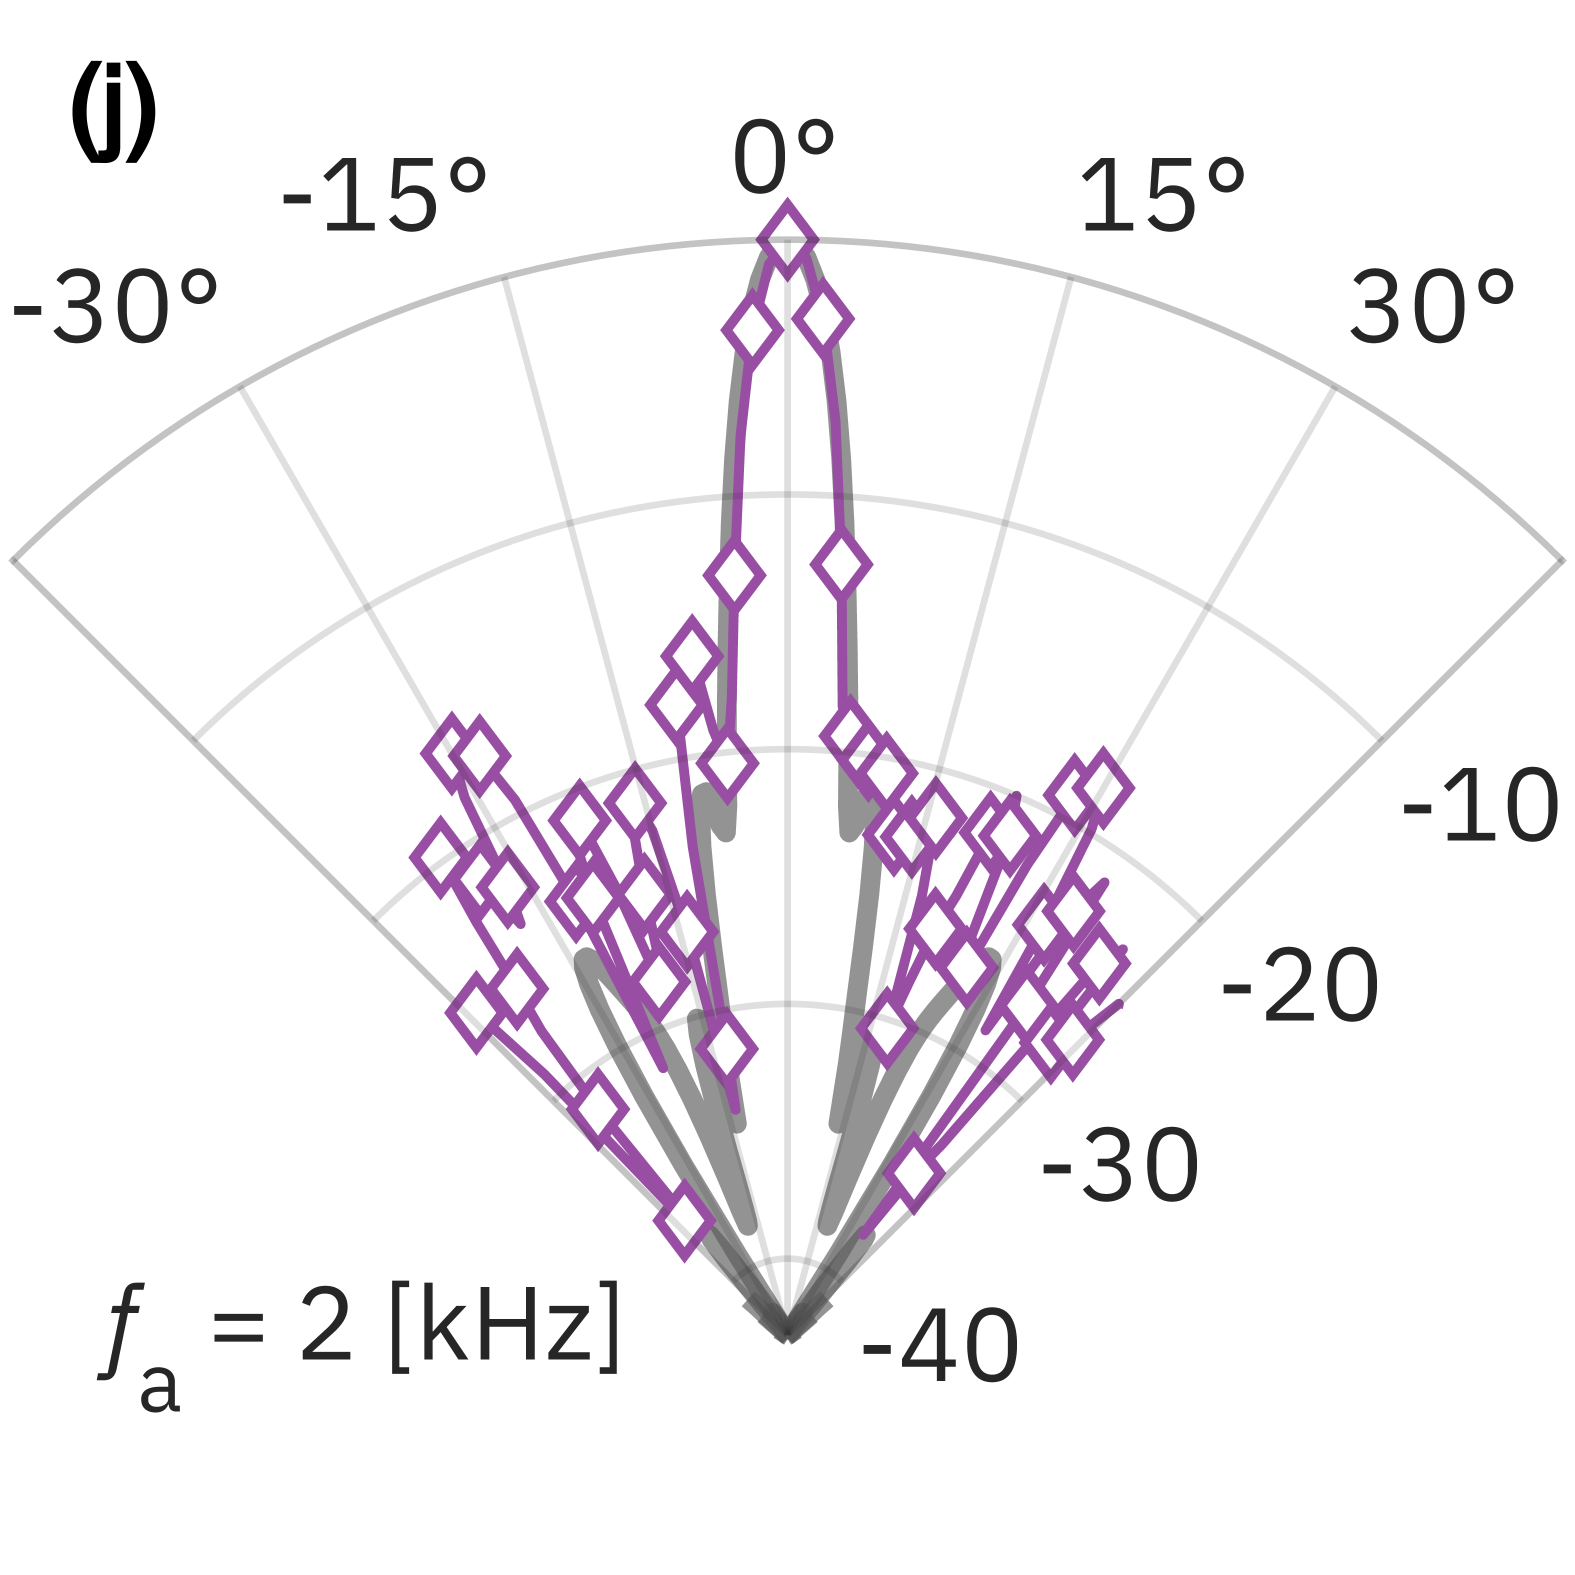
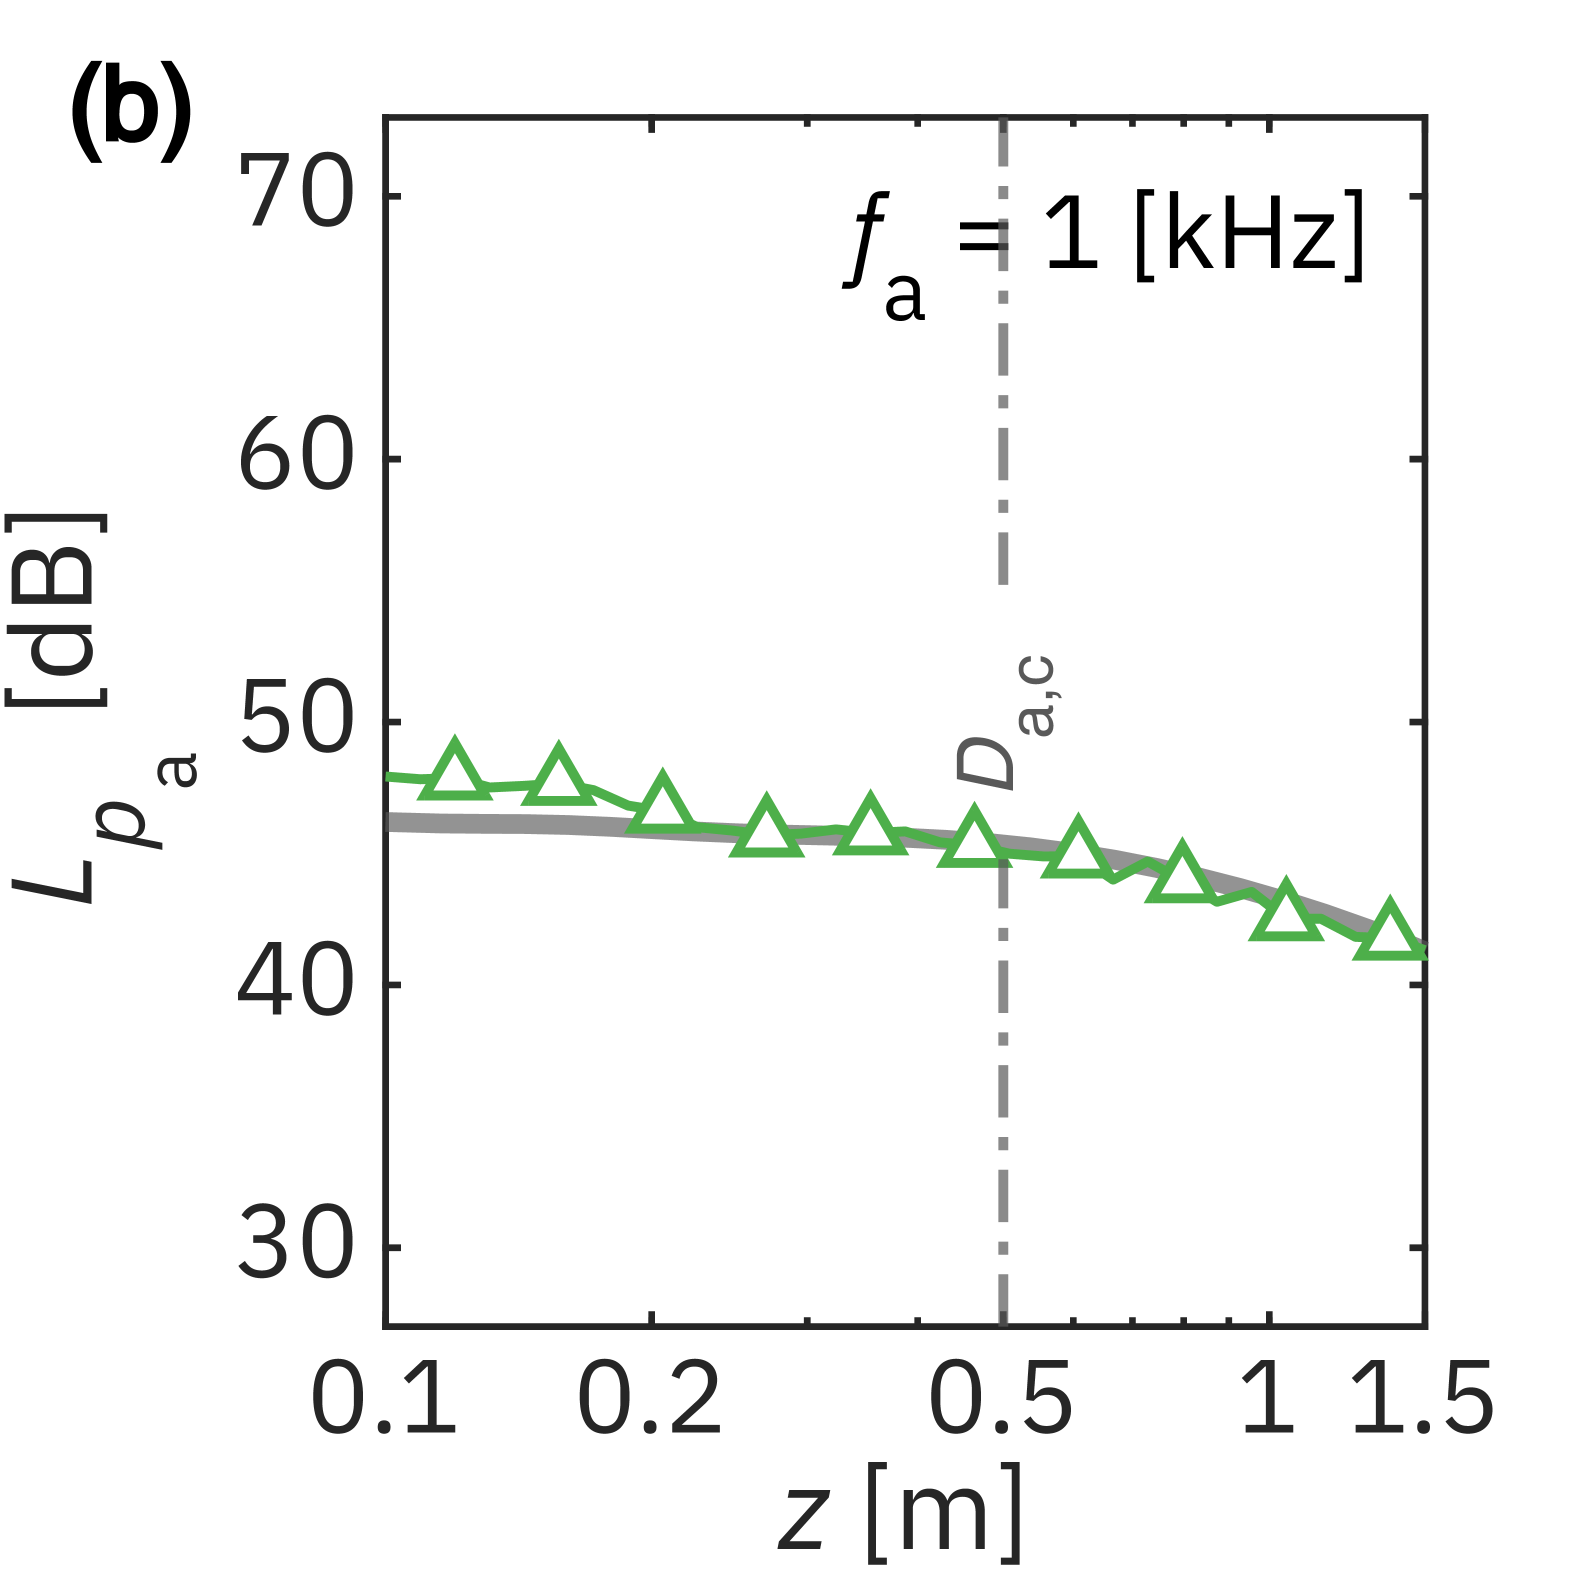
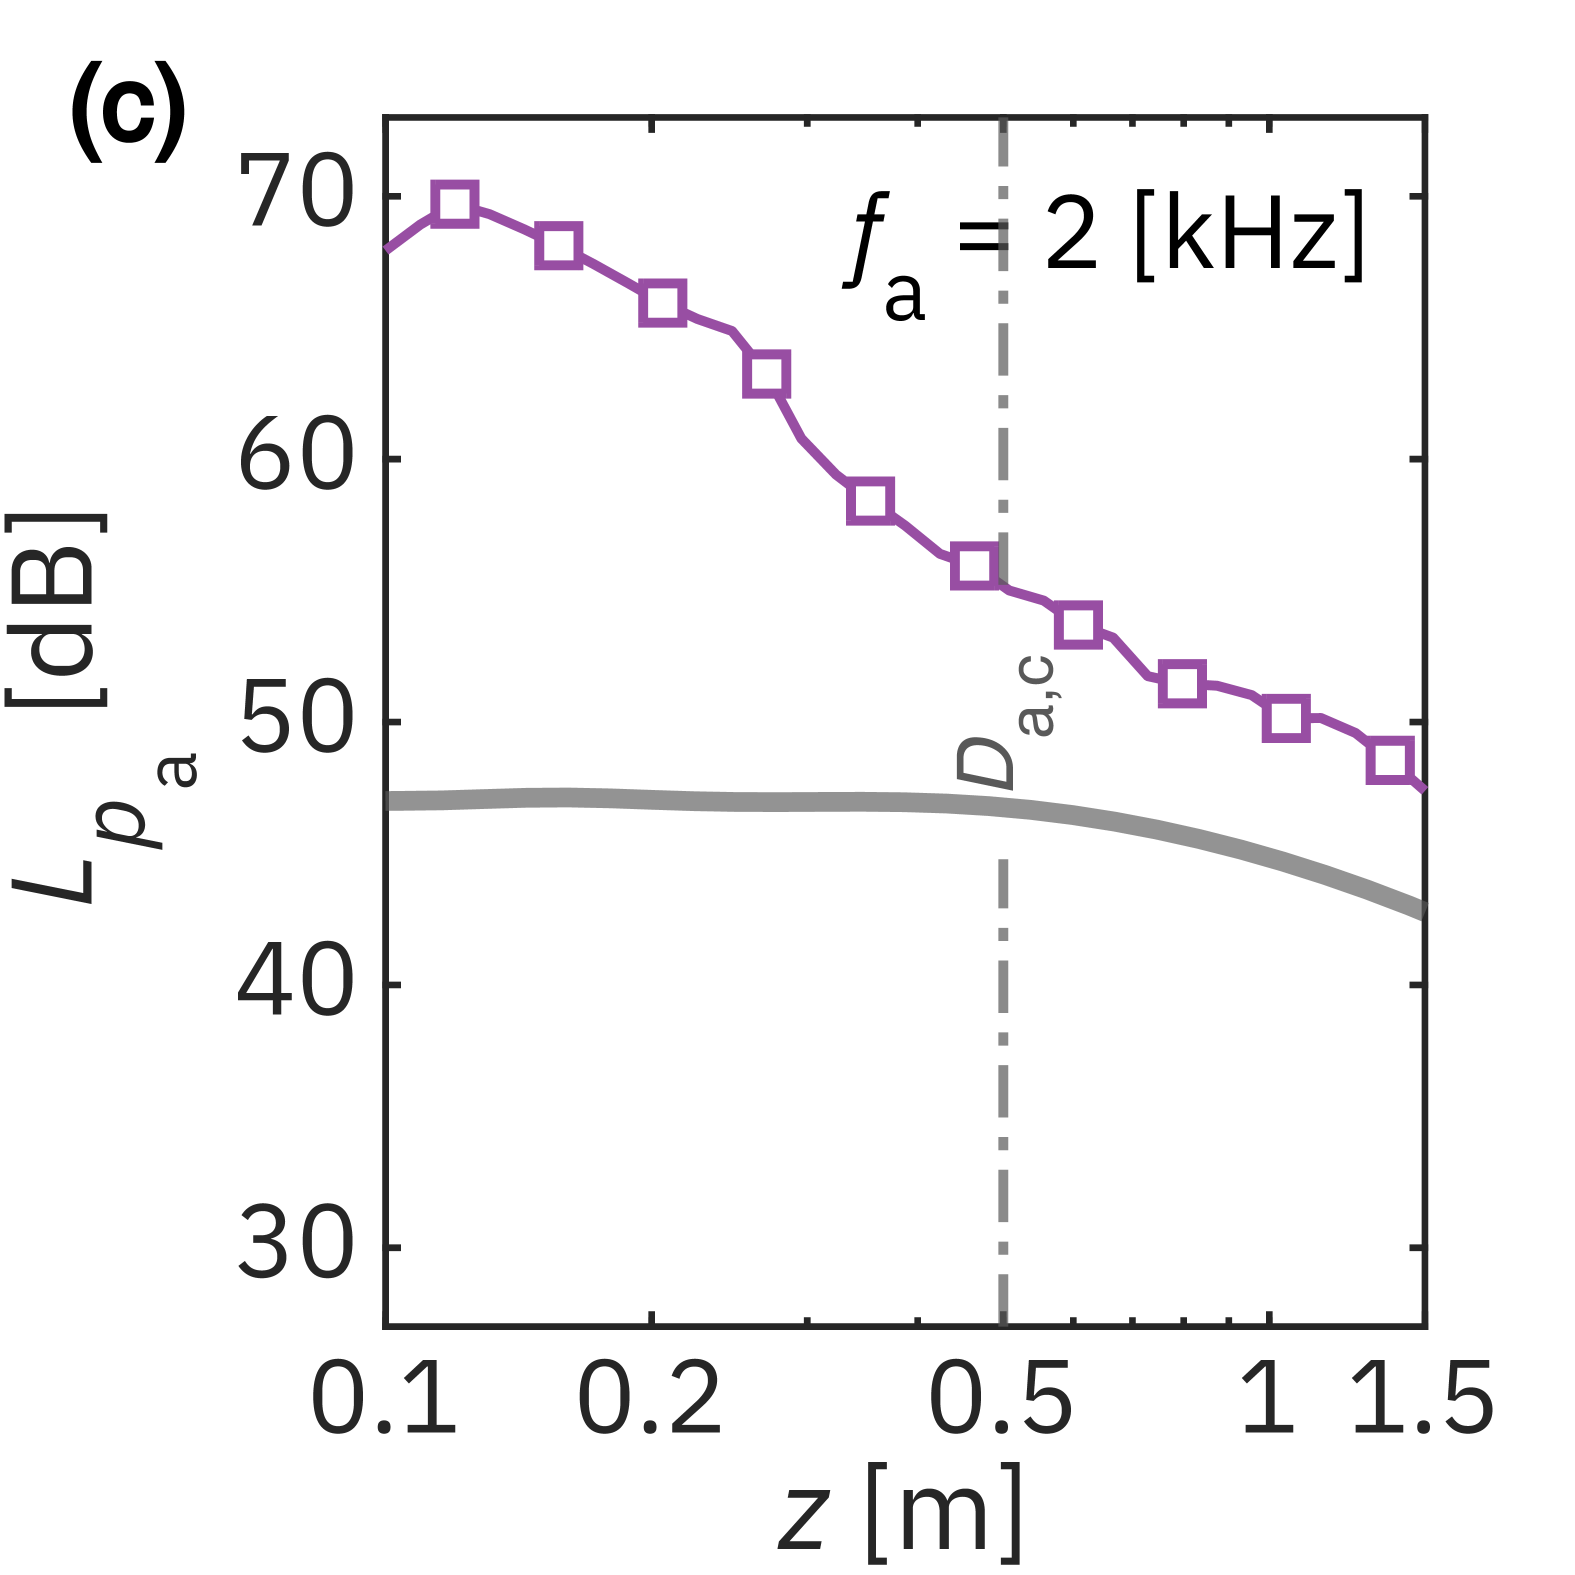
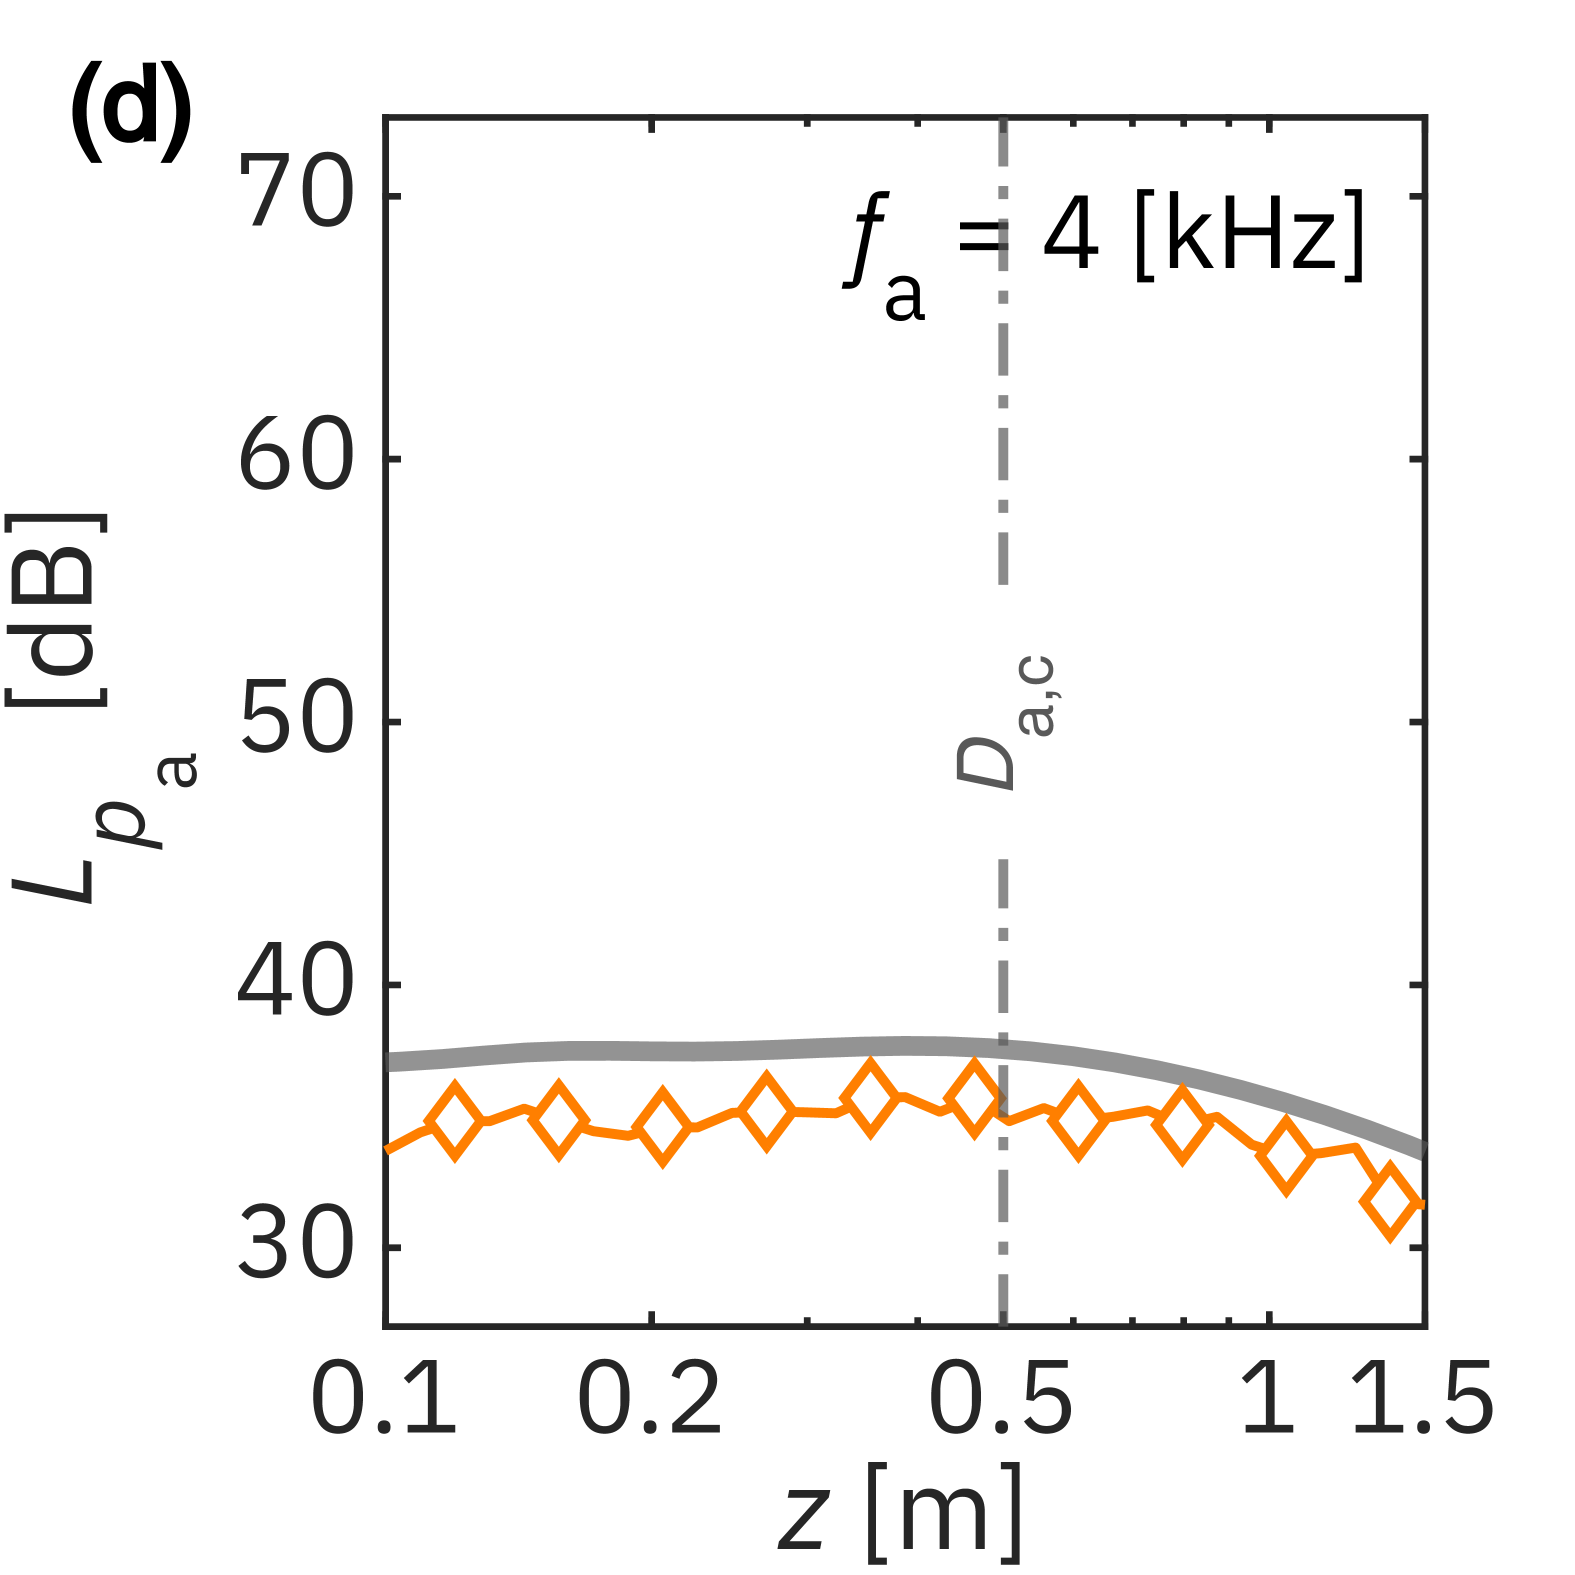
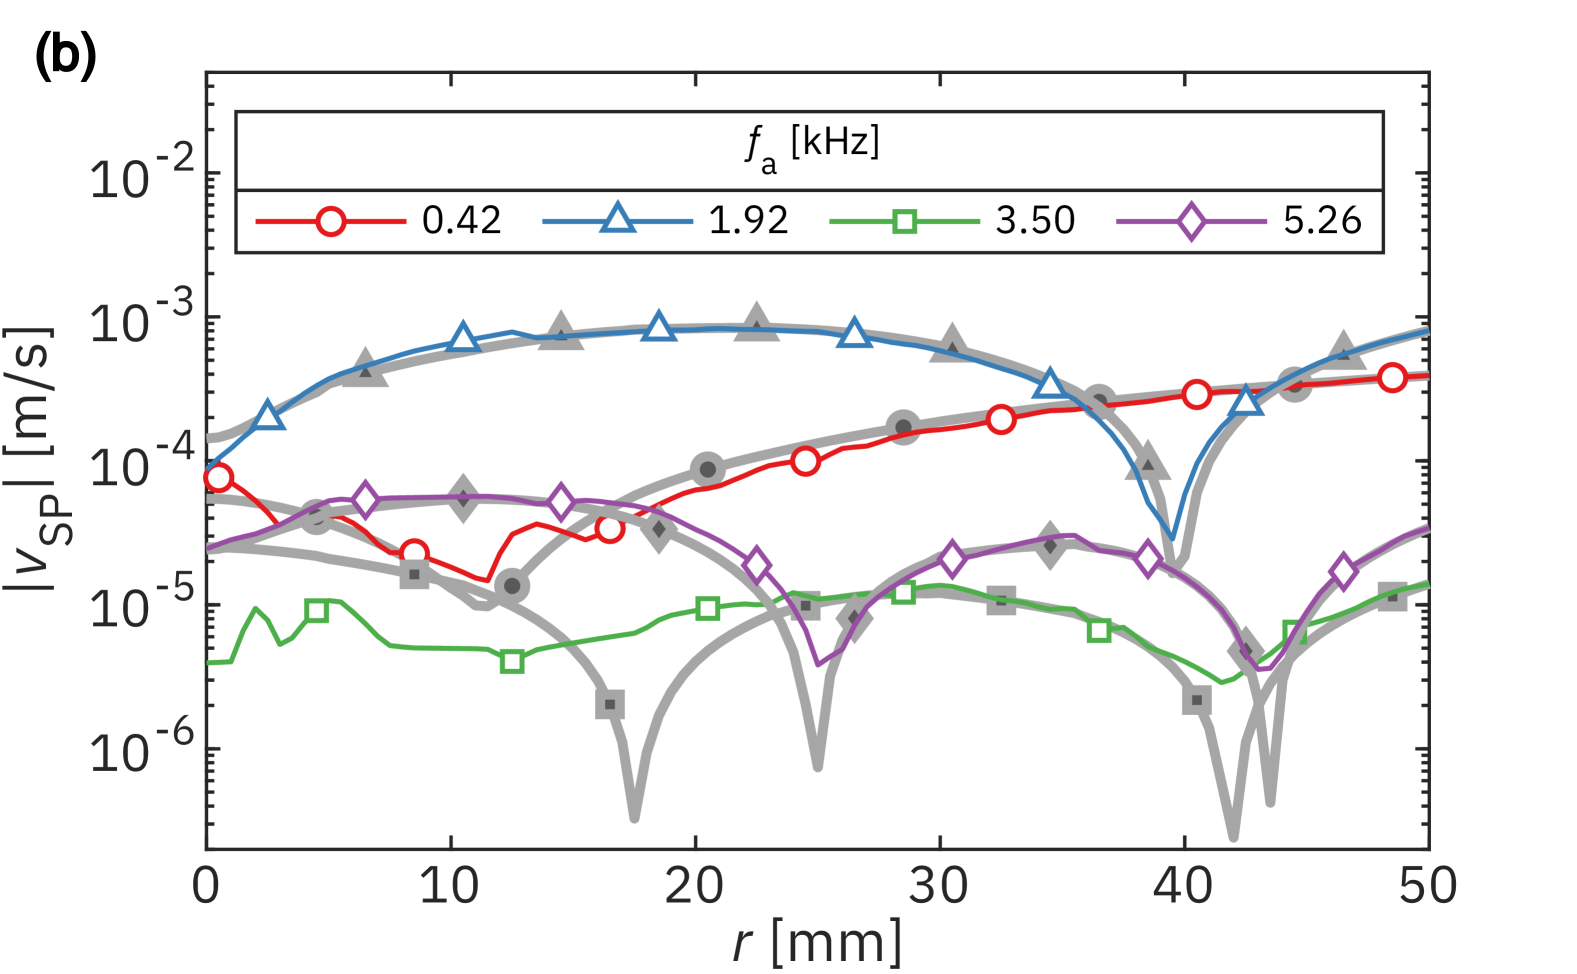
Figure 14(a) illustrates the ultrasound propagation characteristics of the SPPAL driven at V, showing the acoustic pressure field as a function of distance and frequency . Two distinct resonances appear near kHz. While appreciable pressure levels are also observed in the USB range, they are not practically usable due to unintended transitions to the 9th vibrational mode, as discussed in Sec. IV.2.2 and further detailed in the next section. Figures 14(c)-14(f) compare the experimentally measured PCs (markers) with theoretical predictions from Method B (thick gray solid lines), evaluated at the carrier resonance and corresponding LSB frequencies for , , kHz. The experimental results closely match the analytical predictions, with clear acoustic peaks near the design target . These results validate that the SPPAL emulates the radiation behavior of a RP, as established in Sec. II.2, and support the use of the ER in the multi-objective optimization framework by confirming the predictive reliability of the analytical approach.
Beam pattern
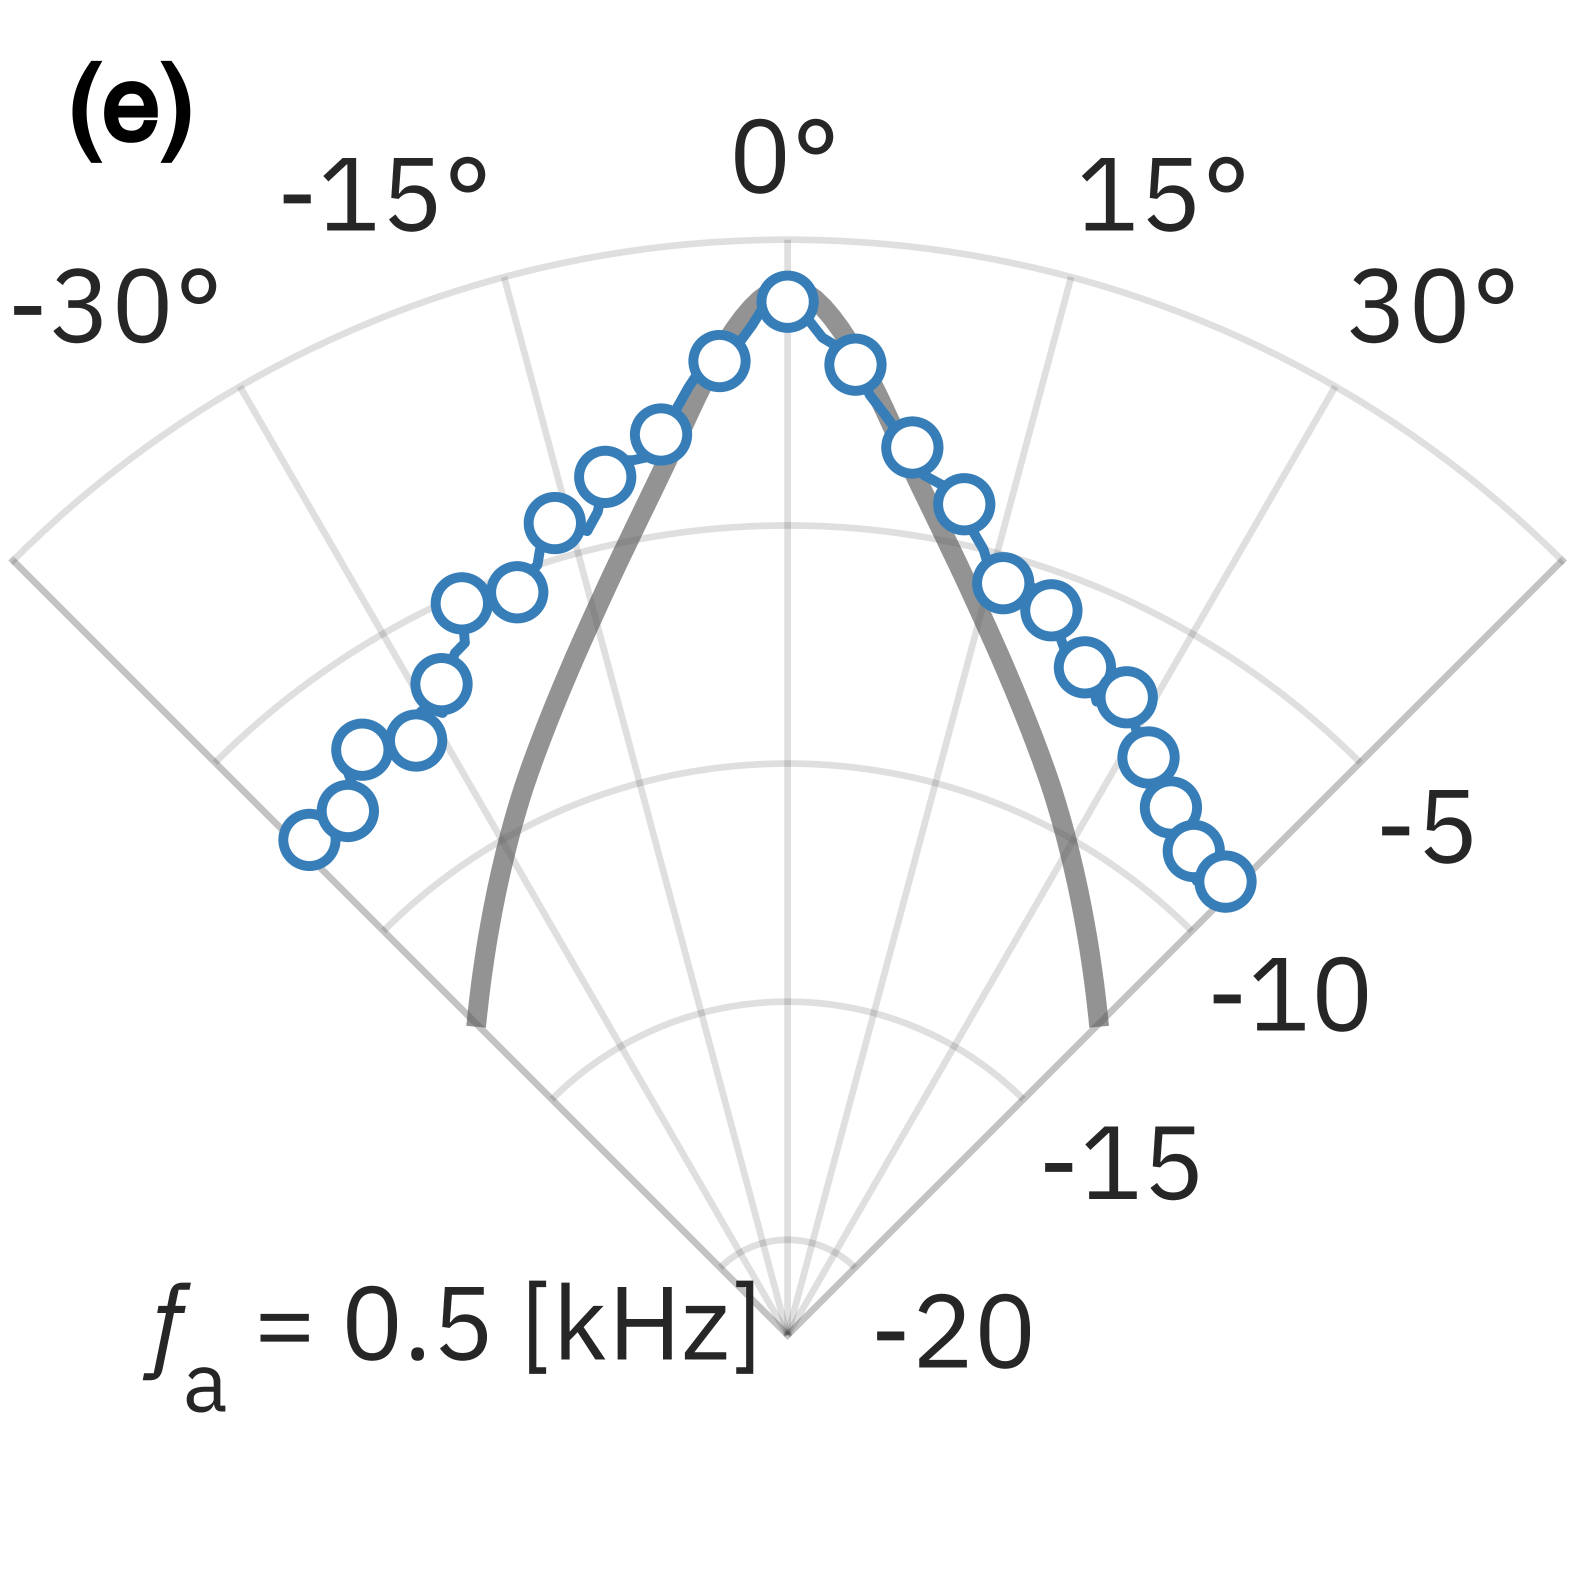
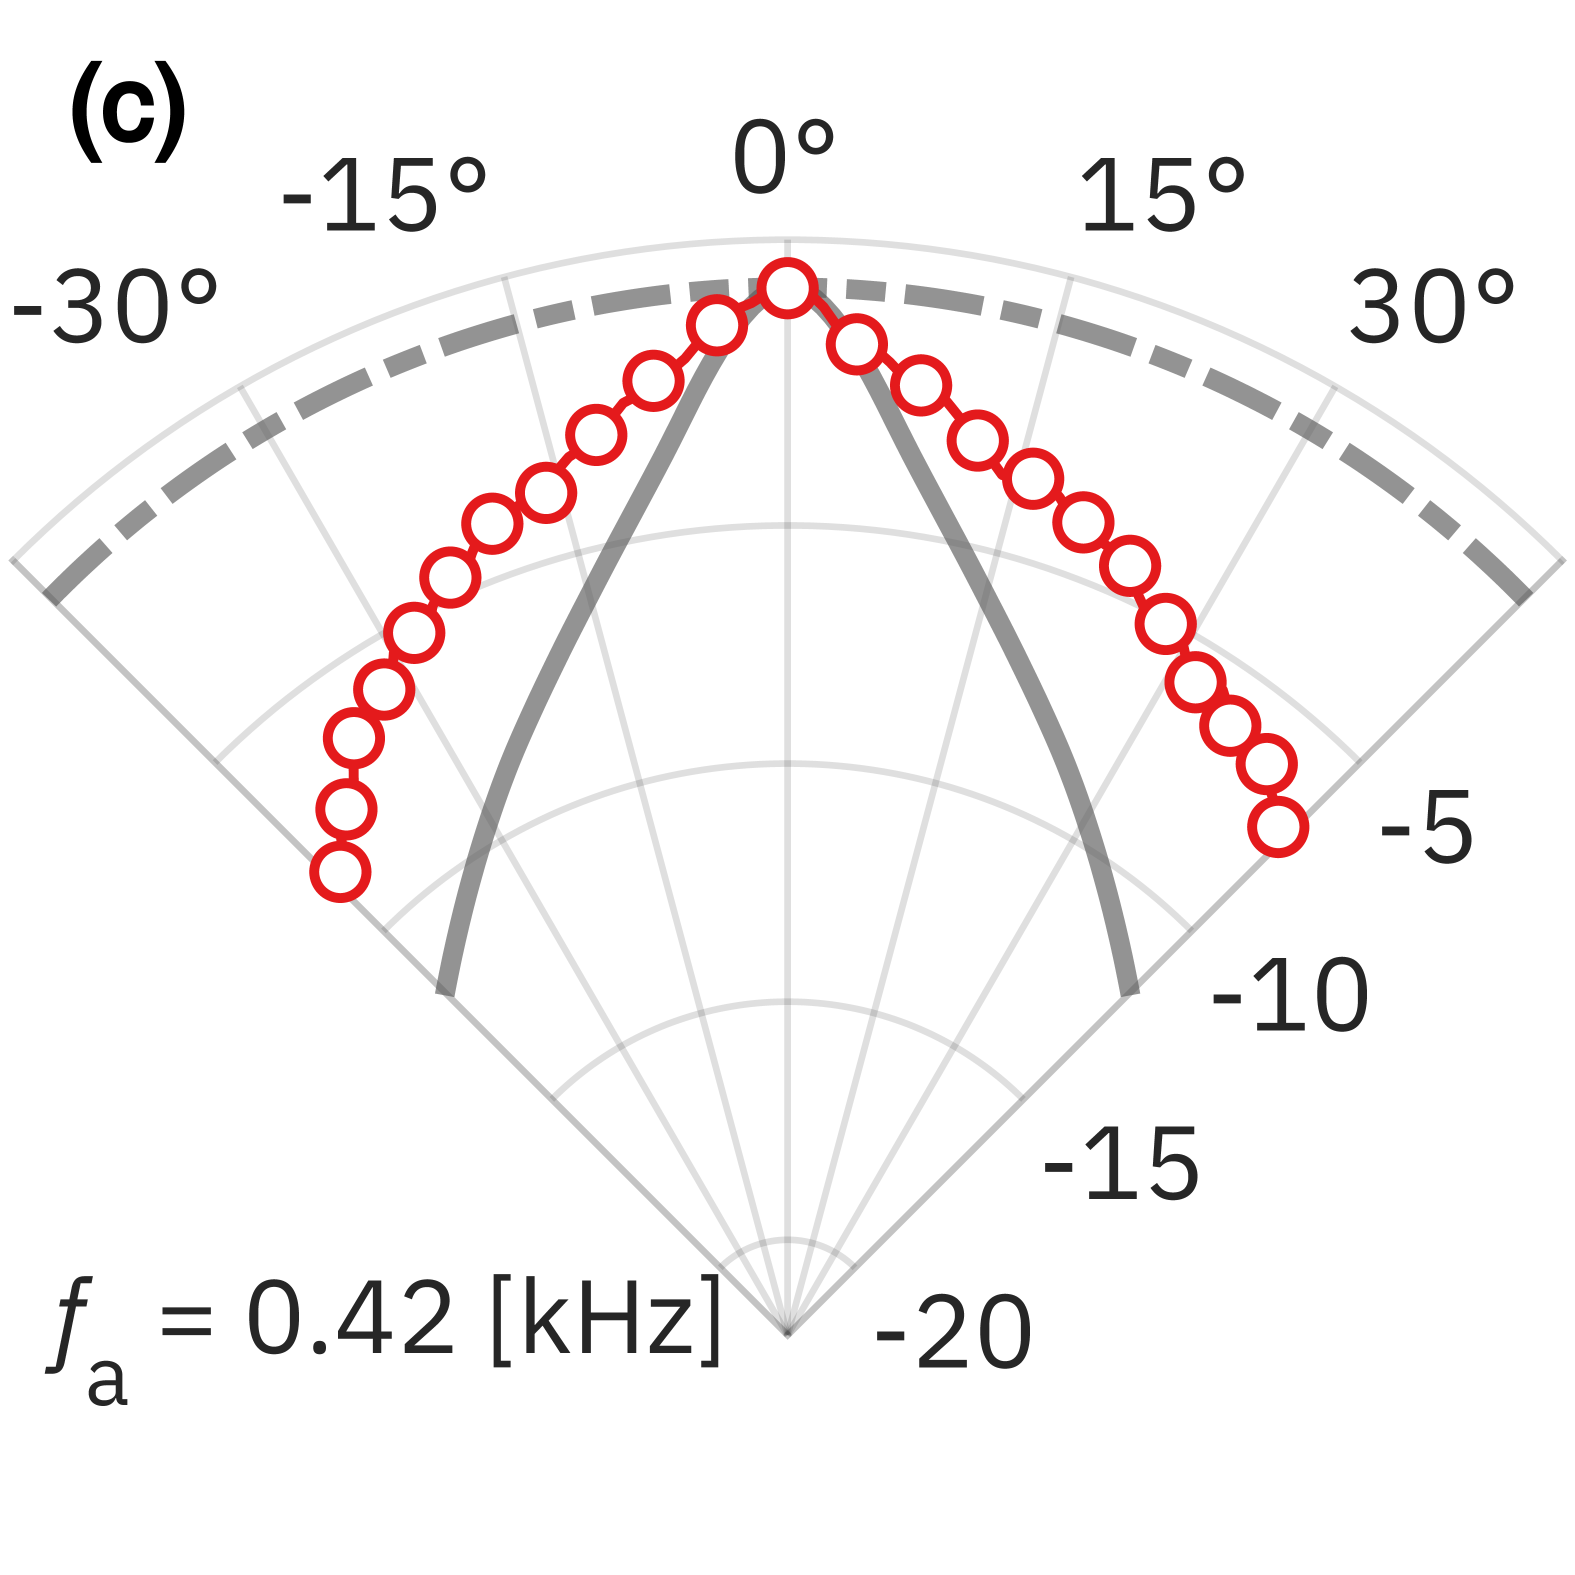
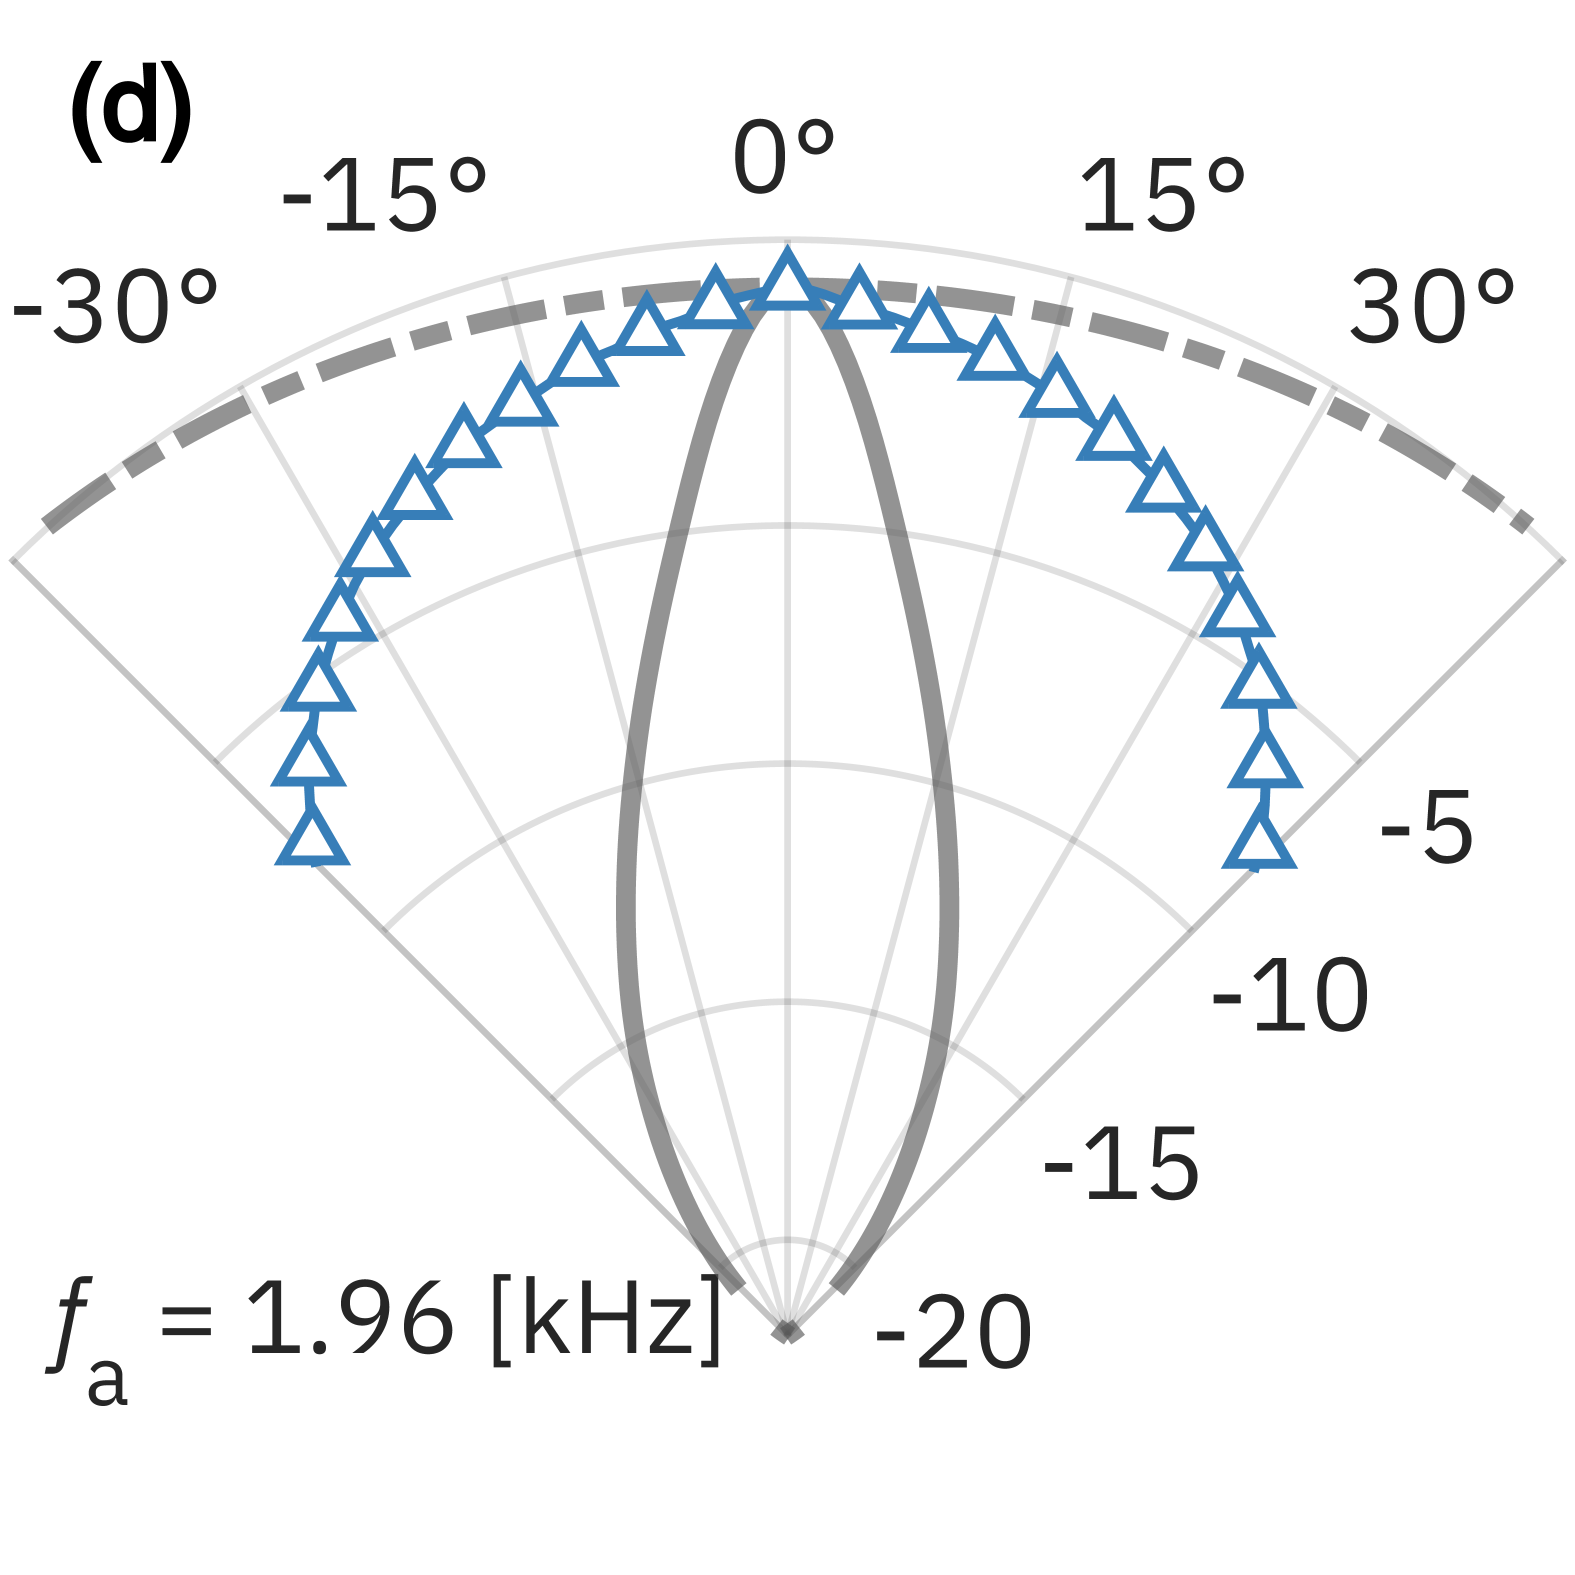
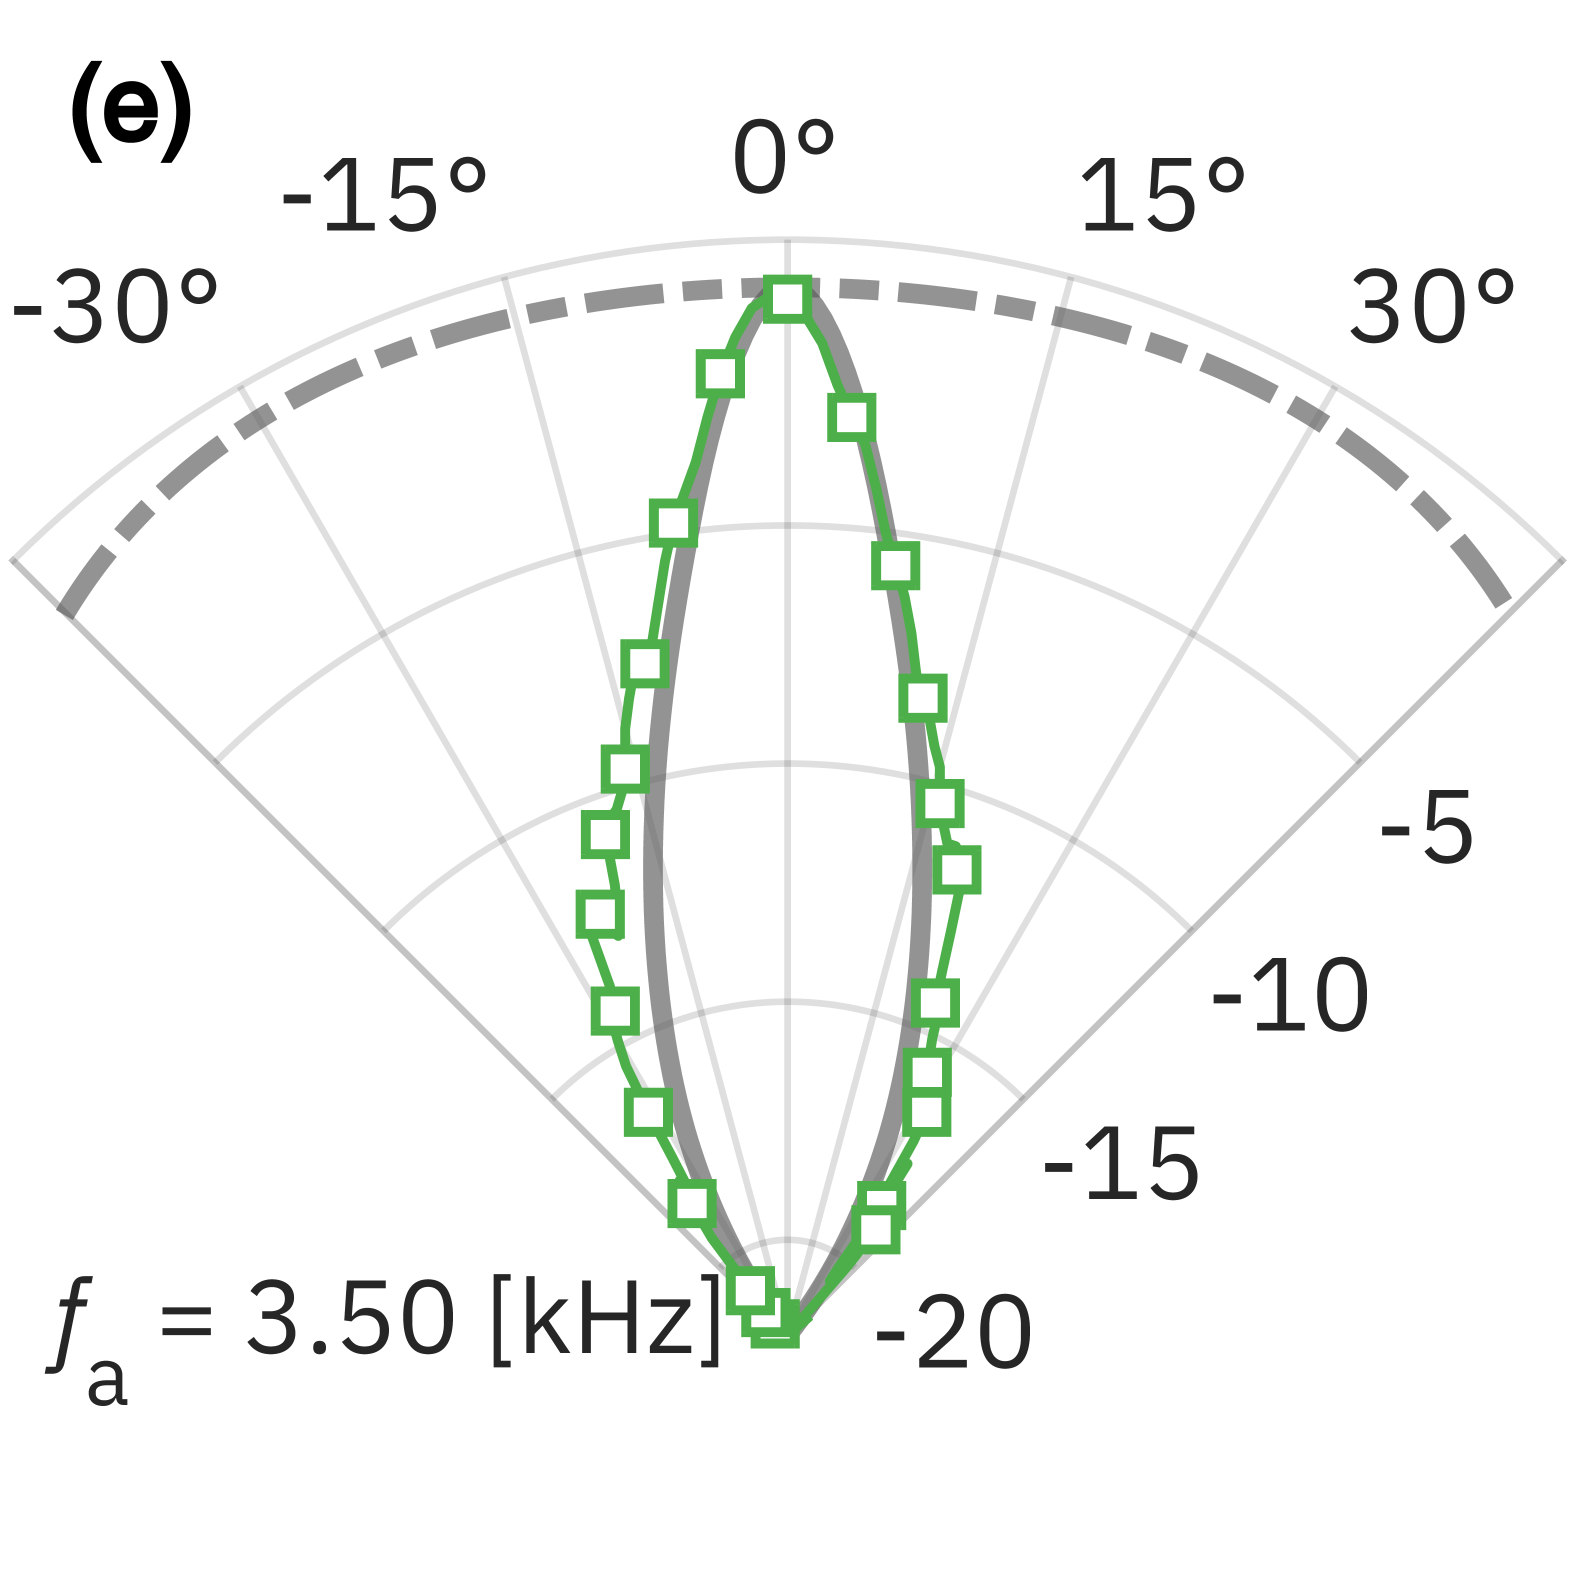
Figure 14(b) presents the BP of the ultrasound generated by the SPPAL at a driving voltage of V, showing acoustic pressure as a function of frequency and angle . Below approximately kHz, the beam exhibits a well-focused main lobe along the acoustic axis. However, near kHz, a transition to the 9th vibrational mode occurs, degrading beam directivity due to lobe splitting and loss of coherence. This limits the use of USB frequencies for audio modulation, as discussed in Sec. IV.4.2. Figures 14(g)-14(j) compare measured BPs (markers) with theoretical predictions from Method B (thick gray solid lines), evaluated at , , kHz.
IV.3.2 Audio sound
This section presents the measurement of audio sound fields generated by the SPPAL. Overall, the experimental results show good agreement with the theoretical pr edictions across the audio frequency range. However, at kHz, a noticeable deviation is observed between the measured and predicted values. The underlying causes of this discrepancy are discussed in the Sec. IV.4.
Frequency response
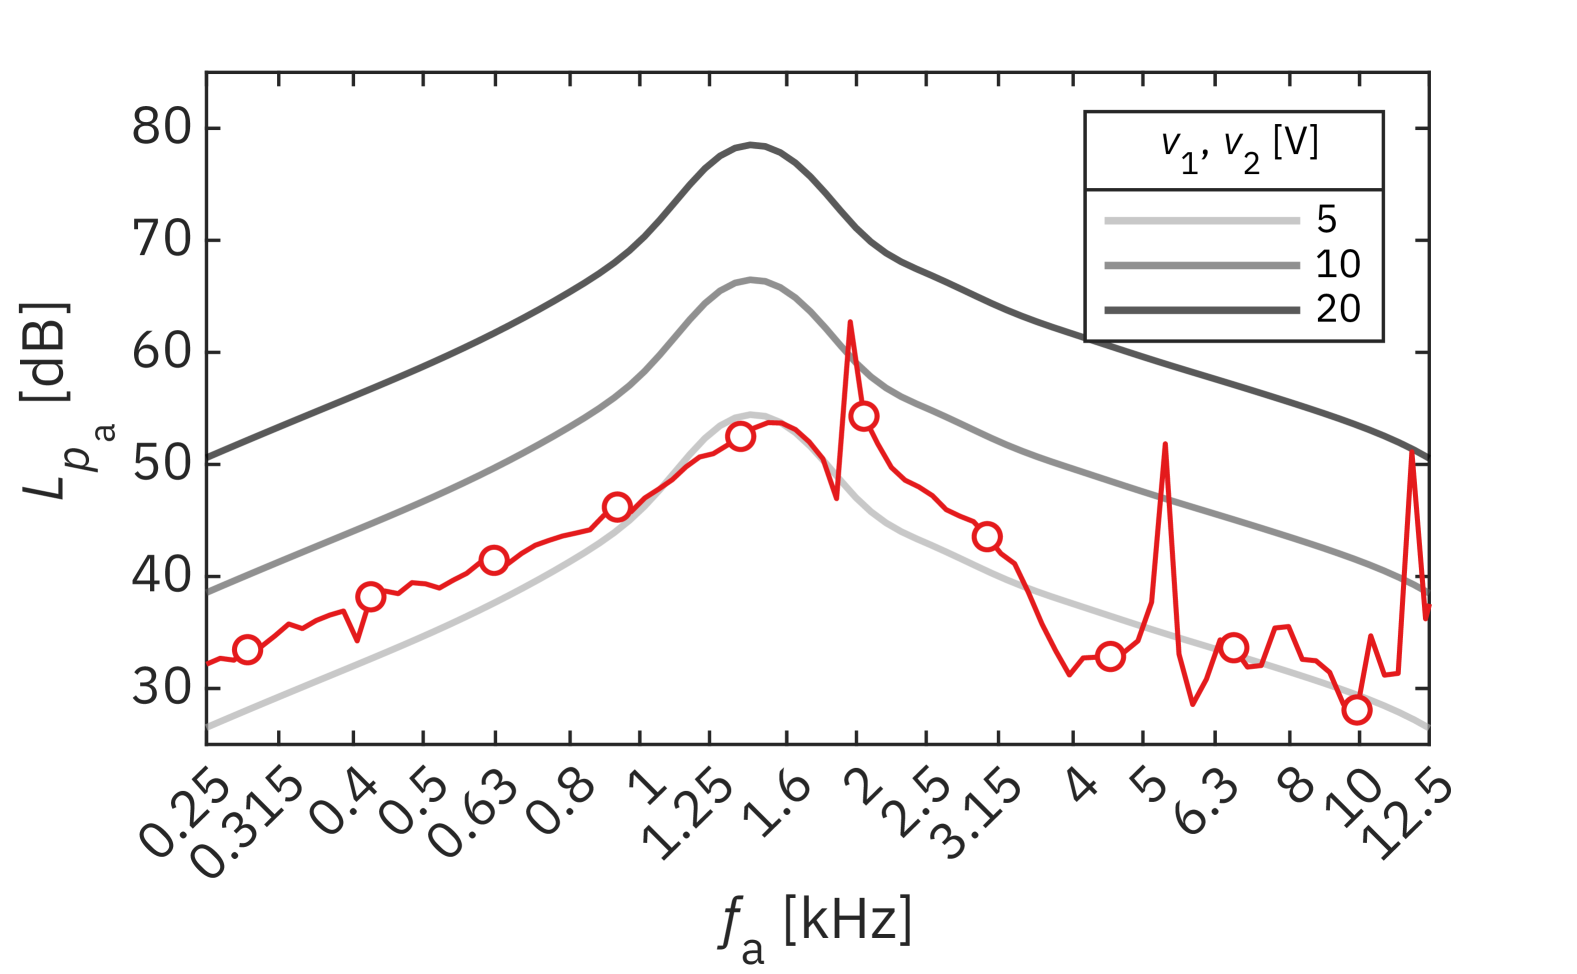
Figure 15 illustrates the measured audio frequency response of the SPPAL driven by LSB-AM, recorded at the m. Both the carrier and sideband signals were driven at V. The experimental results (markers) reveal an enhancement in the audio output near the frequency region associated with the DR spacing, aligning with the intended design. The thick gray solid lines represent analytical predictions computed using Methods B for driving voltages of , , V. As previously observed in Figs. 11 and 13, deviations between the fabricated transducer and its target specifications result in some discrepancy between experimental and theoretical curves. Nevertheless, the measured trends are consistent with simulation results.
Propagation curve
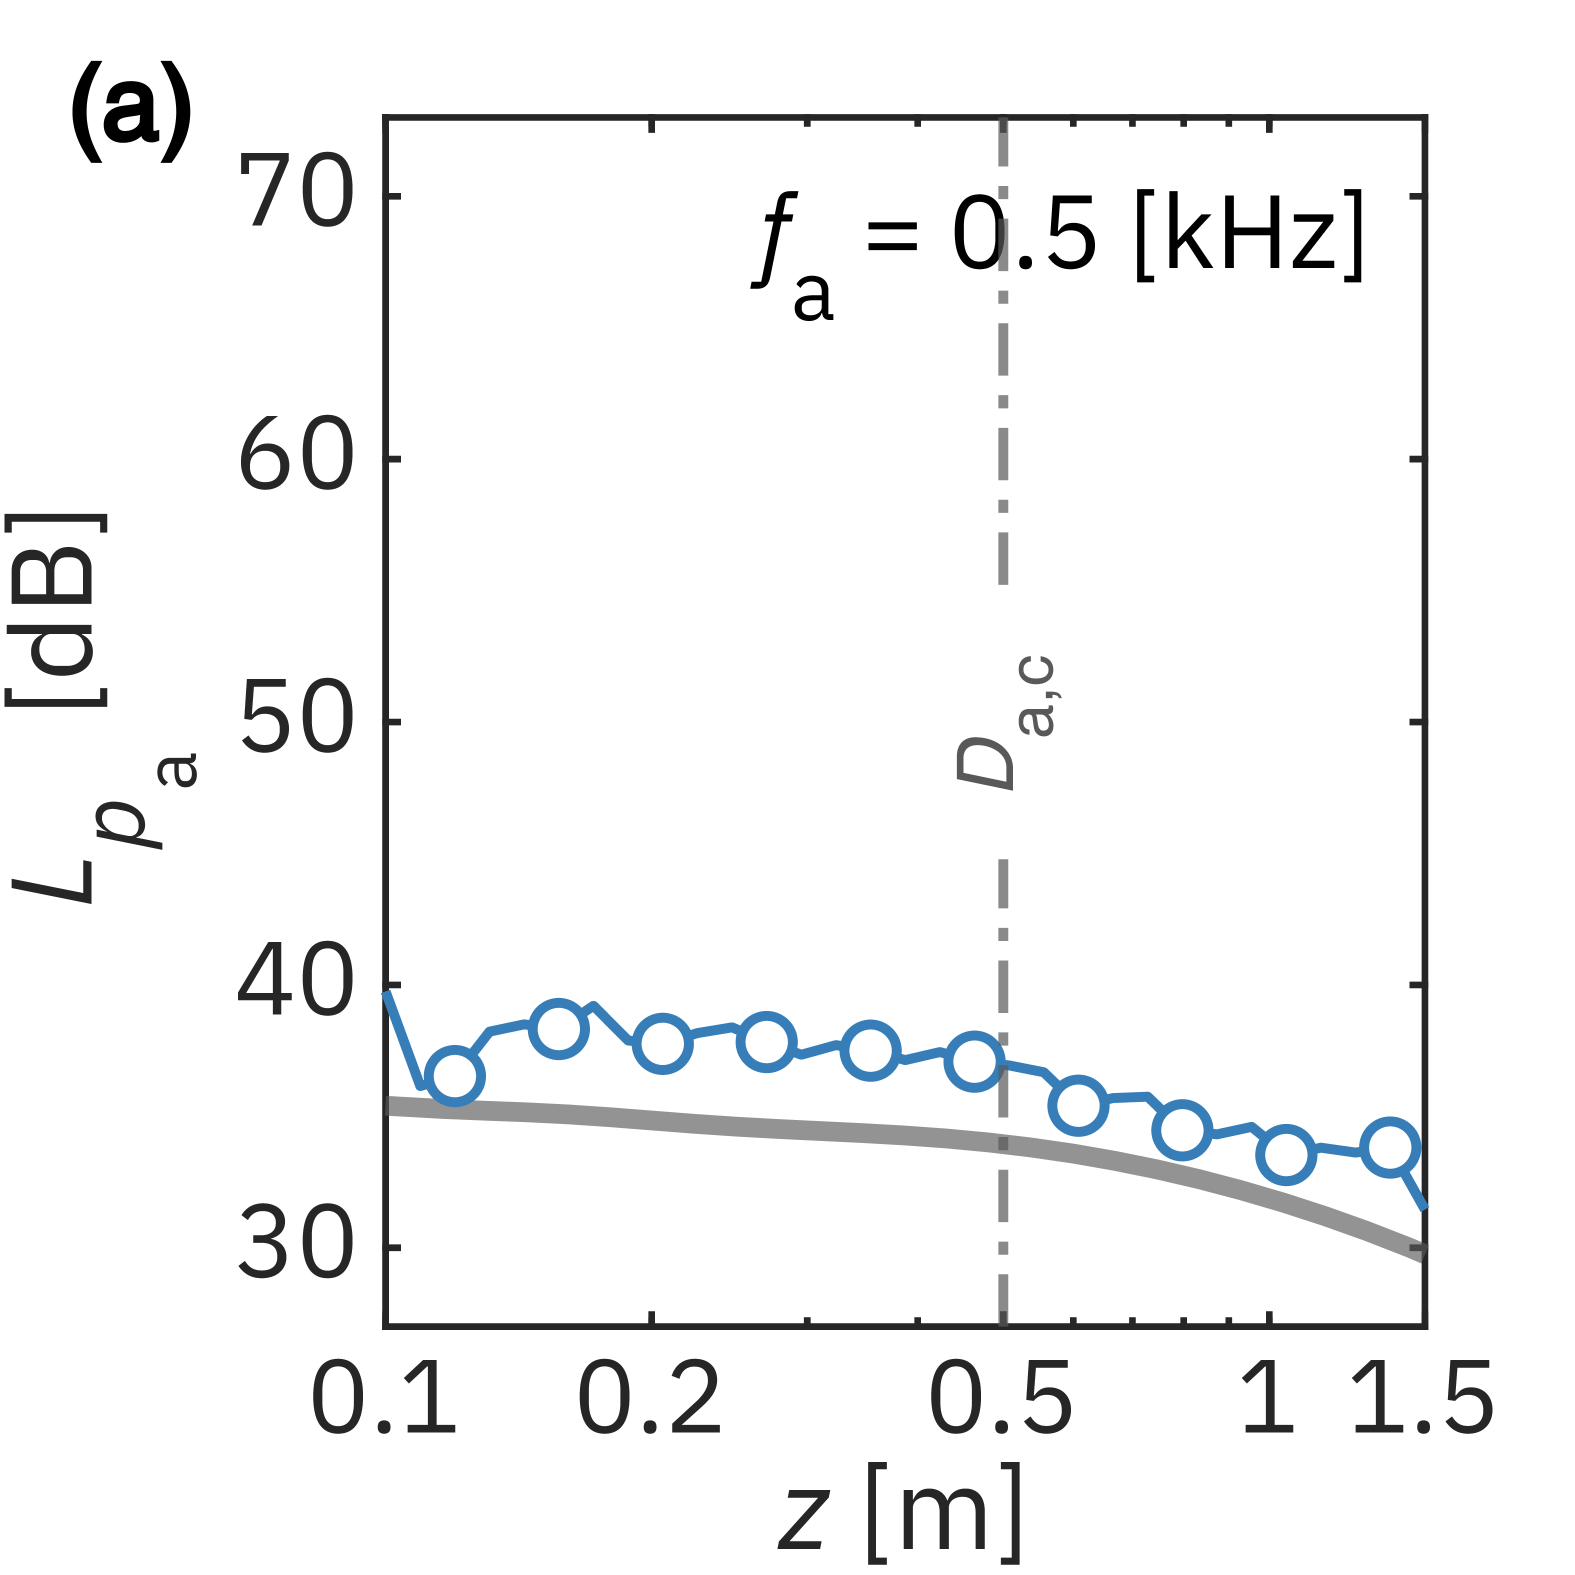
Figures 16(a)-16(d) illustrates the PCs of audio frequencies kHz generated by the SPPAL driven at V. As designed, each curve exhibits a peak at the m. This experimental validation confirms the appropriateness of employing a RP as the fundamental design reference for the SPPAL, as initially proposed in Sec. II.1. The audio CD thus emerges as an optimal target position for listeners due to the maximized cumulative effect of the audio signals.
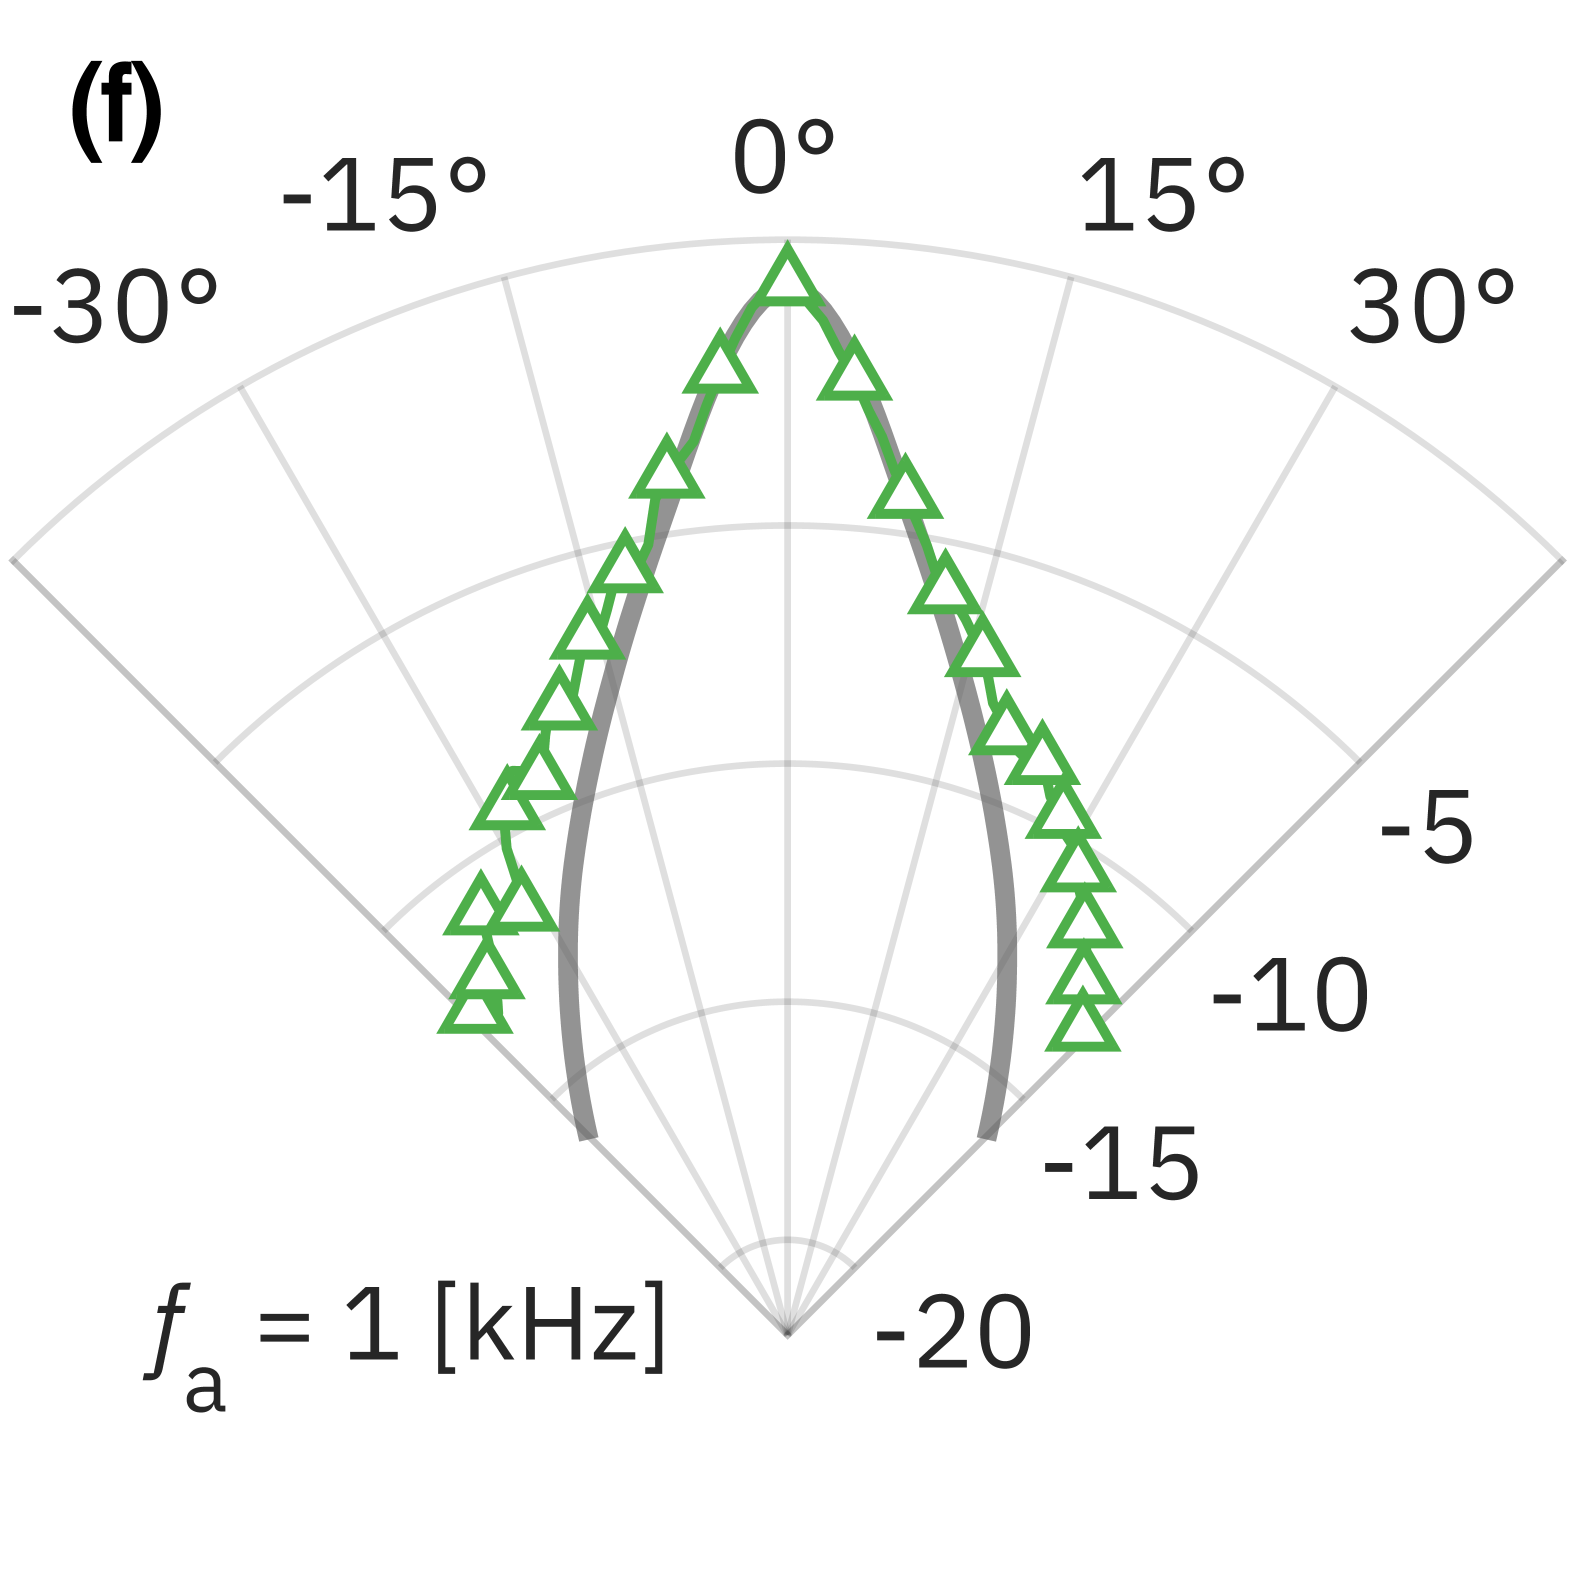
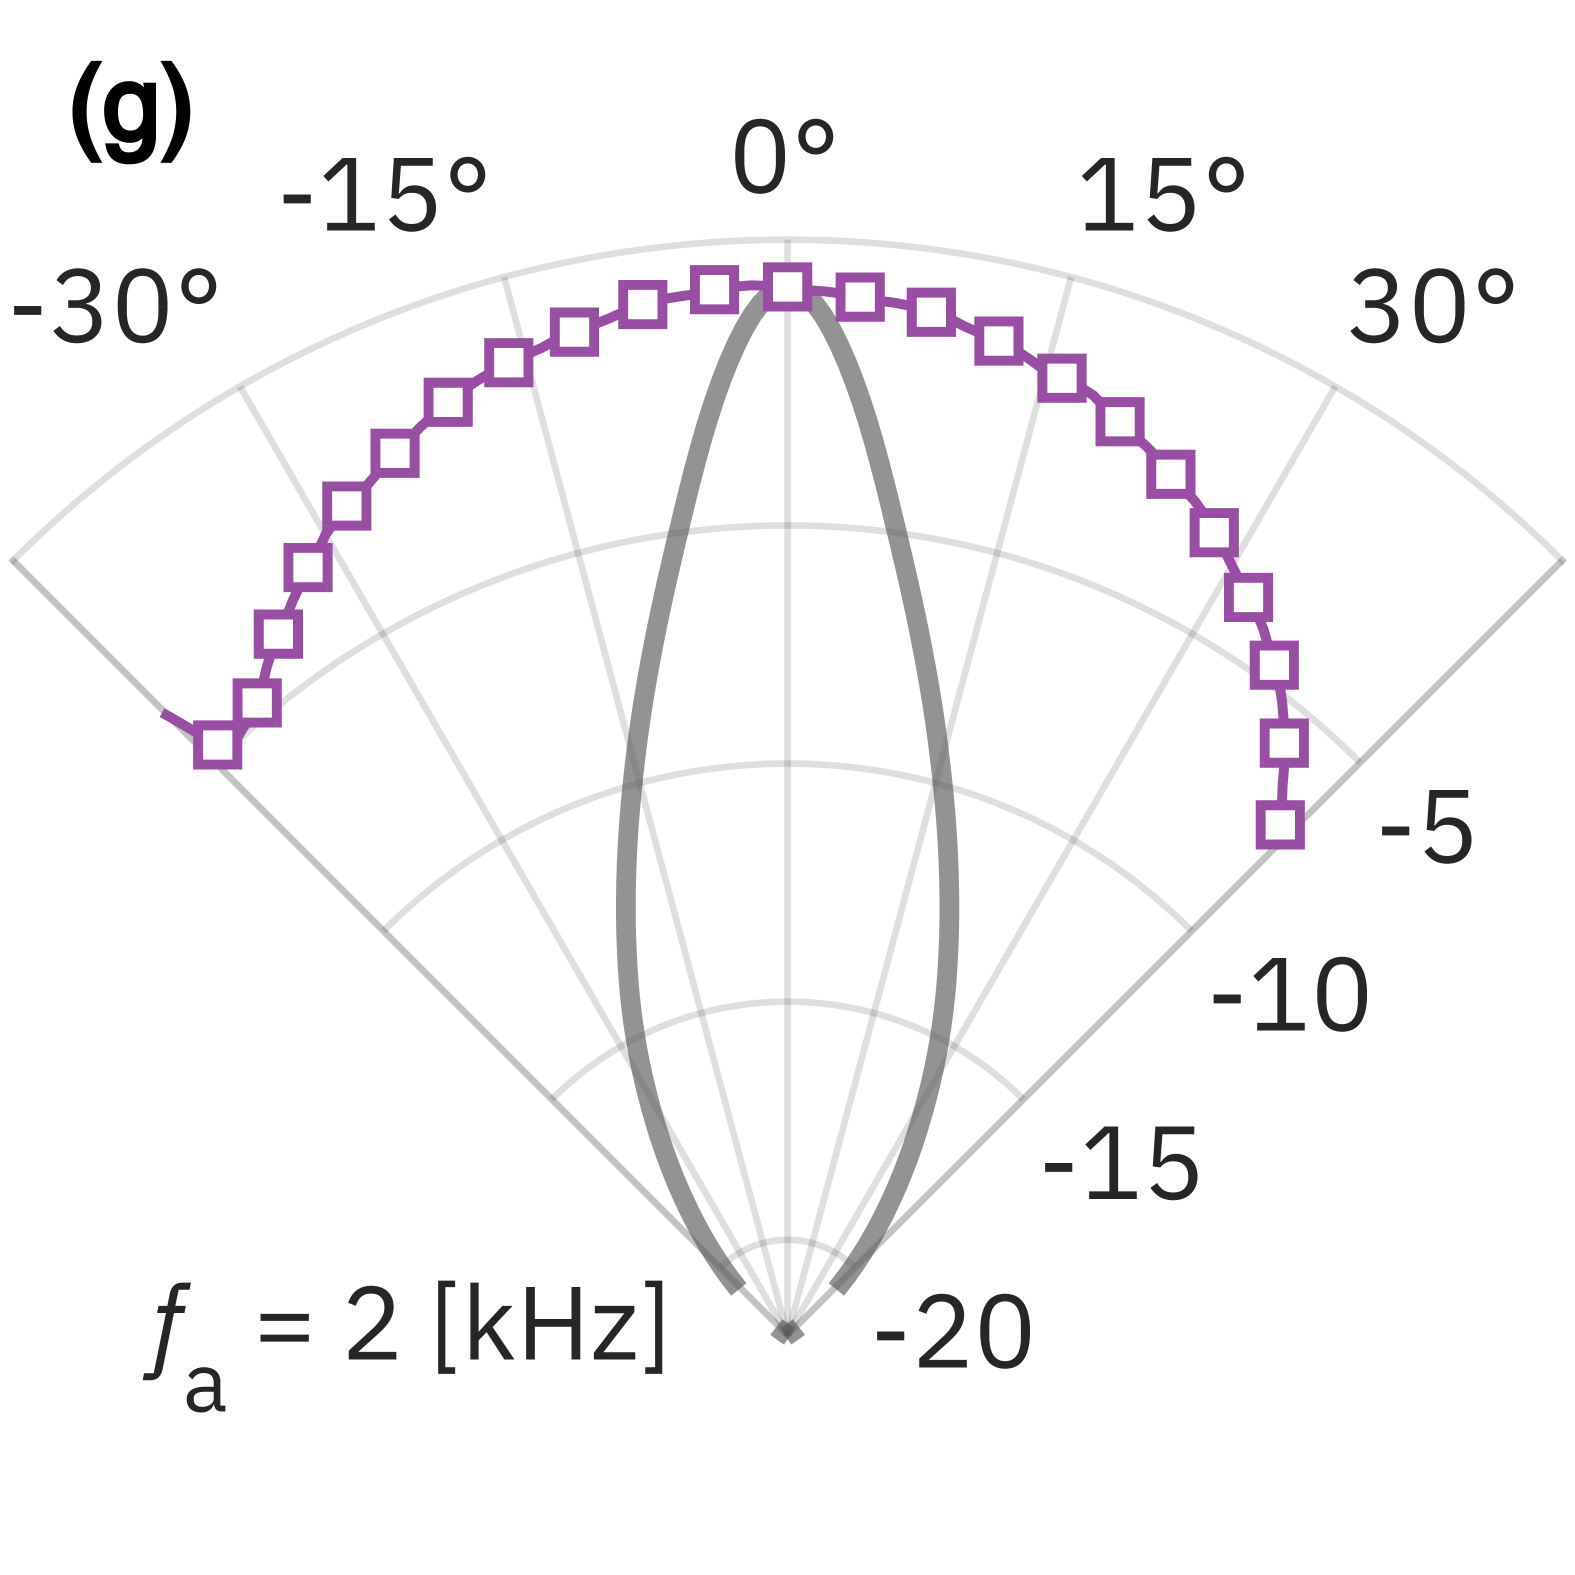
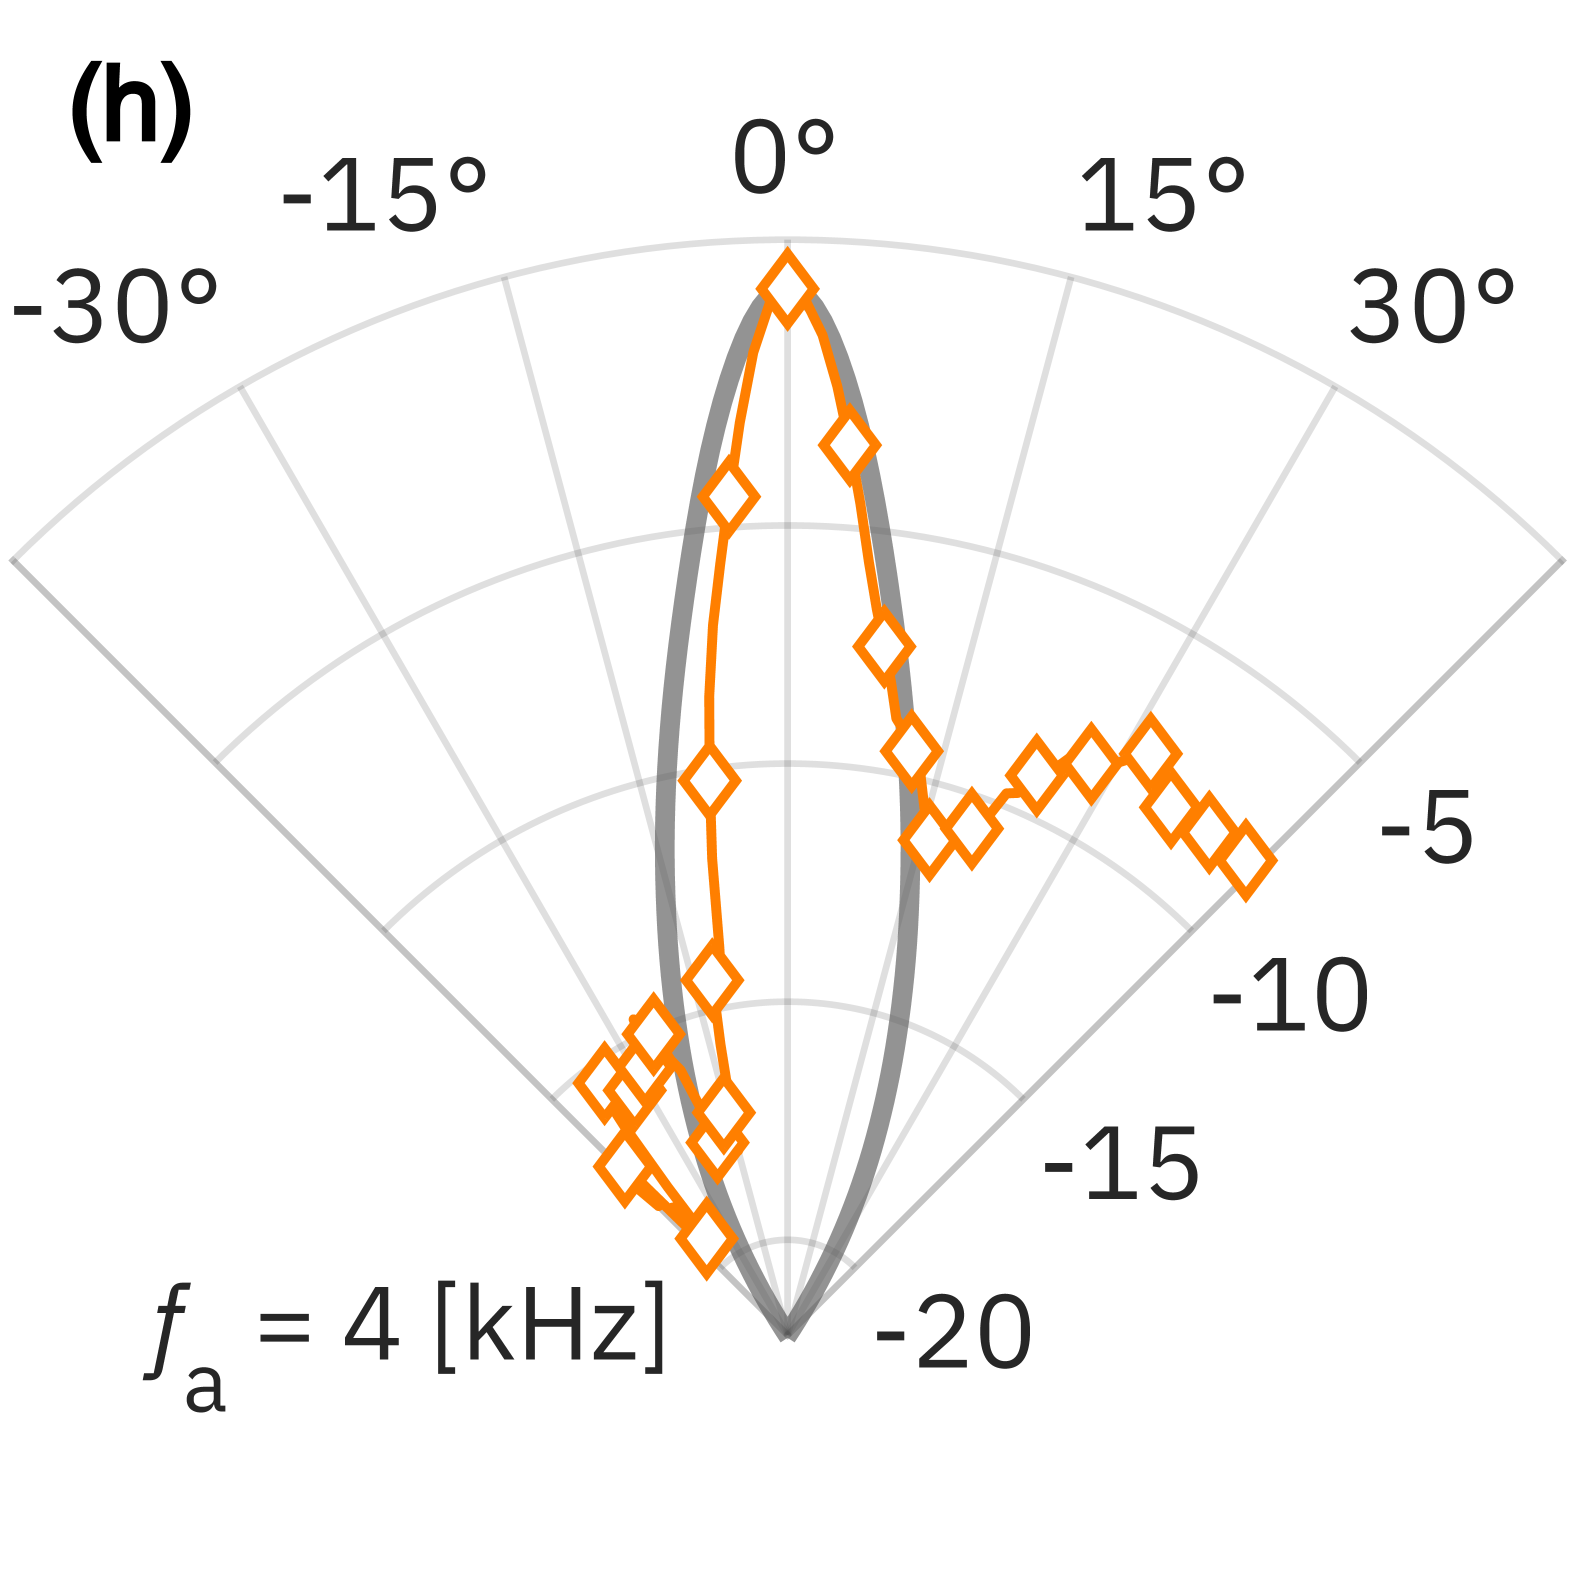
Beam pattern
Figures 16(e)-16(h) presents the measured BPs of the audio frequencies kHz generated by the SPPAL, recorded at m. The experimental results (colored markers) show good agreement with analytical predictions (solid gray lines), also with the notable exception of the BP at kHz, where considerable deviation is observed.
IV.4 Combination resonance
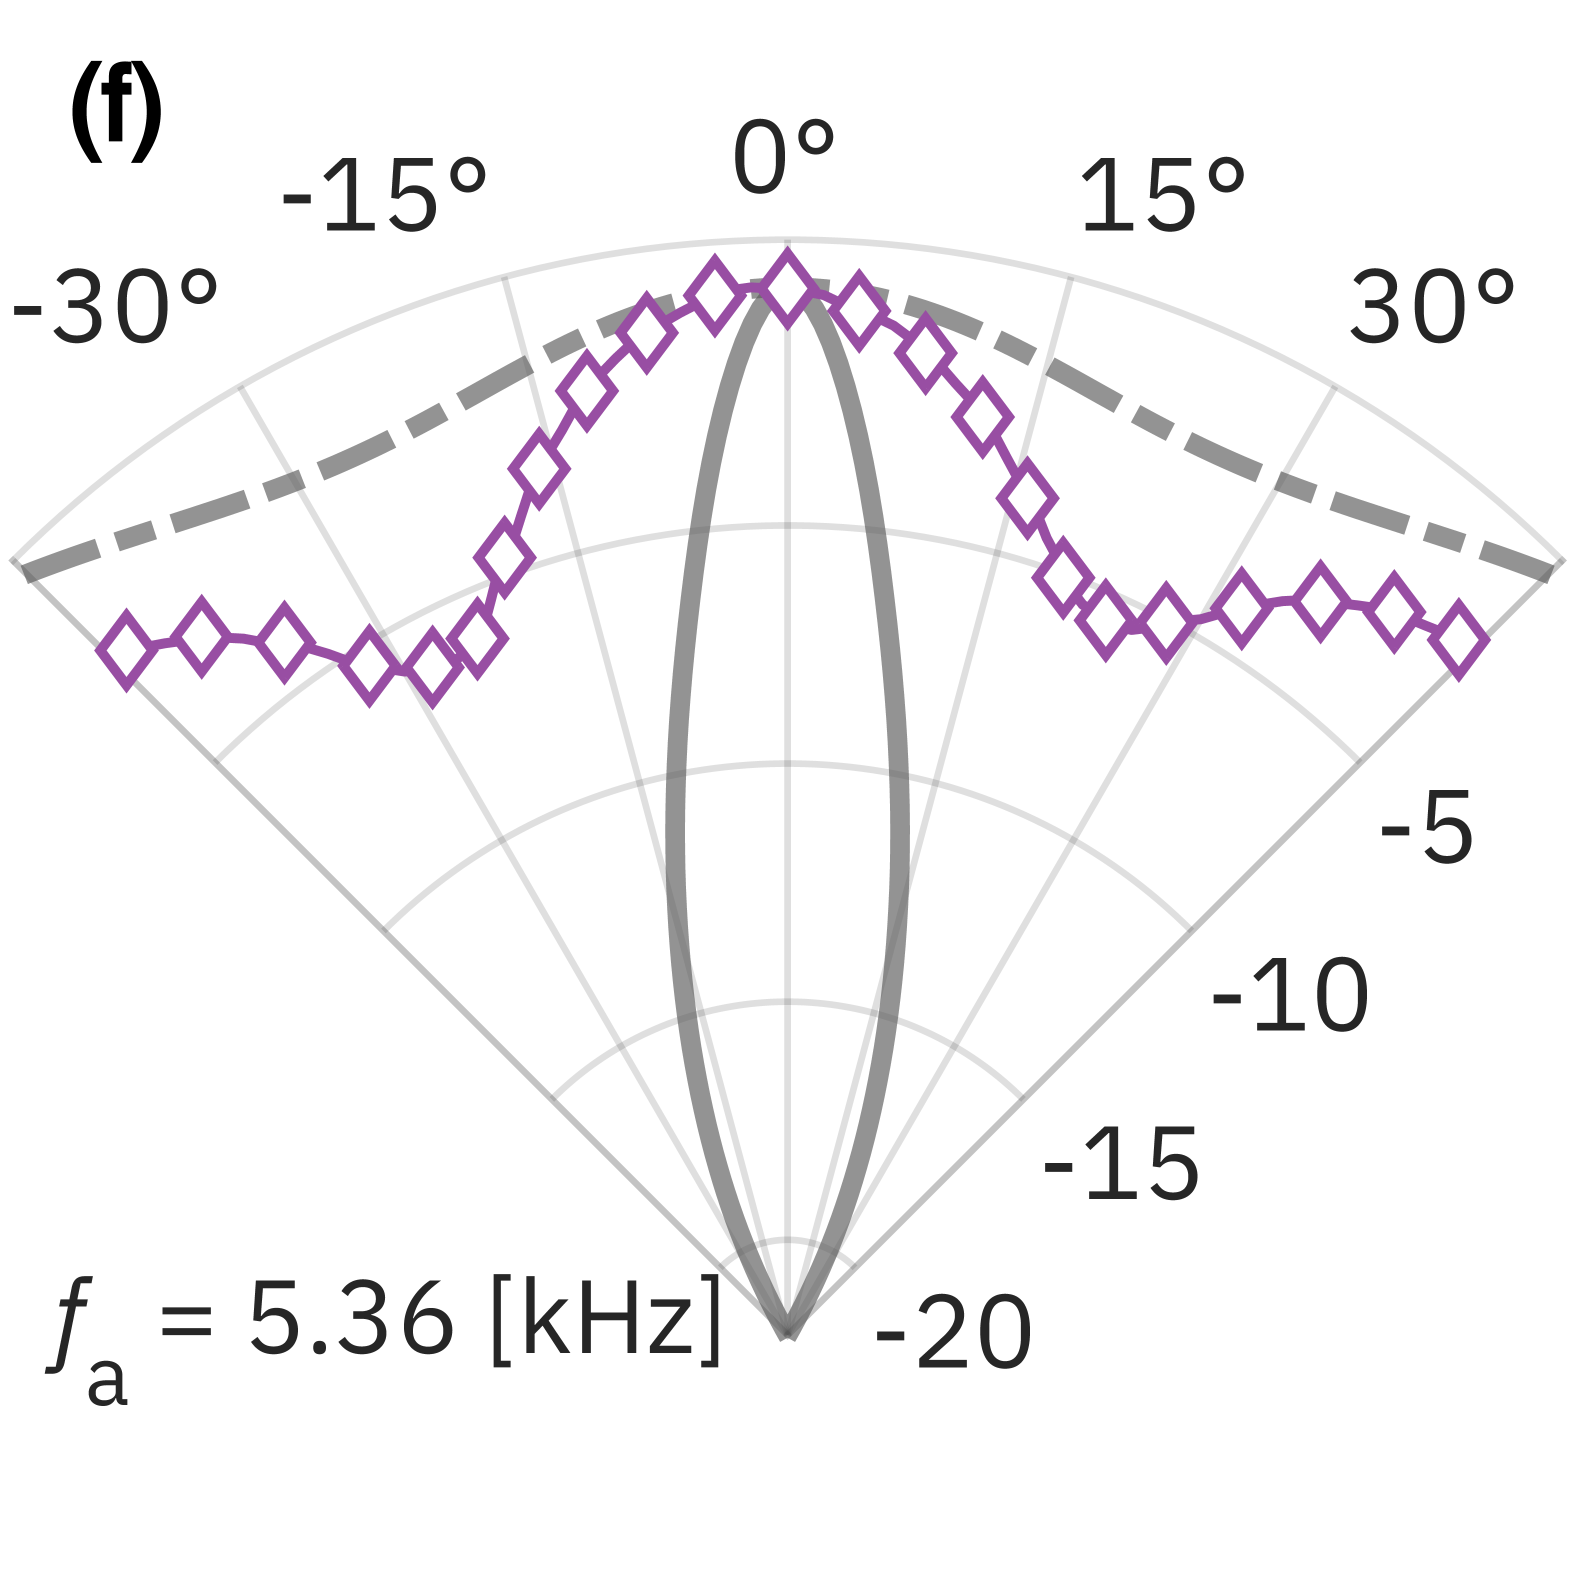
Combination resonance (CR)[34, 44] refers to a nonlinear phenomenon in which intermodulation components excite the natural frequencies of the SPPAL, resulting in unintended mechanical responses. In the context of a SPPAL, this occurs when the difference-frequency components generated by LSB-AM coincide with the plate’s inherent vibrational modes. When such resonance is triggered, the plate emits low-frequency audio sound directly through its structural vibration, rather than via nonlinear interaction in air. The amplitude of this direct audio radiation often exceeds that of the audio sound produced, meaning the perceived audio field becomes dominated by structural vibration rather than the intended airborne nonlinear process. Consequently, the presence of CR highlights the need for further investigation into its suppression or compensation to fully harness the potential of the SPPAL in directional audio applications.
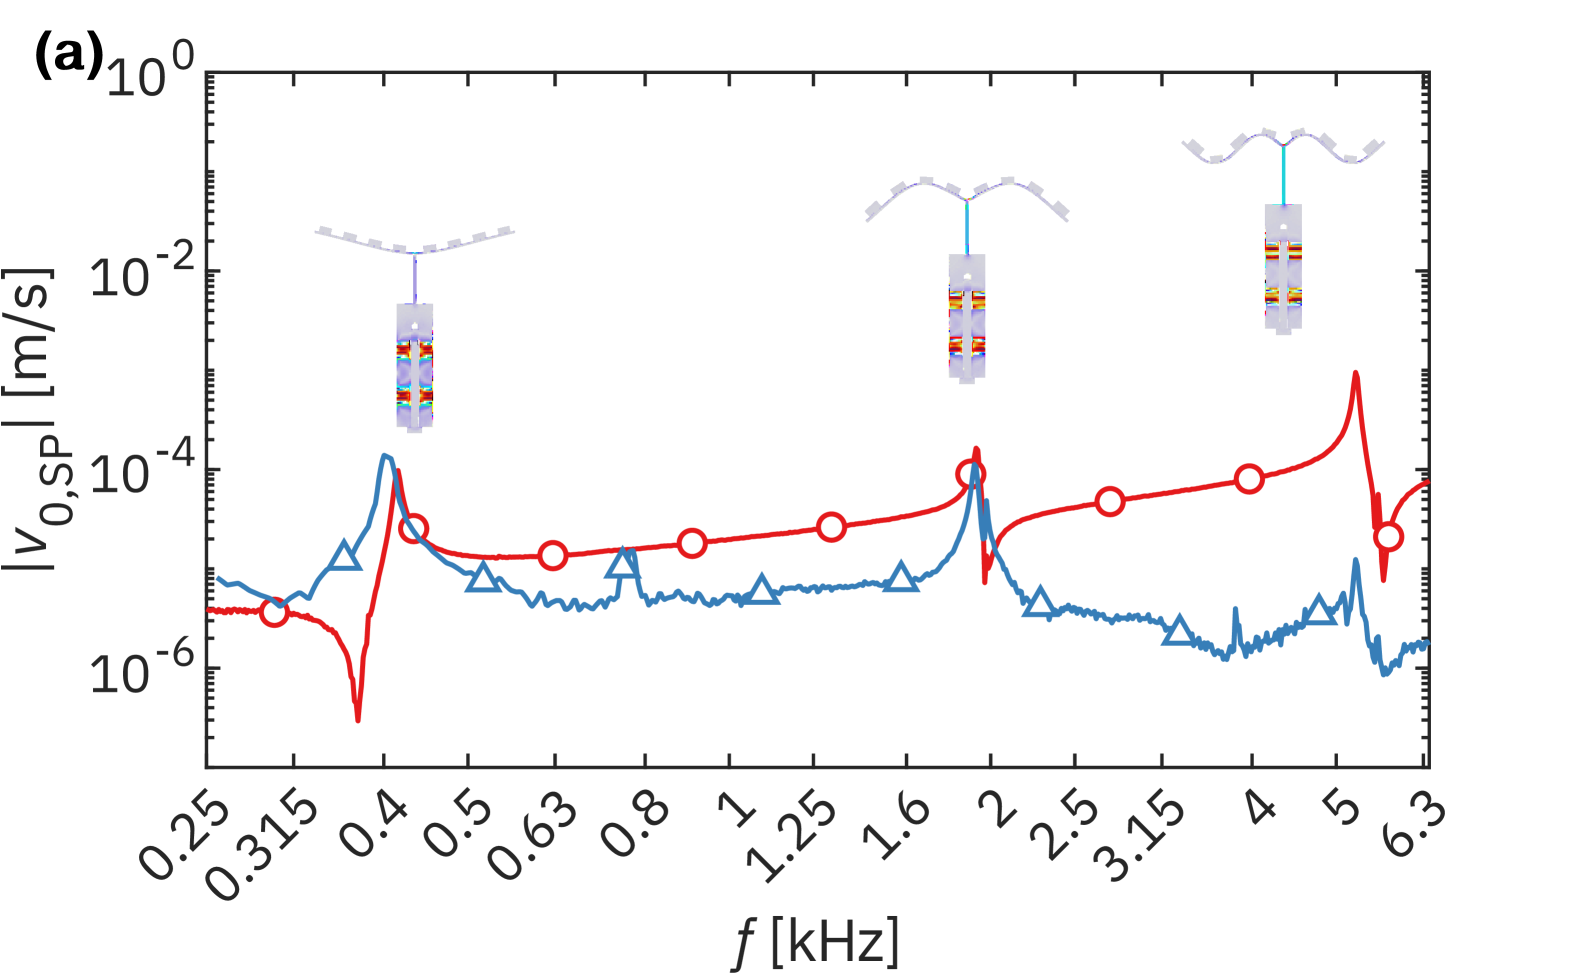
IV.4.1 Frequency response of plate’s center velocity
Figure 17(a) illustrates the velocity frequency responses measured at the center of the SPPAL plate in the audio frequency range. The circular markers represent the linear response under V excitation, while the triangular markers correspond to the response under LSB-AM excitation with both carrier and sideband signals driven at V. Distinct peaks appear near , , and kHz in both cases, indicating that the plate’s structural resonances are excited by intermodulation distortion (IMD). Although the spectrum analyzer guarantees low IMD, the LDV’s IMD characteristics are unspecified. Thus, the velocity magnitudes under LSB-AM may not be quantitatively reliable. Nonetheless, the consistent appearance of peaks at the known resonance frequencies supports the occurrence of CRs.
IV.4.2 Experimental modal analysis
Figure 17(b) presents the measured modal shapes of the SPPAL plate, acquired using LDV at frequencies where CRs were observed. For comparison, the thick gray lines show the corresponding linear modal shapes obtained from FEM simulations, amplitude-scaled to match the experimental data. The measured shapes under LSB-AM excitation closely align with the predicted linear mode shapes, confirming that the excited structural responses stem from the plate’s inherent resonances. As a reference, the modal shape at kHz is included as a control case, representing a frequency at which CR does not occur.
IV.4.3 Beam pattern
Figures 17(c)-17(f) show the BPs measured at frequencies where CRs occur. The thick gray solid lines represent analytical predictions obtained using Method B, while the dash-dotted lines correspond to FEM simulations under linear excitation at the same frequencies. At kHz, the measured BP closely matches the analytical prediction. In contrast, at CR-affected frequencies, the measured patterns exhibit significant deviations from both predictions. These results suggest that under CR conditions, the audio sound field generated by the SPPAL becomes highly unpredictable and cannot be reliably described by linear models.
IV.5 Experiment setup
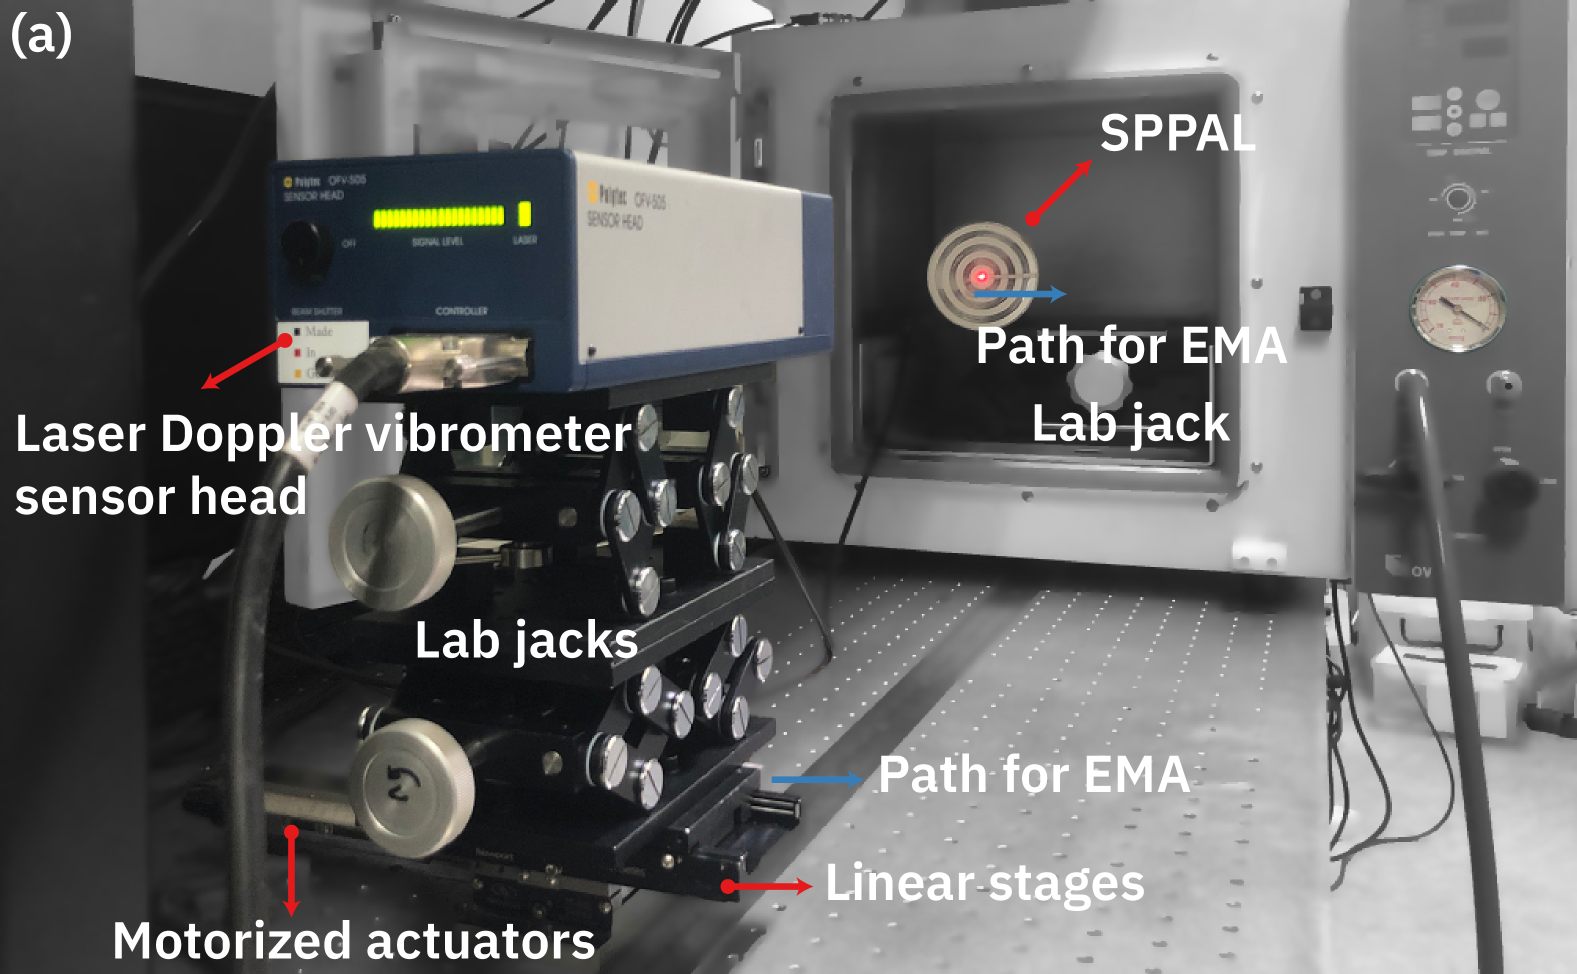
IV.5.1 Vibrational characteristics
To measure the plate’s center velocity and radial mode shape of the SPPAL, the device was mounted on a lab jack using a custom-designed jig. The vibration of the plate was measured using a single-point laser Doppler vibrometer (LDV; OFV-505, OFV-5000, VD-09, Polytec), while the LDV sensor head traversed the radial axis of the plate using a pair of motorized linear stages (LTA-HS, Newport) connected in series. The actuators of the linear stages were controlled by a motion controller (ESP301, Newport). The transducer was driven by a dynamic signal analyzer (SR785, Stanford Research Systems) through a power amplifier (HSA4052, NF Corporation), and the output signal from the LDV was recorded simultaneously. All measurement instruments were controlled and synchronized using MATLAB 2024b.
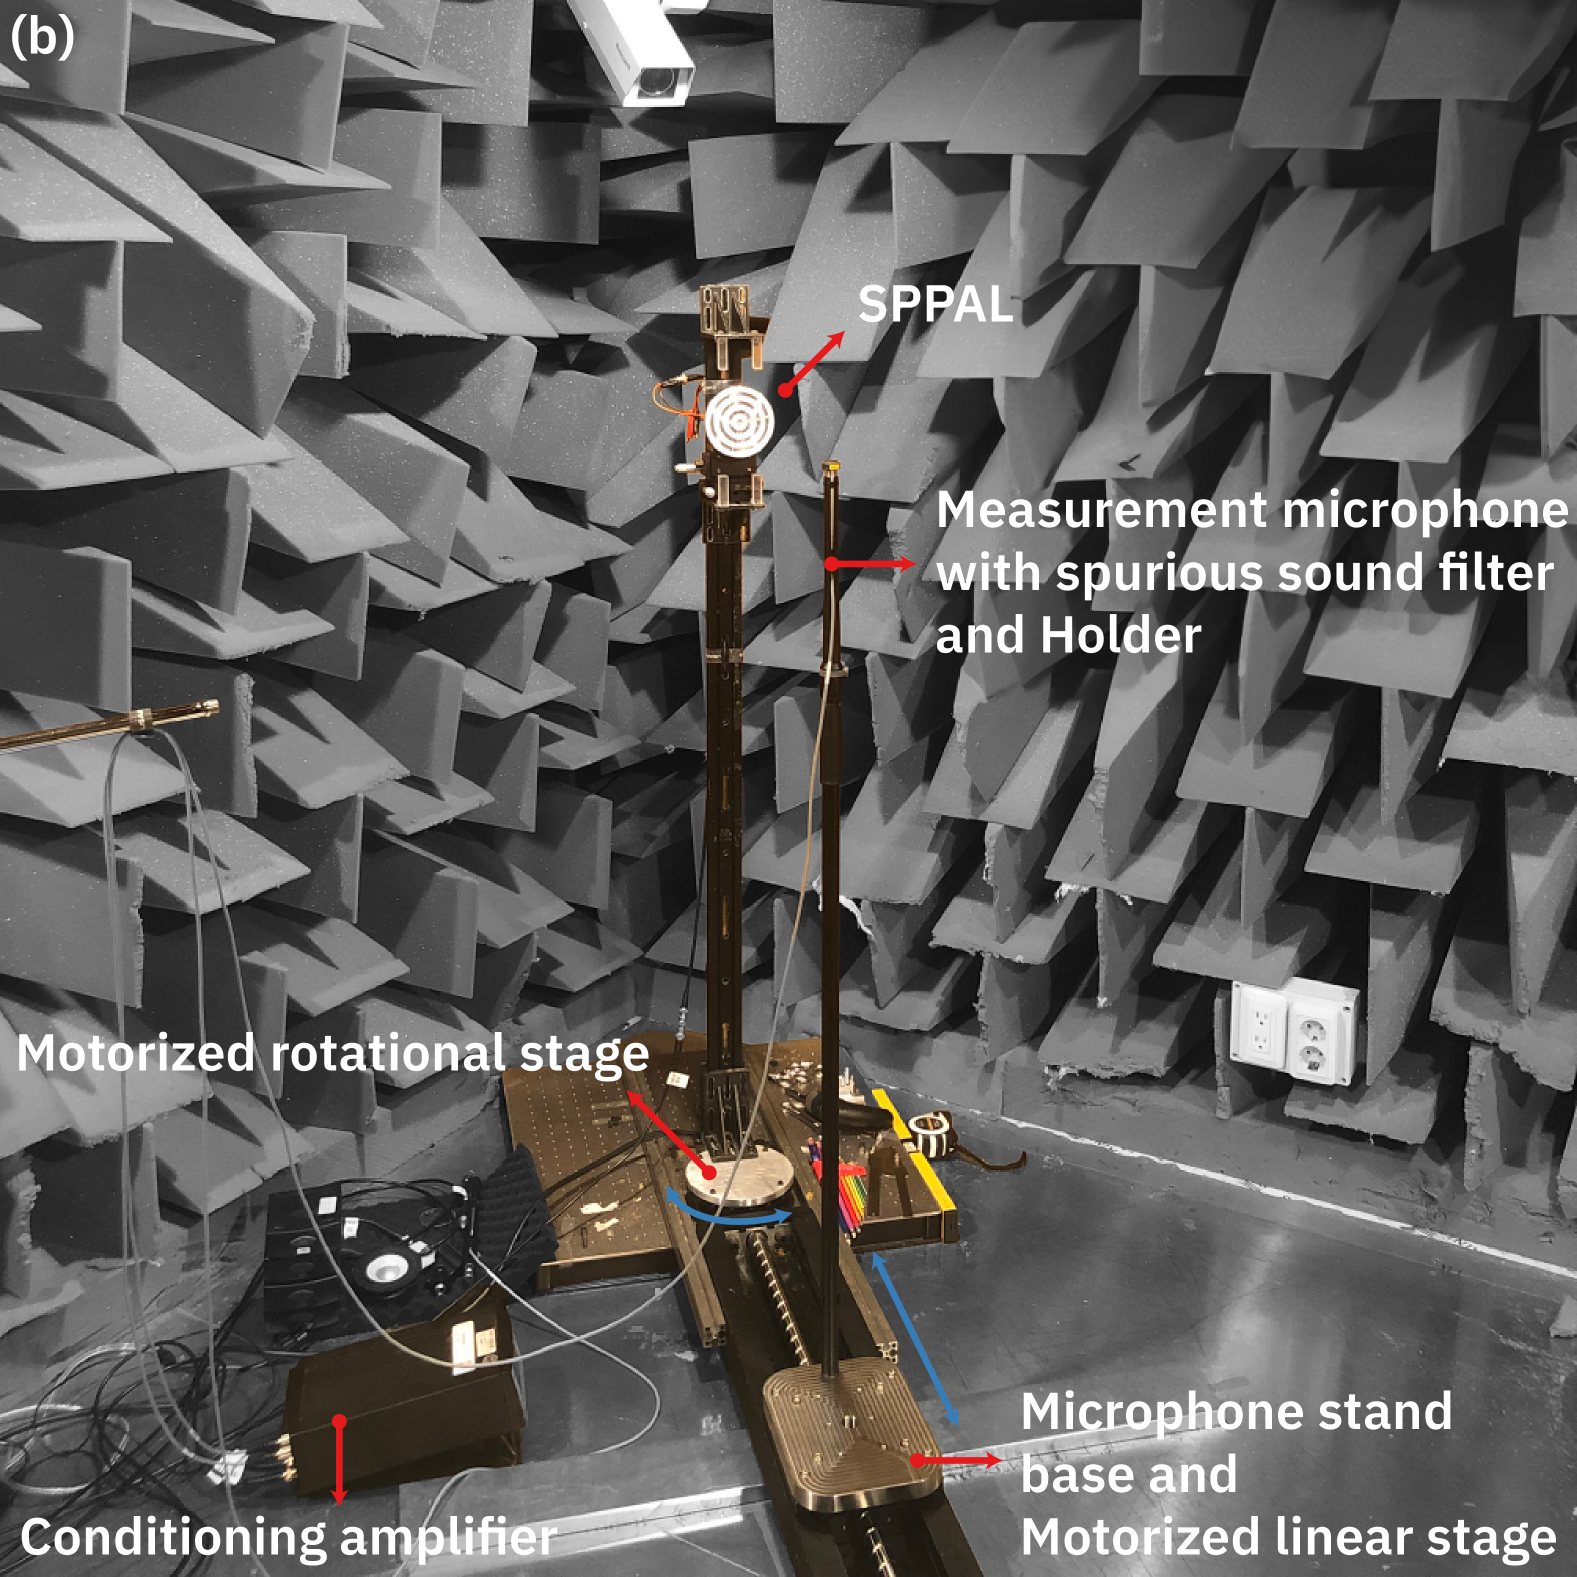
IV.5.2 Acoustic characteristics
Acoustic measurements were conducted in a semi-anechoic chamber at Pohang University of Science and Technology. The chamber’s background noise level, free-field effective volume, absorption coefficient, and low cutoff frequency were below dB SPL, , , and Hz, respectively. The temperature and relative humidity during the measurements were maintained at ℃ and % RH. The SPPAL was mounted on a motorized rotational stage using a custom jig, positioned m above the floor. Acoustic fields were measured using Brüel & Kjær 1/8” pressure-field microphone type 4138 for ultrasound and 1/2” microphone type 4192 for audio sound. The microphones, mounted on a motorized linear stage via a custom holder, were interchangeable for each measurement. For both ultrasound and audio measurements, the microphone was oriented at a ° angle of incidence to enable free-field correction and mitigate spurious sound in complex near-field measurements.[8, 45, 46] Additionally, a spurious sound filter topologically equivalent to a half-wavelength resonator was applied to the microphone assembly to further suppress spurious components.[47] A dynamic signal analyzer (SR785, Stanford Research Systems) drove the transducer through a power amplifier (HSA4052, NF Corporation), and the measurement signals were acquired using a conditioning amplifier type 2690. MATLAB 2024b was employed for data acquisition and instrument control.
V Conclusion
This study introduced and comprehensively examined SPPAL, demonstrating its potential as an effective alternative to conventional transducer array-based PAL systems. The investigation encompassed acoustic modeling, transducer design optimization, and experimental validation. The key contribution lies in quantitatively establishing an equivalence between the stepped plate (SP) and a baffled rigid piston (RP) using the equivalence ratio (ER), enabling efficient and efficient preliminary design approximations; this, in turn, facilitated a broad parametric study.
To address the intrinsic limitations of low-frequency sound pressure common in conventional PAL systems, a dual-resonance (DR) approach was proposed and validated. This DR strategy employed multi-objective optimization across a comprehensive set of design parameters. Utilizing an Approximated 3D modeling method, this study effectively balanced computational efficiency and model accuracy, significantly extending feasible design parameter ranges beyond traditional quarter-wavelength constraints up to half-wavelength diameters. This advancement allowed the practical choice of larger horn-end radii, thus directly mitigating critical manufacturing challenges. Optimal design parameters were identified by evaluating trade-offs among carrier frequency, aperture radius, and transducer geometry. Clear trends observed from the impact of these parameters on audio SPL elucidate key design parameters, providing practical guidelines for future developments in SPPAL systems or analogous flexural ultrasonic transducers.
Comprehensive experimental modal analyses provided robust validation of the theoretical and computational results, distinctly revealing the modal behavior of the stepped plate and explicitly confirming the effectiveness of the annular steps in phase compensation. Acoustic measurements reinforced these findings, affirming the accuracy of the proposed modeling approaches and the validity of the design methodology. Additionally, the experimental characterization identified the presence of combination resonance (CR), a structural excitation resulting from intermodulation phenomena. CR was experimentally demonstrated as inherent to the SPPAL due to its single-transducer configuration combined with high-order flexural mode operation of an extended radiating surface. Such resonance is not typically observed in conventional PAL systems employing arrays of single-resonance transducers. Although CR may induce unintended structural audio emissions, its identification highlights an essential area for future investigation into resonance mitigation strategies for more robust and reliable SPPAL.
Overall, this work establishes a comprehensive workflow for the design and analysis of SPPAL–from theoretical modeling to practical implementation. Beyond demonstrating the effectiveness of the proposed design scheme, the study also identifies the inherent limitations of the SPPAL concept, particularly those arising from the structural dynamics of high-order-mode operation. These findings are expected to inform the design of future flexural transducer systems, especially those adopting similar principles. Moreover, the proposed design scheme offers a valuable foundation for the development of high-performance PAL transducers and related nonlinear acoustic devices.
Acknowledgements.
This work was supported by the Industrial Strategic Technology Development Program (Korea-led for K-sensor technology for market leadership) (RS-2022-00154770, Next-generation piezoelectric based motion sensor platform) funded By the Ministry of Trade Industry & Energy (MOTIE, Korea).Author Declarations
The authors have no conflicts to disclose.
Data Availability
The data that support the findings of this study are available from the corresponding author upon reasonable request.
References
- Westervelt [1963] P. J. Westervelt, “Parametric acoustic array,” J. Acoust. Soc. Am. 35, 535–537 (1963).
- Yoneyama et al. [1983] M. Yoneyama, J.-I. Fujimoto, Y. Kawamo, and S. Sasabe, “The audio spotlight: An application of nonlinear interaction of sound waves to a new type of loudspeaker design,” J. Acoust. Soc. Am. 73, 1532–1536 (1983).
- Pompei [1999] F. J. Pompei, “The use of airborne ultrasonics for generating audible sound beams,” J. Audio Eng. Soc. 47, 726–731 (1999).
- Gan, Yang, and Kamakura [2012] W.-S. Gan, J. Yang, and T. Kamakura, “A review of parametric acoustic array in air,” Appl. Acoust. 73, 1211–1219 (2012).
- Zhong et al. [2022a] J. Zhong, T. Zhuang, R. Kirby, M. Karimi, H. Zou, and X. Qiu, “Quiet zone generation in an acoustic free field using multiple parametric array loudspeakers,” J. Acoust. Soc. Am. 151, 1235–1245 (2022a).
- Zhong et al. [2025] J.-X. Zhong, J. Ji, X. Xia, H. Heo, and Y. Jing, “Audible enclaves crafted by nonlinear self-bending ultrasonic beams,” Proc. Natl. Acad. Sci. U. S. A. 122, e2408975122 (2025).
- Li et al. [2023] M. Li, J. Zhong, Y. Jing, and J. Lu, “A note on the audio sound power generated by a parametric array loudspeaker,” J. Acoust. Soc. Am. 154, 3899–3905 (2023).
- Zhong and Qiu [2024] J. Zhong and X. Qiu, Acoustic Waves Generated by Parametric Array Loudspeakers, 1st ed. (CRC Press, Boca Raton, 2024) pp. 295–299, 305–314.
- Wygant et al. [2009] I. O. Wygant, M. Kupnik, J. C. Windsor, W. M. Wright, M. S. Wochner, G. G. Yaralioglu, M. F. Hamilton, and B. T. Khuri-Yakub, “50 khz capacitive micromachined ultrasonic transducers for generation of highly directional sound with parametric arrays,” IEEE Trans. Ultrason. Ferroelectr. Freq. Control 56, 193–203 (2009).
- Lee, Kang, and Moon [2009] H. Lee, D. Kang, and W. Moon, “A micro-machined source transducer for a parametric array in air,” J. Acoust. Soc. Am. 125, 1879–1893 (2009).
- Je et al. [2015] Y. Je, H. Lee, K. Been, and W. Moon, “A micromachined efficient parametric array loudspeaker with a wide radiation frequency band,” J. Acoust. Soc. Am. 137, 1732–1743 (2015).
- Je et al. [2010] Y. Je, H. Lee, J. Park, and W. Moon, “A stepped-plate bi-frequency source for generating a difference frequency sound with a parametric array,” J. Acoust. Soc. Am. 127, 3494–3502 (2010).
- Barone and Gallego Juarez [1972] A. Barone and J. A. Gallego Juarez, “Flexural vibrating free-edge plates with stepped thicknesses for generating high directional ultrasonic radiation,” J. Acoust. Soc. Am. 51, 953–959 (1972).
- Ranz-Guerra and Ruiz-Aguirre [1975] C. Ranz-Guerra and R. D. Ruiz-Aguirre, “Composite sandwich transducers with quarter-wavelength radiating layers,” J. Acoust. Soc. Am. 58, 494–498 (1975).
- Iula, Lamberti, and Pappalardo [1998] A. Iula, N. Lamberti, and M. Pappalardo, “An approximated 3-d model of cylinder-shaped piezoceramic elements for transducer design,” IEEE Trans. Ultrason. Ferroelectr. Freq. Control 45, 1056–1064 (1998).
- Lin [1995] S. Lin, “Coupled vibration and natural frequency analysis of isotropic cylinders or disks of finite dimensions,” J. Sound Vibr. 185, 193–199 (1995).
- Feng, Shen, and Deng [2006] F. Feng, J. Shen, and J. Deng, “A 2d equivalent circuit of piezoelectric ceramic ring for transducer design,” Ultrasonics 44, e723–e726 (2006).
- Mančić and Stančić [2010] D. D. Mančić and G. Z. Stančić, “New three-dimensional matrix models of the ultrasonic sandwich transducers,” J. Sandw. Struct. Mater. 12, 63–80 (2010).
- Hwang and Moon [2018] Y. Hwang and W. Moon, “A wide-band in-air parametric array source composed of a circular plate with steps and a langevin transducer with a horn,” Appl. Acoust. 141, 223–233 (2018).
- Kim et al. [2022] C. Kim, Y. Hwang, K. Shin, and W. Moon, “A parametric array loudspeaker featuring a langevin transducer, a circular aluminum plate, and composite polymer steps,” Sens. Actuator A-Phys. 338, 113466 (2022).
- Oh et al. [2023] B. Oh, C. Kim, D. Lee, J. Rho, and W. Moon, “An improved analytic model for designing the polymer-composite stepped-plate transducer using the modified mindlin plate theory,” Ultrasonics 131, 106933 (2023).
- Lee and Hamilton [1995] Y.-S. Lee and M. F. Hamilton, “Time-domain modeling of pulsed finite-amplitude sound beams,” J. Acoust. Soc. Am. 97, 906–917 (1995).
- Aanonsen et al. [1984] S. I. Aanonsen, T. Barkve, J. N. Tjøtta, and S. Tjøtta, “Distortion and harmonic generation in the nearfield of a finite amplitude sound beam,” J. Acoust. Soc. Am. 75, 749–768 (1984).
- Tjøtta, Tjøtta, and Vefring [2005] J. N. Tjøtta, S. Tjøtta, and E. H. Vefring, “Propagation and interaction of two collinear finite amplitude sound beams,” J. Acoust. Soc. Am. 82, S12–S12 (2005).
- Červenka and Bednařík [2013] M. Červenka and M. Bednařík, “Non-paraxial model for a parametric acoustic array,” J. Acoust. Soc. Am. 134, 933–938 (2013).
- Zhong, Kirby, and Qiu [2020] J. Zhong, R. Kirby, and X. Qiu, “A spherical expansion for audio sounds generated by a circular parametric array loudspeaker,” J. Acoust. Soc. Am. 147, 3502–3510 (2020).
- Zhuang et al. [2025] T. Zhuang, J. X. Zhong, G. Ma, F. Niu, and J. Lu, “Modeling a phased array of parametric array loudspeakers using the spherical wave expansion,” IEEE Trans. Audio Speech Lang. Process. 33, 309–318 (2025).
- Li et al. [2024] S.-Z. Li, T. Zhuang, J.-X. Zhong, and J. Lu, “Extended king integral for modeling of parametric array loudspeakers with axisymmetric profiles,” J. Acoust. Soc. Am. 156, 2189–2199 (2024).
- Kagawa et al. [1992] Y. Kagawa, T. Tsuchiya, T. Yamabuchi, H. Kawabe, and T. Fujii, “Finite element simulation of non-linear sound wave propagation,” J. Sound Vibr. 154, 125–145 (1992).
- Campos-Pozuelo, Dubus, and Gallego-Juárez [1999] C. Campos-Pozuelo, B. Dubus, and J. A. Gallego-Juárez, “Finite-element analysis of the nonlinear propagation of high-intensity acoustic waves,” J. Acoust. Soc. Am. 106, 91–101 (1999).
- Červenka and Bednařík [2019] M. Červenka and M. Bednařík, “A versatile computational approach for the numerical modelling of parametric acoustic array,” J. Acoust. Soc. Am. 146, 2163–2169 (2019).
- Zhong, Kirby, and Qiu [2021] J. Zhong, R. Kirby, and X. Qiu, “The near field, westervelt far field, and inverse-law far field of the audio sound generated by parametric array loudspeakers,” J. Acoust. Soc. Am. 149, 1524–1535 (2021).
- Červenka and Bednařík [2022] M. Červenka and M. Bednařík, “An algebraic correction for the westervelt equation to account for the local nonlinear effects in parametric acoustic array,” J. Acoust. Soc. Am. 151, 4046–4052 (2022).
- Nayfeh and Mook [1995] A. Nayfeh and D. Mook, Nonlinear Oscillations (Wiley, 1995) pp. 14–20, 26–35, 201–203.
- Zhong et al. [2023] J. Zhong, H. Zou, J. Lu, and D. Zhang, “A modified convolution model for calculating the far field directivity of a parametric array loudspeaker,” J. Acoust. Soc. Am. 153, 1439–1451 (2023).
- ISO [1993] ISO 9613-1:1993 Acoustics – Attenuation of sound during propagation outdoors – Part 1: Calculation of the absorption of sound by the atmosphere (International Organization for Standardization, 1993).
- [37] See supplementary material for computational algorithm descriptions used in multi-objective and global optimization, and for detailed comparison of nonlinear acoustic simulation methods (Methods A-C).
- Berktay [1965] H. O. Berktay, “Possible exploitation of non-linear acoustics in underwater transmitting applications,” J. Sound Vibr. 2, 435–461 (1965).
- Zhong et al. [2022b] J. Zhong, T. Zhuang, R. Kirby, M. Karimi, X. Qiu, H. Zou, and J. Lu, “Low frequency audio sound field generated by a focusing parametric array loudspeaker,” IEEE-ACM Trans. Audio Speech Lang. 30, 3098–3109 (2022b).
- Neppiras [1973] E. A. Neppiras, “The pre-stressed piezoelectric sandwich transducer,” in Ultrasonics international 1973 (London, England, 1973) pp. 295–302.
- Oberg et al. [2020] E. Oberg, F. D. Jones, H. Horton, H. Ryffel, and C. McCauley, Machinery’s Handbook (Industrial Press, 2020) pp. 1653–1661.
- DeAngelis, Schulze, and Wong [2015] D. A. DeAngelis, G. W. Schulze, and K. S. Wong, “Optimizing piezoelectric stack preload bolts in ultrasonic transducers,” Phys. Procedia 63, 11–20 (2015).
- The MathWorks, Inc. [2024] The MathWorks, Inc., Global Optimization Toolbox User’s Guide, R2024b (2024) pp. 1–31–1–36.
- Yamamoto and Hayashi [1964] T. Yamamoto and S. Hayashi, “Combination tones of differential type in nonlinear vibratory systems,” Bulletin of JSME 7, 690–698 (1964).
- Ju and Kim [2010] H. S. Ju and Y.-H. Kim, “Near-field characteristics of the parametric loudspeaker using ultrasonic transducers,” Appl. Acoust. 71, 793–800 (2010).
- Nomura and Sato [2022] H. Nomura and H. Sato, “Influence of microphone characteristics on demodulated sound measurement in near field of parametric loudspeaker,” Jpn. J. Appl. Phys. 61, SG1008 (2022).
- [47] W. Kim, B. Oh, J. Rho, and W. Moon, “An accurate measurement of parametric array using a spurious sound filter topologically equivalent to a half-wavelength resonator,” ArXiv, Apr 16, 2025, preprint, v1.