Multi-Component Ionized Gas Outflows in a Hot Dust-Obscured Galaxy W20260716 with Keck/OSIRIS
Abstract
We present narrowband-filtered integral field unit (IFU) observations of the Hot Dust-Obscured Galaxy (Hot DOG) WISE J202615.27+071624.0 (hereafter W20260716) at redshift using Keck/OSIRIS. Our analysis reveals a multi-component ionized gas outflow structure in this heavily obscured AGN host galaxy. Multi-component Gaussian decomposition of the [O iii] and H emission lines uncovers extremely broad and asymmetric profiles, characteristic of AGN-driven outflows. Kinematic mapping shows spatially distinct structures: the [O iii] and H dominated components (with radii of kpc) are separated by a projected offset of kpc and exhibit divergent velocity regimes. The [O iii] outflow reaches a velocity of 3210 50 km s-1, while the H outflow component attains 2310 840 km s-1. Dynamical modeling supports a biconical outflow structure, with [O iii] and H emissions dominating separate cones and significant dust obscuration of the redshifted outflow. Their comparable momentum outflow rates and energy outflow rates suggest a potential physical connection in their driving mechanisms. Spectral energy distribution (SED) analysis reveals anomalous optical/UV excess, attributed to AGN photon scattering by dust or outflowing material, classifying W2026+0716 as a “Blue Hot DOG.” The derived outflow timescale ( yr) aligns with the evolutionary phase of Blue Hot DOGs, suggesting AGN feedback operates persistently during this transitional stage.
1 Introduction
Active Galactic Nucleus (AGN) feedback injects energy and momentum into the surrounding interstellar medium (ISM) in the host galaxy through various mechanisms (Feruglio et al., 2010; Fabian, 2012; King & Pounds, 2015; Cicone et al., 2014). This feedback process typically impacts the distribution and kinematic properties of gas in galaxies (Fabian, 2012), the star formation rate (Di Matteo et al., 2005; Hopkins et al., 2016), and further affects the evolution of the host galaxy (Kormendy & Ho, 2013; Heckman & Best, 2014). AGN-driven outflows play a crucial role in the feedback process (Yuan & Narayan, 2014; King & Pounds, 2015; Cicone et al., 2018). The energy or momentum of these AGN-powered outflows (Faucher-Giguère & Quataert, 2012; Costa et al., 2014) can eject material from the nuclear region of galaxies at high velocities (Rupke & Veilleux, 2011; Feruglio et al., 2015; Fiore et al., 2017).
AGN feedback is expected during the short “blowout” phase of an obscured AGN in merging driven galaxy evolution. During this phase, AGN outflows clear the surrounding dust and gas, revealing bright, unobscured quasars, which may further deplete the cold gas available for star formation. This process drives the transition of merging galaxies from an early dust-obscured, star-forming, and rapidly accreting AGN phase to a later phase characterized by suppressed star formation and AGN dominance (e.g., Sanders et al., 1988; Hopkins et al., 2016). Within this framework, dust-reddened, obscured AGNs offer a key sample for investigating this rapid transitional evolution process. These obscured AGN systems often show active star formation (e.g., Canalizo & Stockton, 2001; Urrutia et al., 2008; Assef et al., 2015; Calistro Rivera et al., 2021; Glikman et al., 2022; Sun et al., 2024), suggesting that the AGN energy output has begun clearing the surrounding medium but has not yet fully halted star formation activity. Dust-reddened and obscured AGNs are thus prime candidates for studying how AGN feedback regulates galaxy evolution.
Hot Dust-Obscured Galaxies (Hot DOGs) are a population of highly obscured, hyper-luminous galaxies (Eisenhardt et al., 2012; Wu et al., 2012) discovered by the WISE survey (Wright et al., 2010). They represent the most luminous obscured galaxies in the universe with luminosities exceeding (over 10% of them surpassing ) (Tsai et al., 2015), spanning a wide redshift range of – (Eisenhardt et al., 2012; Li et al., 2024, ; Eisenhardt et al. in prep.) with few sources at (Li et al., 2023) and are commonly found in high-density environments (Jones et al., 2014; Assef et al., 2015; D´ıaz-Santos et al., 2018; Ginolfi et al., 2022; Luo et al., 2022; Zewdie et al., 2023, 2024). Multi-wavelength observations with space facilities and ground-based telescopes show a strong mid-infrared component in their spectral energy distributions (SEDs), suggesting higher dust temperatures ( 450 K or higher, Tsai et al., 2015) compared to typical dust-obscured galaxies (Blain, 2003; Bussmann et al., 2009; Casey et al., 2014). They are indeed rare, with a surface number density of (corresponding to one object per ), yet their number density is on par with that of equally luminous, unobscured quasars at the brightest end of the luminosity function (Assef et al., 2015). The extreme luminosities of Hot DOGs are powered by accretion onto a central supermassive black hole (SMBH) heavily enshrouded in gas and dust (Eisenhardt et al., 2012; Assef et al., 2015; Tsai et al., 2015), making them difficult to detect in the X-ray band due to the high Compton thickness (Stern et al., 2014; Piconcelli et al., 2015; Assef et al., 2016; Vito et al., 2018; Assef et al., 2020). The black hole masses have been estimated at around with an Eddington ratio close to unity (Wu et al., 2018; Finnerty et al., 2020; Li et al., 2024) and occasionally surpass the Eddington limit (Tsai et al., 2018; Li et al., 2024). The extreme luminosities () of these highly obscured AGNs within typical galaxies (Assef et al., 2015; Li et al., 2024) suggests that Hot DOGs are experiencing a critical transitional phase in galaxy and AGN evolution, characterized by high luminosity, high accretion, and intense feedback.
Blue-excess Hot Dust-obscured Galaxy (BHD), first identified as a distinct subpopulation of Hot DOGs by Assef et al. (2016), exhibit significant blue/UV excess emission in their rest-frame SEDs. Unlike typical Hot DOGs where the blue/UV continuum can be sufficiently modeled with star formation components, BHDs’ SEDs require incorporation of an AGN component dominating of the bolometric luminosity blueward of 1 µm to obtain physically consistent SED solutions (Li et al., 2024). Polarimetric observations together with radiative transfer modeling reveal that the blue-excess emission predominantly originates from scattered light emerging through partial obscuration of a centrally-located, heavily dust-enshrouded AGN (Assef et al., 2020, 2022).
Evidence of outflows in Hot DOGs has been observed across multiple wavelengths. Spectroscopic signatures of kpc-scale ionized gas outflows, based on the broad and blue-shifted [O iii] emission lines (Finnerty et al., 2020; Jun et al., 2020; Vayner et al., 2024) and polarimetric imaging (Assef et al. 2022, Assef et al. in prep.), suggest that these objects commonly host high-kinetic-energy outflows, indicating strong AGN feedback. Recent studies (Martin et al., 2024) have expanded the sample of outflows and provided the first evidence for molecular gas outflows. In some Hot DOGs with significant outflow features, multi-wavelength SEDs display an additional emission component potentially linked to the outflow or AGN photon scattering by dust (Assef et al. 2022; Li et al. 2024, Assef et al. 2024 in prep.). However, these studies on Hot DOG outflows are primarily based on 1-D spectroscopy without spatial information. High spatial resolution integral field spectroscopic observation data can directly reveal the outflow gas morphology, kinematic properties, and its interactions with the ISM of the host galaxy in detail.
In this study, we conducted near-infrared IFU observations of WISE J202615.27071624.0 (hereafter W20260716), at = 2.570, as spectroscopically measured by Jun et al. (2020). The HST F160W image shows its compact and mildly disturbed morphology (Fan et al., 2016). This system is identified as a BHD with ionized gas outflow features in its 1-D optical spectrum. Our analysis and discussions focus on the spatial discrepancies between the broad [O iii] and H emission lines. This paper is organized as following: Section 2 details our observational methods and data processing; Section 3 describes our data fitting and analysis techniques; Section 4 presents the imaging analysis results and kinematic calculations; Section 5 provides a physical interpretation and discussion of our observational and analytical findings; and Section 6 concludes with a summary of the study. This study assumes a flat CDM cosmology, with and . At , 1″ corresponds to 8.02 kpc.
2 Observation and DATA Reduction
2.1 Observations
We conducted near-infrared IFU observations of the target W2026+0716 (RA = 20h 26m 15.27s, Dec = +07∘ 16′ 2402) using OSIRIS (Larkin et al., 2006; Mieda et al., 2014) on the Keck I Telescope with Laser Guide Star Adaptive Optics (LGS-AO) system on Oct 7th and 8th, 2019 UTC. We used the 35 mas pupils, incorporating both the and filters. In this setup, a field of view of 1.12′′2.24′′ was attained, along with a sampling of 0.035′′. The observations covered the wavelength ranges 1.721-1.808 µm and 2.292-2.408 µm with spectral resolutions of . The angular resolution was calibrated through standard star observations, obtaining the full width at half maximum (FWHM) of the point spread function ′′ and ′′ in the and bands, respectively. We obtained three 900-second exposures for each band with dithering of 0.175′′ between consecutive observations, resulting in a total integration time of 45 minutes on W2026+0716. Similar dithering approach was applied to the observations of the standard stars with a typical integration time of 9 seconds per exposure.
2.2 Data Reduction
The raw data obtained from Keck/OSIRIS were processed into data cubes using the Keck/OSIRIS Data Reduction Pipeline (DRP, Lyke et al., 2017; Lockhart et al., 2019). We applied standard processing procedures to all observational data using the OSIRIS DRP including dark subtraction, channel-level adjustments, crosstalk removal, glitch identification, cosmic ray cleaning, and data cube assembly. The detailed descriptions of these procedures can be seen in the OSIRIS User Manual111https://www2.keck.hawaii.edu/inst/osiris/OSIRIS_Manual.pdf. Subsequently, we employed the OH line suppression scaling sky subtraction algorithm based on Davies (2007), which effectively removed OH sky emission lines from the observational data.
We performed atmospheric telluric correction and flux calibration for both band and band observations using the standard stars. Then we performed spectral spike cleaning by removing anomalous signals in each data cube. These spikes were identified through a localized thresholding process: Any individual spaxel showing flux values exceeding above the background level within its immediate spaxel neighborhood was flagged as an anomaly. These outliers were then replaced by the median value computed from the 8 surrounding spaxels (excluding the central spike itself), ensuring the preservation of local background continuity while eliminating uncorrelated noise events. The number of anomalous spikes is of the total 3-D data.
For each exposure frame, we selected the median spectra from several source-free regions as a sky background and subtracted this background from each pixel’s spectral data to obtain the clean datacube. Finally, we combined multiple frames of data in the same band using a weighted average method to produce the final datacube. To optimize the signal-to-noise ratio, we set the weight of each velocity channel as the ratio of the observational data to the observational error. We spatially aligned the band and band datacubes using the peaks of their continuum emissions before conducting data analysis. More detailed discussions about the spatial alignment are included in Section 3.2.
3 Data Analysis
3.1 SED Fitting
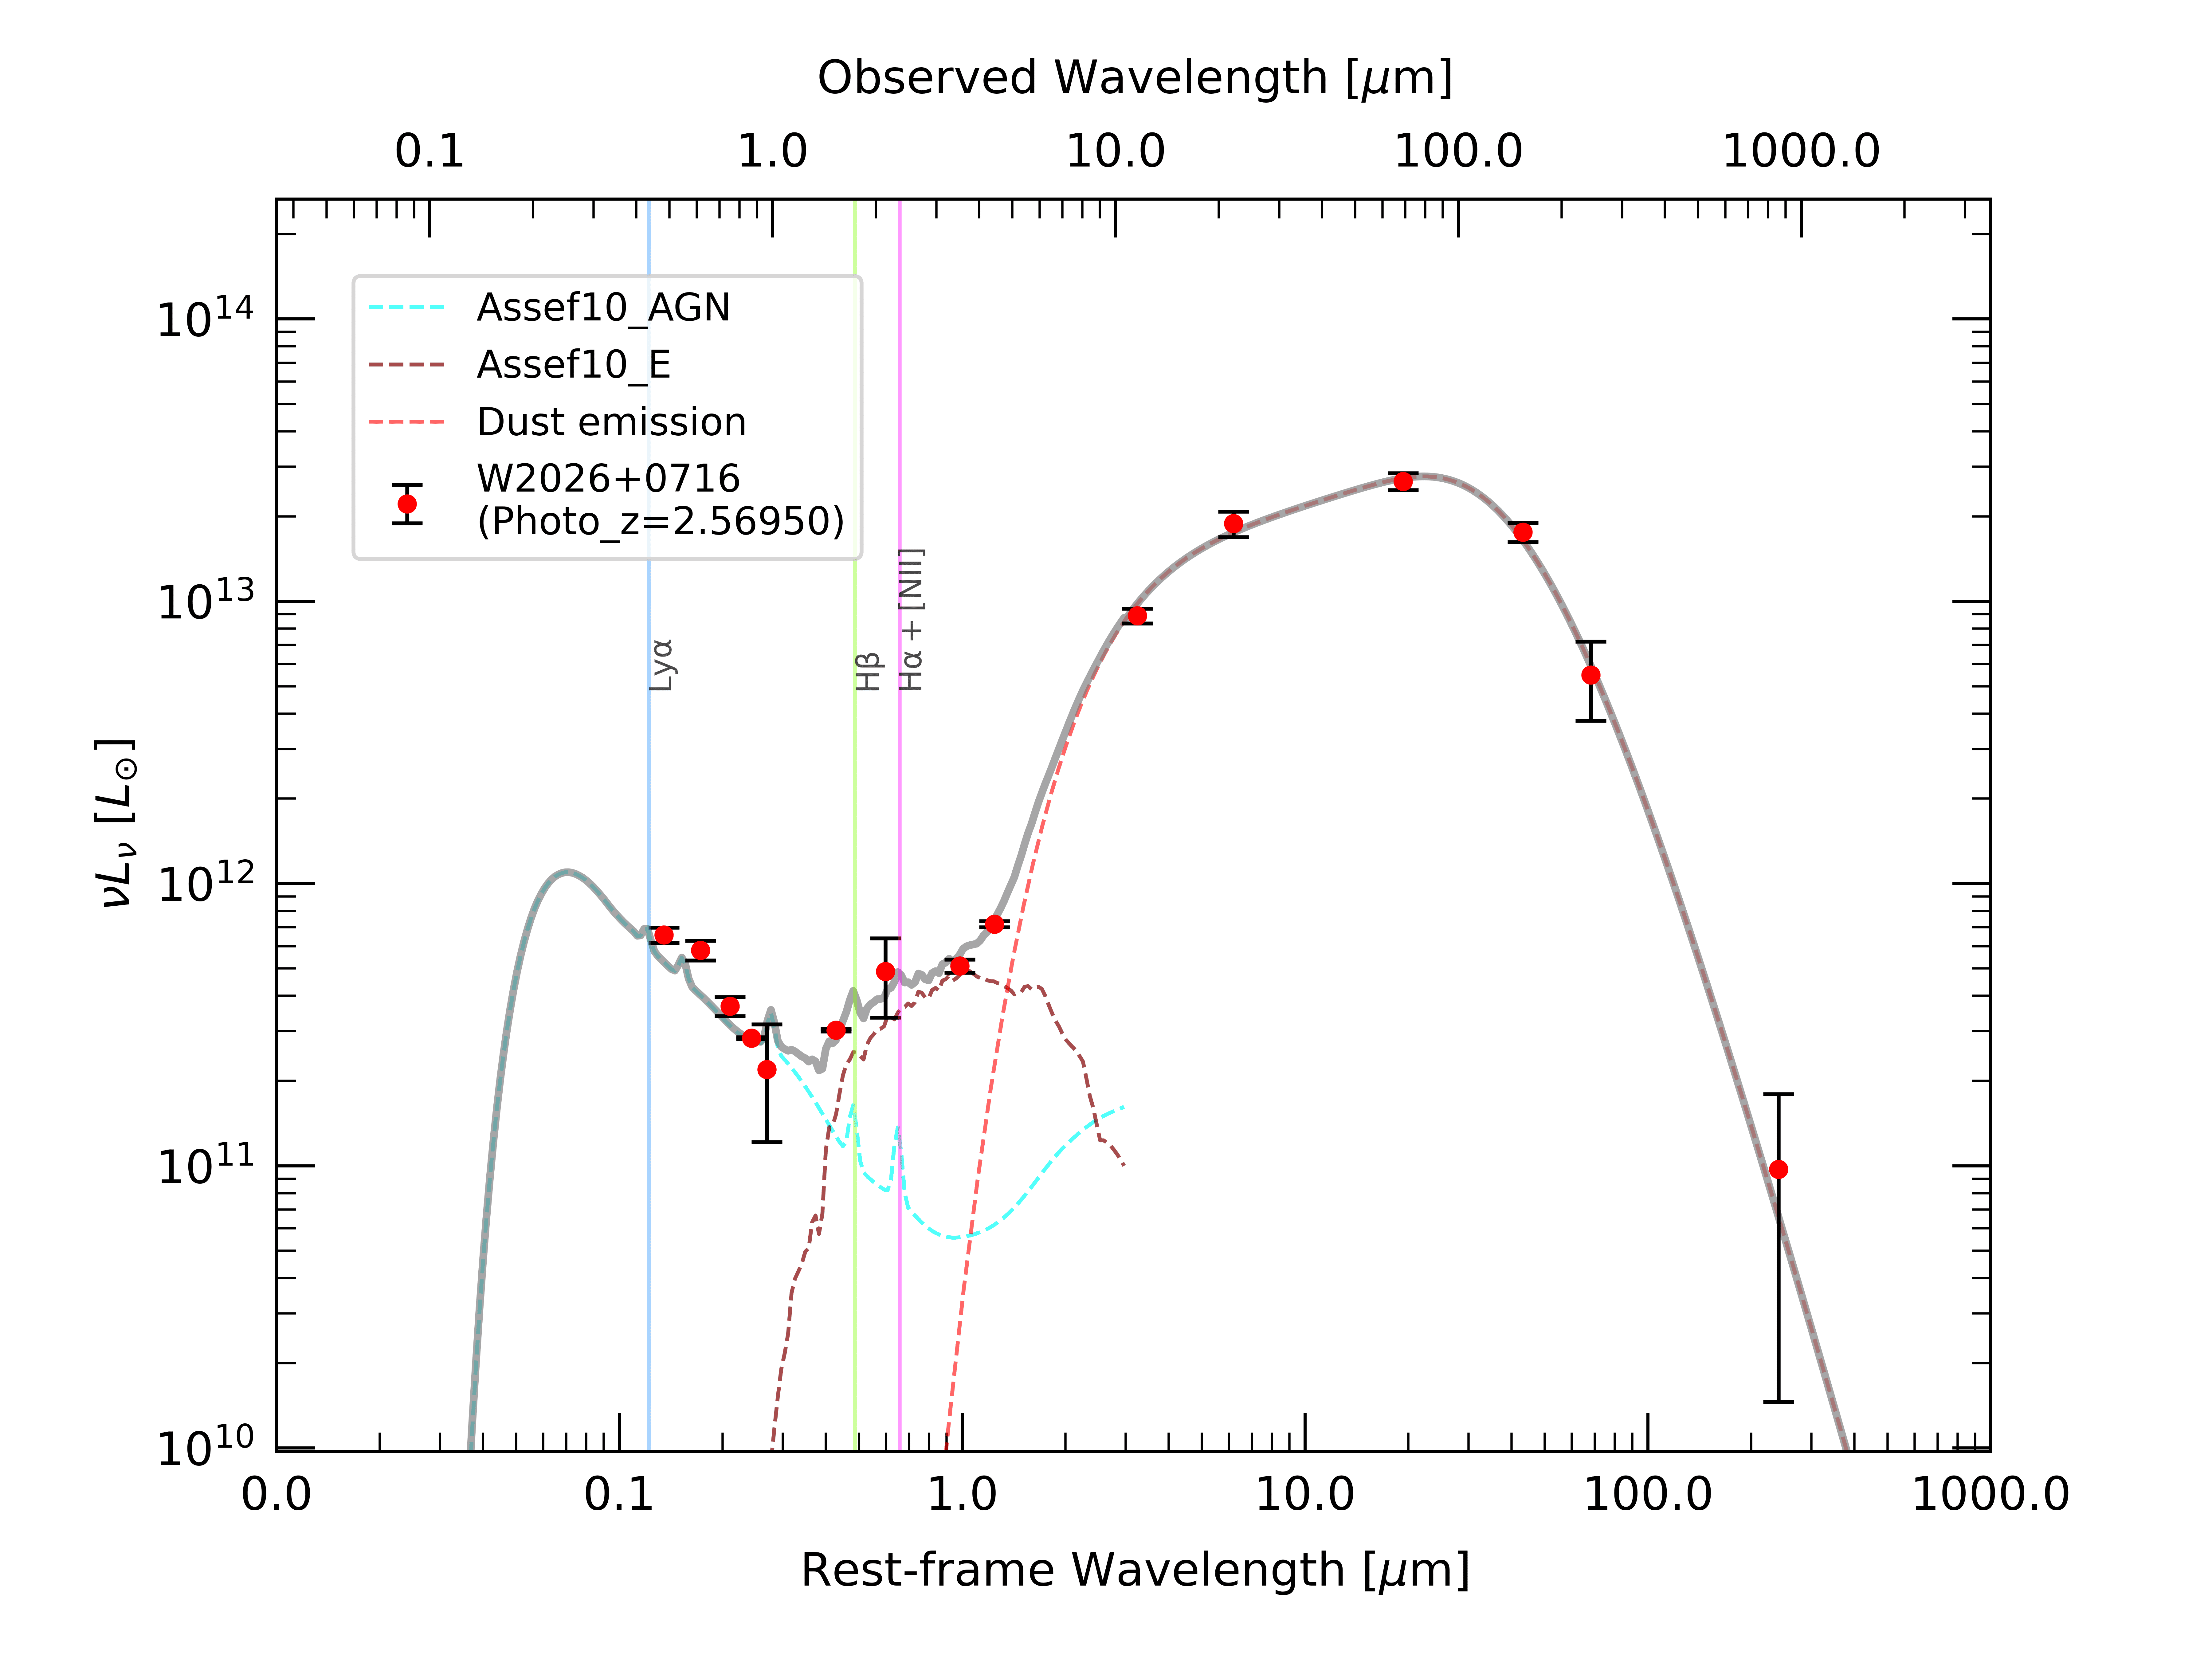
We performed SED fitting of W2026+0716 using photometry from ultraviolet to submillimeter wavelengths. Our dataset 222The HST data used in this paper can be found in MAST: http://dx.doi.org/10.17909/y5pw-cx63 (catalog 10.17909/y5pw-cx63). The data from WISE, Spitzer, and Herschel can be found in IRSA: Wright et al. (2019), SSC And IRSA (2020), and HSA (2021), respectively.encompasses observations from multiple facilities including SDSS, Pan-STARRS1, HST, Hale 200 inch, Spitzer IRAC, WISE, Herschel PACS and SPIRE, as well as JCMT SCUBA-2, see Table 1.
The UV-to-MIR SED modeling was conducted following the methodology developed by Assef et al. (2010, 2016). As shown in Figure 1, for the short-wavelength regime () in the rest frame, we employed a linear combination of three templates: one AGN template with variable extinction and two galaxy templates representing stellar populations of different ages. This approach enabled us to simultaneously account for contributions from both AGN and stellar radiation. For the long-wavelength regime (), we implemented a single power-law (SPL) dust distribution model to capture the thermal radiation from the dust-obscured AGN (Tsai et al. in prep). The fitting procedure utilized a Markov Chain Monte Carlo (MCMC) method with five free parameters, including the amplitudes of individual templates, AGN extinction level, and the power-law index of the SPL model.
Based on our best-fit model, we derived several key physical properties of W20260716. The object exhibits a total luminosity of , indicating an extremely luminous source. The model reveals substantial hot dust content with an estimated total mass of . Analysis of the stellar component suggests a star formation rate of and a median stellar mass of . We note that our analysis reveals significant excess blue emission in the optical bands, likely originating from scattered AGN light. This characteristic qualifies W20260716 as a “Blue Hot DOG” (BHD), suggesting that a portion of the central AGN radiation scatters off the obscuring dust layer. As a result, the stellar mass and star formation rate estimates from the SED modeling might be affected by the leaked AGN emission.
| Band | Wavelengtha | Flux | Ref.b |
|---|---|---|---|
| (m) | (Jy) | ||
| PS1.g | 0.48 | 5.2 ±0.5 | C16;F20 |
| PS1.r | 0.62 | 6.5 ±0.7 | … |
| PS1.i | 0.75 | 5.5 ±0.5 | … |
| PS1.z | 0.87 | 5.1 ±0.1 | … |
| PS1.y | 0.96 | 4.5 ±2.3 | … |
| HST.WFC3.F160W | 1.53 | 10.5 ±0.1 | L25 |
| Hale 200 inch.WIRC | 2.13 | 24.2 ±7.8 | A15 |
| Spitzer.IRAC.I1 | 3.54 | 42.5 ±2.3 | G12 |
| Spitzer.IRAC.I2 | 4.44 | 75.9 ±1.9 | … |
| WISE.W3 | 11.56 | 2.5 ±0.2 ×10^3 | W10;C13 |
| WISE.W4 | 22.09 | 10.0 ±1.0 ×10^3 | … |
| Herschel.PACS.blue | 68.92 | 44.0 ±3.0 ×10^3 | T25 |
| Herschel.PACS.red | 154 | 65 ±5 ×10^3 | … |
| Herschel.SPIRE.PSW | 243 | 32 ±10 ×10^3 | … |
| JCMT.SCUBA2.850 | 858 | ¡ 5.1 ×10^3 | J14 |
Note. — a Effective wavelength, adopted from SVO Filter Profile Service (Rodrigo et al., 2012; Rodrigo & Solano, 2020). b The reference code: A15: Assef et al. (2015); C13: Cutri et al. (2021); C16: Chambers et al. (2016); F14: Jones et al. (2014); F20: Flewelling et al. (2020); G12: Griffith et al. (2012); L25: This work, using basic aperture photometry.; T25: Tsai et al. in prep.; W10: Wright et al. (2010).
3.2 Spectrum Fitting
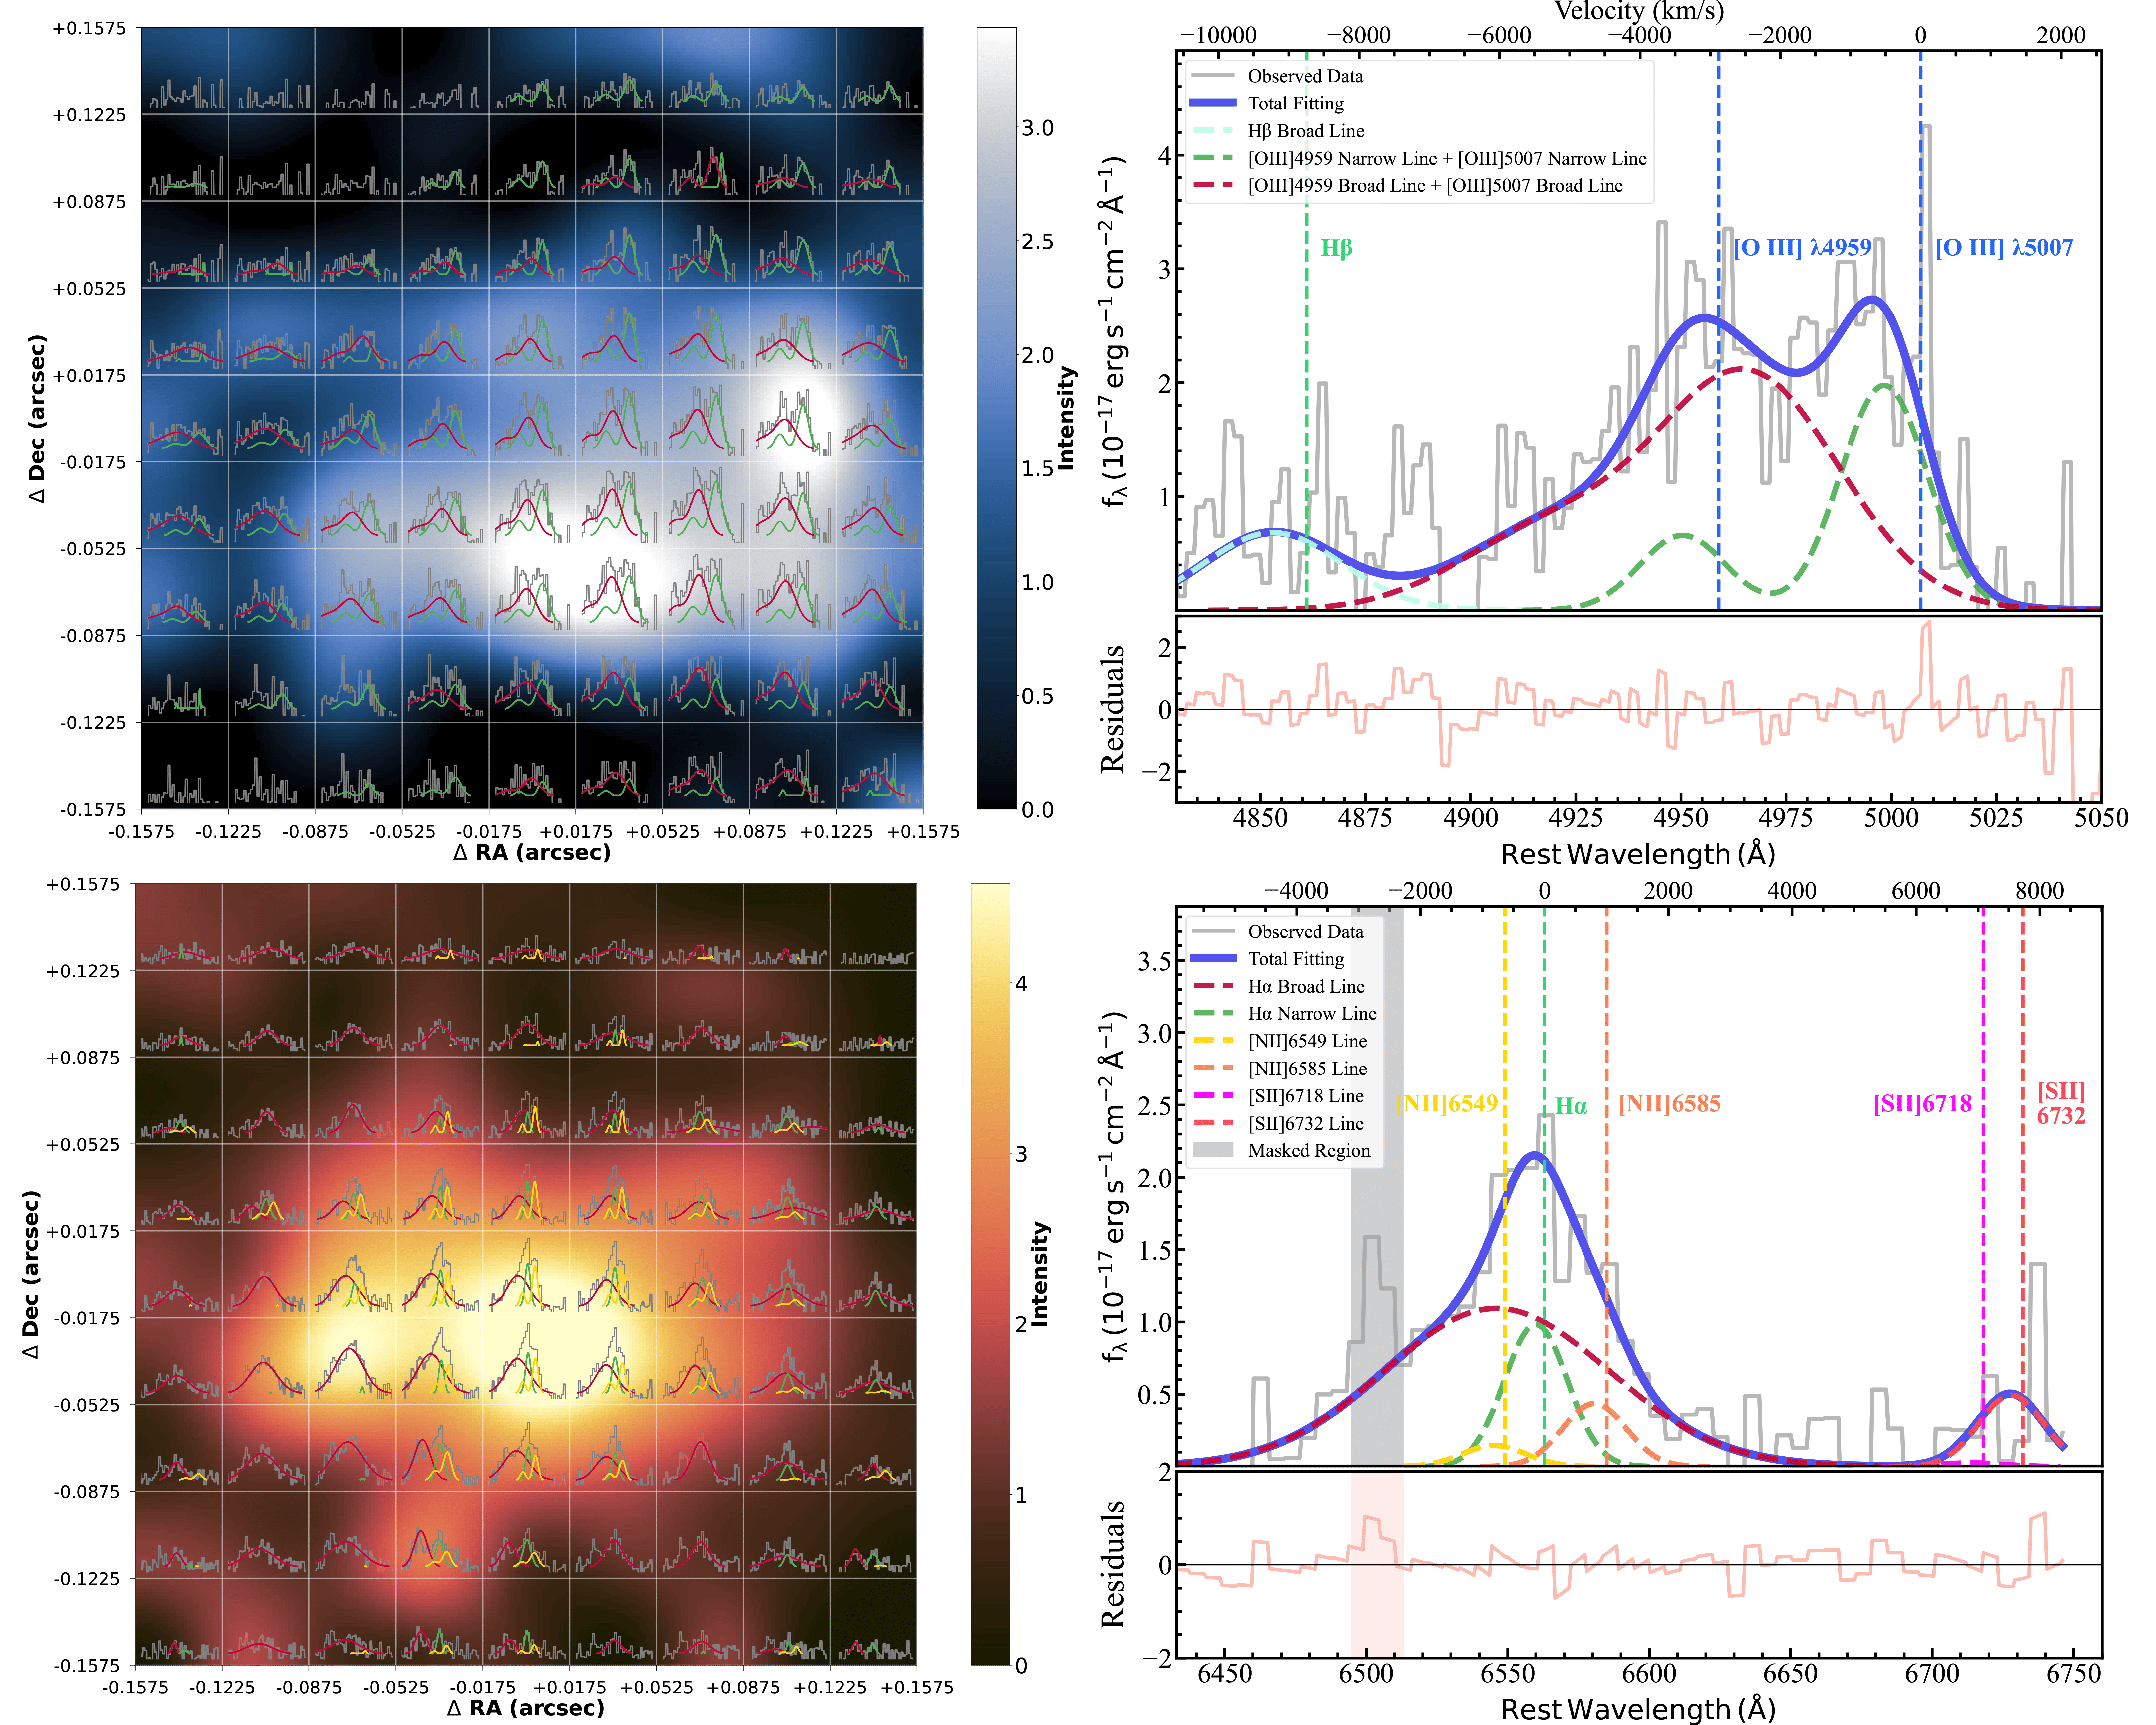
We modeled the emission lines with a combination of narrow and broad components using PyQSOfit (Guo et al., 2018; Shen et al., 2019), where the narrow component represents Gaussian at the systemic velocity with a dispersion km s-1and the broad component characterizes the high-velocity outflow with a larger dispersion. [O iii]4959Å, [O iii]5007Å, and H include both broad and narrow components. For other weaker emission lines, we employed a single Gaussian component for only the narrow component. All the spectroscopic data are corrected for Galactic extinction before multi-Gaussian modeling.
For all emission lines within the same spectral band, components originating from the same physical region share fixed line centers and full width at half maximum. Additionally, for doublet lines, their relative flux ratios are constrained during the spectral fitting process. The intensity ratio of [O iii] and [N ii] doublets was fixed at (according to Storey & Zeippen, 2000). However, the [S ii] doublet ratio was not fixed because of its dependence on the electron density of the ionized gas (Sanders et al., 2016). Given the source’s weak continuum as a typical characteristic of Hot DOGs, we performed a simple linear fit for the continuum spectrum to prevent the overfitting issues.
For individual spaxel fitting, the spectral data for each pixel were convolved with a Gaussian kernel of an FWHM of 2.5 pixels over a pixel window. The combined effect of the PSF and Gaussian smoothing yielded an actual spatial resolution of 0139, which corresponds to a spatial scale of 1.14 kpc. Additionally, we employed PyQSOFit with an “nsmooth” value of 8 to mitigate the fitting instability. Figure 2 represents the results of the spectral fitting on the H and [O iii] lines.
4 Results
4.1 Kinematics Maps
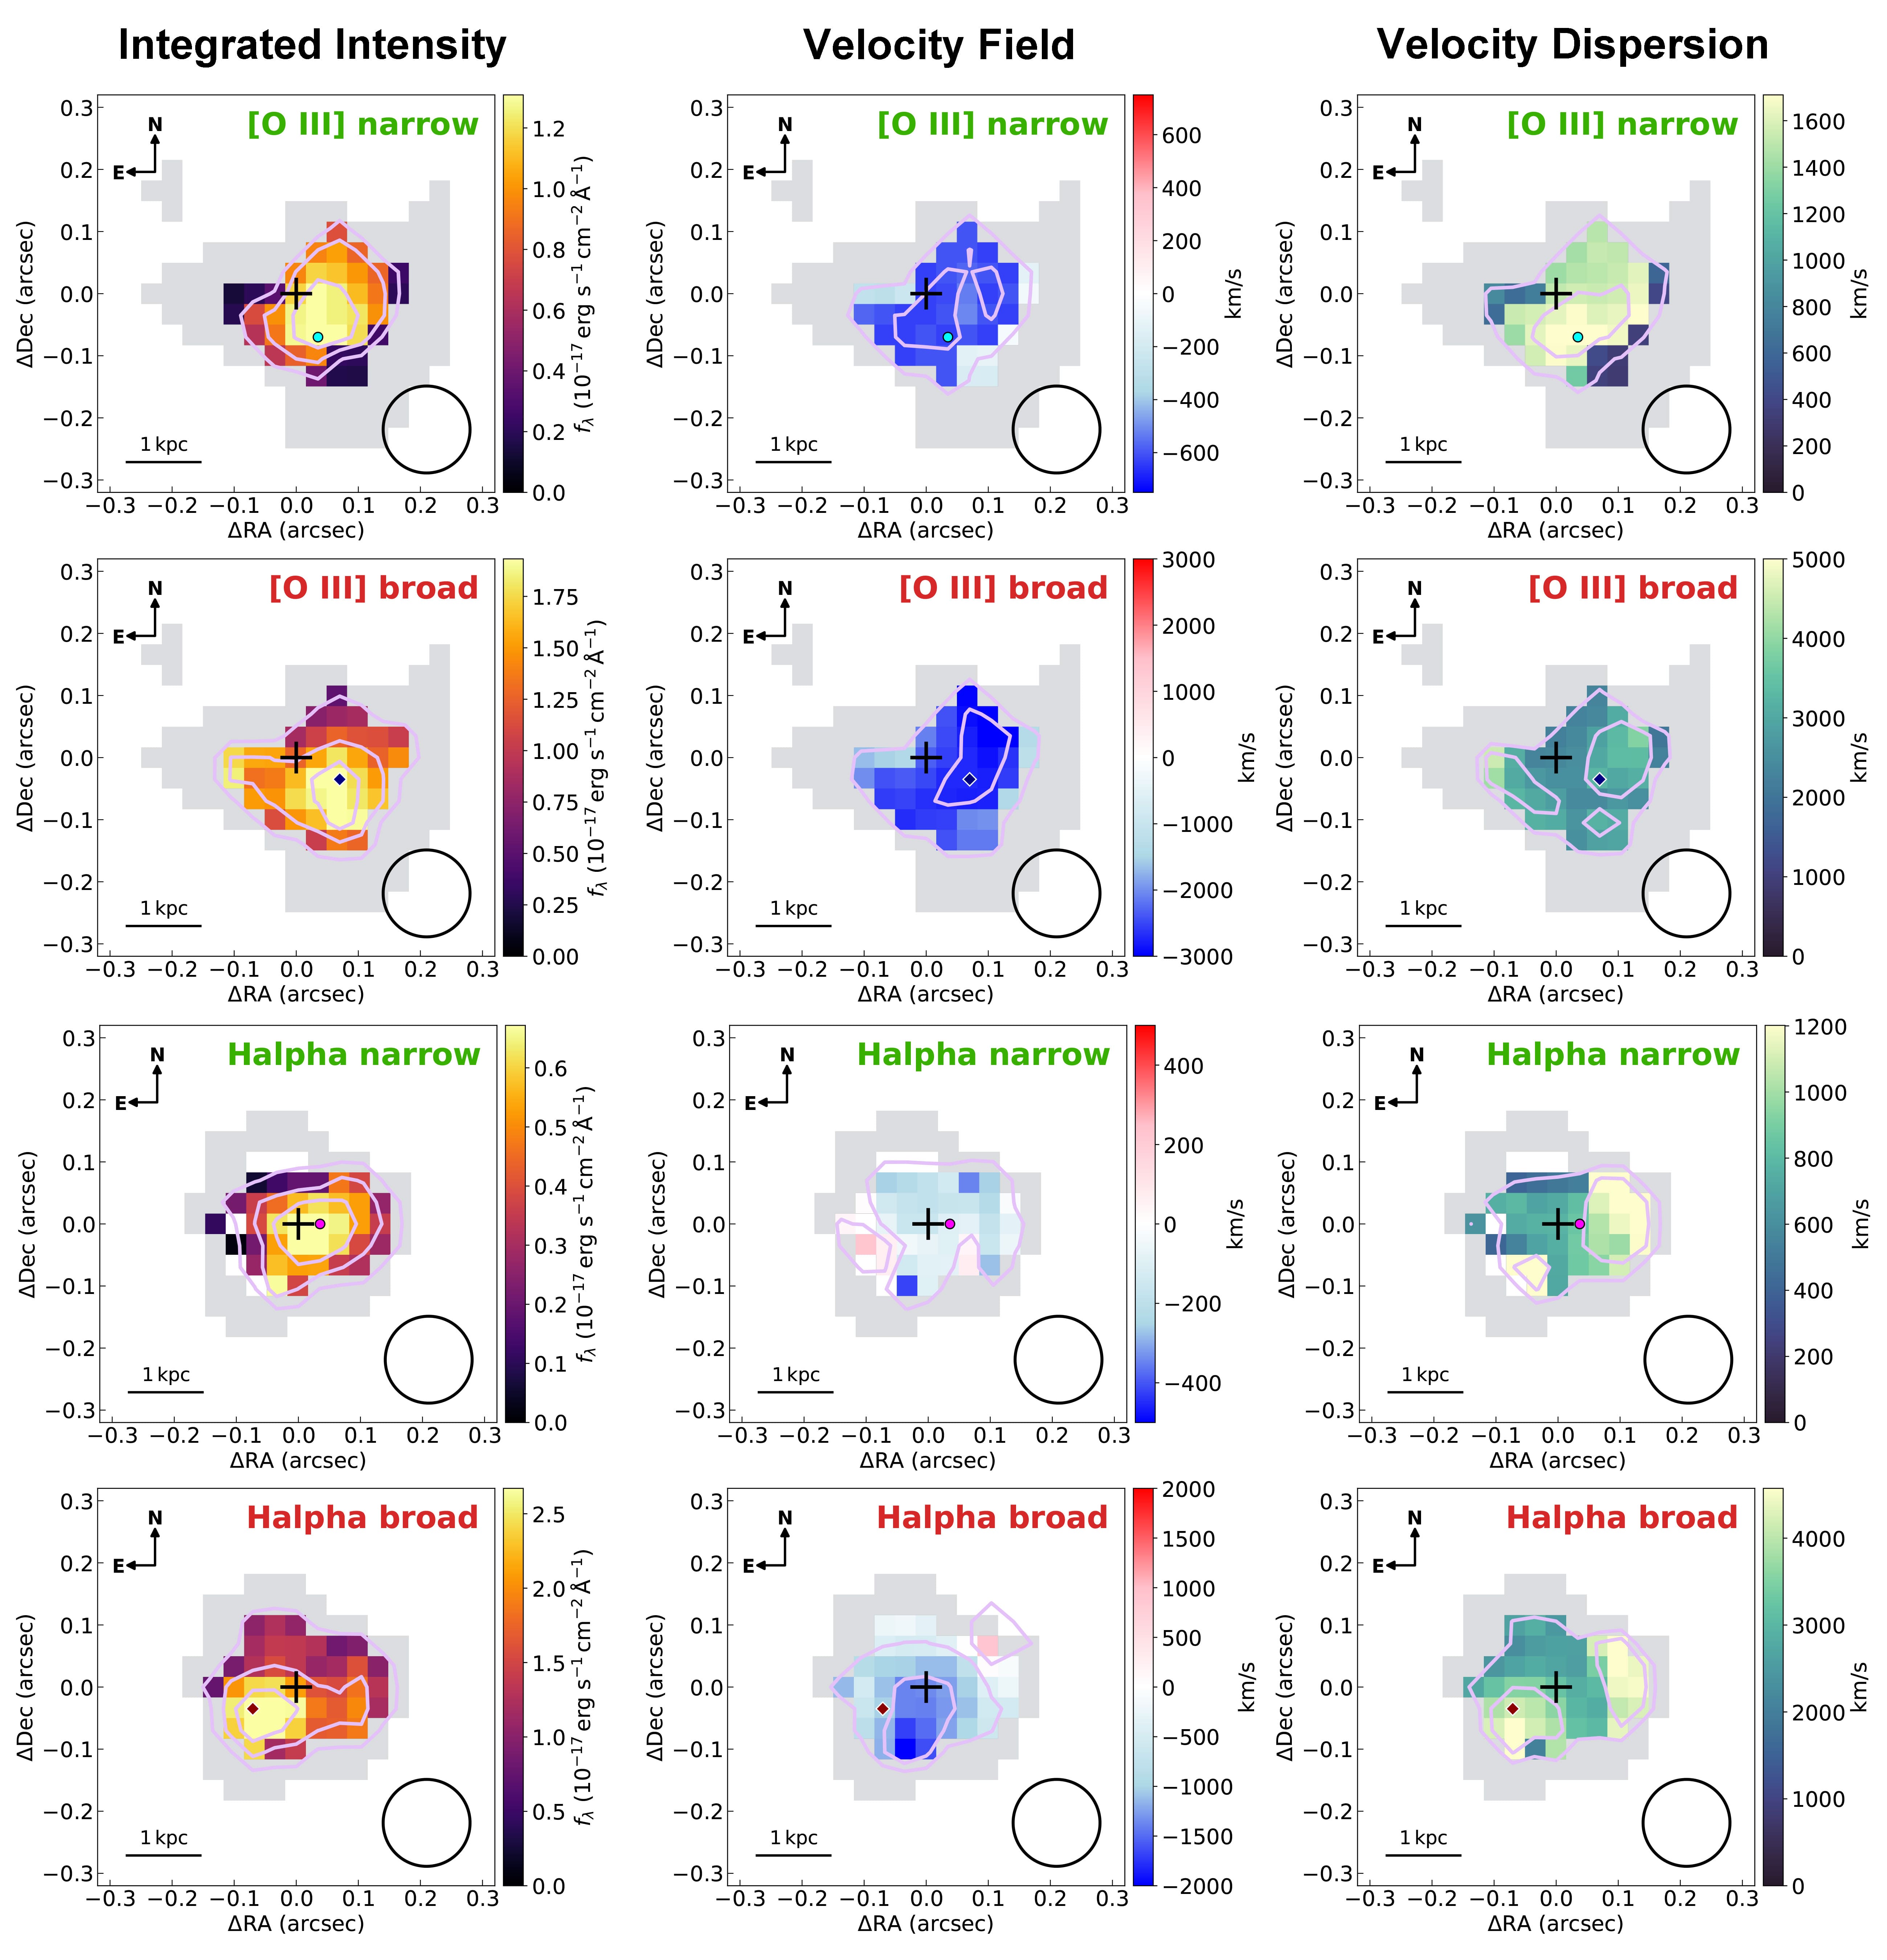
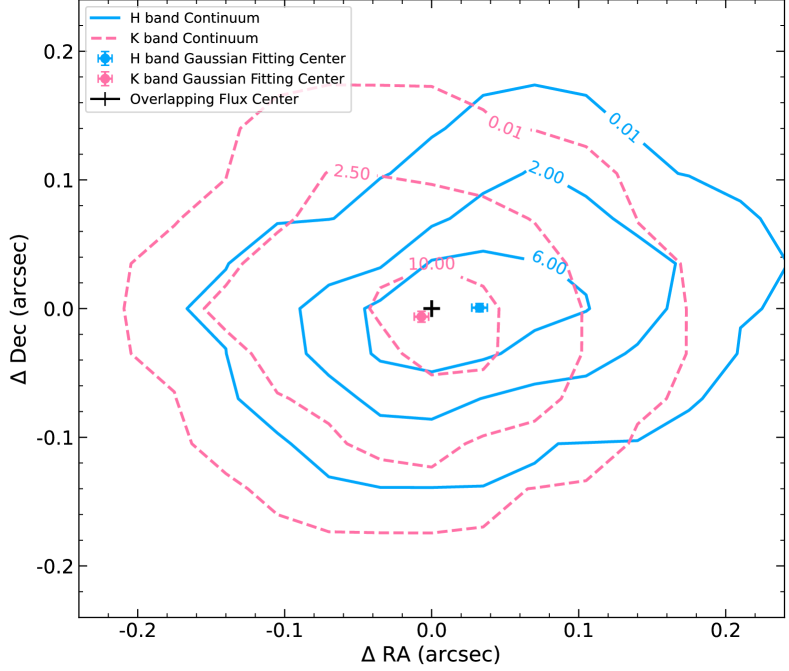
We spatially aligned the [O iii] and H datacubes using continuum emission from the band and bands (as shown in Figure 3). A 2-D Gaussian fit to the continuum contours in both bands yielded FWHMs of (major axis) and (minor axis) in the band, and (major axis) and (minor axis) in the band. The estimated spatial alignment uncertainty between [O iii] and H maps is . With the datacubes properly aligned, we compiled the spectral fitting results for each pixel into maps, allowing us to examine the spatial distribution of various spectral line components. We constructed the spatial distribution of flux intensity, velocity offset, and velocity dispersion of the [O iii] and H lines in Figure 4, to study the kinematics of the ionized gas in W20260716.
Examining the flux intensity maps, we find that the narrow components of both emission lines are concentrated near the AGN (marked with black cross in the Figure 4) with slight offsets. The broad components, representing outflows, show more pronounced spatial offsets from the continuum peak, which is presumably the location of the obscured AGN and the assumed galaxy center. These significant offsets exceed half a size of resolution element and the spatial alignment uncertainty of . The flux peaks of both [O iii] and H outflows are offset with respect to the galaxy center by similar amounts but in quite different directions. The peak of [O iii] outflow’s flux is offset 008 to the southwest from the continuum emission peak, while the H outflow’s flux peak is offset 008 toward the southeast.
Furthermore, the extent of [O iii] and H diffuse gas regions also shows a discrepancy. The spatially [O iii] diffuse gas exhibits a more extensive region, which is shown in gray in Figure 4, and exhibits less gas emission in the southeast where the H outflow emission dominates.
The velocity fields of the narrow and broad components for both [O iii] and H emission lines show overall blueshifted velocities without significant gradients. The narrow component of H exhibits blueshifted velocities mostly within 400 km s-1, with some regions showing slight redshift. The [O iii] narrow component shows slightly higher blueshifted velocities, mostly within 600 km s-1. For the broad components, the H outflow has an overall blueshift exceeding 500 km s-1, with a peak blueshifted velocity over 1200 km s-1in the southeast, corresponding to its flux peak. The [O iii] outflow shows even higher overall blueshifted velocities exceeding 1000 km s-1, with a peak of over 2600 km s-1in the southwest, aligning with its flux center. Notably, the H outflow exhibits weak blueshift or even redshift in the northwest at a 01 offset from the continuum peak, though the redshifted outflow is detected in only two pixels. These features may relate to irregularity in the 2-D structure observed in the velocity dispersion map. The high blueshifted velocities of broad components of both lines coupled with their spatially corresponding high dispersion regions, provide strong evidence for outflows.
The velocity dispersion maps of the [O iii] and H broad components reveal intriguing kinematic features. The broad-line components of both [O iii] and H exhibit velocity dispersions exceeding 1500 km s-1, which suggests significant turbulence within the ionized gas outflows of W20260716. Broad components of both lines display two high-velocity dispersion regions on the east and west sides of the continuum emission peak. However, the widths of [O iii] broad components in the high dispersion regions exceed 2700 km s-1, while those of the H broad components surpass 3500 km s-1 in the corresponding positions.
Such broad line widths could result from the superposition of different velocity components along the line of sight or from turbulent regions created by outflow interactions with the surrounding interstellar medium. Either scenario implies the presence of multi-velocity component regions in the ionized gas, which is consistently observed in emission lines from two observed wavebands of W20260716 system. Combining these findings with our analysis of flux intensity and velocity offset distributions, they suggest the presence of high-velocity ionized gas outflows in Hot DOG W20260716.
4.2 Dynamics of Outflows
We obtained fundamental kinematic parameters of the ionized gas to calculate the dynamical characteristics of the outflows. These pieces of information allow us to investigate their origins, driving mechanisms, and evolutionary scenarios.
The outflow radius indicates a representative maximum spatial extent of outflow, which is crucial for calculating other dynamical parameters. In previous studies, the outflow radius for Hot DOGs was often assumed to be 3 kpc (Finnerty et al., 2020; Jun et al., 2020; Martin et al., 2024), which serves as a conservative estimate. We instead estimate a spatially resolved outflow radius utilizing the LGS-AO guided OSIRIS observations. However, the overall blueshifted outflows indicate a projection of these outflows along our line of sight. While existing information is insufficient to determine the exact projection angle, the overall blueshift in the velocity field indicates that this angle is relatively small. Considering that the outflow axis being exactly aligned with the line of sight is a low-probability event, we adopted a projection angle of (Bae & Woo, 2016). Thus, we applied the following corrections to the outflow radius and velocity using :
| (1) |
| (2) |
A 30∘ inclination angle may be a conservative estimate, with the actual angle potentially larger or smaller. This inclination angle typically does not exceed 45∘, or the redshifted outflow would likely be observed. If the outer opening angle of the outflow lies between 30∘ and 45∘, we may overestimate the outflow radius and underestimate its velocity. As a result, the observed outflow could be distributed more confined in a smaller region with higher velocity. This compact, high-velocity outflow could represent a younger outflow in an early formation phase. On the other hand, if the opening angle is between 0∘ and 30∘, the outflow could be denser and in a more mature stage, possibly interacting with the interstellar medium (ISM).
In the kinematic maps (Figure 4), the correspondence between the outflow’s flux peaks and its high-velocity dispersion region allows us to distinguish the outflow radius in the plane of the sky. Despite the a spatial offset of size of resolution element between the two, the displacement of flux centroids used to determine the outflow radius is a relatively conservative and reliable measurement. Therefore, we consider the offset from the galactic center of this region as the outflow radius. After deprojection correction, the outflow radius is estimated as , which corresponds to 1.2 kpc for W20260716.
| Parameters | Meaning | [O iii] Outflow | H Outflow | Unit |
|---|---|---|---|---|
| Outflow Luminosity | erg s-1 | |||
| Observed Velocity of Outflow | km s-1 | |||
| Projection Corrected Velocity of Outflow | km s-1 | |||
| Velocity Dispersion of Outflow | km s-1 | |||
| Radius of Outflow | kpc | |||
| Mass of Outflows | ||||
| Mass Outflow Rate | /yr |
Note. — Dynamical parameters for the [O iii] and H outflows in the Hot DOG W20260716. The electron density () is assumed to be 500 cm-3 for both outflows in the calculations. See Section 4.2 for details.
Electron density constitutes a crucial parameter in determining outflow masses. The [S ii] emission doublet, widely recognized for its electron density sensitivity (Sanders et al., 2016), serves as the standard diagnostic. However, in our observations of W2026+0716, the [S ii] doublet was only marginally detected, permitting single-component Gaussian fitting and precluding robust electron density measurements. Therefore, we adopted an assumption-based approach to estimate the electron density.
AGN-driven outflows typically exhibit electron densities in the range cm-3 (Greene et al., 2011; Harrison et al., 2014; Karouzos et al., 2016). Previous studies of Hot DOG outflows adopted cm-3 based on an assumed characteristic radius of 3 kpc (Finnerty et al., 2020; Jun et al., 2020). For W2026+0716, however, the measured outflow radius of 1.2 kpc implies that using cm-3 would overestimate the mass outflow rate due to the scaling dependence in mass calculations. We therefore conservatively assume cm-3 to mitigate potential overestimation of feedback effects.
The outflow masses are calculated following the formalism of Carniani et al. (2015) and Santoro et al. (2020),
| (3) |
and
| (4) |
We find the outflow masses reach and for [O iii] and H outflows respectively.
Assuming a biconical structure for the outflow (e.g., Maiolino et al., 2012), we estimate its mass outflow rate, energy outflow rate, and momentum outflow rate based on the outflow mass , velocity, and radius as follows:
| (5) |
| (6) |
| (7) |
Under the same electron density assumption and outflow radius conditions discussed previously, the derived properties of [O iii] and H outflows are listed in Table 2. In comparison with the AGN bolometric luminosity obtained from the SED analysis, we find that the energy coupling efficiency of the [O iii] line is 1%, similar to the results presented by Jun et al. (2020). The observed outflow momentum substantially exceeds the expected momentum deposition rate ( dyne, Vayner et al., 2021) derived from the star formation rate of 130 /yr, providing evidence for AGN-driven outflow. We note that for the H line, although its energy coupling efficiency is similar to that of [O iii], the measurement of this value is associated with significant uncertainties.
Assuming the outflow radius of 1.2 kpc as we discussed previously, the outflow timescale needed for the outflow gas launched from the center of the host galaxy to its current observed position is 0.4-0.5 Myr for both [O iii] and H emitting gas. This timescale is a few times higher than the timescale based on the observed outflow mass to reach its mass outflow rate. However, we note that the outflow masses derived from the observed line luminosities are not corrected with the possible extinction, especially for the undetected outflow on the red and far side. If we take the extinction into account, the outflow timescales based on the physical extension and the mass are both a few yr. This is similar to the outflow timescale estimated for luminous obscured AGN in Jun et al. (2021), but it is shorter than the estimated timescale from radiation pressure. This suggests that radiation-driven outflows may be a possibility for multiple episodes of activity. For a more detailed discussion, see Section 5.3.
4.3 BPT Diagram
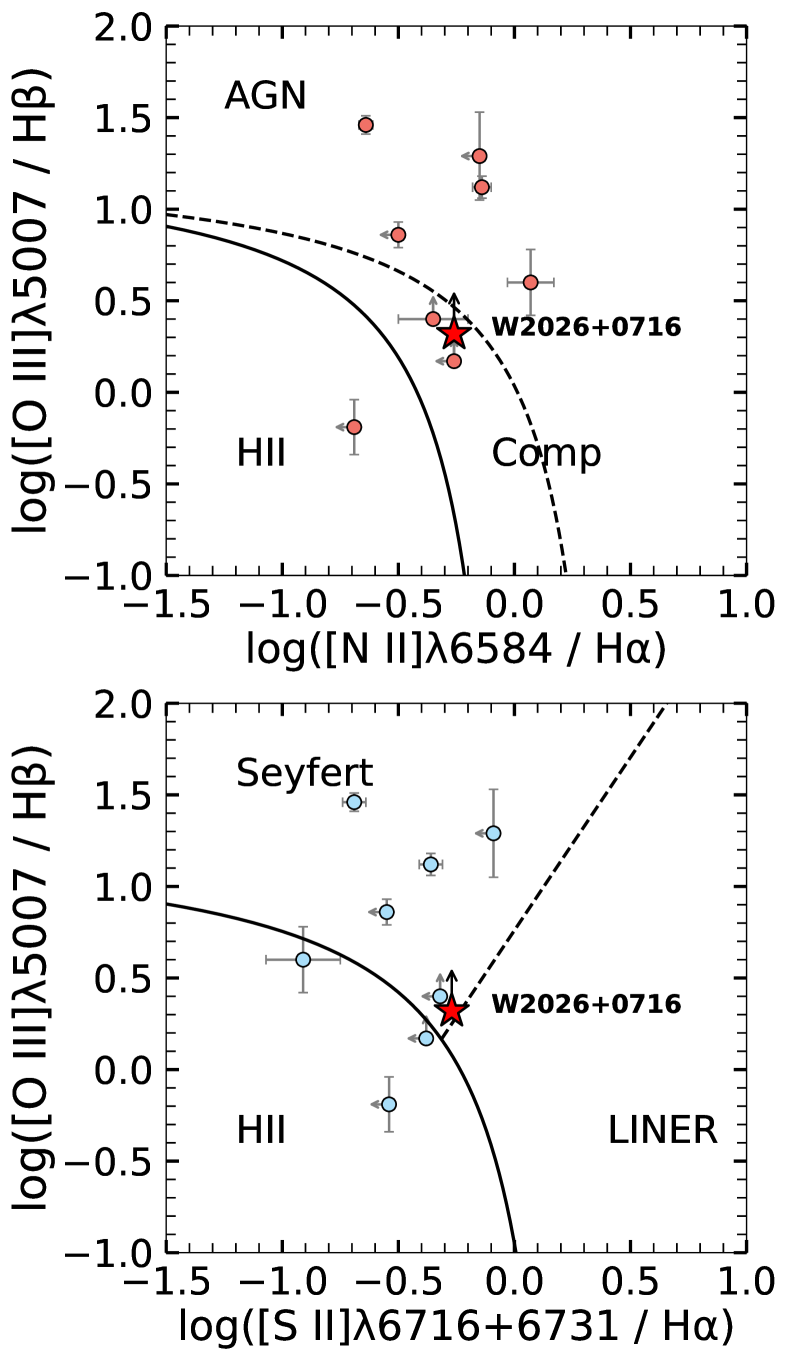
Based on the narrow components in the spatially integrated spectrum, out target source is located in the “composite” region (Kauffmann et al., 2003; Kewley et al., 2013) of the [N ii]/H-vs-[O iii]/H version (see Figure 5) of the BPT diagram (Baldwin et al., 1981), suggesting the possible coexistence of AGN activity and star formation. In the [S ii]/H-vs-[O iii]/H plot, W20260716 is positioned near the boundary between the Seyfert and LINER regions (Kewley et al., 2006), further supporting the interpretation of composite nature and indicating the presence of both high- and low-ionization gas. However, since only the broad-line component of H could be measured, the arrow in the diagram represents a lower limit for the [O iii]/H ratio. The actual ratio could be higher, pushing this system further into the AGN region of the BPT diagram.
Compared to other Hot DOGs which range from the AGN to composite regions on the BPT diagram, W20260716 exhibits typical characteristics, which indicates that the Hot DOGs generally have strong AGN activity, possibly accompanied by significant star formation (Assef et al., 2015; D´ıaz-Santos et al., 2021).
5 Discussion
5.1 Blue Hot DOGs
W20260716 exhibits excess AGN radiation in the optical blue and near-ultraviolet regions. The low-extinction AGN component contributes over 50% of the blue luminosity below 1 µm, clearly indicating W20260716 as a Blue Hot DOG. This subpopulation, which may account for 26% of all Hot DOGs (Li et al., 2024), was first identified by Assef et al. (2016, 2020).
Polarimetric observations by Assef et al. (2022) suggest that the blue light in the BHDs originates from the scattering of the central AGN’s light. Among the first three Blue Hot DOGs identified, W01160505 and W02200137 have large-scale ionized gas outflows (Finnerty et al., 2020). In addition, W01160505 also exhibits extent broad CO emission lines (Martin et al., 2024), suggesting an optically thick outflow scattering model. The spatially resolved emission lines found in this study of W20260716 also reveal a strong ionized gas outflow. The complex outflow structure (as discussed in Section 4.1) might be an important feature of the optically thick outflow scattering model for BHDs.
5.2 Multi Dynamical Components in the Biconical Outflows
As discussed in the Section 4.1, the broad components of [O iii] and H emission lines exhibit distinct features in their velocity dispersion maps. Both lines are spatially resolved in different directions in their flux intensity distribution, line-of-sight velocity shifts, and velocity dispersion. High velocity dispersion regions are offset from the peak of the continuum emission, likely resulting from turbulent motions or shocks caused by the interaction between high-velocity outflows and the interstellar medium. These results suggest that the spatial structure of the outflow is not uniformly spherical, but rather possesses a more complex geometric morphology.
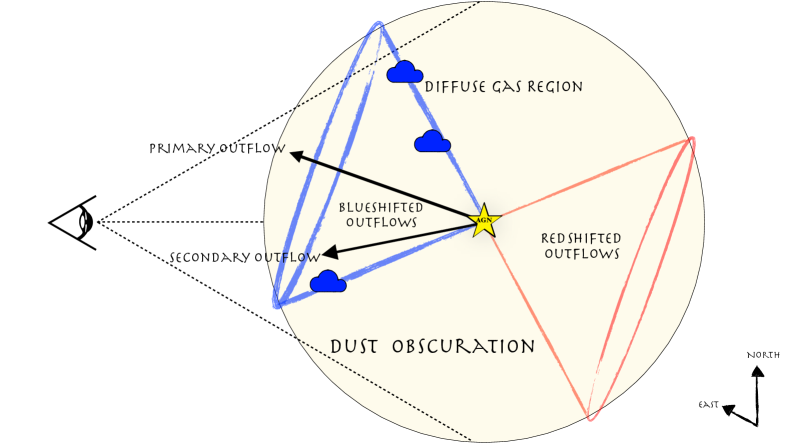
Bipolar outflow models are often adopted to explain large-scale AGN outflow structures (Veilleux et al., 2005; Husemann & Harrison, 2018). For the case of W20260716, we employ an inner-hollow bi-conical outflow model similar to that proposed by Bae & Woo (2016). In our system, the broad H component exhibits an overall blueshift across the entire field of view, with significant line widths and non-uniform spatial flux distribution. These features strongly suggest that the broad H component primarily originates from outflows. We consider the direction between the continuum peak to the center of the outflow flux as the primary outflow direction.
For both [O iii] and H line emission, the observed overall blueshifted velocity field indicates that the outflow is predominantly oriented towards the observer. Because Hot DOGs are a class of highly dust-obscured AGN galaxies, the surrounding dust significantly affects our observational results. Specifically, the redshifted side of the outflow has a longer path length along the line of sight and is thus more heavily obscured by dust. This effect makes it challenging to observe the redshifted portion of the outflows.
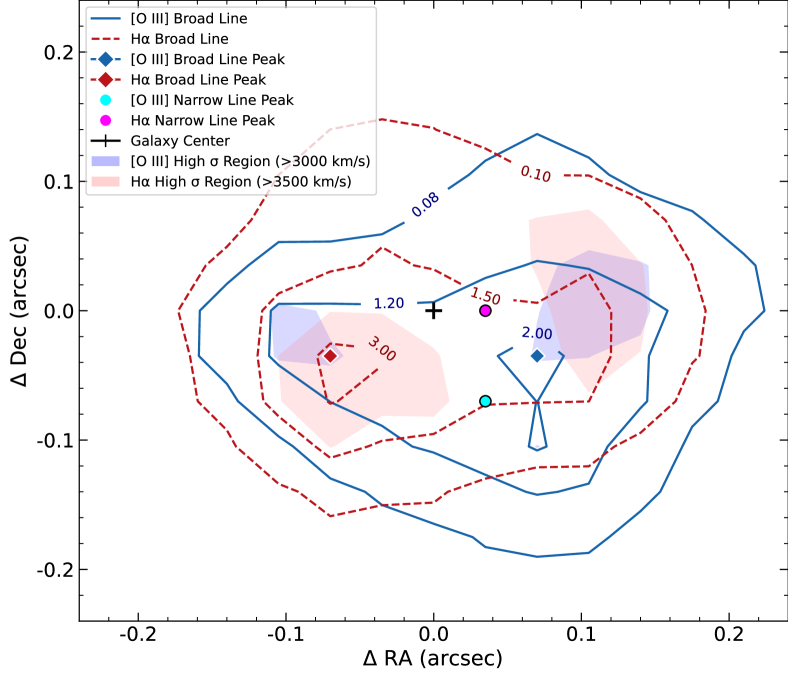
In the kinematics map analysis (Section 4.1), we found the spatial deviation between the outflow centers of [O iii] and H. Figure 6 details the spatial distribution of [O iii] and H. Assuming the AGN is centrally located at the peak of continuum emission, we observe that the H narrow line roughly coincides with the continuum peak within half a size of resolution element. However, the narrow line [O iii] emission deviates from the AGN location by more than half a size of resolution element. This discrepancy may result from non-uniform dust extinction.
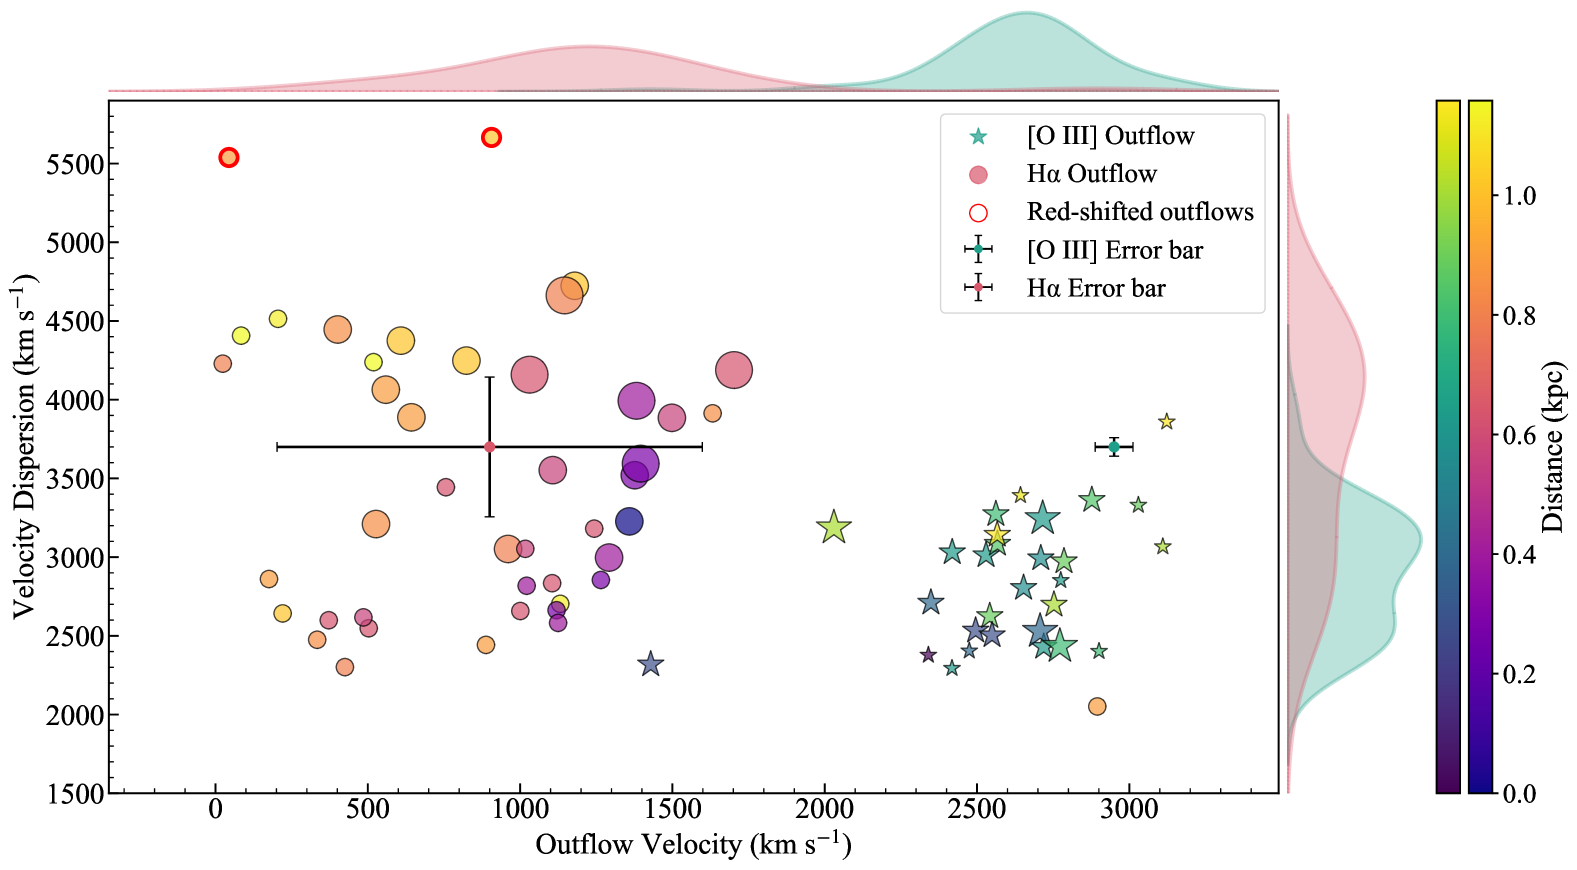
As shown in the velocity-velocity dispersion diagram (Figure 7), the [O iii] outflow exhibits higher blueshifted velocities close to the center, while H shows relatively high velocity dispersion at larger radii. The inconsistency between H and [O iii] outflow characteristics suggests a complex outflow structure in W20260716. Combined with the previously observed flux center asymmetry, this phenomenon leads us to speculate the [O iii] and H outflows may trace different components of the ionized gas outflow. [O iii] and H have different critical densities, with H more likely to exist in relatively cool, dense gas. Based on these observations, we hypothesize that the outflow may have a large opening angle with non-uniform gas density distribution and two primary outflow directions. The primary direction, traced primarily by [O iii], represents the highest velocity component where gas density is relatively low and temperature is higher, favoring [O iii] excitation. To verify this hypothesis, higher resolution observations are needed to reveal the spatial distribution of electron density.
As illustrated in Figure 8, our proposed outflow model comprises two main components. The inner arrows represent the core of the outflow, demonstrating its primary direction and concentrated flux stream. Based on our assumption, the angle between the core outflow direction and the line of sight is . The outer cone region represents slower velocity outflows or diffuse ionized gas.
5.3 Role of Outflow in Obscured AGN Evolution
The outflows of two ionized gases display comparable dynamical characteristics. Both [O iii] and H outflows carry the kinetic energy outflow rates of 1.6–1.7 erg s-1 and momentum outflow rates of 1.0–1.4 dyn. With their similar inferred energy coupling efficiencies and momentum boost factor (Costa et al., 2014) , these two ionized gas outflows yet exhibit noticeable differences in the spatial distributions of their morphology and kinematics. This discrepancy may indicate that the [O iii] and H emission lines trace distinct components of ionized outflows driven by a common physical mechanism, rather than by separate processes (e.g., AGN and starburst activities in Xu & Wang, 2022). This suggests that multiple kinematically distinct ionized outflow components may coexist in this system. Previous studies have primarily focused on multiphase outflows involving ionized, neutral, or molecular gas (e.g., Fluetsch et al., 2021), whereas this work provides the potential first evidence of kinematic differentiation within the ionized outflow itself. The observed differentiation might result from varying electron densities in high- and low-speed outflows. This finding suggests that the outflow structure at this evolutionary stage may be more complex than previously thought. Such a phenomenon could be associated with outflow fragmentation or differential acceleration, where ionized gas components with different physical properties have not yet fully mixed. However, given the limitations of our data in terms of signal-to-noise ratio, as well as potential contamination from BLR scattered light and dust extinction, our results provide only preliminary evidence for this scenario. Further observations with higher spatial and spectral resolution are required to confirm this phenomenon and to gain a deeper understanding of its implications for AGN feedback.
Li et al. (2024) based on number density comparisons and Type 1 AGN lifetimes, estimate the lifespan of Blue Hot DOGs to be approximately 0.5 Myr and that of ordinary Hot DOGs to be about 1.5 Myr. These timescales are comparable to the calculated outflow timescale (see discussions in Section 4.2). This implies that outflows likely persist throughout the Hot DOGs phase, which is potential evidence for the widespread presence of outflows during Hot DOGs stage. The kinematic timescales of the [O iii] and H outflows are similar, suggesting that they may originate from the same epoch. Therefore, detecting multi-component outflows and assessing the long-term evolution of outflow kinematics will provide crucial information about the transitional phase between obscured and unobscured AGN systems.
6 Conclusion
We conducted narrow band and band IFU observations of W20260716 using Keck/OSIRIS. The observational results reveal extremely broad [O iii] and H emission lines. We provided detailed kinematic and dynamical analyses of the broad and narrow components of these lines. Additionally, we performed multi-parameter SED fitting for W20260716. Our analyses have found:
-
1.
W20260716 is identified as a Blue Hot DOG exhibiting strong outflows. Blue Hot DOGs may universally host outflows, which could play a crucial role in cleaning out the dust cocoon around the central accreting supermassive black hole to transit to an unobscured AGN.
-
2.
Kinematic analysis of W20260716 suggests that the bulk outflow has a small inclination angle to the line of sight. The geometric distribution of outflow regions with the high velocity and high dispersion suggest that this outflow is likely a bi-conical structure with some complexity. The extinction of dust surrounding the central region of this Hot DOG hinders the detections of the redshifted outflow on the far side.
-
3.
The [O iii] and H outflows exhibit different spatial distributions and velocity dispersion profiles, likely tracing gas at different densities and ionization states. Consequently, W20260716 may possess a complex multi-component ionized gas outflow structure. The broad H line from the BLR is not clearly detected, possibly affected by the high dust obscuration toward the central AGN.
-
4.
Based on the timescale estimates, both ionized gas outflows have persisted over a few yr within the evolutionary phase of the Hot DOG W20260716. This duration is comparable to the lifetime of Blue Hot DOGs.
The outflow kinematics and geometry of the obscured AGN provide critical clues about the process of how the dust cocoon is revealed. Furthermore, the relative configuration of the outflows and the ISM distribution in the galaxy could also lead to positive or negative AGN feedback to the star formation activities in the host system. The spatially resolved spectroscopic studies for the obscured AGN systems, based on the IFU instrumentations (Keck, VLT, or JWST for intermediate redshift targets, while CSST(Zhan, 2011) for low redshift sources), can better provide a comprehensive picture of the critical transitional phase between the obscured and unobscured AGNs.
Acknowledgments
This material is based upon work supported by the National Natural Science Foundation of China (grant No. 11988101, 11973051). C.-W.T. and M.L. are supported by the International Partnership Program of the Chinese Academy of Sciences, Grant No. 114A11KYSB20210010. RJA was supported by FONDECYT grant number 1231718 and by the ANID BASAL project FB210003. This publication makes use of data obtained at the W.M. Keck Observatory, which is operated as a scientific partnership among Caltech, the University of California and NASA. The Keck Observatory was made possible by the generous financial support of the W.M. Keck Foundation. The authors wish to recognize and acknowledge the very significant cultural role and reverence that the summit of Mauna Kea has always had within the indigenous Hawaiian community. We are most fortunate to have the opportunity to conduct observations from this mountain. This publication makes use of data products from the Wide-field Infrared Survey Explorer, which is a joint project of the University of California, Los Angeles, and the Jet Propulsion Laboratory, California Institute of Technology, funded by the National Aeronautics and Space Administration. This research has made use of the NASA/ IPAC Infrared Science Archive, which is operated by the Jet Propulsion Laboratory, California Institute of Technology, under ontract with the National Aeronautics and Space Administration. All HST, Pan-STARRS1, and Spitzer data referenced in this paper are accessible through the Mikulski Archive for Space Telescopes (MAST) at DOI: 10.17909/y5pw-cx63, while AllWISE data can be accessed through IPAC via DOI: 10.26131/IRSA1.
Keck:I (OSIRIS); Spitzer Space Telescope; Herschel Space Telescope; Hubble Space Telescope; Wide-field Infrared Survey Explorer; JCMT
References
- Assef et al. (2010) Assef, R. J., Kochanek, C. S., Brodwin, M., et al. 2010, ApJ, 713, 970, doi: 10.1088/0004-637X/713/2/970
- Assef et al. (2015) Assef, R. J., Eisenhardt, P. R. M., Stern, D., et al. 2015, ApJ, 804, 27, doi: 10.1088/0004-637X/804/1/27
- Assef et al. (2016) Assef, R. J., Walton, D. J., Brightman, M., et al. 2016, ApJ, 819, 111, doi: 10.3847/0004-637X/819/2/111
- Assef et al. (2020) Assef, R. J., Brightman, M., Walton, D. J., et al. 2020, ApJ, 897, 112, doi: 10.3847/1538-4357/ab9814
- Assef et al. (2022) Assef, R. J., Bauer, F. E., Blain, A. W., et al. 2022, ApJ, 934, 101, doi: 10.3847/1538-4357/ac77fc
- Bae & Woo (2016) Bae, H.-J., & Woo, J.-H. 2016, ApJ, 828, 97, doi: 10.3847/0004-637X/828/2/97
- Baldwin et al. (1981) Baldwin, J. A., Phillips, M. M., & Terlevich, R. 1981, PASP, 93, 5, doi: 10.1086/130766
- Blain (2003) Blain, A. W. 2003, in Astronomical Society of the Pacific Conference Series, Vol. 289, The Proceedings of the IAU 8th Asian-Pacific Regional Meeting, Volume 1, ed. S. Ikeuchi, J. Hearnshaw, & T. Hanawa, 247–250, doi: 10.48550/arXiv.astro-ph/0302184
- Bussmann et al. (2009) Bussmann, R. S., Dey, A., Lotz, J., et al. 2009, ApJ, 693, 750, doi: 10.1088/0004-637X/693/1/750
- Calistro Rivera et al. (2021) Calistro Rivera, G., Alexander, D. M., Rosario, D. J., et al. 2021, A&A, 649, A102, doi: 10.1051/0004-6361/202040214
- Canalizo & Stockton (2001) Canalizo, G., & Stockton, A. 2001, ApJ, 555, 719, doi: 10.1086/321520
- Carniani et al. (2015) Carniani, S., Marconi, A., Maiolino, R., et al. 2015, A&A, 580, A102, doi: 10.1051/0004-6361/201526557
- Casey et al. (2014) Casey, C. M., Narayanan, D., & Cooray, A. 2014, Phys. Rep., 541, 45, doi: 10.1016/j.physrep.2014.02.009
- Chambers et al. (2016) Chambers, K. C., Magnier, E. A., Metcalfe, N., et al. 2016, arXiv e-prints, arXiv:1612.05560, doi: 10.48550/arXiv.1612.05560
- Cicone et al. (2018) Cicone, C., Brusa, M., Ramos Almeida, C., et al. 2018, Nature Astronomy, 2, 176, doi: 10.1038/s41550-018-0406-3
- Cicone et al. (2014) Cicone, C., Maiolino, R., Sturm, E., et al. 2014, A&A, 562, A21, doi: 10.1051/0004-6361/201322464
- Costa et al. (2014) Costa, T., Sijacki, D., & Haehnelt, M. G. 2014, MNRAS, 444, 2355, doi: 10.1093/mnras/stu1632
- Cutri et al. (2021) Cutri, R. M., Wright, E. L., Conrow, T., et al. 2021, VizieR Online Data Catalog: AllWISE Data Release (Cutri+ 2013), VizieR On-line Data Catalog: II/328. Originally published in: IPAC/Caltech (2013)
- Davies (2007) Davies, R. I. 2007, MNRAS, 375, 1099, doi: 10.1111/j.1365-2966.2006.11383.x
- Di Matteo et al. (2005) Di Matteo, T., Springel, V., & Hernquist, L. 2005, Nature, 433, 604, doi: 10.1038/nature03335
- D´ıaz-Santos et al. (2018) Díaz-Santos, T., Assef, R. J., Blain, A. W., et al. 2018, Science, 362, 1034, doi: 10.1126/science.aap7605
- D´ıaz-Santos et al. (2021) Díaz-Santos, T., Assef, R. J., Eisenhardt, P. R. M., et al. 2021, A&A, 654, A37, doi: 10.1051/0004-6361/202140455
- Eisenhardt et al. (2012) Eisenhardt, P. R. M., Wu, J., Tsai, C.-W., et al. 2012, ApJ, 755, 173, doi: 10.1088/0004-637X/755/2/173
- Fabian (2012) Fabian, A. C. 2012, ARA&A, 50, 455, doi: 10.1146/annurev-astro-081811-125521
- Fan et al. (2016) Fan, L., Han, Y., Fang, G., et al. 2016, ApJ, 822, L32, doi: 10.3847/2041-8205/822/2/L32
- Faucher-Giguère & Quataert (2012) Faucher-Giguère, C.-A., & Quataert, E. 2012, MNRAS, 425, 605, doi: 10.1111/j.1365-2966.2012.21512.x
- Feruglio et al. (2010) Feruglio, C., Maiolino, R., Piconcelli, E., et al. 2010, A&A, 518, L155, doi: 10.1051/0004-6361/201015164
- Feruglio et al. (2015) Feruglio, C., Fiore, F., Carniani, S., et al. 2015, A&A, 583, A99, doi: 10.1051/0004-6361/201526020
- Finnerty et al. (2020) Finnerty, L., Larson, K., Soifer, B. T., et al. 2020, ApJ, 905, 16, doi: 10.3847/1538-4357/abc3bf
- Fiore et al. (2017) Fiore, F., Feruglio, C., Shankar, F., et al. 2017, A&A, 601, A143, doi: 10.1051/0004-6361/201629478
- Flewelling et al. (2020) Flewelling, H. A., Magnier, E. A., Chambers, K. C., et al. 2020, ApJS, 251, 7, doi: 10.3847/1538-4365/abb82d
- Fluetsch et al. (2021) Fluetsch, A., Maiolino, R., Carniani, S., et al. 2021, MNRAS, 505, 5753, doi: 10.1093/mnras/stab1666
- Ginolfi et al. (2022) Ginolfi, M., Piconcelli, E., Zappacosta, L., et al. 2022, Nature Communications, 13, 4574, doi: 10.1038/s41467-022-32297-x
- Glikman et al. (2022) Glikman, E., Lacy, M., LaMassa, S., et al. 2022, ApJ, 934, 119, doi: 10.3847/1538-4357/ac6bee
- Greene et al. (2011) Greene, J. E., Zakamska, N. L., Ho, L. C., & Barth, A. J. 2011, ApJ, 732, 9, doi: 10.1088/0004-637X/732/1/9
- Griffith et al. (2012) Griffith, R. L., Kirkpatrick, J. D., Eisenhardt, P. R. M., et al. 2012, AJ, 144, 148, doi: 10.1088/0004-6256/144/5/148
- Guo et al. (2018) Guo, H., Shen, Y., & Wang, S. 2018, PyQSOFit: Python code to fit the spectrum of quasars, Astrophysics Source Code Library, record ascl:1809.008
- Harrison et al. (2014) Harrison, C. M., Alexander, D. M., Mullaney, J. R., & Swinbank, A. M. 2014, MNRAS, 441, 3306, doi: 10.1093/mnras/stu515
- Heckman & Best (2014) Heckman, T. M., & Best, P. N. 2014, ARA&A, 52, 589, doi: 10.1146/annurev-astro-081913-035722
- Hopkins et al. (2016) Hopkins, P. F., Torrey, P., Faucher-Giguère, C.-A., Quataert, E., & Murray, N. 2016, MNRAS, 458, 816, doi: 10.1093/mnras/stw289
- HSA (2021) HSA. 2021, Herschel High Level Images, IPAC, doi: 10.26131/IRSA79
- Husemann & Harrison (2018) Husemann, B., & Harrison, C. M. 2018, Nature Astronomy, 2, 196, doi: 10.1038/s41550-018-0407-2
- Jones et al. (2014) Jones, S. F., Blain, A. W., Stern, D., et al. 2014, MNRAS, 443, 146, doi: 10.1093/mnras/stu1157
- Jun et al. (2021) Jun, H. D., Assef, R. J., Carroll, C. M., et al. 2021, ApJ, 906, 21, doi: 10.3847/1538-4357/abc629
- Jun et al. (2020) Jun, H. D., Assef, R. J., Bauer, F. E., et al. 2020, ApJ, 888, 110, doi: 10.3847/1538-4357/ab5e7b
- Karouzos et al. (2016) Karouzos, M., Woo, J.-H., & Bae, H.-J. 2016, ApJ, 833, 171, doi: 10.3847/1538-4357/833/2/171
- Kauffmann et al. (2003) Kauffmann, G., Heckman, T. M., White, S. D. M., et al. 2003, MNRAS, 341, 33, doi: 10.1046/j.1365-8711.2003.06291.x
- Kewley et al. (2006) Kewley, L. J., Groves, B., Kauffmann, G., & Heckman, T. 2006, MNRAS, 372, 961, doi: 10.1111/j.1365-2966.2006.10859.x
- Kewley et al. (2013) Kewley, L. J., Maier, C., Yabe, K., et al. 2013, ApJ, 774, L10, doi: 10.1088/2041-8205/774/1/L10
- King & Pounds (2015) King, A., & Pounds, K. 2015, ARA&A, 53, 115, doi: 10.1146/annurev-astro-082214-122316
- Kormendy & Ho (2013) Kormendy, J., & Ho, L. C. 2013, ARA&A, 51, 511, doi: 10.1146/annurev-astro-082708-101811
- Larkin et al. (2006) Larkin, J., Barczys, M., Krabbe, A., et al. 2006, in Society of Photo-Optical Instrumentation Engineers (SPIE) Conference Series, Vol. 6269, Ground-based and Airborne Instrumentation for Astronomy, ed. I. S. McLean & M. Iye, 62691A, doi: 10.1117/12.672061
- Li et al. (2023) Li, G., Tsai, C.-W., Stern, D., et al. 2023, ApJ, 958, 162, doi: 10.3847/1538-4357/ace25b
- Li et al. (2024) Li, G., Assef, R. J., Tsai, C.-W., et al. 2024, ApJ, 971, 40, doi: 10.3847/1538-4357/ad5317
- Lockhart et al. (2019) Lockhart, K. E., Do, T., Larkin, J. E., et al. 2019, AJ, 157, 75, doi: 10.3847/1538-3881/aaf64e
- Luo et al. (2022) Luo, Y., Fan, L., Zou, H., et al. 2022, ApJ, 935, 80, doi: 10.3847/1538-4357/ac8162
- Lyke et al. (2017) Lyke, J., Do, T., Boehle, A., et al. 2017, OSIRIS Toolbox: OH-Suppressing InfraRed Imaging Spectrograph pipeline, Astrophysics Source Code Library, record ascl:1710.021
- Maiolino et al. (2012) Maiolino, R., Gallerani, S., Neri, R., et al. 2012, MNRAS, 425, L66, doi: 10.1111/j.1745-3933.2012.01303.x
- Martin et al. (2024) Martin, L. R., Blain, A. W., Díaz-Santos, T., et al. 2024, MNRAS, 534, 978, doi: 10.1093/mnras/stae2147
- Mieda et al. (2014) Mieda, E., Wright, S. A., Larkin, J. E., et al. 2014, PASP, 126, 250, doi: 10.1086/675784
- Piconcelli et al. (2015) Piconcelli, E., Vignali, C., Bianchi, S., et al. 2015, A&A, 574, L9, doi: 10.1051/0004-6361/201425324
- Rodrigo & Solano (2020) Rodrigo, C., & Solano, E. 2020, in XIV.0 Scientific Meeting (virtual) of the Spanish Astronomical Society, 182
- Rodrigo et al. (2012) Rodrigo, C., Solano, E., & Bayo, A. 2012, SVO Filter Profile Service Version 1.0, IVOA Working Draft 15 October 2012, doi: 10.5479/ADS/bib/2012ivoa.rept.1015R
- Rupke & Veilleux (2011) Rupke, D. S. N., & Veilleux, S. 2011, ApJ, 729, L27, doi: 10.1088/2041-8205/729/2/L27
- Sanders et al. (1988) Sanders, D. B., Soifer, B. T., Elias, J. H., et al. 1988, ApJ, 325, 74, doi: 10.1086/165983
- Sanders et al. (2016) Sanders, R. L., Shapley, A. E., Kriek, M., et al. 2016, ApJ, 816, 23, doi: 10.3847/0004-637X/816/1/23
- Santoro et al. (2020) Santoro, F., Tadhunter, C., Baron, D., Morganti, R., & Holt, J. 2020, A&A, 644, A54, doi: 10.1051/0004-6361/202039077
- Shen et al. (2019) Shen, Y., Hall, P. B., Horne, K., et al. 2019, ApJS, 241, 34, doi: 10.3847/1538-4365/ab074f
- SSC And IRSA (2020) SSC And IRSA. 2020, Spitzer Enhanced Imaging Products, IPAC, doi: 10.26131/IRSA433
- Stern et al. (2014) Stern, D., Lansbury, G. B., Assef, R. J., et al. 2014, ApJ, 794, 102, doi: 10.1088/0004-637X/794/2/102
- Storey & Zeippen (2000) Storey, P. J., & Zeippen, C. J. 2000, MNRAS, 312, 813, doi: 10.1046/j.1365-8711.2000.03184.x
- Sun et al. (2024) Sun, W., Fan, L., Han, Y., et al. 2024, ApJ, 964, 95, doi: 10.3847/1538-4357/ad22e3
- Tsai et al. (2015) Tsai, C.-W., Eisenhardt, P. R. M., Wu, J., et al. 2015, ApJ, 805, 90, doi: 10.1088/0004-637X/805/2/90
- Tsai et al. (2018) Tsai, C.-W., Eisenhardt, P. R. M., Jun, H. D., et al. 2018, ApJ, 868, 15, doi: 10.3847/1538-4357/aae698
- Urrutia et al. (2008) Urrutia, T., Lacy, M., & Becker, R. H. 2008, ApJ, 674, 80, doi: 10.1086/523959
- Vayner et al. (2021) Vayner, A., Wright, S. A., Murray, N., et al. 2021, ApJ, 919, 122, doi: 10.3847/1538-4357/ac0f56
- Vayner et al. (2024) Vayner, A., Díaz-Santos, T., Eisenhardt, P. R. M., et al. 2024, arXiv e-prints, arXiv:2412.02862, doi: 10.48550/arXiv.2412.02862
- Veilleux et al. (2005) Veilleux, S., Cecil, G., & Bland-Hawthorn, J. 2005, ARA&A, 43, 769, doi: 10.1146/annurev.astro.43.072103.150610
- Vito et al. (2018) Vito, F., Brandt, W. N., Stern, D., et al. 2018, MNRAS, 474, 4528, doi: 10.1093/mnras/stx3120
- Wright et al. (2010) Wright, E. L., Eisenhardt, P. R. M., Mainzer, A. K., et al. 2010, AJ, 140, 1868, doi: 10.1088/0004-6256/140/6/1868
- Wright et al. (2019) Wright, E. L., Eisenhardt, P. R. M., Mainzer, A. K., et al. 2019, AllWISE Source Catalog, IPAC, doi: 10.26131/IRSA1
- Wu et al. (2012) Wu, J., Tsai, C.-W., Sayers, J., et al. 2012, ApJ, 756, 96, doi: 10.1088/0004-637X/756/1/96
- Wu et al. (2018) Wu, J., Jun, H. D., Assef, R. J., et al. 2018, ApJ, 852, 96, doi: 10.3847/1538-4357/aa9ff3
- Xu & Wang (2022) Xu, X., & Wang, J. 2022, ApJ, 933, 110, doi: 10.3847/1538-4357/ac7222
- Yuan & Narayan (2014) Yuan, F., & Narayan, R. 2014, ARA&A, 52, 529, doi: 10.1146/annurev-astro-082812-141003
- Zewdie et al. (2023) Zewdie, D., Assef, R. J., Mazzucchelli, C., et al. 2023, A&A, 677, A54, doi: 10.1051/0004-6361/202346695
- Zewdie et al. (2024) Zewdie, D., Assef, R. J., Lambert, T., et al. 2024, arXiv e-prints, arXiv:2412.04436, doi: 10.48550/arXiv.2412.04436
- Zhan (2011) Zhan, H. 2011, Scientia Sinica Physica, Mechanica & Astronomica, 41, 1441, doi: 10.1360/132011-961