Constraints on the galaxy formation models during epoch of reionization with high redshift observations
Abstract
We use high resolution N-body dark matter simulations and L-Galaxies semi-analytical galaxy formation models to explore the high- galaxy properties and estimate the budget of ionizing photons. The parameters within L-Galaxies are obtained using a Markov Chain Monte Carlo (MCMC) method with high- galaxy observations from JWST and other telescopes. We consider two versions of L-Galaxies with and without dust correction on galaxy UV luminosities. With the best-fit parameters, both L-Galaxies 2015 and L-Galaxies 2020 reproduce well observations of UV luminosity functions, stellar mass functions, star formation rate densities and ionizing photon emission efficiency. With the assumption of escape fraction of , all models produce more ionizing photons than the number of Hydrogen atoms in the Universe at . The inclusion of dust correction within MCMC results in higher star formation efficiency, which predicts more ionizing photons, with better consistency between the predicted stellar mass functions and observations.
1 Introduction
The epoch of reionization (EoR) is the phase transition process of the Universe from cold and neutral to hot and ionized, driven by stellar and galactic radiation sources (Furlanetto et al., 2006). Observations of Gunn-Peterson (GP) troughs in QSO spectra suggest that the EoR should have been completed by (Fan et al., 2006), or even at lower (e.g. Becker et al., 2015; Bosman et al., 2022). Cosmic Microwave Background (CMB) experiments (e.g. the Planck project, Planck Collaboration et al., 2020) measured a Thomson scattering optical depth , which, for the parametrization of the reionization history adopted in Planck Collaboration et al. (2020), results in a mid-point of reionization of . Many state-of-the-art astronomical facilities have been recently providing superb data on celestial objects during the EoR. Among these, early results from the James Webb Space Telescope (JWST) suggested the presence of galaxies at redshifts as high as (Harikane et al., 2023), while a galaxy at has been spectroscopically confirmed (Carniani et al., 2024). The Atacama Large Millimeter/submillimeter Array (ALMA) telescope has measured the properties of galaxies at through e.g. the [CII] emission line (Bouwens et al., 2020). Radio telescopes such as the low-frequency array (LOFAR), the Murchison Widefield Array (MWA), and the Hydrogen Epoch of Reionization Array (HERA) have already released some upper limit observations of the power spectra of the 21-cm line from neutral hydrogen (Mertens et al., 2020; Acharya et al., 2024a; Trott et al., 2020; Abdurashidova et al., 2022), while the next generation telescope Square Kilometre Array (SKA) will provide a more detailed picture of the history and topology of the EoR (Koopmans et al., 2015).
As galaxies are believed to be the main ionizing sources during the EoR, investigating high- galaxies can help to understand the reionization process (Dayal & Ferrara, 2018). In the last few years, the JWST telescope has observed many low-mass and faint high- galaxies, due to its depth and wavelength coverage, which allows to study the properties of very low-mass galaxies such as stellar mass and SFR during the EoR (Navarro-Carrera et al., 2024; Wang et al., 2024). Meanwhile, the JWST has measured the rest-frame UV luminosity functions (UVLF) of galaxies up to (Harikane et al., 2023; Adams et al., 2024; Donnan et al., 2024; Finkelstein et al., 2024). The Hubble Space Telescope (HST) and the Spitzer telescope also measured the UVLF and stellar mass functions (SMF) of galaxies at (Bouwens et al., 2021; Stefanon et al., 2021). Note that these results are mostly from observed galaxies with photometric confirmed redshifts, while the UVLF with spectroscopic redshifts are still with very low precision (Harikane et al., 2024a, b), since only a small fraction of high- galaxies is spectroscopically confirmed.
Ideally, galaxy formation and evolution should be consistently modelled with the reionization process through high-resolution radiation hydrodynamical simulations. Although several are present in the literature, e.g. FIRE (Ma et al., 2018), SPHINX (Rosdahl et al., 2018), CROC (Esmerian & Gnedin, 2021), THESAN (Kannan et al., 2022), CoDa (Ocvirk et al., 2020) and SPICE (Bhagwat et al., 2024), they are extremely computationally expensive, so that they are necessarily limited in terms of e.g. box dimension and/or parameter space exploration. More efficient semi-analytical/numerical approaches which follow the formation and evolution of galaxies within the reionization process have been developed, among which MERAXES (Mutch et al., 2016), ASTRAEUS (Hutter et al., 2021), and POLAR (Ma et al., 2023; Acharya et al., 2024b). These approaches usually adopt the halo distribution and merger tree from N-body dark matter simulations, and model the formation and evolution of galaxies according to some prescription describing the various physical processes at play, e.g. star formation, metal enrichment, feedback effects etc. Although these approaches are extremely efficient, they are still very expensive to fit the model parameters with observations, employing e.g. a Markov Chain Monte Carlo (MCMC) method. To make the MCMC process more efficient, Henriques et al. (2013) proposed to randomly select merger trees and halo samples to produce statistically less precise (e.g. within errors) SMF and luminosity functions before the MCMC runs. This technique is applied in Henriques et al. (2015, 2020) to find galaxy formation parameters which reproduce low- observations. The analytic models that are based on halo mass functions are usually very efficient in computing the UVLF and SMF. Such methods have already been employed in MCMC calculations (e.g. Park et al., 2019; Zhang et al., 2022), but they do not naturally include e.g. the stochasticity of the UV luminosity versus halo mass relation (Gelli et al., 2024; Nikolić et al., 2024), nor a more physically motivated description of the galaxy formation and evolution model.
In this paper, we will apply the MCMC technique developed in Henriques et al. (2013) to explore how high- galaxy observations from the JWST telescope constrain galaxy formation models, by combining high resolution N-body dark matter simulations with the semi-analytical galaxy formation model (SAM) L-Galaxies (Henriques et al., 2015, 2020). We will then explore the galaxy properties and estimate the budget of ionizing photons with the best-fit parameters from different sets of MCMC runs.
The paper is organized as follows: we describe the N-body dark matter simulations, galaxy formation models and MCMC calculations in Section 2, the results of high- galaxy properties and budget of ionizing photons are presented in Section 3, and the conclusions are summarized in Section 4. The cosmological parameters adopted for the N-body dark matter and L-Galaxies simulations are from the Planck project (Planck Collaboration et al., 2020) fitted with the data sets of TT, TE, and EE+lowE+lensing+BAO, i.e. , , , , and .
2 Methods
2.1 Dark matter simulations
For the distributions and the merger trees of dark matter halos we adopt the Jiutian-300 N-body dark matter simulation. It was run with the Gadget-4 code (Springel et al., 2021), with a box size of and dark matter particles, corresponding to a particle mass resolution of . The simulations start at and end at , outputting a total number of 128 snapshots, although in this paper we only employ the first 39 with redshift . The Friend-of-Friend (FoF) algorithm (Springel et al., 2001) is applied to define dark matter halos, while the Subfind technique is used to identify sub-halos. The halos have at least 20 dark-matter particles, i.e. the minimum halo mass is . They are then used to construct the halo merger trees by following Springel et al. (2005).
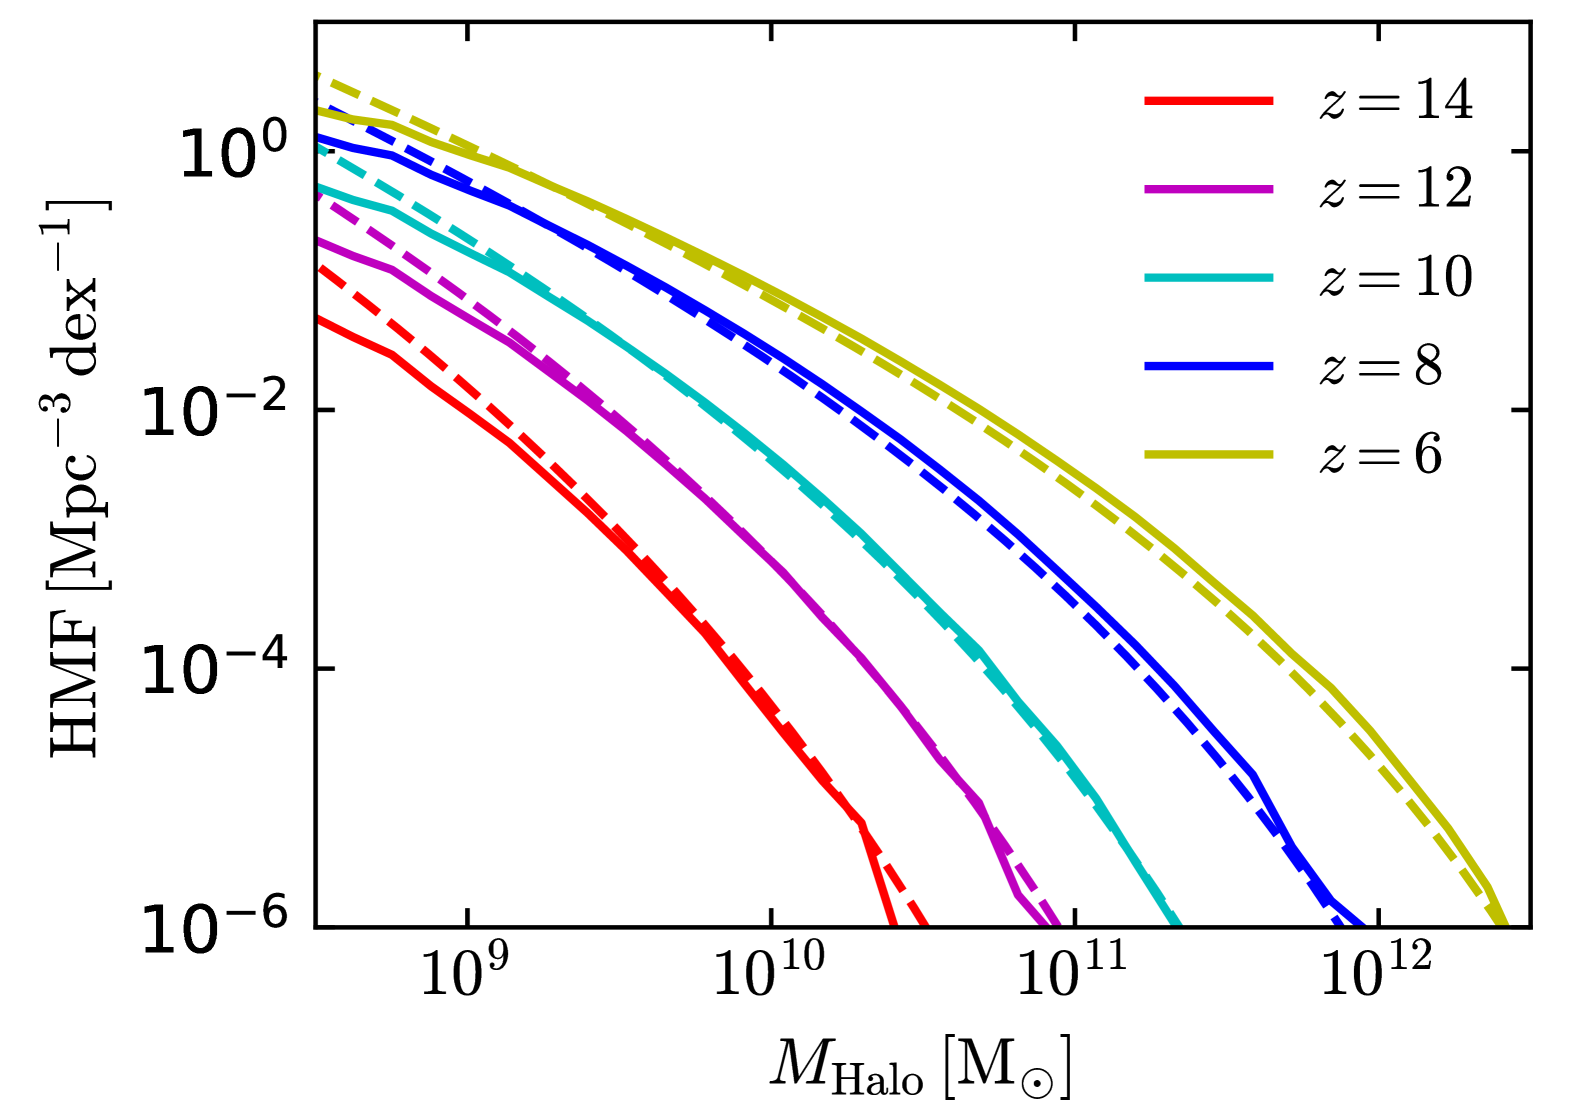
As a reference, in Fig. 1 we show the halo mass function (HMF) at five redshifts, from 14 to 6. As a comparison, we also plot the HMF from Tinker et al. (2008), which are computed with the COLIBRI111https://github.com/GabrieleParimbelli/COLIBRI library and are roughly consistent with those from our simulations, although some differences are observed at the low mass end, probably due to the resolution which is not enough to properly capture halos of those masses.
2.2 L-Galaxies models
As our fiducial semi-analytical galaxy formation model (SAM), we adopt L-Galaxies 2020 (named LG20 in the following; Henriques et al., 2020), which is an updated version of L-Galaxies 2015 (named LG15 in the following; Henriques et al., 2015). Both LG15 and LG20 include many physical processes related to galaxy formation and evolution, e.g. gas cooling, star formation, galaxy merger, supernovae feedback, black hole growth and AGN feedback, chemical enrichment, stellar population synthesis (SPS) models, tidal effects, and reincorporation of ejected gas. Compared to LG15, LG20 adds a molecular hydrogen (H2) based star formation prescription, spatially-resolved rings of the gas and stellar disc in galaxies, and gas radial flow processes. Differently, LG15 adopts the standard star formation prescription from Croton et al. (2006) and Guo et al. (2011), in which the star formation rate (SFR) is linearly related to the cold gas mass within galaxies when the gas surface density is above a given mass threshold. For more comparisons of different L-Galaxies versions, one can refer to the recent paper Vani et al. (2024).
Galaxy properties such as stellar mass, SFR and metal enrichment are directly computed in both LG15 and LG20, and also the UV luminosity and ionizing photon budget are calculated on the fly by adopting spectral energy distributions (SED) of the binary star mode from Binary Population and Spectral Synthesis (BPASS, Eldridge et al., 2017; Stanway & Eldridge, 2018). Note that choosing a different SPS model can result in a very different ionizing photon budget, while this does not strongly affect the UV luminosities (Liu et al., 2024). We also note that, differently from LG15, LG20 includes a time delay after star formation for a supernovae explosion to happen, which results in a delayed energy and metal ejection in comparison to LG15.
2.3 MCMC calculation
There are many free parameters in the modeling of physical processes related to galaxy formation and evolution. Henriques et al. (2013) employed a Markov Chain Monte Carlo (MCMC) technique to constrain the values of these parameters in order to match the results from L-Galaxies simulations (named LG in the following) to observations. Following Henriques et al. (2013), we firstly apply the fiducial LG20 results to select the random tree samples. Note that, the fiducial LG20 results are only used to check if galaxy properties such as SMF and UVLF obtained from random tree samples are still consistent with the LG results. To make the MCMC more efficient, we do not select the biggest merger trees. Besides, we do not update the positions of orphan galaxies as done in Henriques et al. (2013) for simplicity, which has little impact on the results during EoR.
We then fit the free parameters based on UVLF observations from to 12 (e.g. Bouwens et al., 2021; Adams et al., 2024; Finkelstein et al., 2024; Donnan et al., 2024; Harikane et al., 2023). Due to the limit of dark matter simulation box size (i.e. ) and number of tree samples, data points at the brightest end of the UVLF (see the grey area in the top panel of Fig. 2) are not included in the MCMC calculations.
| Parameter | Fiducial | LG20_bestfit | LG20_final | LG20_dust_bestfit | LG20_dust_final | LG15_bestfit | LG15_final |
|---|---|---|---|---|---|---|---|
| 0.06 | 0.11 | 0.11 | 0.19 | 0.19 | 6.1 | 6.1 | |
| – | – | – | – | – | 0.27 | 0.24 | |
| 0.50 | 0.65 | 0.5 | 0.25 | 0.5 | 0.6 | 0.6 | |
| 0.38 | 0.21 | 0.21 | 0.27 | 0.27 | 1.2 | 1.9 | |
| 2.5 | 1.6 | 2.5 | 0.011 | 2.5 | 6.2 | 5.3 | |
| 0.066 | 0.07 | 0.066 | 0.049 | 0.066 | 0.082 | 0.041 | |
| 700 | 730 | 700 | 50 | 700 | 740 | 750 | |
| 5.6 | 1.6 | 5.6 | 0.51 | 5.6 | 1.3 | 2.6 | |
| 110 | 110 | 110 | 150 | 110 | 320 | 480 | |
| 2.9 | 4.1 | 2.9 | 3.4 | 2.9 | 0.79 | 0.72 | |
| 5.5 | 4.7 | 5.5 | 2.8 | 5.5 | 0.28 | 0.28 | |
| 220 | 200 | 220 | 490 | 220 | 59 | 100 | |
| 2.0 | 2.4 | 2.0 | 4.3 | 2.0 | 1.2 | 0.8 | |
| 1.2 | 7.7 | 7.7 | 9.6 | 9.6 | 6.5 | 3.0 | |
| 1.8 | 1.8 | 1.8 | 2.3 | 1.8 | 3.8 | 2.5 | |
| 4.1 | 2.3 | 2.3 | 2.5 | 2.5 | 1.4 | 1.2 |
We perform the MCMC fitting for 15 free parameters within LG20 and 16 within LG15, which are listed in Tab. 1. We note that in LG20 is the star formation efficiency based on H2 surface density, while is the star formation efficiency adopted in LG15. is the mass threshold for star formation adopted in LG15, which is not included in LG20. and are related to the burst of star formation expected after a galactic merger. , and are associated with the modeling of the central massive black hole growth within galaxies. , and regulate the gas heating through supernovae explosions, while , and model the associated gas ejection. is an efficiency factor which regulates the reincorporation time-scale of gas ejected in winds, while is the efficiency factor of galaxy merger delay time due to dynamical friction. Finally, is associated with the ram-pressure stripping process.
Considering the uncertainties of galaxy formation and dust modeling during the EoR, we perform three sets of MCMC runs, one respectively for LG20 and LG15 by assuming no dust correction to compute the UV luminosity, and one for LG20 with dust correction. Since the UVLF after dust correction in LG15 are much lower than the observed ones (Clay et al., 2015), we do not perform an MCMC analysis for the case with dust correction in LG15.
3 Results
The best-fit results of free parameters in LG15 and LG20 are listed in Tab. 1, while Appendix A shows some of the results of the MCMC sample analysis. In the column named Fiducial, we list the parameter values from Henriques et al. (2020), which are fitted with the observations at for LG20. The columns LG20_bestfit and LG20_dust_bestfit are the best-fit results of LG20 without and with dust correction on the UV luminosity, respectively. The column LG15_bestfit is the best-fit results of LG15 without dust correction. Since most parameters are not well constrained by UVLF observations (see also the discussions in Ma et al., 2023), in columns LG20_final and LG20_dust_final we select four well limited parameters from LG20_bestfit and LG20_dust_bestfit (i.e. , , and , see the Appendix A), while the others are the same as those of the Fiducial model. Column LG15_final includes two well-limited parameters from LG15_bestfit ( and ), while the others are the original ones in LG15 that fitted low- observations (Henriques et al., 2015). Note that Henriques et al. (2015) adopted and , i.e. our best-fit is only of the original one in LG15.
In the following subsections, we will discuss the galaxy properties and the ionizing photon budget from LG20 and LG15 with the setting of parameter values listed in Tab. 1, i.e. the results of seven LG simulations.
3.1 Galaxy properties
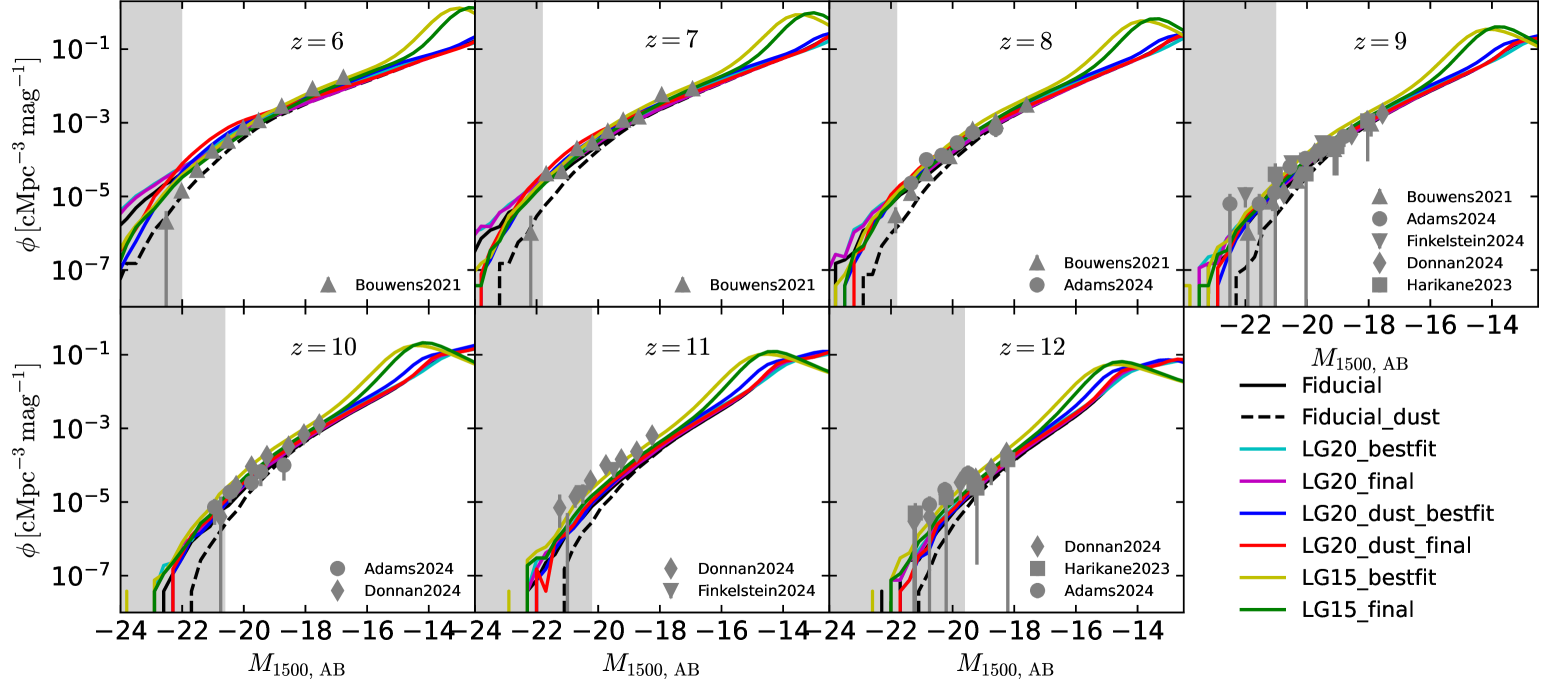
The top panel of Fig. 2 shows the UVLF, , from to 12 from the seven LG simulations, together with observational data from HST and JWST. As a reference, we also show the UVLFs obtained from Fiducial with the addition of dust correction (named as Fiducial_dust), which, as expected, are lower than those of Fiducial at the bright end (i.e. ). Note that the results at might not be very robust, due to the resolution limitation in the simulations. From Fig. 2, we observe that while the UVLF from Fiducial_dust is fairly consistent with the observations of Bouwens et al. (2021) at and 7, they are significantly lower than JWST results at . Although the MCMC calculations do not include the data points at the bright end, the UVLF from all simulations are still consistent with observations at , they are slightly higher at and , and fall below observations at and . The UVLF from LG20_bestfit and LG20_final are very similar among themselves and also to Fiducial, since the minor changes of the galaxy formation parameters do not significantly affect the UVLF (Ma et al., 2023). The UVLF from LG20_dust_bestfit and LG20_dust_final are consistent with Fiducial at , while at and 7 they are slightly higher for and become lower at due to dust absorption. The UVLF from LG15_bestfit and LG15_final are consistent with those of Fiducial at . The discrepancies observed at may be due to the incomplete samples from the simulations at such magnitudes, and probably also to the different prescription of star formation employed in LG15 and LG20, in particular the adoption in L15 of a critical mass threshold for star formation , which is not present in LG20. Since only the faint end of the UVLF is sensitive to , this parameter in LG15 is poorly limited by current UVLF observations. As discussed in Henriques et al. (2020), the prescription adopted in LG15 allows star formation earlier than in LG20, and thus produces a larger SFR and stellar mass in low-mass halos, resulting in a higher UVLF at the faint end. The total of UVLF from to 12 of the eight models shown in the top panel of Fig. 2 are 324.9, 283.9, 607.6, 566.5, 348.2, 1001.3, 584.2, 224.7. Note that, since some data points of UVLF observations are not included in the MCMC, these values are different to the best-fit ones of MCMC. From the values, LG15_final is the best in matching UVLF observations, followed by the Fiducial model with dust correction (i.e. Fiducial_dust in Fig. 2).
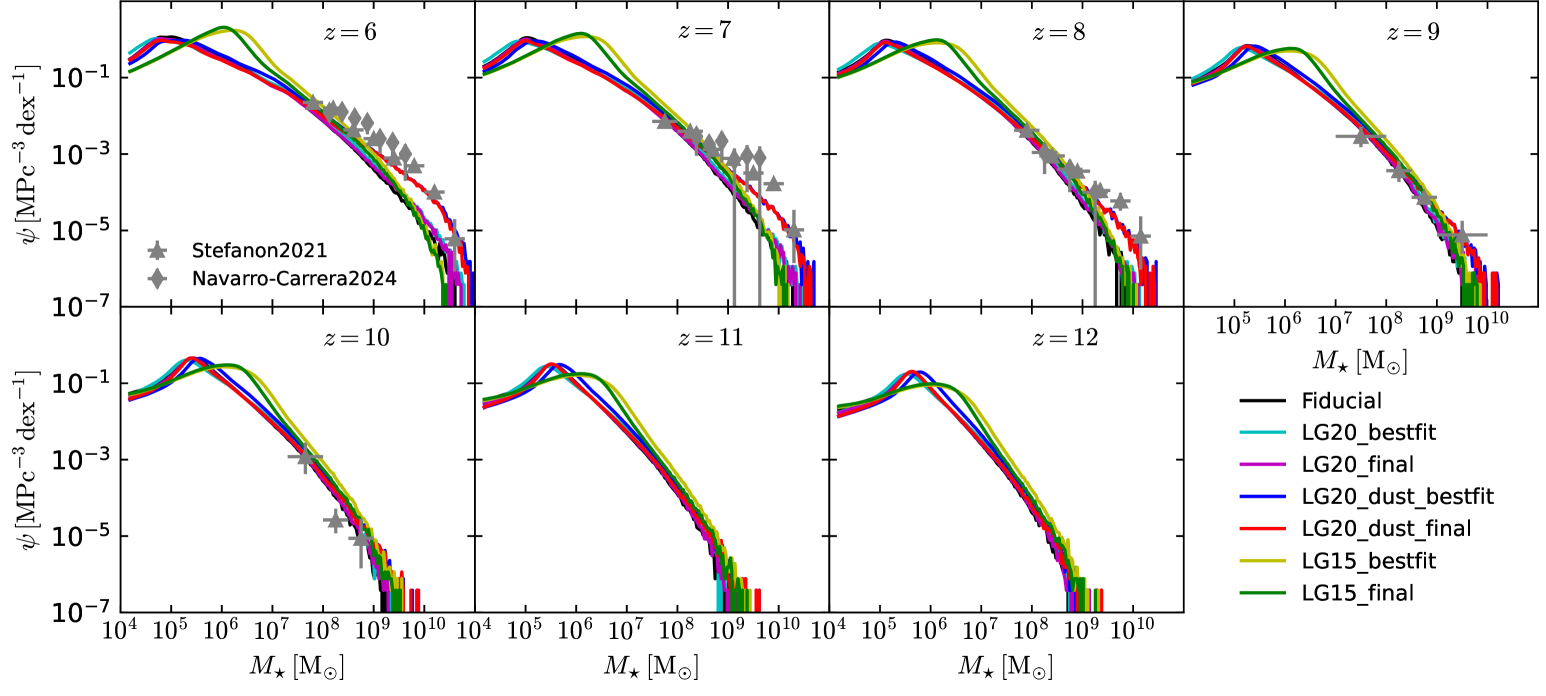
The bottom panel of Fig. 2 shows the stellar mass function (SMF, ) at to 12 from the seven LG simulations, together with observational data points from Stefanon et al. (2021) and Navarro-Carrera et al. (2024). We note that, due to the resolution limitation in the simulations, the results at might not be very robust. The SMF from LG20_bestfit and LG20_final are consistent with those from Fiducial. On the other hand, as shown in Tab. 1, in comparison to the Fiducial case, the inclusion of dust correction within the MCMC calculation results in a higher star formation efficiency , and in a lower gas reincorporation time-scale factor , leading to a higher stellar mass in the massive halos (see also the top panel of Fig. 3). As a consequence, LG20_dust_bestfit and LG20_dust_final show a SMF at and higher than those of Fiducial. The SMF from LG15_bestfit and LG15_final are consistent with those of Fiducial at , while they differ at because of the incomplete samples from the simulations at such masses and the different prescription for star formation adopted in LG15 and LG20. Although SMF observations are not included in the MCMC calculations, the SMF from LG20_dust_bestfit and LG20_dust_final match well with data from Stefanon et al. (2021) and Navarro-Carrera et al. (2024), while the others are consistent with observations only at , suggesting that dust correction should probably be included to fit both UVLF and SMF observations.
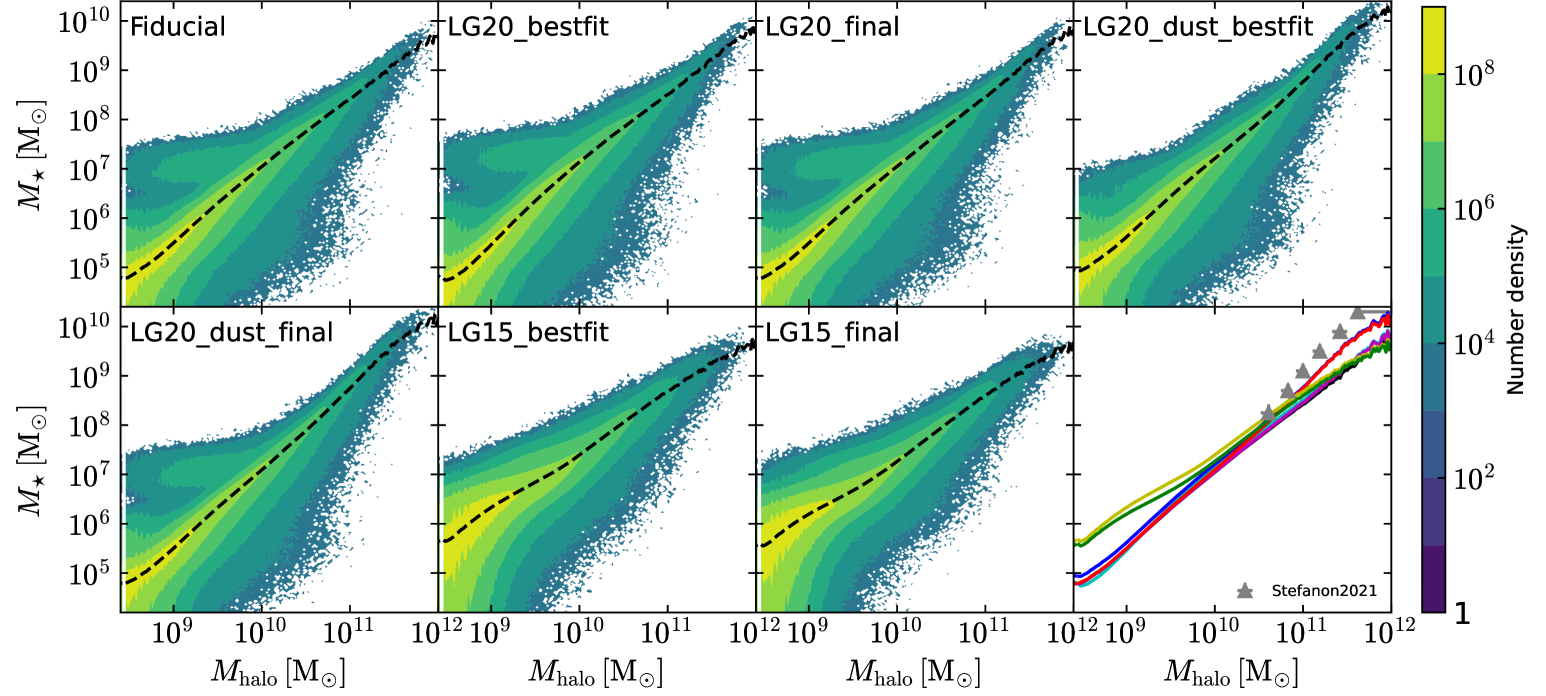
The top panel of Fig. 3 shows the 2-D distributions of stellar mass versus halo mass at from the seven LG simulations. The color-bar refers to the number density of galaxies, computed as , where and are the bin-width along the and -axis, and is the number of galaxies in each bin. We also show the mean versus , together with data at from Stefanon et al. (2021). The results from LG20_bestfit and LG20_final are very similar to those from Fiducial. Their is linearly related to in the log-space, with a power-law relation . LG20_dust_bestfit and LG20_dust_final typically have larger than that of Fiducial at , due to the higher star formation efficiency and lower reincorporation time-scale factor . Because of this, the index of the power-law relation between and is increased to . Note that the relation of and from LG20_dust_bestfit and LG20_dust_final is more consistent with the observations of Stefanon et al. (2021) at than in other models. The of LG15_bestfit and LG15_final have a much larger scatter than Fiducial at , while their mean are consistent with the latter. At , the of LG15_bestfit and LG15_final are typically higher than Fiducial, as the prescription for star formation adopted in LG15 allows an earlier formation of stars in low-mass halos. This results in an index of the power-law relation between and of , lower than Fiducial.
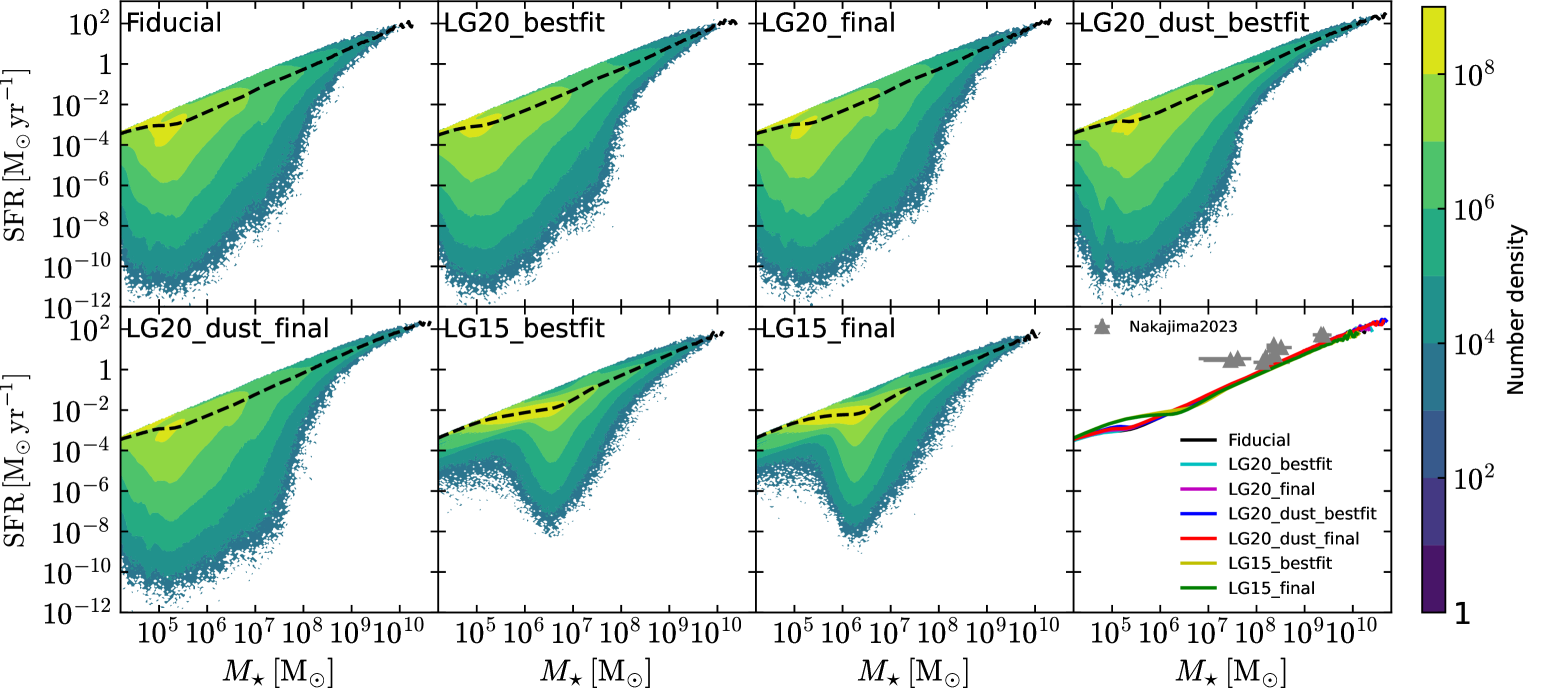
The bottom panel of Fig. 3 shows the 2-D distributions of SFR versus stellar mass at from the seven LG simulations, together with the mean SFR and observational results from galaxies at by Nakajima et al. (2023). The SFR distributions of LG20_bestfit and LG20_final are similar to those of Fiducial, with a very large scatter at . The SFR can be as low as for galaxies with , due to the supernovae feedback that can efficiently quench star formation in some low-mass galaxies. As mentioned earlier, the LG20_dust_bestfit and LG20_dust_final have more massive galaxies than Fiducial, while their SFR versus relations are consistent with the latter. The galaxies from LG15_bestfit and LG15_final have globally higher SFR than Fiducial at , and especially they have no SFR lower than at . The discrepancies observed in the SFR distributions of LG15 and LG20 are due again to the incomplete samples from the simulations in such mass range and to the different prescriptions adopted for star formation. We note that our estimated SFR versus relations in all simulations are roughly consistent with observations at from Nakajima et al. (2023).
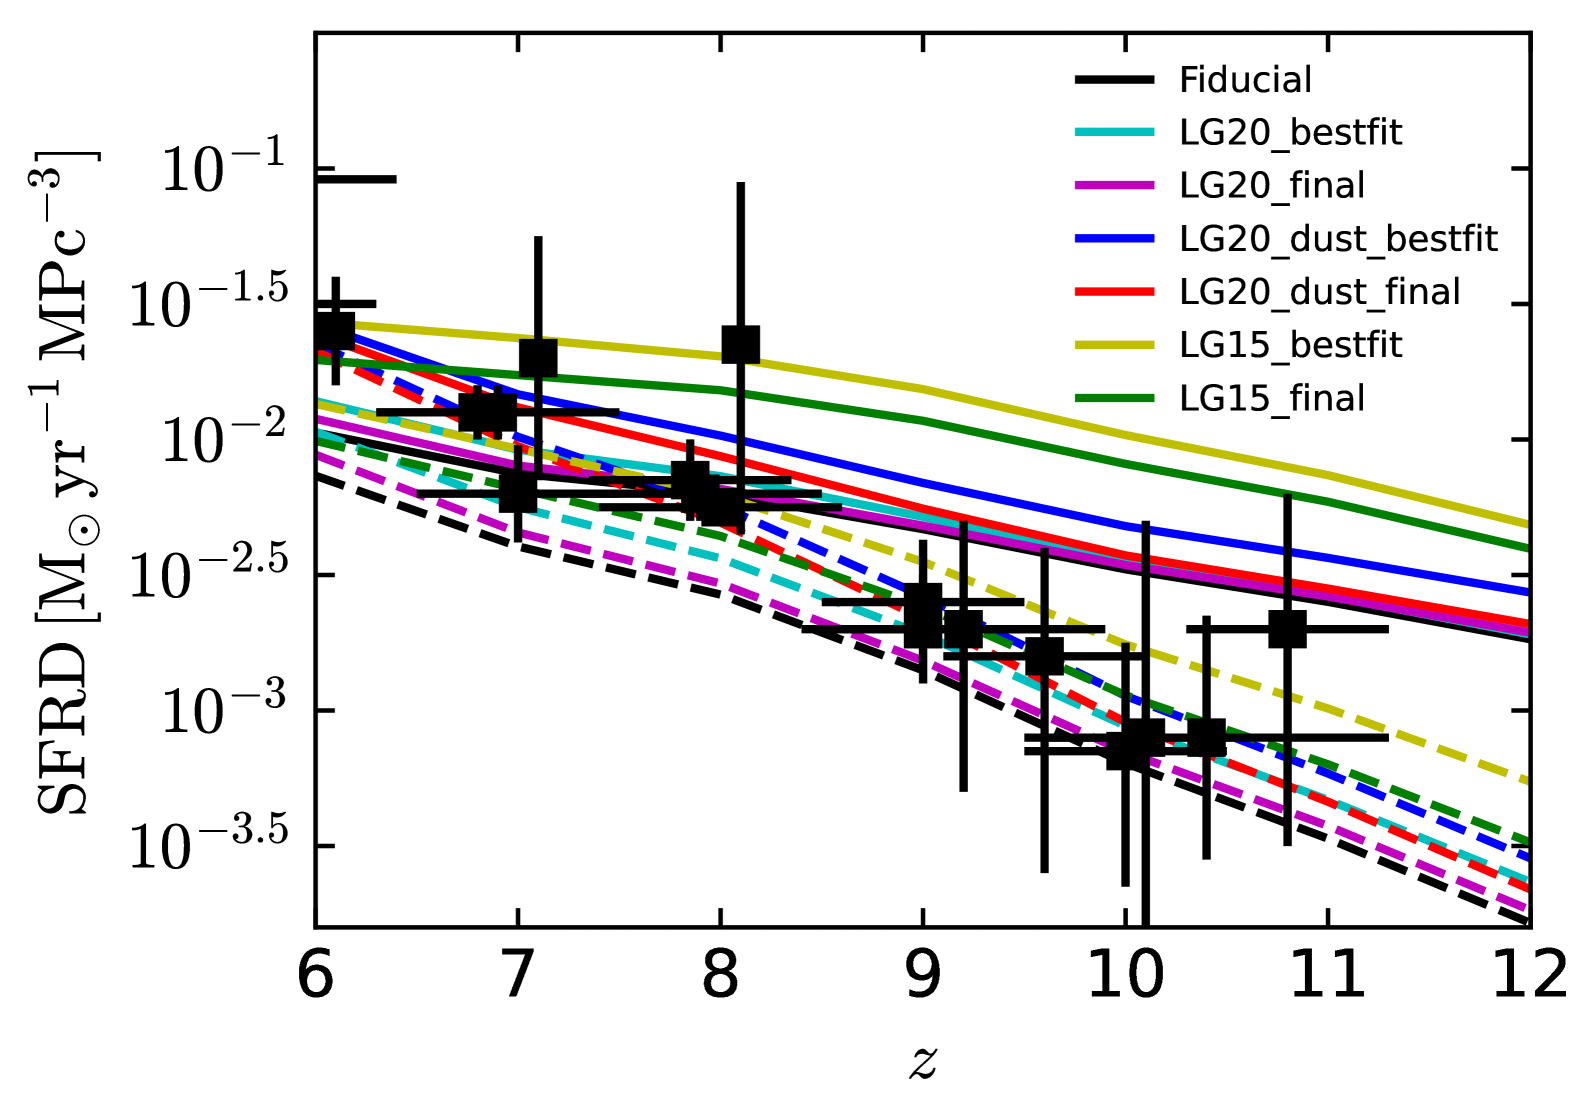
Fig. 4 shows two cases of volume averaged SFR density (SFRD) as a function of , one including all galaxies with non-zero star formation, while the other one considers only those with (as suggested from the bottom panel of Fig. 2 and the top panel of Fig. 7). As a comparison, we also show the observational SFRD summarized in Ma et al. (2017). When all galaxies are included, the SFRD from G20_bestfit and LG20_final are similar to those from Fiducial, while LG20_dust_bestfit and LG20_dust_final produce higher SFRD, especially at , due to their larger star formation efficiency . LG15_bestfit and LG15_final have the highest SFRD, which is dex larger than in Fiducial. When galaxies with are removed, the SFRD becomes smaller. For example, the one of Fiducial is reduced by and at and 12, respectively. The SFRD of LG15_bestfit and LG15_final are reduced by at , as LG15 predicts more galaxies at than Fiducial (see Fig. 2). Since LG20_dust_bestfit and LG20_dust_final have more massive galaxies than Fiducial, their SFRD are only reduced by and become the highest at . Due to the large error-bars of the data points, the SFRD from all simulations are roughly consistent with observations. Note that, since the data points do not include faint galaxies (e.g. Bouwens et al., 2015), the SFRD of galaxies with are more consistent with observations at than those including all galaxies.
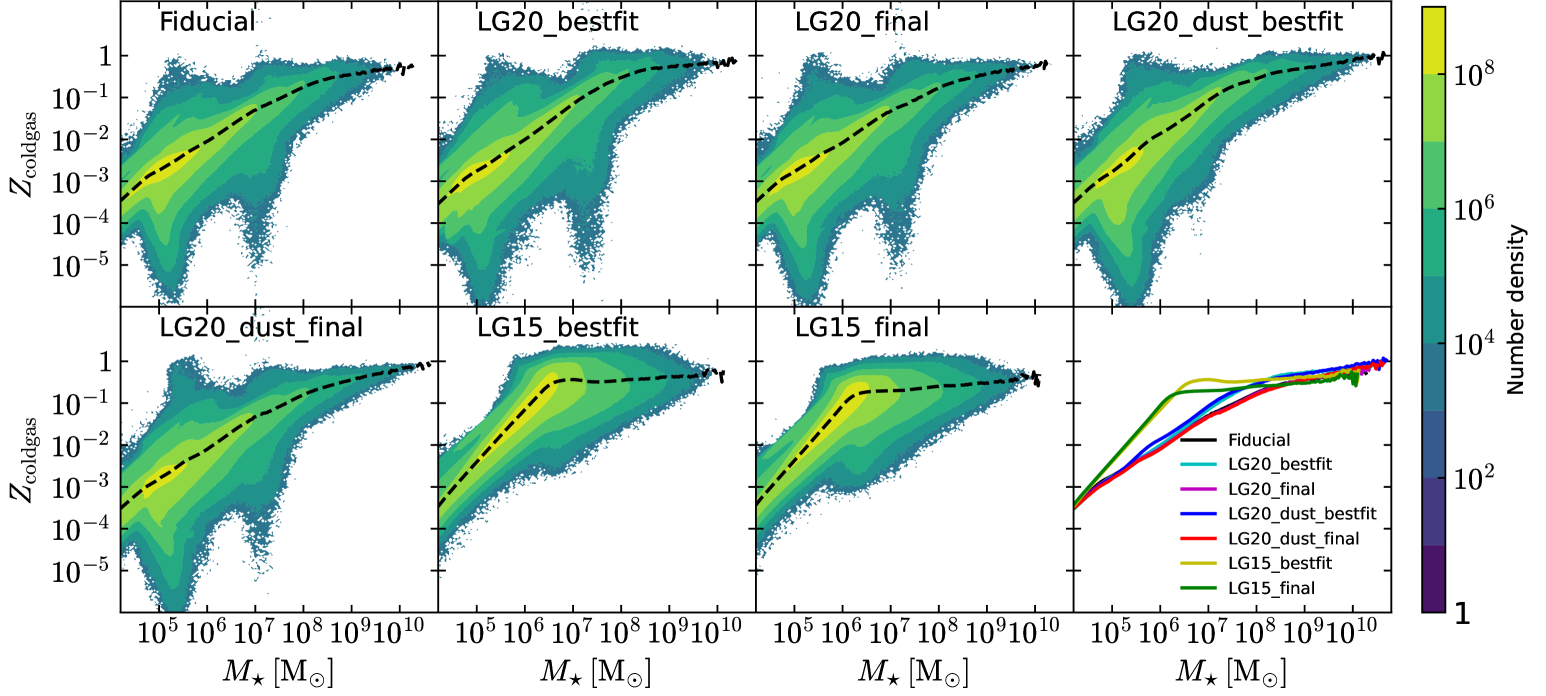
The top panel of Fig. 5 shows the 2-D distributions of cold gas metallicity as a function of stellar mass of galaxies at from all LG simulations, where , with galactic cold gas mass, metal mass within cold gas, and is the solar metallicity. Since the dust absorption of UV photons relates to the metallicity of cold gas, is important to compute the UVLF when considering the dust correction. LG20_bestfit and LG20_final show distributions similar to those of Fiducial. Their mean increases linearly in log-space with increasing at , while the increase is less rapid for . Although LG20_dust_bestfit and LG20_dust_final have more massive galaxies than Fiducial, their relation with is similar to that of Fiducial. The scatter of from LG15_bestfit and LG15_final is much smaller than in Fiducial at , but it becomes larger at . The mean from LG15_bestfit and LG15_final is much higher than the one from LG20 at , due to the lack of modelling time delay effects of the supernovae explosion which enrich the gas in LG15. Such differences can explain why dust correction clearly affects the UVLF shown in Clay et al. (2015) and computed with LG15, but has a small effect in the LG20 simulations (see the top panel of Fig. 2).
3.2 Budget of ionizing photons
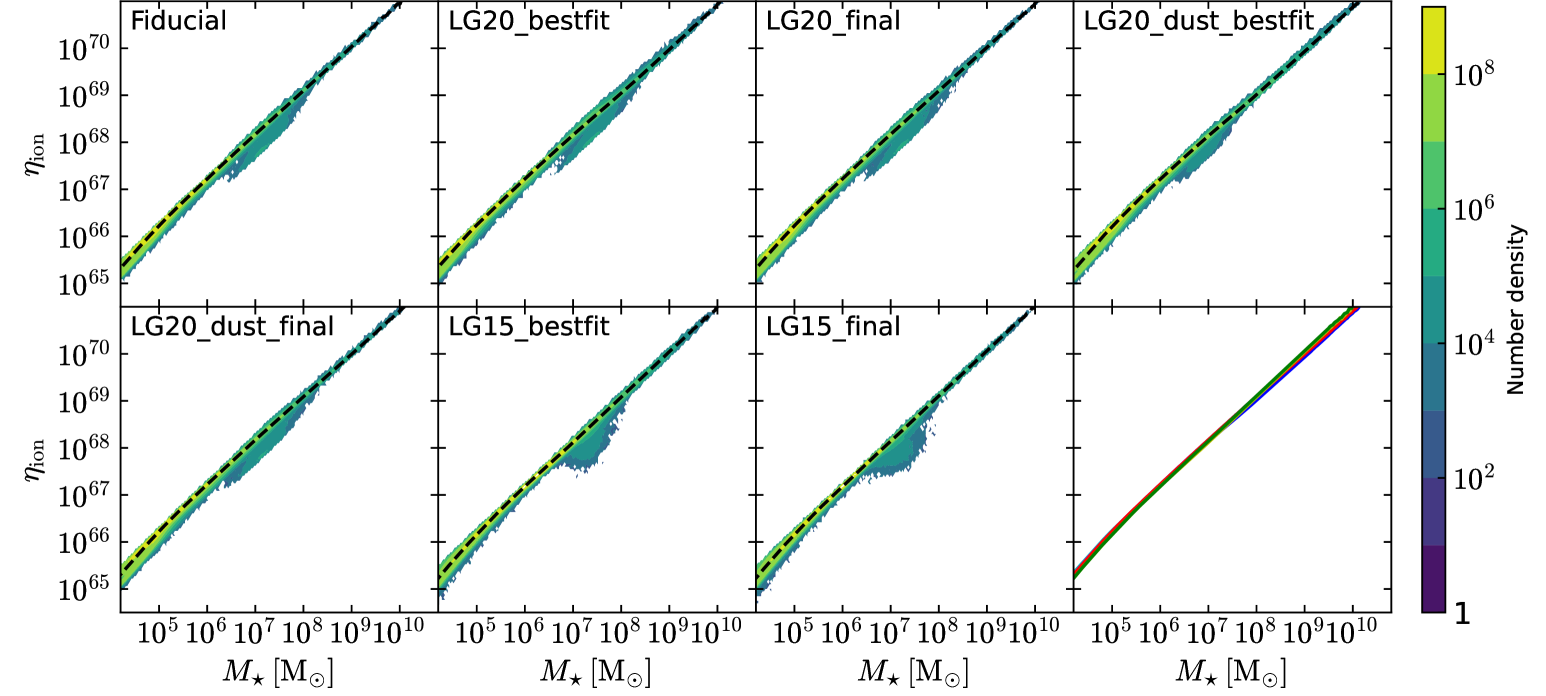
The bottom panel of Fig. 5 shows the 2-D distributions of time integrated ionizing photon number versus stellar mass at for all LG simulations. Following Ma et al. (2023) and Liu et al. (2024), is computed from the star formation history and metal enrichment of galaxies obtained from the LG simulations, combined with the SPS SEDs from BPASS, and it is the total ionizing photon number emitted from the birth of galaxies until the redshift under consideration (i.e. in the bottom panel of Fig. 5). Although the simulations show some clear differences in the stellar mass, SFR, UV luminosity and ionizing photon emission efficiency (see Fig. 8 later on), their are similar and exhibit a very small scatter at the same . This is because the integration along the star formation history of galaxies reduces the scatter caused e.g. by star bursts, supernovae and AGN feedback, and other processes associated to galaxy formation. In all LG simulations, is linearly related to in the log-space:
| (1) |
where is the efficiency factor and is the power-law index.
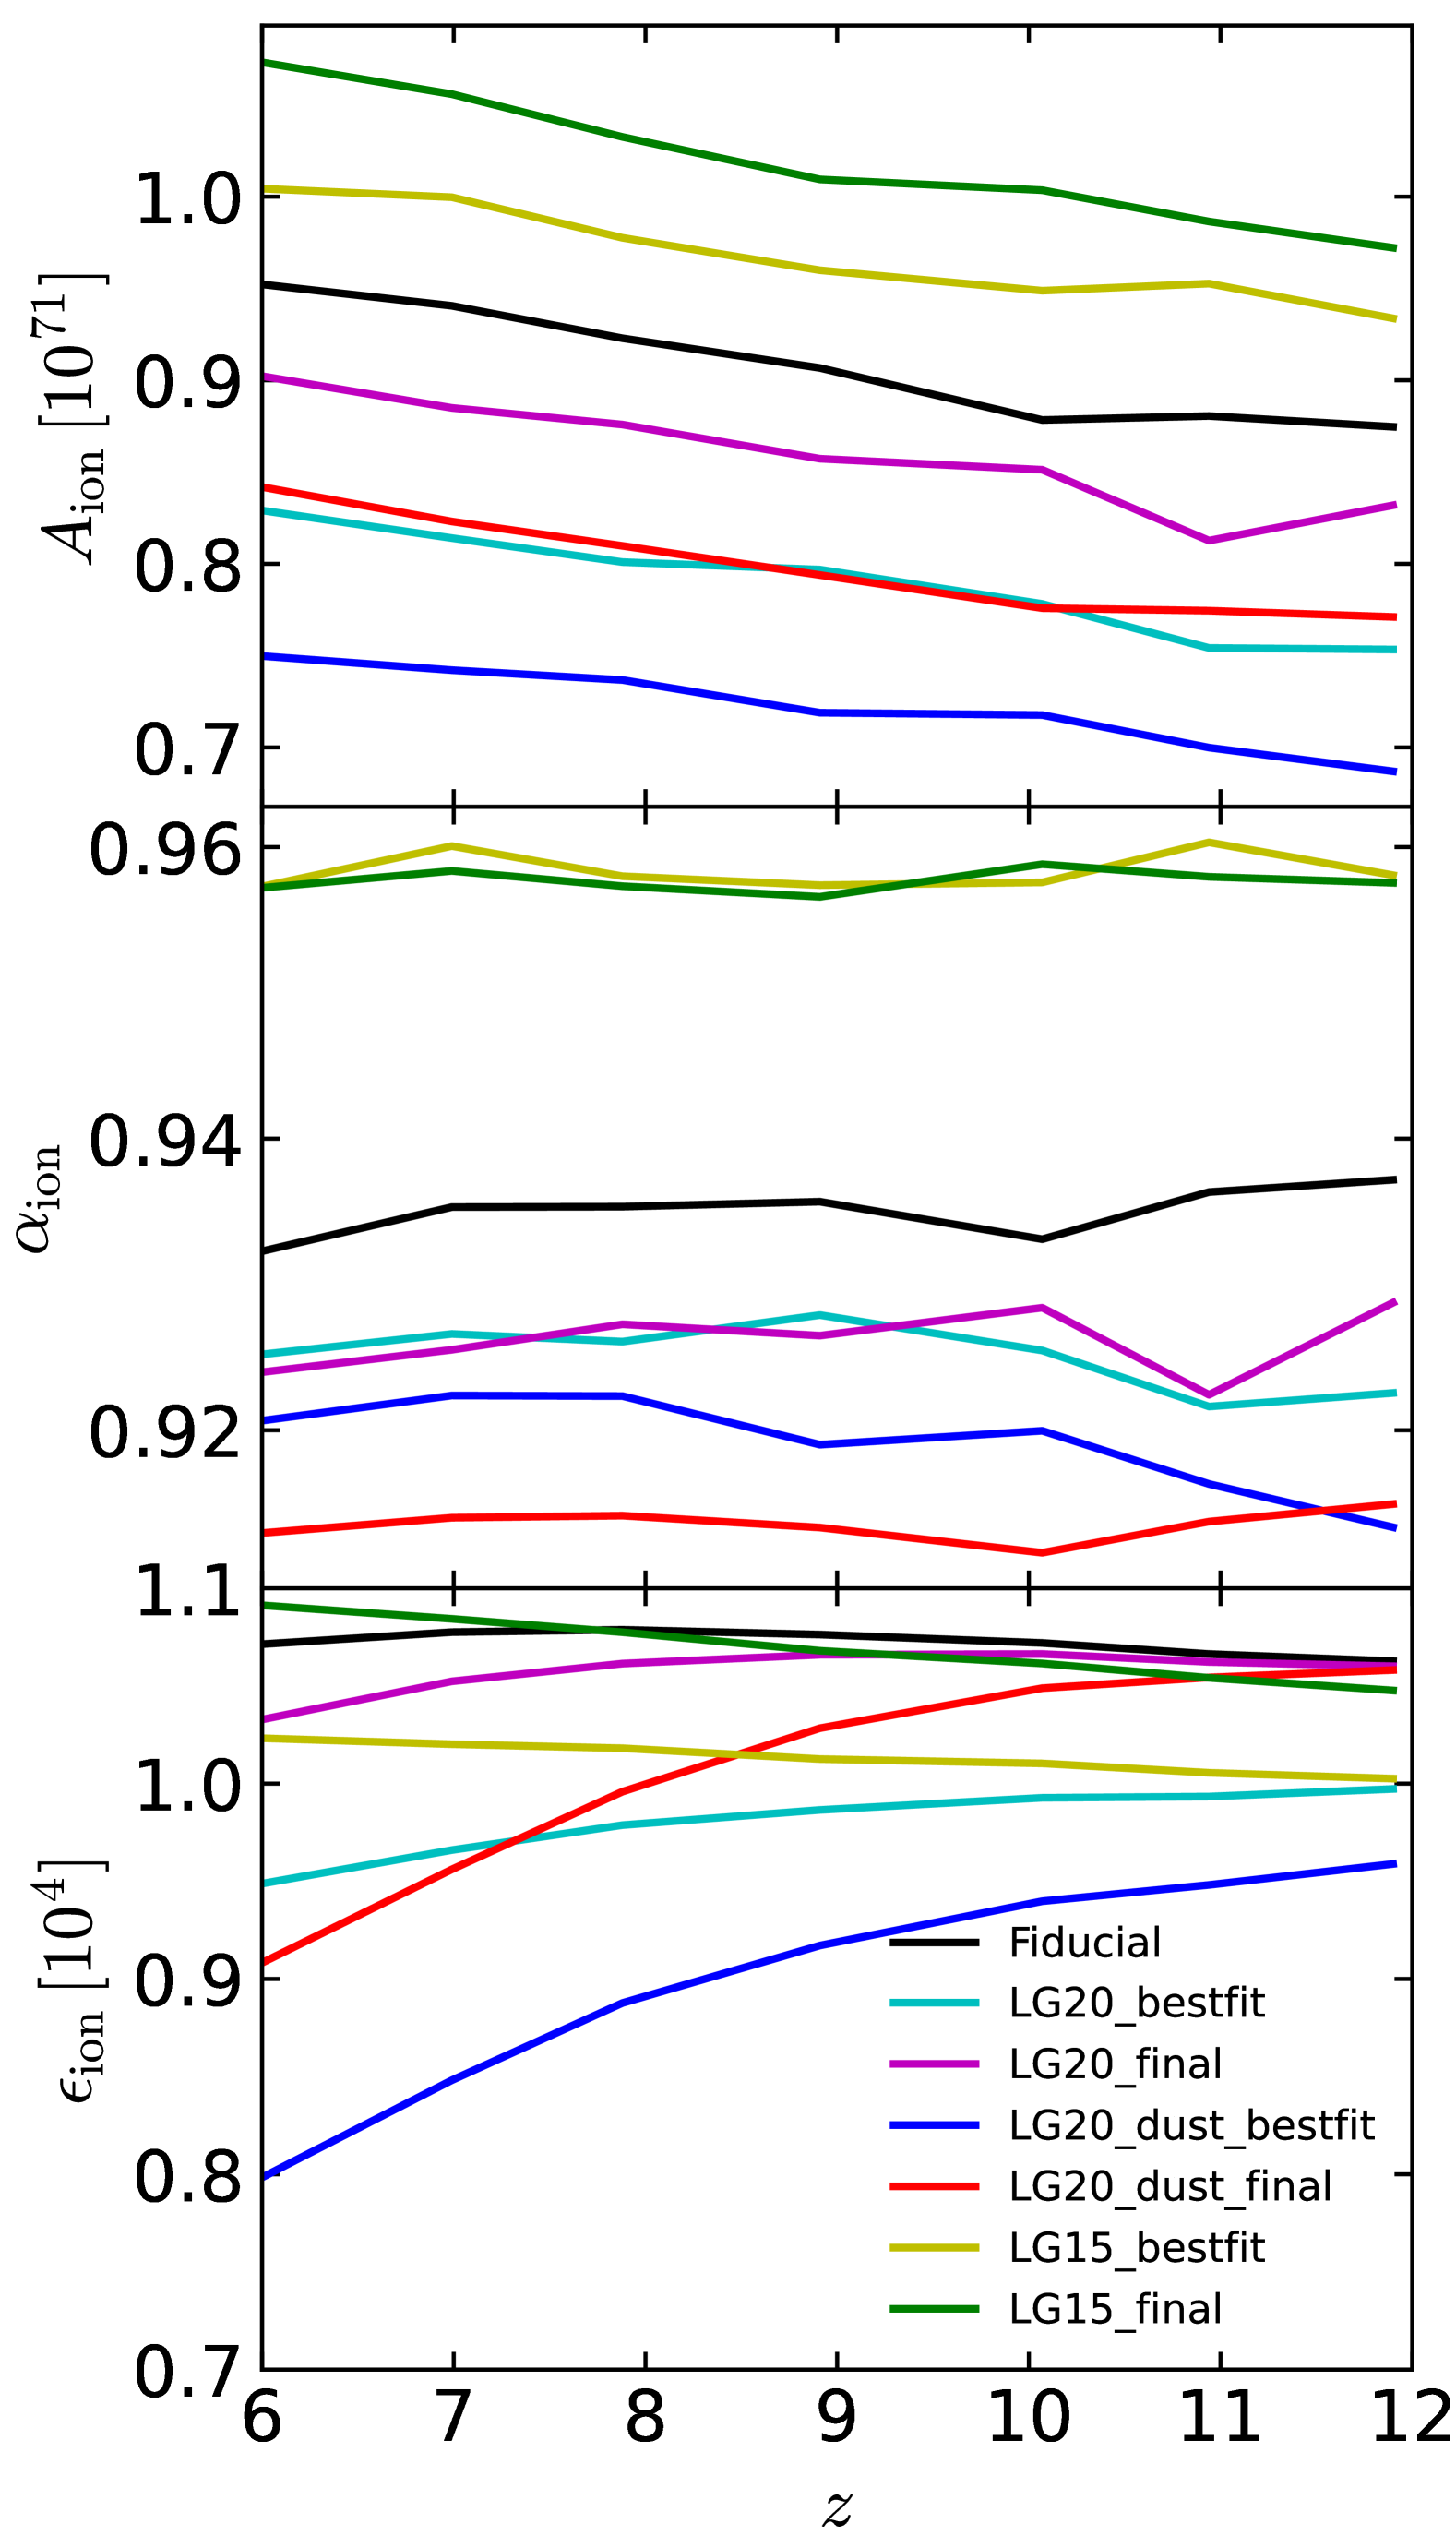
The evolution of and from to 6 is shown in the top and central panels of Fig. 6, respectively. We note that the above quantities are computed including only galaxies with , because of the incomplete sample of galaxies with lower . for all simulations is , and it increases slightly with decreasing ( from to 6). of LG20_bestfit, LG20_final, LG20_dust_bestfit and LG20_dust_final is , , and lower than the one from Fiducial, respectively. On the other hand, of LG15_bestfit and LG15_final is and higher than in Fiducial, respectively. Differently, from all simulations hardly displays a redshift evolution, with values in the range [0.9-1], which denotes a good linear relation between and . The of LG20_bestfit and LG20_final are slightly lower than Fiducial, while the ones of LG20_dust_bestfit and LG20_dust_final are much lower. The LG15_bestfit and LG15_final have higher than Fiducial.
We also estimate the ionizing photon number emitted per baryon within stars hosted in galaxies with , which is defined as:
| (2) |
where is the SMF of galaxies, and is the proton mass. The redshift evolution of is displayed in the bottom of Fig. 6. The of Fiducial is at , and shows a very weak redshift evolution. The of LG20_final is similar to the one of Fiducial, while the one of LG20_bestfit is at and reduces to at . The of LG20_dust_final is similar to Fiducial at but decreases to at . The one of LG20_dust_bestfit is at , but reduces quickly with decreasing , and it is only at . Differently to Fiducial, the of LG15_bestfit and LG15_final slightly increases with decreasing , becoming and at , respectively.
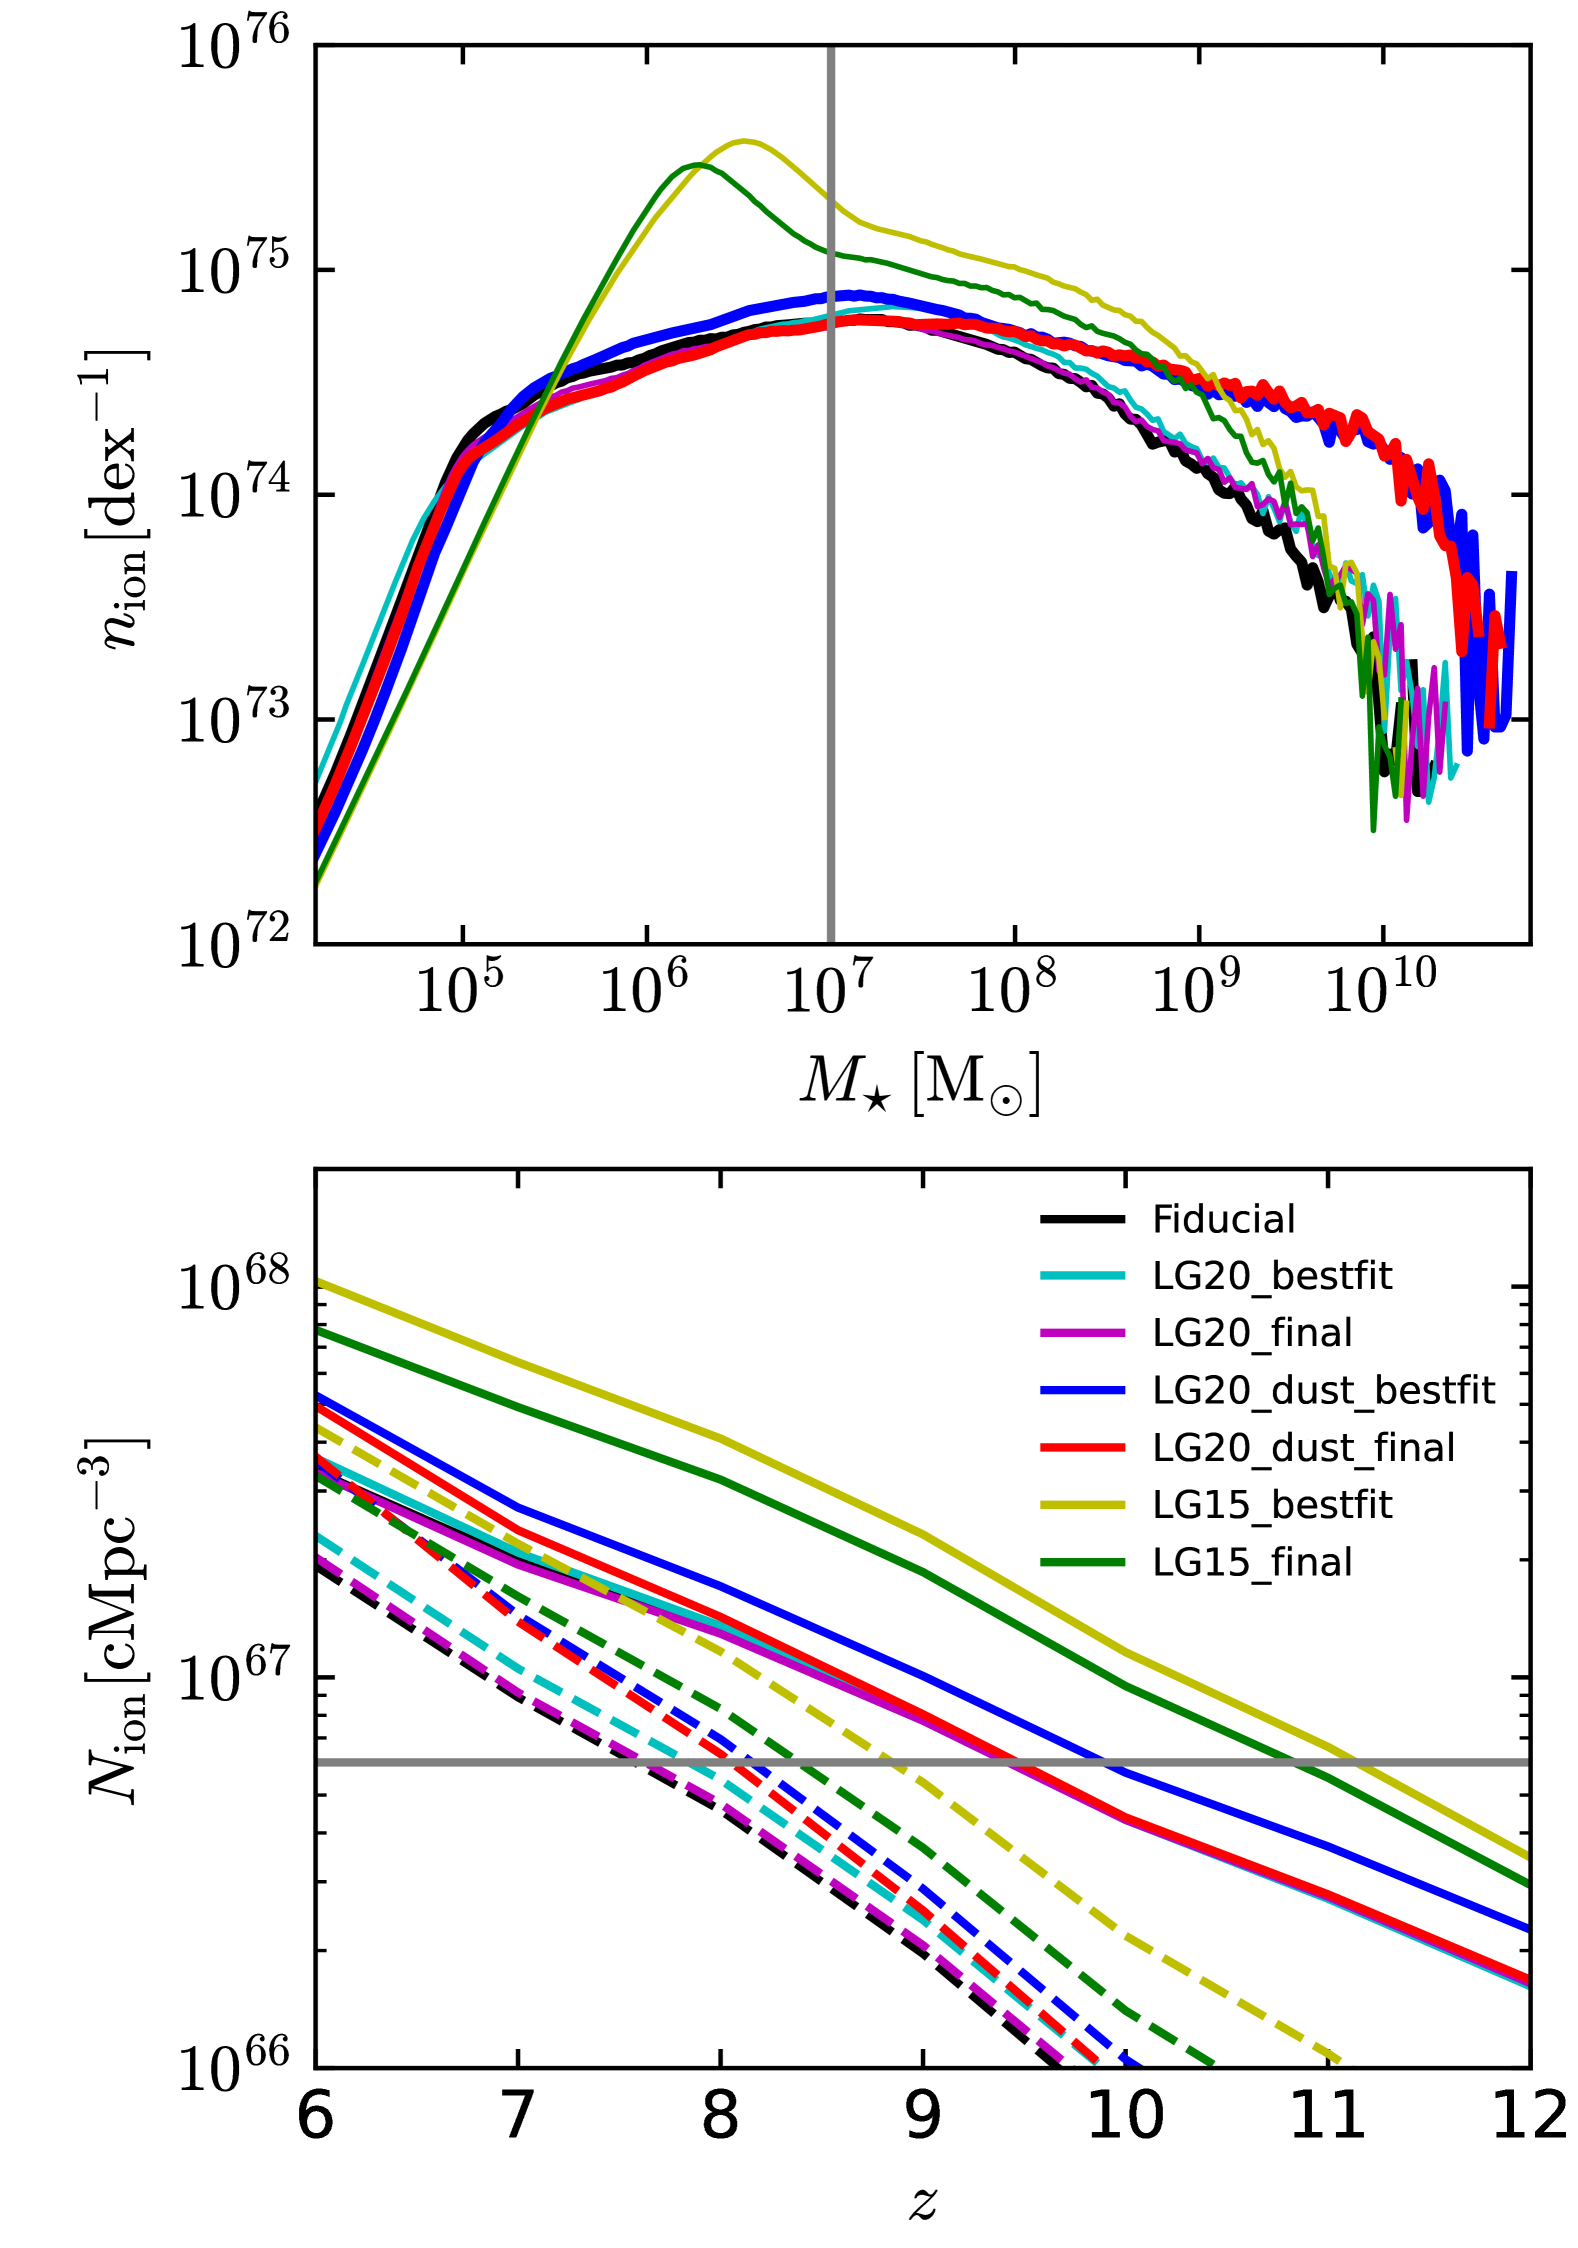
The top panel of Fig. 7 shows the distributions of ionizing photon number as a function of at for all LG simulations, where the ionizing photon number density in the th mass bin is defined as , with bin-width and sum of of all galaxies within the th bin. LG20_bestfit and LG20_final have a distribution similar to that of Fiducial, while LG20_dust_bestfit and LG20_dust_final have a higher distribution at , due to their larger SMF (see Fig. 2). The of LG15_bestfit and LG15_final are typically in between those of Fiducial and of LG20_dust_bestfit/LG20_dust_final at .
The bottom panel of Fig. 7 shows the volume averaged time integrated ionizing photon number densities estimated from all LG simulations, where , with denoting a sum over the galaxies, and the volume of the simulation box. In one case (solid lines) is calculated including all galaxies, while in another one (dashed) only those with are considered. As a reference, we also show the total number density of Hydrogen atom in the Universe, including both the neutral and ionized ones. For an escape fraction of ionizing photons of , would roughly denote the number density of ionizing photons needed to fully ionize the Universe, although it should be noted that gas recombination can substantially increase the required number of photons, in particular in high density regions. When all galaxies are included, the produced in our Fiducial case is above at , and it is times at . LG20_bestfit and LG20_final produce similar results. With LG20_dust_bestfit and LG20_dust_final we obtain more ionizing photons than Fiducial at , while LG15_bestfit and LG15_final produce and more than Fiducial, respectively. When including only galaxies with , the estimated of Fiducial remains above at , and it is times at . The LG20_dust_bestfit and LG20_dust_final simulations have more ionizing photons than Fiducial at the same redshift, while LG15_bestfit and LG15_final have and larger than Fiducial, respectively. We note that with the assumption of an escape fraction of , only LG15_bestfit and LG15_final including all galaxies would have at , while most cases have at , i.e. an escape fraction of would be needed to produce a number of photons equal to the number of Hydrogen atoms.
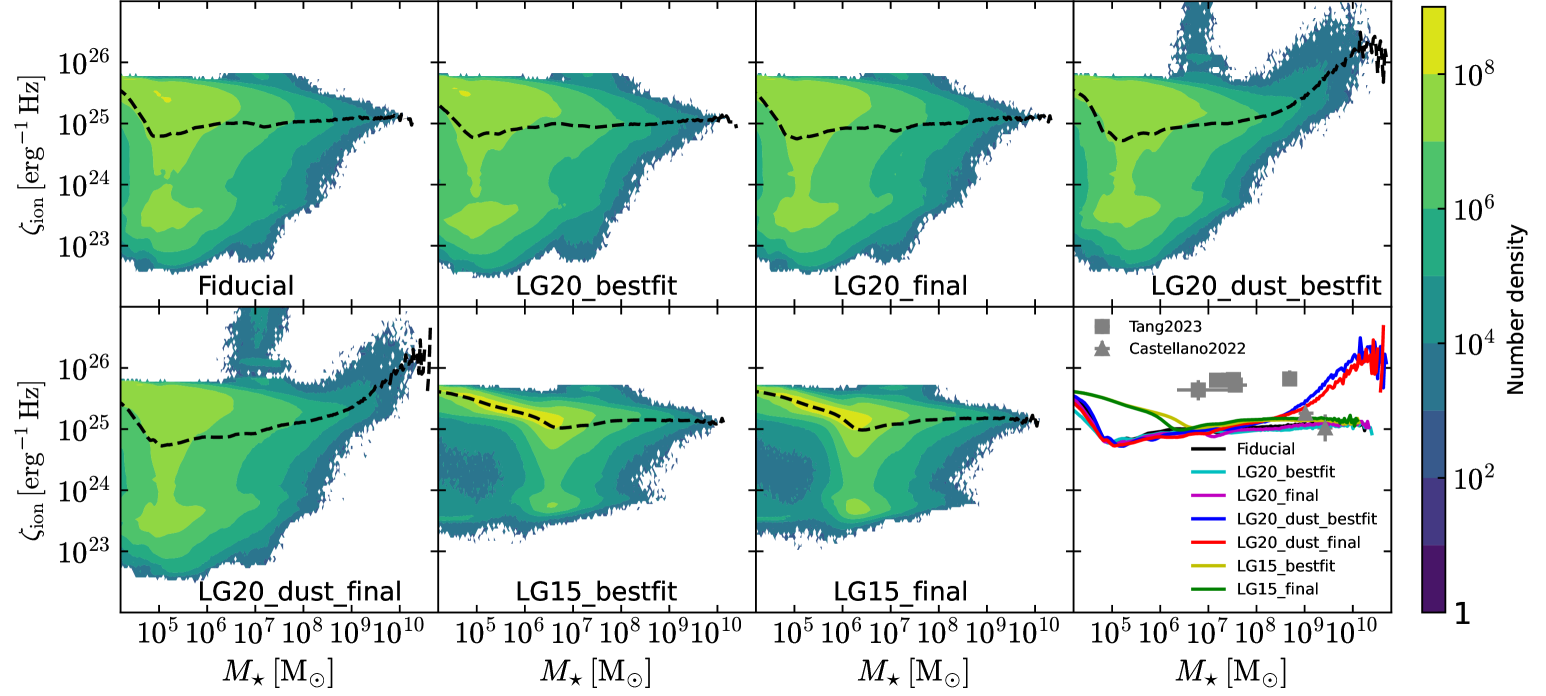
The top panel of Fig. 8 shows the 2-D distributions of ionizing photon emission efficiency versus stellar mass at from all LG simulations, where is defined as the ionizing photon emitted per second divided by the UV luminosity (i.e. unit ) at Å(see e.g. Wilkins et al., 2016; Liu et al., 2024). As a comparison, we also show the observational results from Castellano et al. (2022) and Tang et al. (2023). The LG20_bestfit and LG20_final have distributions similar to those of Fiducial, with a very large scatter at , spanning the range . Galaxies in LG20_dust_bestfit and LG20_dust_final have a at higher than Fiducial, as dust absorption reduces the UV luminosities of massive galaxies, leading to a higher . Some galaxies in LG20_dust_bestfit and LG20_dust_final can even have at . LG15_bestfit and LG15_final have higher than Fiducial at , due to their larger SFR, as shown in the bottom of Fig. 3. Our estimated is consistent with observations from Castellano et al. (2022), while they are lower than the ones from Tang et al. (2023).
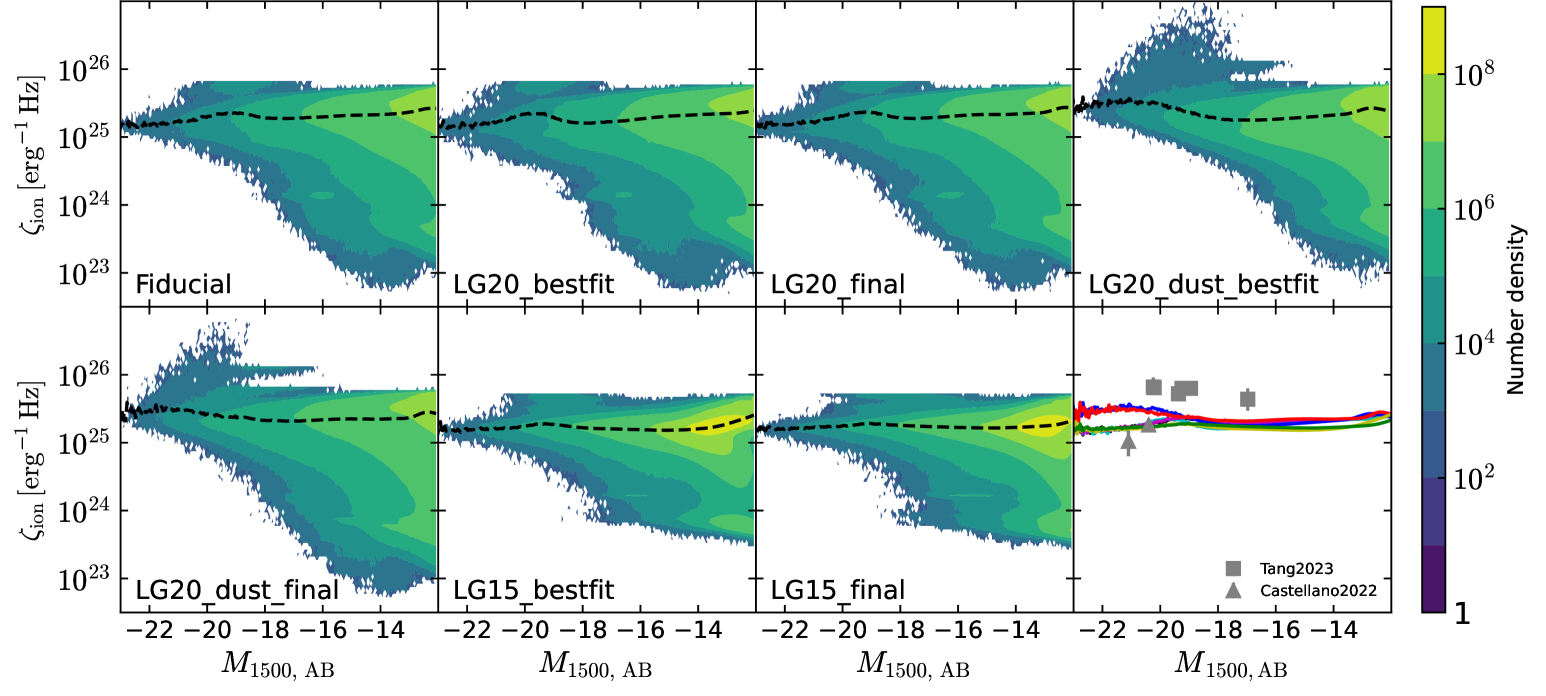
The bottom panel of Fig. 8 shows the 2-D distributions of versus at from all LG simulations, together with observational results from Castellano et al. (2022) and Tang et al. (2023). As in the top panel of the figure, LG20_bestfit and LG20_final have distributions similar to those of Fiducial. As dust correction reduces the UV luminosity of bright galaxies, the of LG20_dust_bestfit and LG20_dust_final are higher than in Fiducial at . The of LG15_bestfit and LG15_final show a smaller scatter than Fiducial, while their mean versus are consistent with the latter. Similarly to the top panel of the figure, our estimated is consistent with the observational results from Castellano et al. (2022), while globally lower than the ones of Tang et al. (2023).
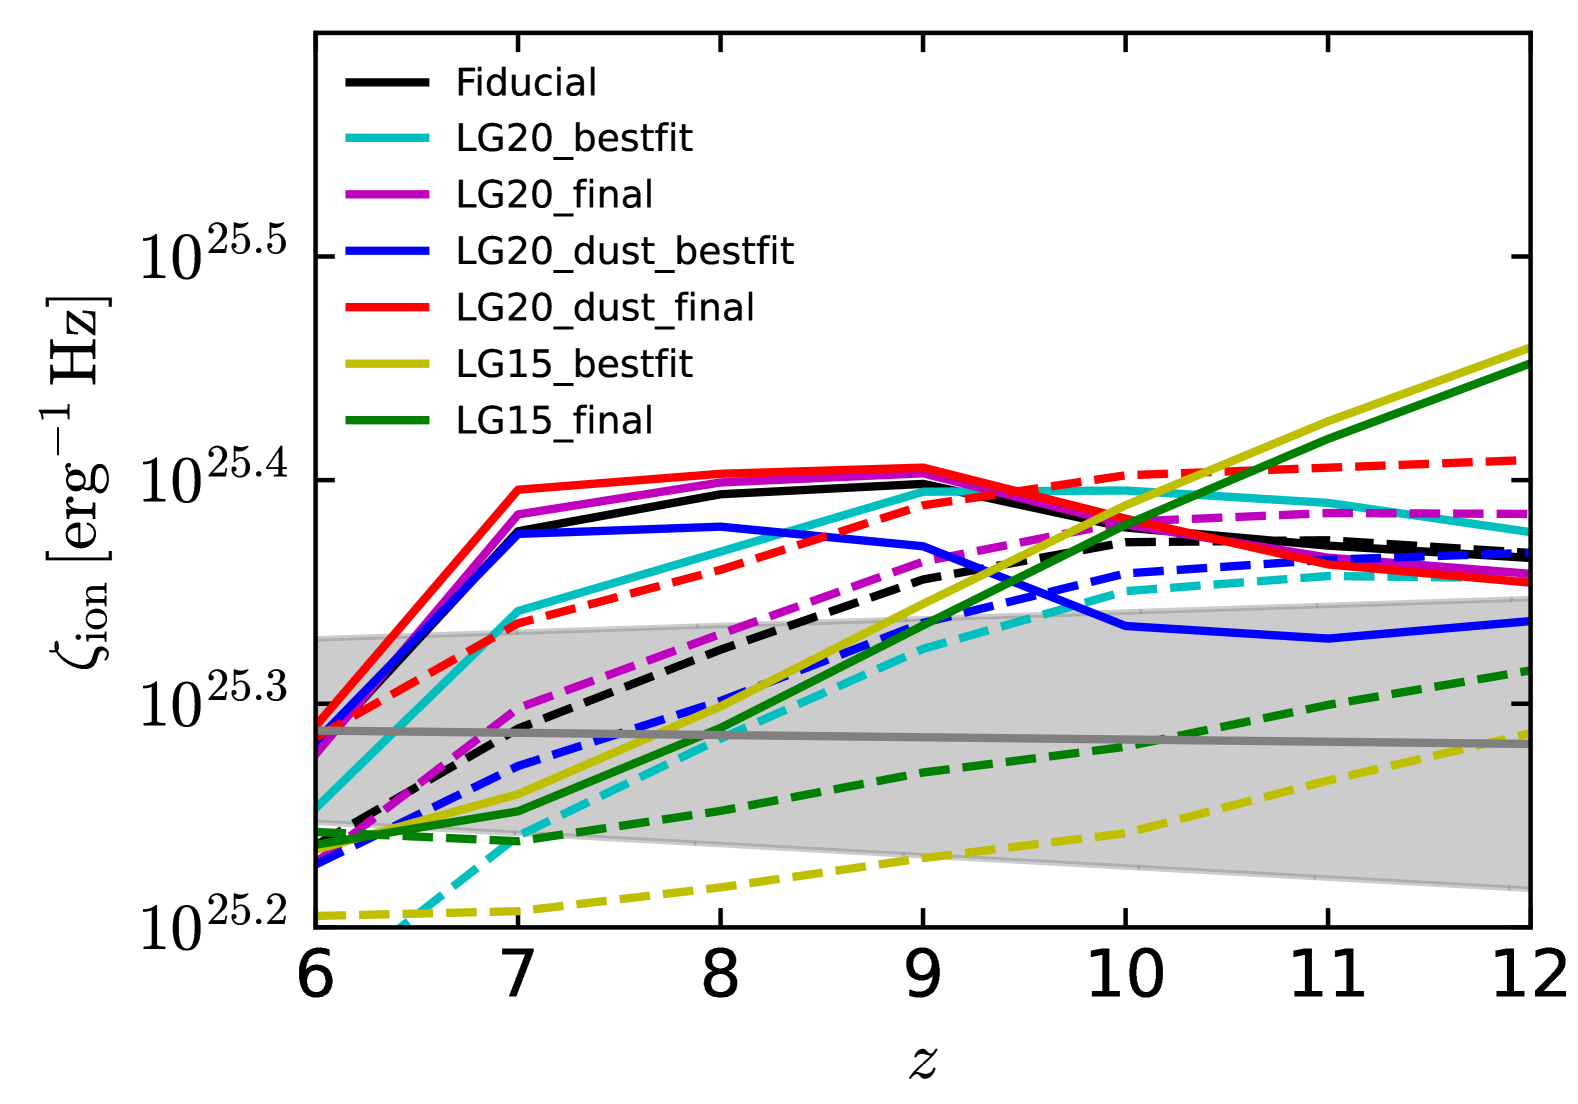
Fig. 9 shows the evolution of the average of galaxies from the seven LG simulations as functions of . In one case (solid lines) is computed including all galaxies, while in another one (dashed lines) only those with are considered. As a reference, we also show the fit obtained for the measured in the photometric sample of Simmonds et al. (2024). When all galaxies are included, the average from LG20 simulations is within , which increases slightly with decreasing from to 9, while it decreases from to 6. The from LG15 simulations shows a visible decline with decreasing , from at to at . When removing the very faint galaxies, i.e. including only galaxies with , of all simulations roughly decreases with decreasing . The ones of LG15 simulations are globally lower than those of LG20 simulations. Our results are roughly consistent with the fitting equation of photometric samples from Simmonds et al. (2024) at , while higher than the latter at . Note that the fitting equation of Simmonds et al. (2024) is the result of observations at , and that at the curve is just an extrapolation.
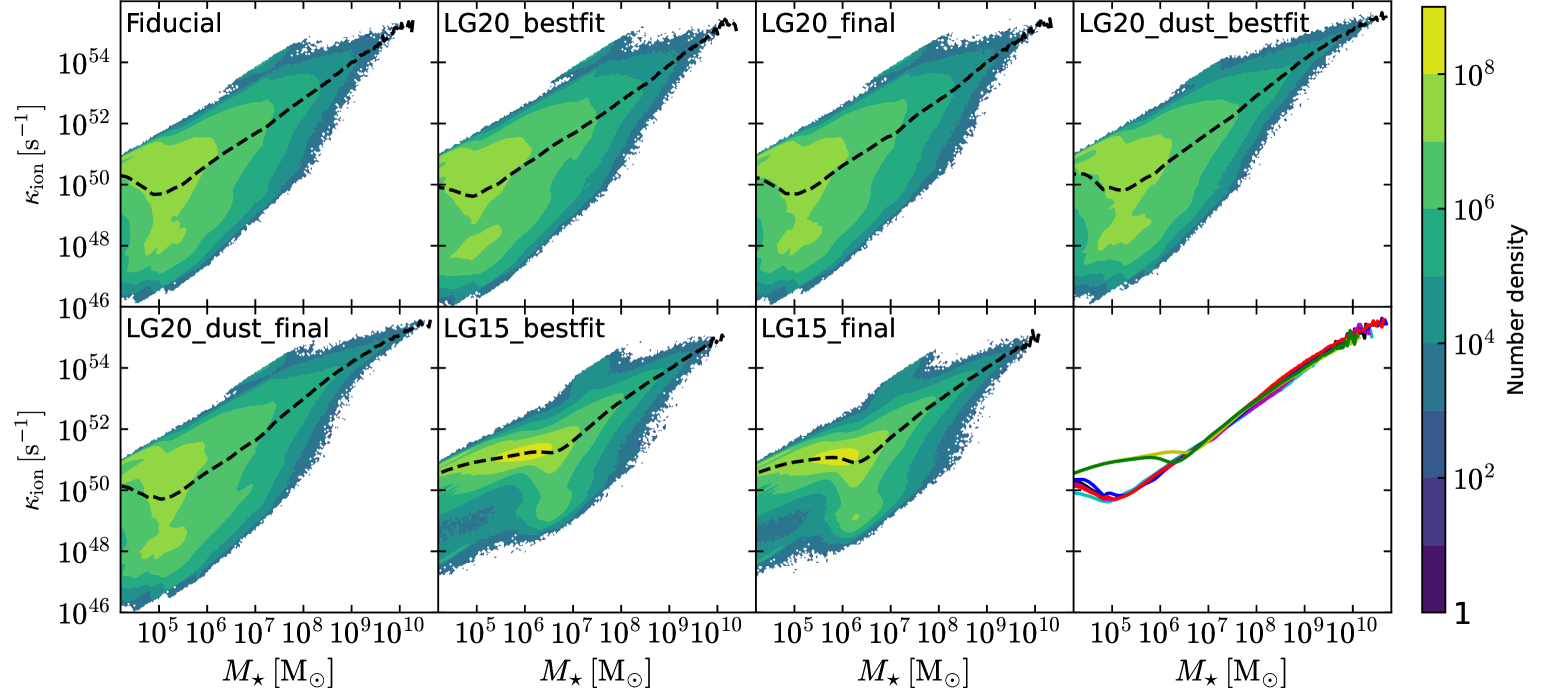
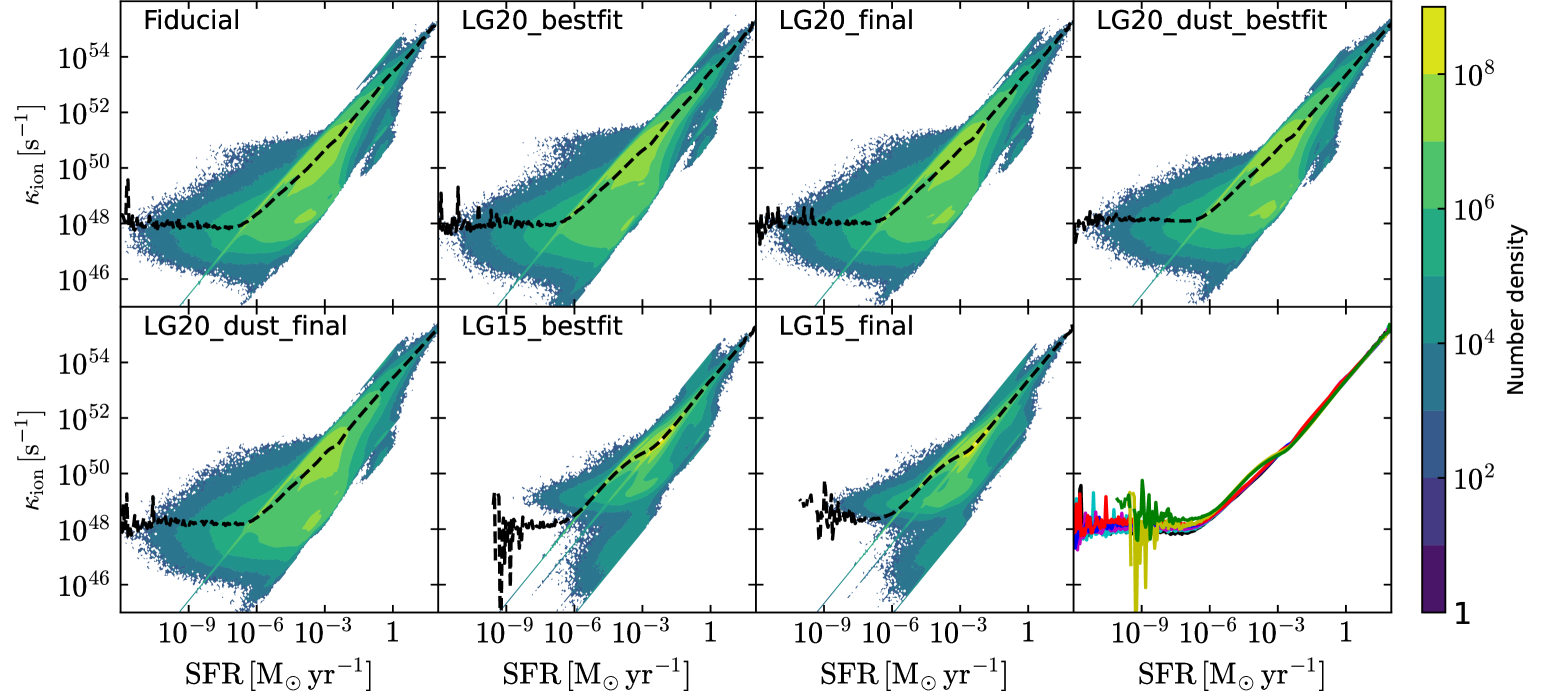
The top panel of Fig. 10 shows the 2-D distributions of ionizing photon production efficiency versus stellar mass at from all LG simulations, where is the ionizing photon emitted per second by galaxies. The LG20_bestfit, LG20_final, LG20_dust_bestfit and LG20_dust_final have distributions similar to those of Fiducial, with a large scatter at . LG15_bestfit and LG15_final have higher than Fiducial at , due to their larger SFR, as shown in the bottom of Fig. 3. The bottom panel of Fig. 10 shows the 2-D distributions of versus SFR at from all LG simulations. As in the top panel of the figure, LG20_bestfit, LG20_final, LG20_dust_bestfit and LG20_dust_final have distributions similar to those of Fiducial. Since LG15_bestfit and LG15_final do not have many galaxies with SFR as shown at the bottom of Fig. 3, their show a smaller scatter than Fiducial at SFR , while their mean versus SFR are consistent with the latter. Thus, we can conclude that the relation of with and SFR is insensitive to the choice of galaxy formation models. Further, the large scatter in the relations is due to the variations of star formation history and metallicity of different galaxies.
4 Conclusions and Discussions
With the increasing number and quality of observations from the JWST telescope, it is now possible to put constrains on galaxy formation models during the Epoch of Reionization (EoR). In this paper, we use the Markov Chain Monte Carlo (MCMC) method to fit galaxy formation models with UV luminosity functions (UVLF) observed by HST and JWST at , by combining the high-resolution N-body dark matter simulation Jiutian-300 and the semi-analytical galaxy formation model L-Galaxies (LG). We then explore the galaxy properties and budget of ionizing photons during the EoR with the best-fit parameter values of the LG models.
We do three sets of MCMC calculations, the first one with L-Galaxies 2020 (LG20) by assuming no dust correction on the UV luminosity, the second one also with LG20 but with dust correction, and the last one with L-Galaxies 2015 (LG15) and no dust correction. The MCMC fittings are done for 15 of the LG20 and 16 of the LG15 free parameters which govern the galaxy formation and evolution process. We then run seven sets of LG simulations to explore the galaxy properties and the budget of ionizing photons during the EoR. Our Fiducial model adopts the parameter values from Henriques et al. (2020). Three simulations have the best-fit parameter values from the three MCMC runs. Since most free parameters are not well constrained by UVLF observations (see also the discussions in Ma et al., 2023), we run three additional sets of LG simulations that adopt the best-fit values of parameters which are well limited by UVLF observations (i.e. , , and for LG20, and and for LG15), while the others are assumed to be the original ones in LG20 (Henriques et al., 2020) and LG15 (Henriques et al., 2015).
We find that with the fine-tuned sets of parameter values, both LG15 and LG20 can produce UVLF consistent with observations, while they still predict different budget of ionizing photons due to their different prescription for star formation. Specifically, as dust correction reduces the bright end of the UVLF (), its inclusion in the MCMC calculation results in a higher star formation efficiency, which increases the stellar mass functions (SMF) at , and thus in a higher budget of ionizing photons. The SMF from LG20 simulations that include dust correction in the MCMC calculation is more consistent than the other simulations with SMF observations at (Stefanon et al., 2021; Navarro-Carrera et al., 2024). Because of the different prescription for the star formation process, the LG15 simulations have SFR and stellar mass higher than LG20 in low-mass halos (), and as a consequence a larger SFR density, which predict more ionizing photons than LG20 models. Additionally, the cold gas metallicity of galaxies with stellar mass in LG15 is much higher than in LG20, which can explain why the dust correction reduces significantly the UVLF in Clay et al. (2015), who used LG15, but its effect is not very strong for the results obtained with LG20.
In all seven LG simulations, the total number of ionizing photons after time integration along the star formation history of galaxies is linearly related to their stellar mass through a power-law relation with index . We also estimate the number of ionizing photons emitted per baryon () within stars, finding that for all simulations, and that it slightly decreases with decreasing . Our estimated ionizing photon emission efficiency is not sensitive to the stellar mass in galaxies nor to the absolute magnitude at Å. However, in models including the dust correction on the UV luminosity, the is higher in the massive and bright galaxies than in the smaller ones.
Appendix A Analysis of MCMC samples
Since the number of merger trees from N-body simulations is too huge to perform MCMC, Henriques et al. 2013 proposed to randomly sample only a small fraction of the trees. To make sure the selected trees still include enough galaxies to properly compute the galaxy properties, such as the UVLF, the results of one full L-Galaxies simulation are adopted to compute how many FOF halos (i.e. ) are needed in each halo bin to match the full UVLF, by following (see Appendix B of Henriques et al. 2013):
| (A1) |
where is the number of FoF halos in the th halo mass bin, is the fraction of the rms uncertainty of estimated UVLF over its true value, is the average number of galaxies in a UV luminosity bin for the halos in a halo mass bin , is the UVLF in the UV luminosity bin , and is the total number of halo mass bins. Note that is from the N-body dark matter simulation, and are from the Fiducial L-Galaxies simulation, and to make sure the uncertainty of the estimated UVLF is smaller than the observational ones.
To make the MCMC efficient, we do not adopt the merger trees with the most massive but rare FOF halos, which might make the reproduced UVLF from random merger tree samples different from the one from the full L-Galaxies simulation. We thus remove the UV luminosity bins if their differences are when performing the MCMC. Since such differences only happen at the bright end of UVLF, we set a cut-off on as shown in Fig. 2.
We compute the MCMC chains with the Metropolis-Hastings method (see Appendix B of Henriques et al. 2013 for more details), with flat priors for the fitted parameters. The likelihood we adopted is the of UVLF, i.e. the , where is the observed UVLF, is the simulated UVLF, and is the error of observed UVLF. The proposed parameters in one step are accepted when one random number (flat probability) between 0 and 1, where is the of previous step. As mentioned in subsection 2.3, we do three sets of MCMC runs. For each run, we have samples on the chains. We use the python package GetDist 222https://getdist.readthedocs.io/ to do the MCMC sample analysis (Lewis, 2019). As suggested by GetDist, during the analysis we drop the first 30% of samples.
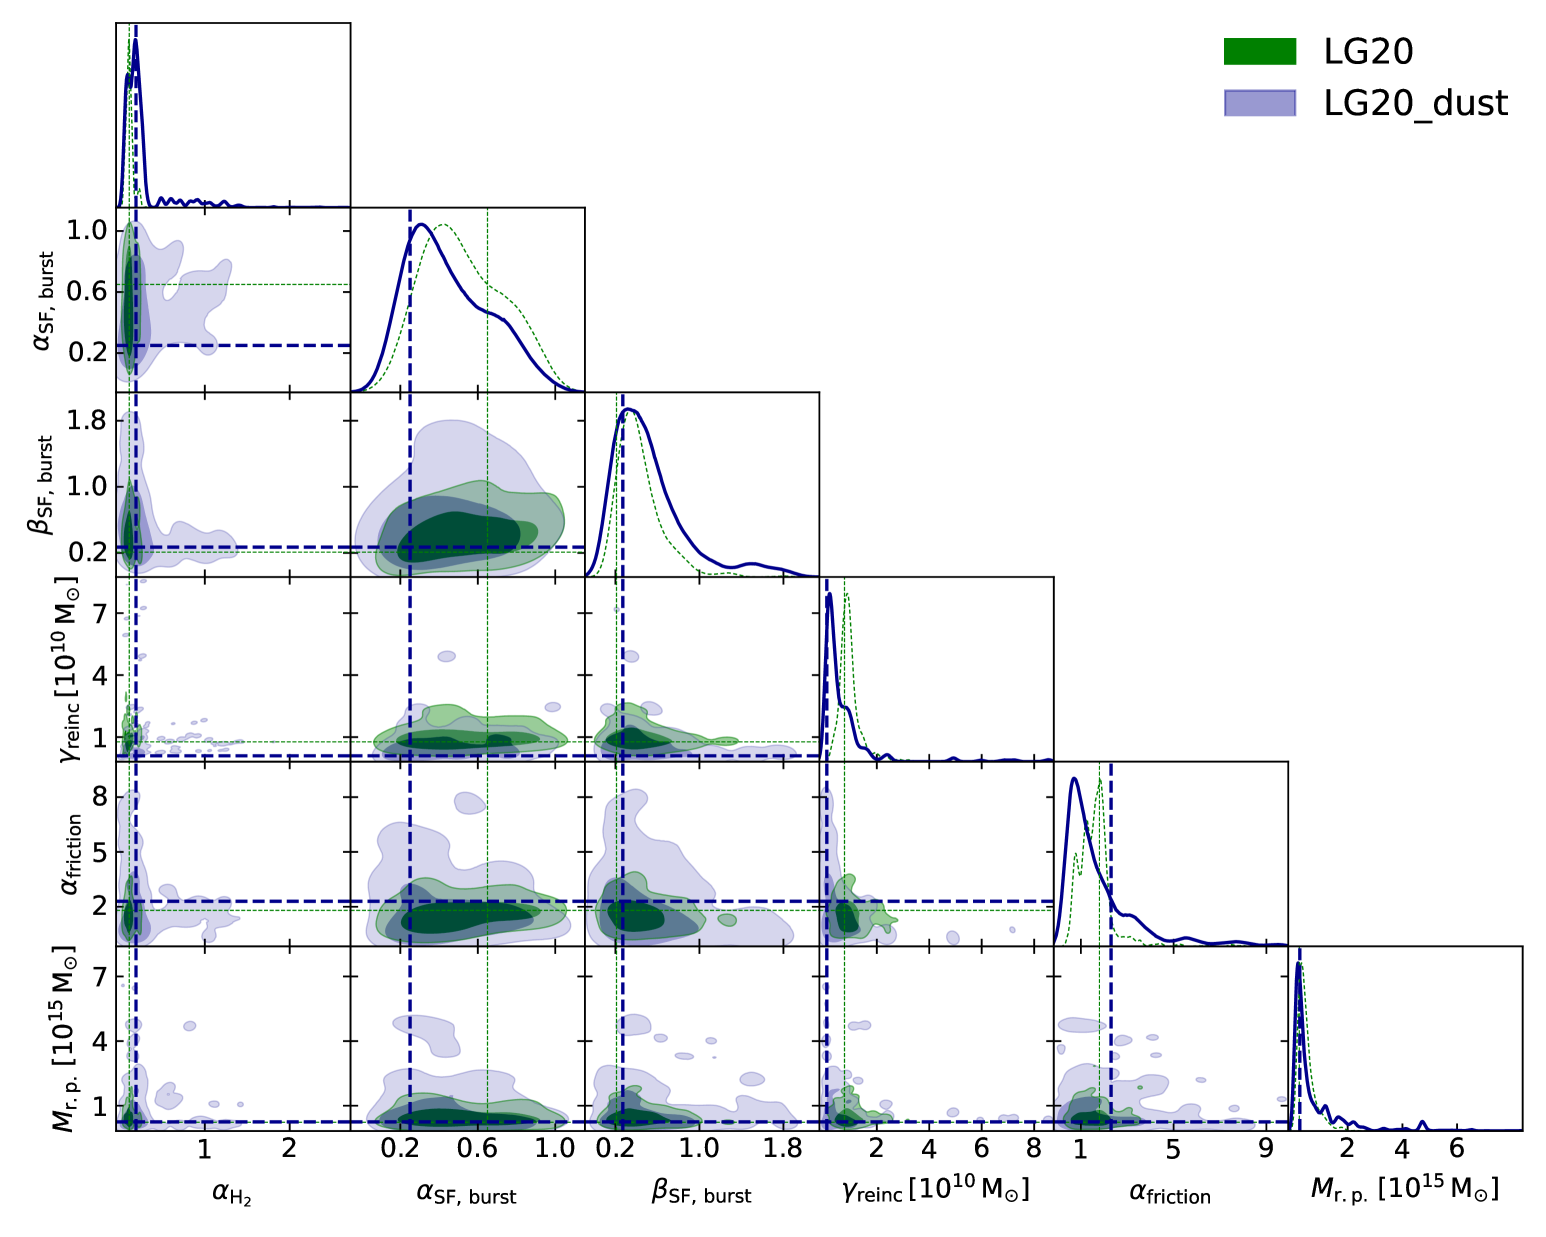
We find that most galaxy formation parameters are weakly limited by the UVLF observations (see the discussions in Ma et al. 2023). To make the results clearly visible, in Fig. 11 we show the 1- () and 3- () ranges of only 6 free parameters in LG20, including the case without dust correction on UVLF (named LG20) and the case with dust correction on UVLF (named LG20_dust). 4 of the 6 free parameters are well constrained by the UVLF observations at , i.e. , , and . We note that both in LG20 and LG20_dust, the original values of the 15 parameters in LG20 from Henriques et al. (2020) are within the 1- ranges limited by the UVLF at , i.e. the original parameter values of LG20 are already good at reproducing the UVLF observations at (see the top panel of Fig. 2).
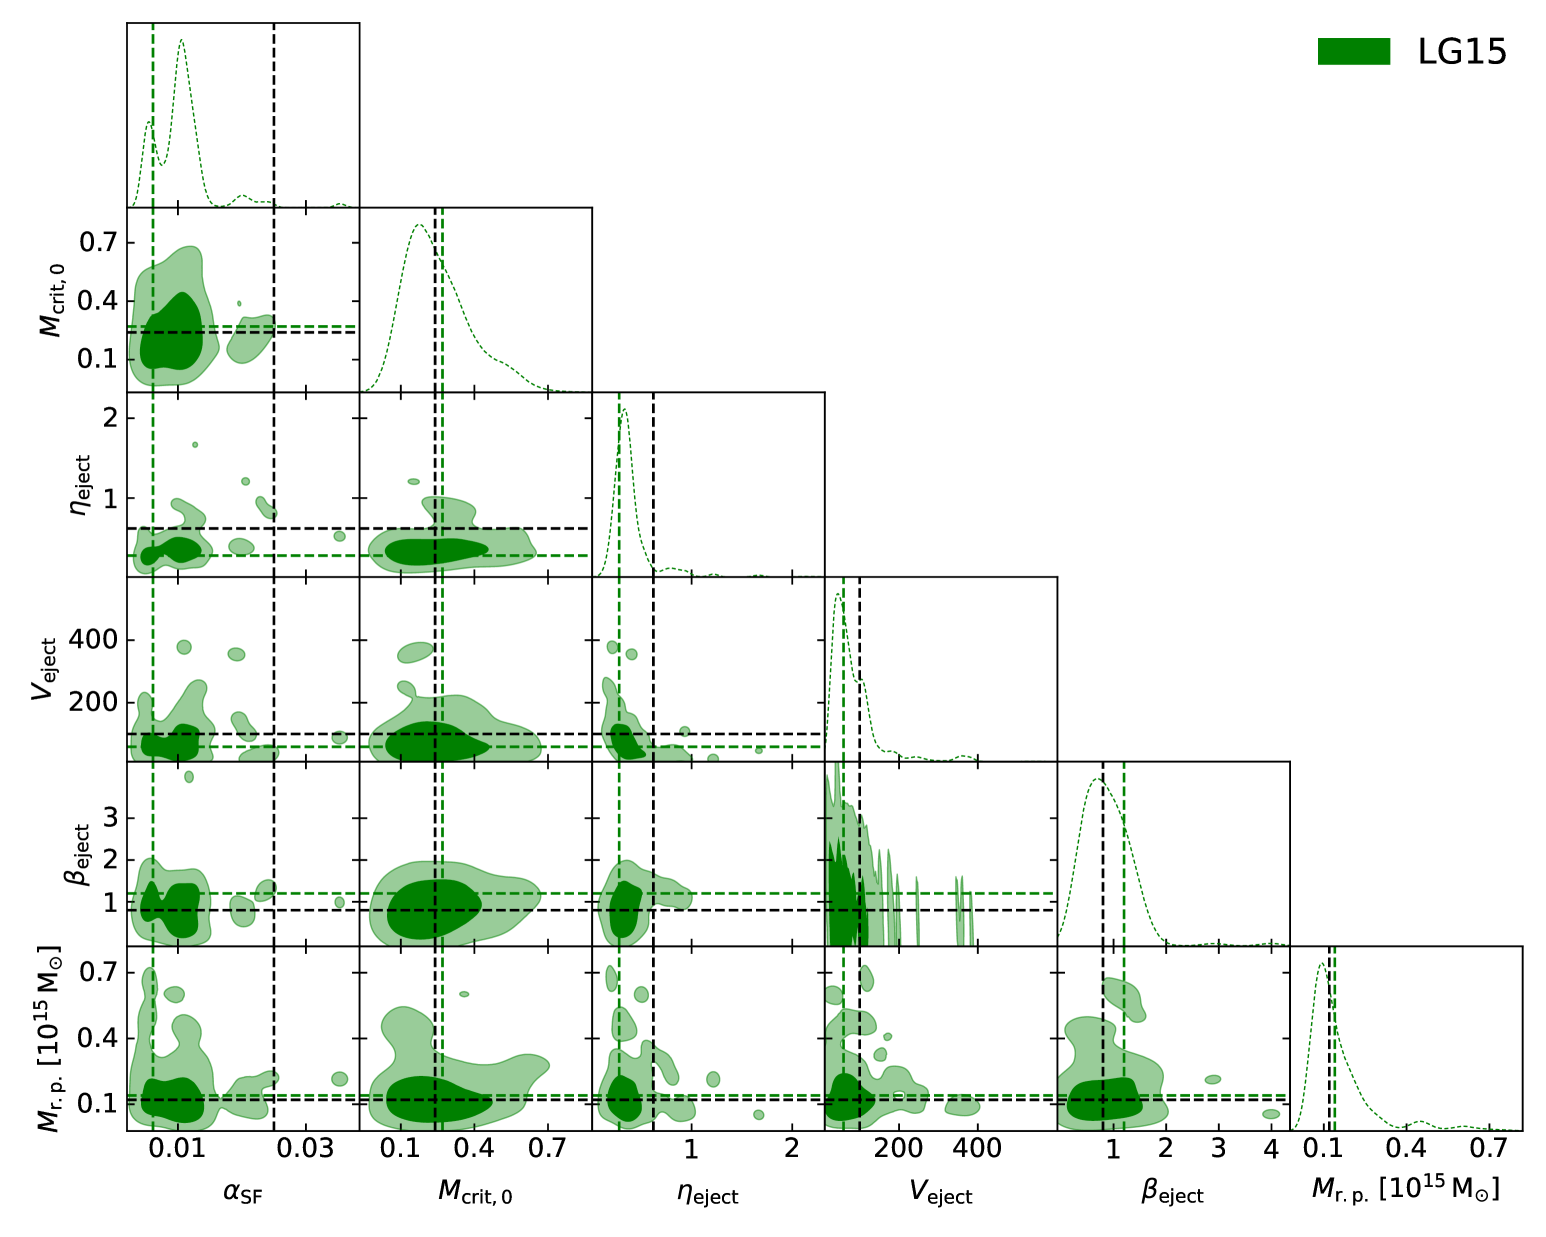
In Fig. 12, we show the 1- () and 3- () ranges of 6 free parameters in LG15. As a reference, we also show the positions of the original values in LG15 from Henriques et al. (2015). We find that the original values of two parameters are beyond the 1- range limited by the UVLF observations at , i.e. and . Note that our best-fit is only of the original value.
References
- Abdurashidova et al. (2022) Abdurashidova, Z., Aguirre, J. E., Alexander, P., et al. 2022, ApJ, 925, 221, doi: 10.3847/1538-4357/ac1c78
- Acharya et al. (2024a) Acharya, A., Mertens, F., Ciardi, B., et al. 2024a, MNRAS, 534, L30, doi: 10.1093/mnrasl/slae078
- Acharya et al. (2024b) Acharya, A., Ma, Q.-b., Giri, S. K., et al. 2024b, arXiv e-prints, arXiv:2410.11620, doi: 10.48550/arXiv.2410.11620
- Adams et al. (2024) Adams, N. J., Conselice, C. J., Austin, D., et al. 2024, ApJ, 965, 169, doi: 10.3847/1538-4357/ad2a7b
- Becker et al. (2015) Becker, G. D., Bolton, J. S., Madau, P., et al. 2015, MNRAS, 447, 3402, doi: 10.1093/mnras/stu2646
- Bhagwat et al. (2024) Bhagwat, A., Costa, T., Ciardi, B., Pakmor, R., & Garaldi, E. 2024, MNRAS, 531, 3406, doi: 10.1093/mnras/stae1125
- Bosman et al. (2022) Bosman, S. E. I., Davies, F. B., Becker, G. D., et al. 2022, MNRAS, 514, 55, doi: 10.1093/mnras/stac1046
- Bouwens et al. (2020) Bouwens, R., González-López, J., Aravena, M., et al. 2020, ApJ, 902, 112, doi: 10.3847/1538-4357/abb830
- Bouwens et al. (2015) Bouwens, R. J., Illingworth, G. D., Oesch, P. A., et al. 2015, ApJ, 803, 34, doi: 10.1088/0004-637X/803/1/34
- Bouwens et al. (2021) Bouwens, R. J., Oesch, P. A., Stefanon, M., et al. 2021, AJ, 162, 47, doi: 10.3847/1538-3881/abf83e
- Carniani et al. (2024) Carniani, S., Hainline, K., D’Eugenio, F., et al. 2024, Nature, 633, 318, doi: 10.1038/s41586-024-07860-9
- Castellano et al. (2022) Castellano, M., Pentericci, L., Cupani, G., et al. 2022, A&A, 662, A115, doi: 10.1051/0004-6361/202243348
- Clay et al. (2015) Clay, S. J., Thomas, P. A., Wilkins, S. M., & Henriques, B. M. B. 2015, MNRAS, 451, 2692, doi: 10.1093/mnras/stv818
- Croton et al. (2006) Croton, D. J., Springel, V., White, S. D. M., et al. 2006, MNRAS, 365, 11, doi: 10.1111/j.1365-2966.2005.09675.x
- Dayal & Ferrara (2018) Dayal, P., & Ferrara, A. 2018, Phys. Rep., 780, 1, doi: 10.1016/j.physrep.2018.10.002
- Donnan et al. (2024) Donnan, C. T., McLure, R. J., Dunlop, J. S., et al. 2024, MNRAS, 533, 3222, doi: 10.1093/mnras/stae2037
- Eldridge et al. (2017) Eldridge, J. J., Stanway, E. R., Xiao, L., et al. 2017, PASA, 34, e058, doi: 10.1017/pasa.2017.51
- Esmerian & Gnedin (2021) Esmerian, C. J., & Gnedin, N. Y. 2021, ApJ, 910, 117, doi: 10.3847/1538-4357/abe869
- Fan et al. (2006) Fan, X., Carilli, C. L., & Keating, B. 2006, ARA&A, 44, 415, doi: 10.1146/annurev.astro.44.051905.092514
- Finkelstein et al. (2024) Finkelstein, S. L., Leung, G. C. K., Bagley, M. B., et al. 2024, ApJ, 969, L2, doi: 10.3847/2041-8213/ad4495
- Furlanetto et al. (2006) Furlanetto, S. R., Oh, S. P., & Briggs, F. H. 2006, Phys. Rep., 433, 181, doi: 10.1016/j.physrep.2006.08.002
- Gelli et al. (2024) Gelli, V., Mason, C., & Hayward, C. C. 2024, ApJ, 975, 192, doi: 10.3847/1538-4357/ad7b36
- Guo et al. (2011) Guo, Q., White, S., Boylan-Kolchin, M., et al. 2011, MNRAS, 413, 101, doi: 10.1111/j.1365-2966.2010.18114.x
- Harikane et al. (2024a) Harikane, Y., Nakajima, K., Ouchi, M., et al. 2024a, ApJ, 960, 56, doi: 10.3847/1538-4357/ad0b7e
- Harikane et al. (2023) Harikane, Y., Ouchi, M., Oguri, M., et al. 2023, ApJS, 265, 5, doi: 10.3847/1538-4365/acaaa9
- Harikane et al. (2024b) Harikane, Y., Inoue, A. K., Ellis, R. S., et al. 2024b, arXiv e-prints, arXiv:2406.18352, doi: 10.48550/arXiv.2406.18352
- Henriques et al. (2015) Henriques, B. M. B., White, S. D. M., Thomas, P. A., et al. 2015, MNRAS, 451, 2663, doi: 10.1093/mnras/stv705
- Henriques et al. (2013) —. 2013, MNRAS, 431, 3373, doi: 10.1093/mnras/stt415
- Henriques et al. (2020) Henriques, B. M. B., Yates, R. M., Fu, J., et al. 2020, MNRAS, 491, 5795, doi: 10.1093/mnras/stz3233
- Hutter et al. (2021) Hutter, A., Dayal, P., Yepes, G., et al. 2021, MNRAS, 503, 3698, doi: 10.1093/mnras/stab602
- Kannan et al. (2022) Kannan, R., Garaldi, E., Smith, A., et al. 2022, MNRAS, 511, 4005, doi: 10.1093/mnras/stab3710
- Koopmans et al. (2015) Koopmans, L., Pritchard, J., Mellema, G., et al. 2015, in Advancing Astrophysics with the Square Kilometre Array (AASKA14), 1, doi: 10.22323/1.215.0001
- Lewis (2019) Lewis, A. 2019, arXiv e-prints, arXiv:1910.13970, doi: 10.48550/arXiv.1910.13970
- Liu et al. (2024) Liu, P., Ma, Q., Han, Y., & Luo, R. 2024, ApJ, 968, 13, doi: 10.3847/1538-4357/ad41e1
- Ma et al. (2017) Ma, Q., Maio, U., Ciardi, B., & Salvaterra, R. 2017, MNRAS, 472, 3532, doi: 10.1093/mnras/stx1839
- Ma et al. (2023) Ma, Q.-B., Ghara, R., Ciardi, B., et al. 2023, MNRAS, 522, 3284, doi: 10.1093/mnras/stad1203
- Ma et al. (2018) Ma, X., Hopkins, P. F., Garrison-Kimmel, S., et al. 2018, MNRAS, 478, 1694, doi: 10.1093/mnras/sty1024
- Mertens et al. (2020) Mertens, F. G., Mevius, M., Koopmans, L. V. E., et al. 2020, MNRAS, 493, 1662, doi: 10.1093/mnras/staa327
- Mutch et al. (2016) Mutch, S. J., Geil, P. M., Poole, G. B., et al. 2016, MNRAS, 462, 250, doi: 10.1093/mnras/stw1506
- Nakajima et al. (2023) Nakajima, K., Ouchi, M., Isobe, Y., et al. 2023, ApJS, 269, 33, doi: 10.3847/1538-4365/acd556
- Navarro-Carrera et al. (2024) Navarro-Carrera, R., Rinaldi, P., Caputi, K. I., et al. 2024, ApJ, 961, 207, doi: 10.3847/1538-4357/ad0df6
- Nikolić et al. (2024) Nikolić, I., Mesinger, A., Davies, J. E., & Prelogović, D. 2024, arXiv e-prints, arXiv:2406.15237, doi: 10.48550/arXiv.2406.15237
- Ocvirk et al. (2020) Ocvirk, P., Aubert, D., Sorce, J. G., et al. 2020, MNRAS, 496, 4087, doi: 10.1093/mnras/staa1266
- Park et al. (2019) Park, J., Mesinger, A., Greig, B., & Gillet, N. 2019, MNRAS, 484, 933, doi: 10.1093/mnras/stz032
- Planck Collaboration et al. (2020) Planck Collaboration, Aghanim, N., Akrami, Y., et al. 2020, A&A, 641, A6, doi: 10.1051/0004-6361/201833910
- Rosdahl et al. (2018) Rosdahl, J., Katz, H., Blaizot, J., et al. 2018, MNRAS, 479, 994, doi: 10.1093/mnras/sty1655
- Simmonds et al. (2024) Simmonds, C., Tacchella, S., Hainline, K., et al. 2024, MNRAS, 535, 2998, doi: 10.1093/mnras/stae2537
- Springel et al. (2021) Springel, V., Pakmor, R., Zier, O., & Reinecke, M. 2021, MNRAS, 506, 2871, doi: 10.1093/mnras/stab1855
- Springel et al. (2001) Springel, V., White, S. D. M., Tormen, G., & Kauffmann, G. 2001, MNRAS, 328, 726, doi: 10.1046/j.1365-8711.2001.04912.x
- Springel et al. (2005) Springel, V., White, S. D. M., Jenkins, A., et al. 2005, Nature, 435, 629, doi: 10.1038/nature03597
- Stanway & Eldridge (2018) Stanway, E. R., & Eldridge, J. J. 2018, MNRAS, 479, 75, doi: 10.1093/mnras/sty1353
- Stefanon et al. (2021) Stefanon, M., Bouwens, R. J., Labbé, I., et al. 2021, ApJ, 922, 29, doi: 10.3847/1538-4357/ac1bb6
- Tang et al. (2023) Tang, M., Stark, D. P., Chen, Z., et al. 2023, MNRAS, 526, 1657, doi: 10.1093/mnras/stad2763
- Tinker et al. (2008) Tinker, J., Kravtsov, A. V., Klypin, A., et al. 2008, ApJ, 688, 709, doi: 10.1086/591439
- Trott et al. (2020) Trott, C. M., Jordan, C. H., Midgley, S., et al. 2020, MNRAS, 493, 4711, doi: 10.1093/mnras/staa414
- Vani et al. (2024) Vani, A., Ayromlou, M., Kauffmann, G., & Springel, V. 2024, arXiv e-prints, arXiv:2408.00824, doi: 10.48550/arXiv.2408.00824
- Wang et al. (2024) Wang, X., Cheng, C., Ge, J., et al. 2024, ApJ, 967, L42, doi: 10.3847/2041-8213/ad4ced
- Wilkins et al. (2016) Wilkins, S. M., Feng, Y., Di-Matteo, T., et al. 2016, MNRAS, 458, L6, doi: 10.1093/mnrasl/slw007
- Zhang et al. (2022) Zhang, Z., Shan, H., Gu, J., et al. 2022, MNRAS, 516, 1573, doi: 10.1093/mnras/stac2208