Study of Gamow-Teller strength and associated weak-rates on odd-A nuclei in stellar matter
Abstract
In a recent study by Cole et al. [1], it was concluded that QRPA calculations show larger deviations and overestimate the total experimental Gamow-Teller (GT) strength. It was also concluded that QRPA calculated electron capture rates exhibit larger deviation than those derived from the measured GT strength distributions. The main purpose of this study is to probe the findings of the Cole et al. paper. This study gives useful information on the performance of QRPA-based nuclear models. As per simulation results, the capturing of electrons that occur on medium heavy isotopes have a significant role in decreasing the ratio of electron-to-baryon content of the stellar interior during the late stages of core evolution. We report the calculation of allowed charge-changing transitions strength for odd-A -shell nuclei (45Sc and 55Mn) by employing the deformed pn-QRPA approach. The computed GT transition strength is compared with previous theoretical calculations and measured data. For stellar applications the corresponding electron capture rates are computed and compared with rates using previously calculated and measured Gamow-Teller values. Our finding show that our calculated results are in decent accordance with measured data. At higher stellar temperature our calculated electron capture rates are larger than those calculated by Independent Particle Model (IPM) and shell model. It was further concluded that at low temperature and high density regions the positron emission weak-rates from 45Sc and 55Mn may be neglected in simulation codes.
keywords:
Gamow-Teller transitions; electron capture rates; pn-QRPA theory; stellar evolution; core-collapsePACS numbers: 23.40.Bw, 26.30.Jk, 23.40.-s, 97.10.Cv, 26.50.+x
1 Introduction
Study of supernova process is one of the means to explore our Universe. All type of natural interactions manifest themselves in a supernova explosion. The study of these interactions explain many scenarios of the universe [2]. The strong and the weak interactions, during hydrostatic process of stellar evolution, produce nuclei till mass number A. More massive nuclei are most probably synthesized in supernova explosion environments at very high temperature and density. To date the complete mechanism of supernova explosion is not well understood. There are many complexities involved. Researchers world-wide continue their quest for a deeper understanding of the dynamics of core-collapse.
The weak interaction processes are considered as to be the key
parameters for understanding the mechanism of late stages of stellar
evolution [3]. These processes also perform a vital role to
estimate the pre-supernova stellar core composition as well as the
nucleosynthesis of neutron-rich (heavier) nuclei [3, 4]. The Gamow-Teller (GT) charge-changing transitions are
responsible for these processes, due to which the GT distribution of
-shell nuclei are of particular significance. In pre-supernova
structure these nuclei are the major ingredient of the astrophysical
core leading to thermonuclear/type-Ia or core-collapse/type-II
supernovae [5, 6]. In the pre-explosion development of
core-collapse supernovae, once the electrons Fermi energy
sufficiently raised to overcome Q-value limitations that confine
electron capture (EC) under laboratory environment, the nuclear
content in the astrophysical core is neutronized and EC reactions
reduce the lepton-to-baryon fraction (Ye)[7]. In other
words the EC process reduces the electron degeneracy pressure,
electron-to-baryon ratio and entropy of the system. During these
stages of stellar evolution, EC on -shell nuclei play important
role, since these are the key ingredients of the stellar core in
pre-supernovae formation which lead to core-collapse or
thermonuclear supernovae.
During later phases of stellar evolution, electrons have enough
energy to initiate transitions to GT resonance. For probing GT
transitions at higher excitation energy (n, p), (p, n),(3He,
t) and (d, 2He) reactions are studied. Williams et al.
[8] observed that the total charge-changing GT strength in
the EC direction was quenched (compared to theoretical estimates)
and distributed over many final levels in the daughter nuclei due to
the residual nucleon-nucleon correlation. More efficient way for
extraction of GT+ (responsible for EC process) strength in stable
nuclei is to investigate charge-exchange reactions [9]. In
case of incident energy higher than 100 MeV, the dominating
components of effective interaction are iso-vector spin-flip and
spin-isospin transitions. The momentum transfer in forward angle is
rather small and GT operator with , ,
in reaction cross section may dominate. The cross
sections, in region of zero momentum transfer, are directly related
to strength of -decay between the same states. In order to
study GT strength distributions, charge-changing reactions at low
momentum transfer is to be employed in case where -decay is
not possible.
Researchers are working hard to estimate, in a microscopic fashion,
the ground- and excited-state charge-changing transition strength
distributions. Measurement of GT functions itself is a challenging
task. Due to involvement of hundreds of nuclei in stellar matter and
also in order to incorporate finite-temperature effects, theoretical
predictions of GT distributions continue to be the affordable
choice. Because of the significant implications of the weak rates in
astrophysical scenario, they were widely studied using various
nuclear models. The first considerable attempt to measure the
astrophysical weak rates over a wide range of temperature and
density was done by Fuller, Fowler and Newman (FFN) [3].
The calculation was based on the independent particle model and the
authors employed the Brink-Axel hypothesis [Bri65] in their
calculation to estimate the excited state GT strength functions.
They further incorporated measured data available at that time in
their calculation to improve the reliability of the results. Later,
the FFN work was expanded for heavier nuclei with by Aufderheide and collaborators [5]. Shell model
Monte Carlo (SMMC) approach was employed for the first time to
calculate, in a fully microscopic way, the Gamow-Teller
contributions to EC rates for fp-shell nuclei, by considering
the thermal effects [who]. The electroweak interaction matrix
elements were calculated in the limit of zero-momentum transfer,
with the GT operators as the main constituent. However, the shell
model diagonalization cannot be performed beyond the fp-shell
nuclei, because of the huge dimension of the model space involved.
To overcome this limitation a hybrid model (SMMC + RPA) was
introduced [10, 11]. Dzhioev et al., introduced an
alternative approach known as thermal quasi-particle random-phase
approximation (TQRPA) model, for the calculation of electron capture
rates of hot nuclides. This is basically a statistical approach to
the nuclear many-body problem at finite-temperature [12, 13]. In TQRPA model, instead of calculating the individual
strength functions for the nuclear ground and excited states, one
calculates an ’average’ temperature dependent strength distribution.
A TQRPA model, based on the Woods-Saxon potential and separable
multi-pole and having spin-multi-pole particle-hole interactions,
was used for the thermal evolution of GT+ distributions on
54,56Fe and 76,78,80Ge nuclei [who]. This model was
based on the thermofield dynamics (TFD) formalism and performed
calculation of the weak-interaction response of nuclei at finite
temperature. It was concluded that thermal effects shift the
GT+ centroid to lower excitation energies [13].
Recently, a self-consistent finite-temperature RPA (FTRPA) model
based on Skyrme functionals has been applied in Refs. [14, 15] to study EC cross sections and weak rates using several
different interactions. Furthermore, a similar approach, extended to
the relativistic framework i.e., finite-temperature RPA (FTRRPA)
model has been employed in Ref. [16]. It was concluded that
the FTRRPA provides a universal theoretical tool for the analysis of
stellar weak-interaction processes in a fully consistent microscopic
approach, specifically for region of neutron-rich nuclei. In this
work we have used the pn-QRPA model having separable residual GT
interactions in a deformed basis, to compute the allowed GT
transitions and stellar weak reaction rates for the odd-A nuclei
45Sc and 55Mn. In our model we calculate the ground and
excited state temperature dependent nuclear partition functions. We
compute ground and excited states of parent and daughter nuclei and
the nuclear matrix elements connecting these states via the GT
operator within the QRPA approach. We assume that the probability of
excited states follow a normal Boltzmann distribution. However,
currently we are unable to determine the complete finite-temperature
effects on the GT transition functions (applicable at high stellar
temperatures exceeding 1010 K [Rau00]) and on the pairing
correlations. In our model the pairing gap is considered to be
independent of temperature. In our model the nuclear Fermi surface
is smeared due to pairing correlations only. We cite this as a
short-coming of our current model. We hope to include the
finite-temperature effects in our model as a future assignment. It
should be mentioned that the thermal QRPA approaches and our model
do not rely
on the Brink’s hypothesis, as used in shell model calculations.
Cole et al. [1] have presented a systematic evaluation of
the capability of theoretical nuclear models to reproduce the
measured GT strength of charge-exchange reactions at intermediate
energies. The authors have concluded that the GT strength
distributions calculated in the shell models reproduce well the
measured data, whereas QRPA calculations [17] show larger
deviations and overestimate the total experimental GT strength. It
was also concluded that EC rates from the shell-model calculations
are also much closer to the EC rates derived from the experimental
GT strength distributions than those calculated on basis of the QRPA
framework. The current study probes the conclusion of the Cole et
al. study and provide useful information on the performance of
QRPA-based models and refines the conclusions in Ref. [1].
Our findings show that this is not the case for all kind QRPA
calculations and form the prime motivation for this paper. In the
next section we briefly describe the necessary formalism of pn-QRPA
model and its parameters used for the computation of transitions
strength and stellar rates. Sec. 3 presents the comparison of our
calculation with different experimental and theoretical results.
Finally the conclusion of our findings is describe in Sec. 4.
2 Theoretical Formalism
The pn-QRPA Hamiltonian is specified by
| (1) |
where is the single particle Hamiltonian, is pairing force (considered within the BCS approximation), and represent the particle-hole () and particle-particle () interaction parameters for GT channel, respectively. The single particle eigenfunctions and eigenvalues were computed in Nilsson model [18], in which the nuclear deformation parameter () was incorporated. The and interaction strengths were characterized by model parameters and , accordingly. These parameters were selected with the constraint that the computed Gamow-Teller strength satisfy the model independent Ikeda sum rule (ISR) [19]. Other parameters needed for computation of weak-interaction rates are the pairing gap (), the Nilsson potential parameters (NPP) and the Q-values. The NPP were chosen from [20] and in units of MeV was considered for Nilsson oscillator constant, similar for neutrons and protons. The calculated half-life (T1/2) values rely weakly on the pairing gaps () between nucleons [21]. The same were calculated using
| (2) |
was determined by using the formula
| (3) |
where denote the electric quadrupole moment taken from Ref. [22]. Q-values of reactions were taken from Ref. [23].
In our model the charge-changing transitions are described by phonon creation operators defined by
| (4) |
The summation is taken over all the p-n pairs having = mp-mn = 0, 1, here mn(mp) depicts the angular momentum third component of the for neutron(proton). The a are the creation operator of a quasi-particle (q.p) state of neutron(proton). The () represents the time reversed state of p (n). The ground level of our model with respect to the QRPA phonons is considered as the vacuum, A = 0. The excitation energy () and amplitudes (X) of phonon operator were obtained by solving the RPA equation. Detailed solution of RPA matrix equation may be seen in Refs. [21, 24].
2.1 Quasi-particle transitions
The RPA is formulated for excitations from the Jπ = 0 ground level of an even-even nucleons. When the parent nuclide consists of odd nucleon, as in the current work, then the ground level is represented as a one-quasi-particle state, in which the odd quasi-particle occupies the single quasi-particle orbit of the smallest energy. Two kinds of transitions are possible in our model. One is the phonon excitations alone, in which the quasi-particle acts merely as a spectator. The other is transitions of the quasi-particle itself, and phonon correlations to the quasi-particle transitions in first order perturbation were introduced using the Refs. [25, 26]. The phonon-correlated one-quasi-particle states are specified by:
| (5) |
with
| (6) |
Eq. 5 has two parts, first part of the equation represents the proton (neutron) quasi-particle state and the second part shows the admixture of correlation of RPA phonon by quasi-particle phonon coupling Hamiltonian (Hqp-ph), obtained from the separable and forces by the Bogoliubov transformation [24]. The sum in Eq. 5 run over all the levels of phonon and proton (neutron) quasi-particle levels that fulfill the and . The analytical treatment of the quasi-particle transition amplitudes for correlated states (for the general force and charge changing transitions mode) may be seen in Refs. [24, 27, 28].
In case of odd-A nucleus, low- lying states were obtained by lifting the quasi-particle in the orbit of the smallest energy to higher-lying orbits. Parent states of 45Sc and 55Mn (even-neutron and odd-proton system) were represented by three-proton states or one-proton two-neutron states, corresponding to excitation of a neutron or proton
| (7) |
| (8) |
with the energy denominators of first order perturbation
| (9) |
The three quasi-particle states to odd neutron and even proton
nuclide are obtained from (Eq. 7 and
Eq. 8) by the interchange of proton states and
neutron states, and
.
The excited states for an even-proton and odd-neutron nuclei
(daughter nuclei) were
constructed as
(1) raising odd neutron from the lower (ground)state to the upper
(excited) state (one quasi-particle states state),
(2) three-neutron states, corresponding to excitation of a
neutron or,
(3) two-proton and one-neutron states, corresponds to
excitation of proton.
The formulae for multi-quasi-particle GT transitions and their
reduction to correlated (c) one-quasi-particle states were defined
as:
| (10) |
| (11) |
| (12) |
Here and denote the spin and the isospin operators, respectively. For further necessary details Ref. [24] may be seen.
2.2 Weak-decay rates
The positron emission (PE) and electron capture (EC) weak-rates from the nth parent state to mth daughter state is given by
| (13) |
the term is linked to the reduced transition probability () by
| (14) |
The reduced transition probabilities ’s are sum of GT and Fermi transition probabilities and given by
| (15) |
The value of constant was taken as 6143 Ref. [29] and was taken as -1.2694. The reduced Fermi and GT transition probabilities were expressed as
| (16) |
| (17) |
For the construction of daughter and parent excited levels and computation of GT nuclear matrix elements we refer to [30].
The phase space () integrals (over total energy) were calculated (by adopting the natural units ) as
| (18) |
| (19) |
In above equations is the (K.E + rest mass) of electron and threshold energy of EC is represented by . R± shows the distribution function of positrons (electrons) and given by
| (20) |
| (21) |
where , , and T denote the Fermi energy, kinetic energy of electrons, and temperature, respectively. The Fermi functions denoted by were computed using the recipe of Ref. [31]. If the positron (or electron) emission total energy () value was larger than -1, then was taken as 1, and if 1, then . is given by
| (22) |
where and () are the masses of parent and daughter nuclei, respectively and their corresponding excitation energies are denoted by (), respectively. The interior temperature of the stellar core is high enough and there is always a chance of parent excited levels occupation. The EC and PE total weak-interaction rates were calculated using
| (23) |
where represents the probability of occupation of parent excited states and follows the normal Boltzmann distribution. In Eq. 23, the summation was applied over all final and initial states until satisfactory convergence in EC(PE) rates were obtained.
3 Results and Discussion
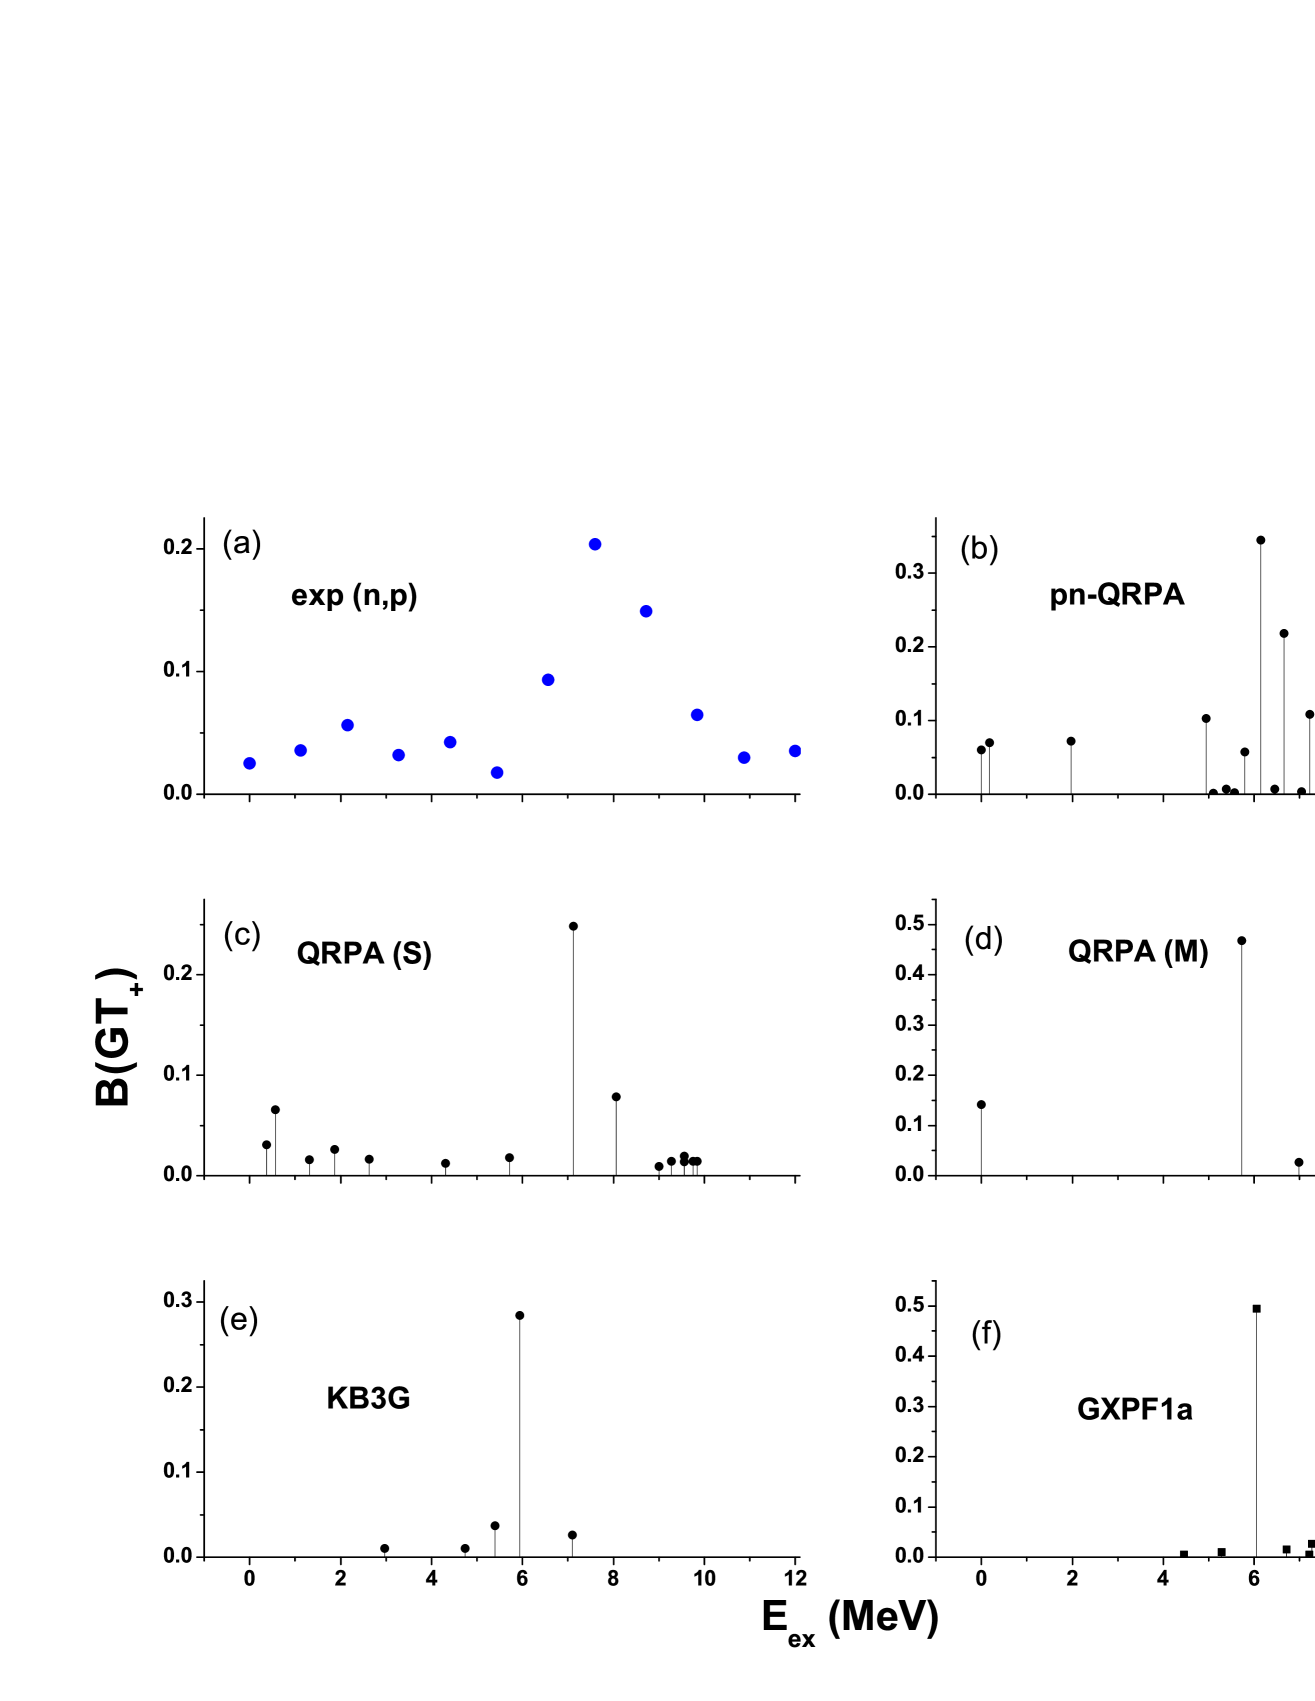
Our model was able to calculate GT transitions from 200 discrete parent levels to 300 daughter levels. Our model calculates GT transition strength at energy range of (EdE) where ”E” represent the excitation energy in daughter nucleus and ”dE” is equal to 0.05 MeV. Within this energy range our model determines all those GT transitions (which satisfy the allowed selection rules), adds them and put the cumulative strength corresponding to excitation energy ”E”. The charge-changing transitions from the ground level of 45Sc (parent nucleus) to 45Ca (daughter nucleus) levels is shown in Fig. 1. The transition strength linking the ground level of 55Mn to 55Cr in the GT+ direction is shown in Fig. 2. The comparison of pn-QRPA computed GT distribution strength with experiment and previous theoretical calculations are also presented in Figs. (1 - 2). There are six panels in each figure. Panel (a) shows the (n,p) GT data of the experiment performed by Alford and collaborators [32]. Data were only presented in energy bins (Eex) of 1 MeV due to the limited resolution of charge-changing (n,p) reaction in the experiment. It was further noted by the authors in Ref. [32] that the upper limit of the extracted charge-changing strength in daughter nuclei (45Ca, 55Cr) was up to Eex of 2 MeV possibly due to the contamination on hydrogen in the target. Panel (b) depicts the GT distribution computed by employing the current pn-QRPA approach. We used a quenching factor (fq) value of 0.6. The same value of 0.6 was suggested for the RPA results in case of 54Fe [33, 34]. Panel (c) shows the QRPA calculation of GT distribution using the Skyrme interactions [2] (shown as QRPA(S)). Sarriguren used a fq value of 0.7 and the Skyrme force SLy4 [35] for this calculation. Panel (d) depicts the theoretical GT transition strength using QRPA formalism of Ref. [17] (shown as QRPA(M)) employing the deformation and masses achieved from the finite-range droplet model (FRDM) [36]. Results of QRPA(M) are divided by a factor of 3. Panels (e) and (f) show the spin-isospin transitions using shell-model employing the interactions KB3G [37] and GXPF1a [38], accordingly. The shell model results used a fq value of 0.74 in their calculation. It is noted from figure 1 that our calculated strength distribution is well fragmented and, unlike previous theoretical estimates, do not put bulk of strength in one single transition. For the case of 55Mn, Fig. 2 shows that the QRPA models calculate bigger GT transitions as compared to shell model results.
The re-normalized Ikeda sum rule (ISRre) [19] is given by
| (24) |
Table 1 shows that the current pn-QRPA model satisfies the ISRre. The values appearing in third and fourth column of Table 1 were calculated using Eq. 17.
The deformed pn-QRPA computed electron capture (EC) and positron emission (PE) weak-rates for 45Sc and 55Mn, at selected stellar density and temperature values, are shown in Tables (2 - 3), respectively. The weak-rates are presented for stellar temperature range (0.7–30) K at stellar densities (, , and gcm-3. The calculated EC and PE rates (Eq. 23) are stated in values (in units of s-1). The weak rates increase as the stellar temperature rises. This increase is due to the fact that the occupation probability of parent excited states increase with rising of stellar core temperature. As the core stiffens, the electron Fermi energy level rises. This leads to sizeable increase of EC rates at high stellar density. The PE rates remains more or less constant as the stellar core stiffens. In our calculation it is assumed that positrons generate via electron-positron pair creation, at high stellar temperatures ( MeV). The complete set of EC and PE rates for 45Sc and 55Mn, on a fine density-temperature grid useful for interpolation processes, may be demanded as ASCII files from the authors. It is noted that at low temperatures and high stellar density regions the PE weak-rates are orders of magnitude smaller than the EC rates and may be safely omitted in simulation codes.
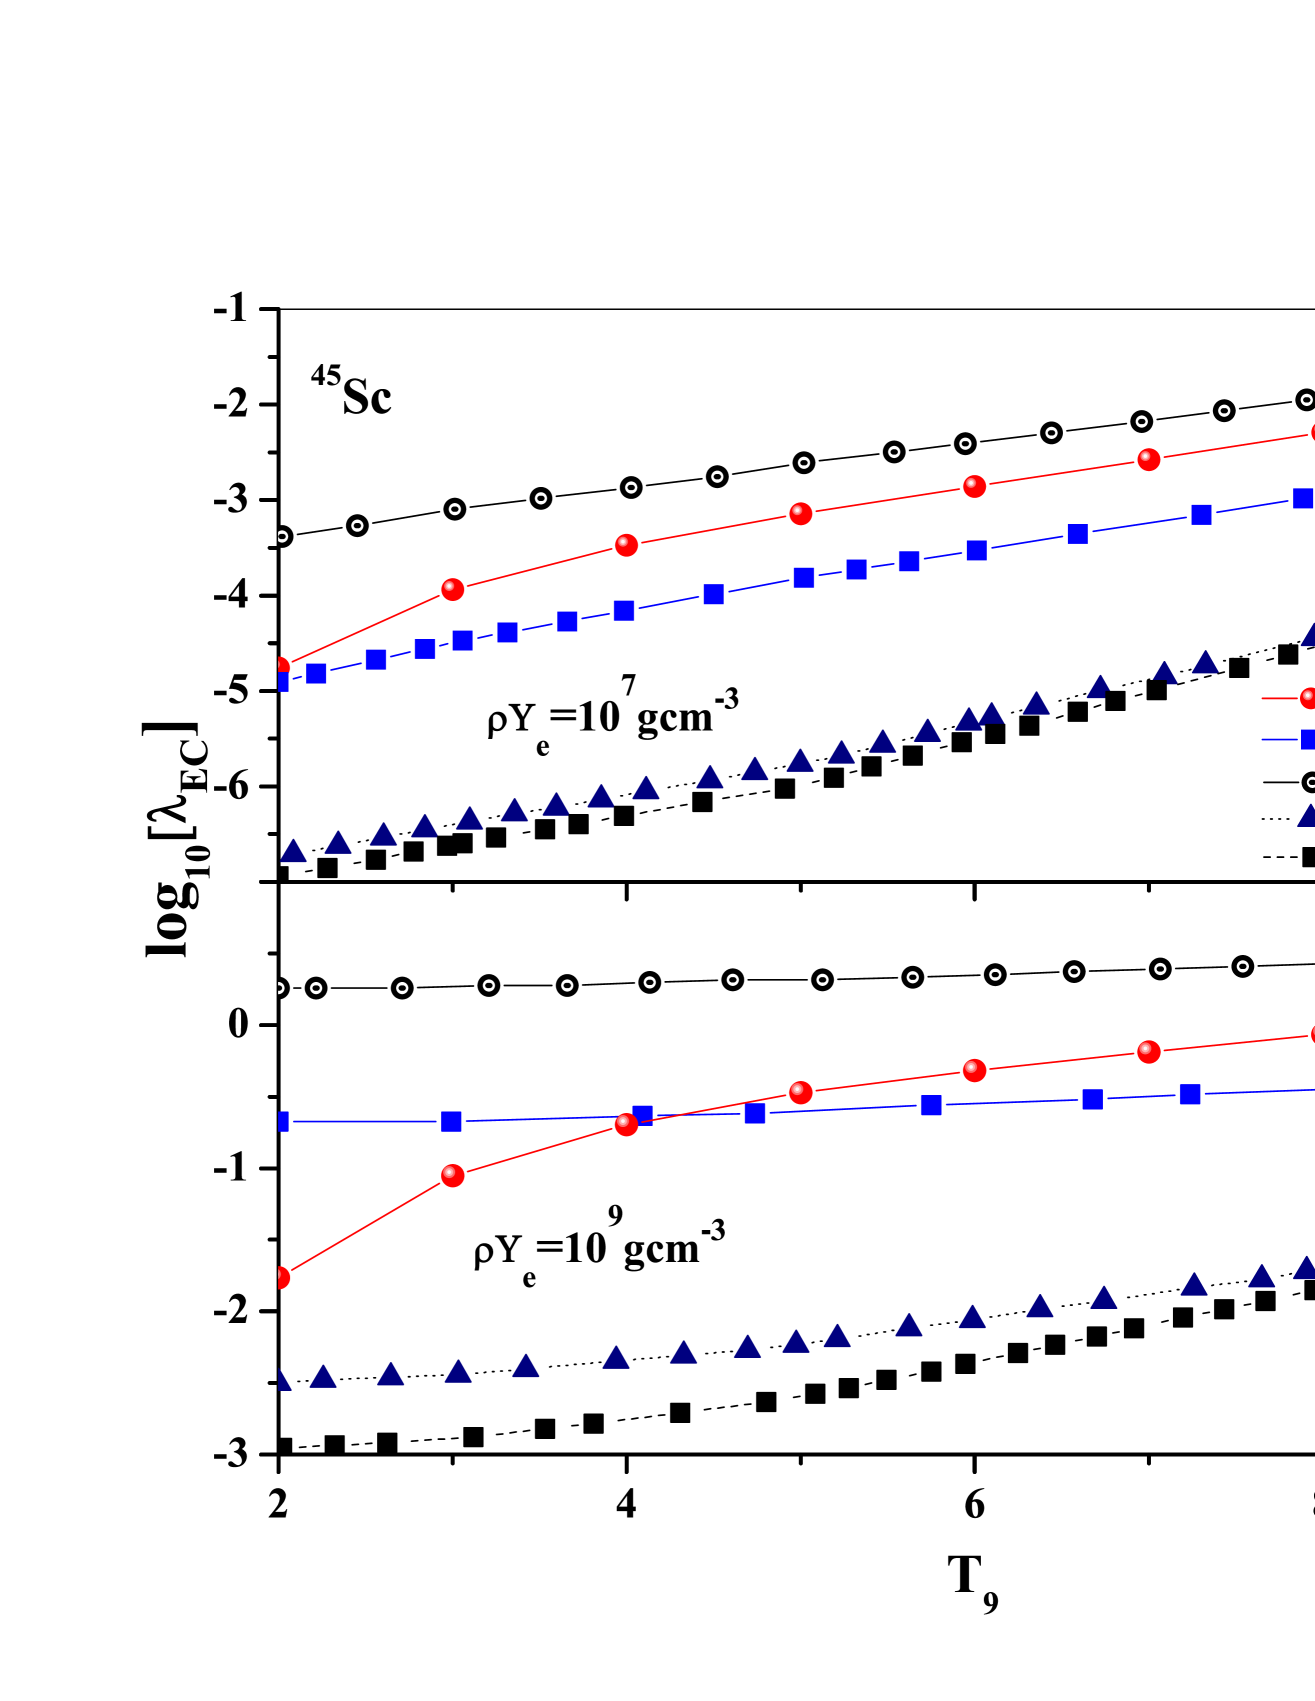
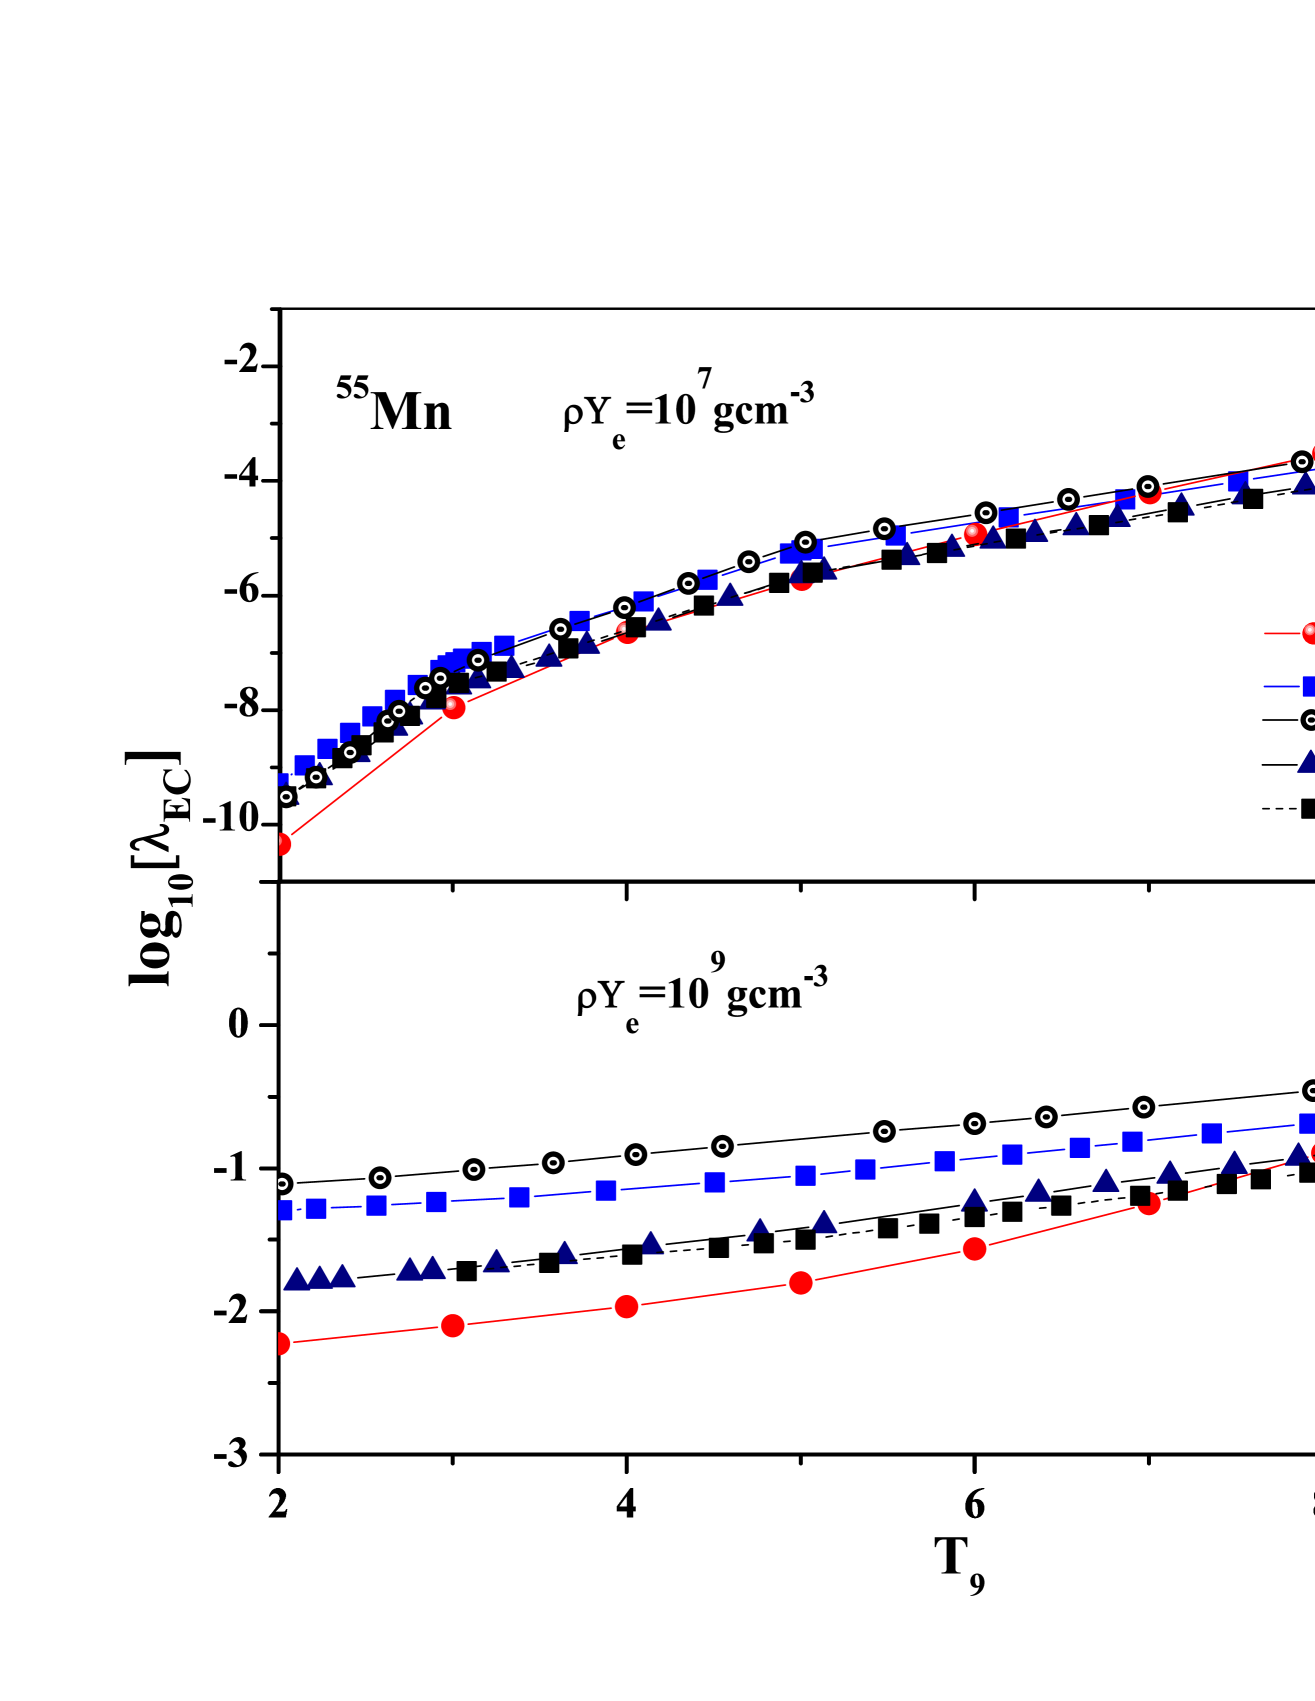
The comparison of our computed stellar EC rates with ground-state EC reaction rates are displayed in Figs. (3 - 4). Fig. 3 shows the result of 45Sc at stellar densities (107 and 109) gcm-3, while similar results are depicted for 55Mn in Fig. 4. In both figures we show the pn-QRPA calculated EC rates due to (i) 200 excited state GT distributions calculated by our pn-QRPA model and ground state (ii) measured GT strength distribution, (iii) QRPA(M) computed transitions strength distribution, (iv) shell model (SM) (KB3G interaction) calculated GT strength distribution and (v) SM (GXPF1a interaction) calculated GT strength distribution. The corresponding references were stated earlier. Apart from the pn-QRPA data (where we microscopically calculate excited levels GT strength distributions), all EC rates were computed using only the ground state GT strength distributions and were adopted from Ref. [1]. The EC rates are plotted in values (in units of s-1) as a function of stellar temperature (T9 = 109 K). On abscissa the range of temperature varies from (T9 = 2–10). These regions of density and stellar temperature are important for stellar scenarios associated with silicon burning phases (T9 3, 107 gcm-3), for phenomena related to type-Ia supernova, up to pre-collapse of the core (T9 10, 109 gcm-3). For the case of 45Sc, at (T9 = 2, and 107 gcm-3) our computed weak rates are in decent comparison with measured data, but an order of magnitude greater than shell model calculation. However at higher stellar temperature our calculated weak rates are bigger almost by factor of 5 than the data. The enhancement comes because our calculation also takes into consideration GT transitions from parent excited states that show their effect at high T9 values. The QRPA(M) rates are biggest because of calculation of big GT strength distribution (see Fig. 1). Shell model (SM) weak interaction rates are much smaller. It was reported in Ref. [1] that for the case of 45Sc, largest discrepancy was noted between measured data and shell model results. For the case of 55Mn the theoretical estimates match rather well with experimental data (Fig. 4) at 107 gcm-3. At low temperature pn-QRPA calculated weak rates are smaller than the data and shell model calculation almost by factor of 12 and 7, respectively. This may be attributed to the fact that within our model, the bulk of GT strength is calculated at high excitation energies (see Fig. 2). At low stellar temperatures the calculated EC rates are very sensitive to the strength distributions at low excitation energies. However at high stellar temperatures our calculated weak-rates exceed from the EC rates calculated by using the experimental GT strength and shell model calculations, by factor of almost 3 and 4, respectively. Because at higher temperature the low-lying strength becomes less significant as the capture proceeds mainly due to the GT resonance. Also at higher temperature the occupation probability of excited states are significant.
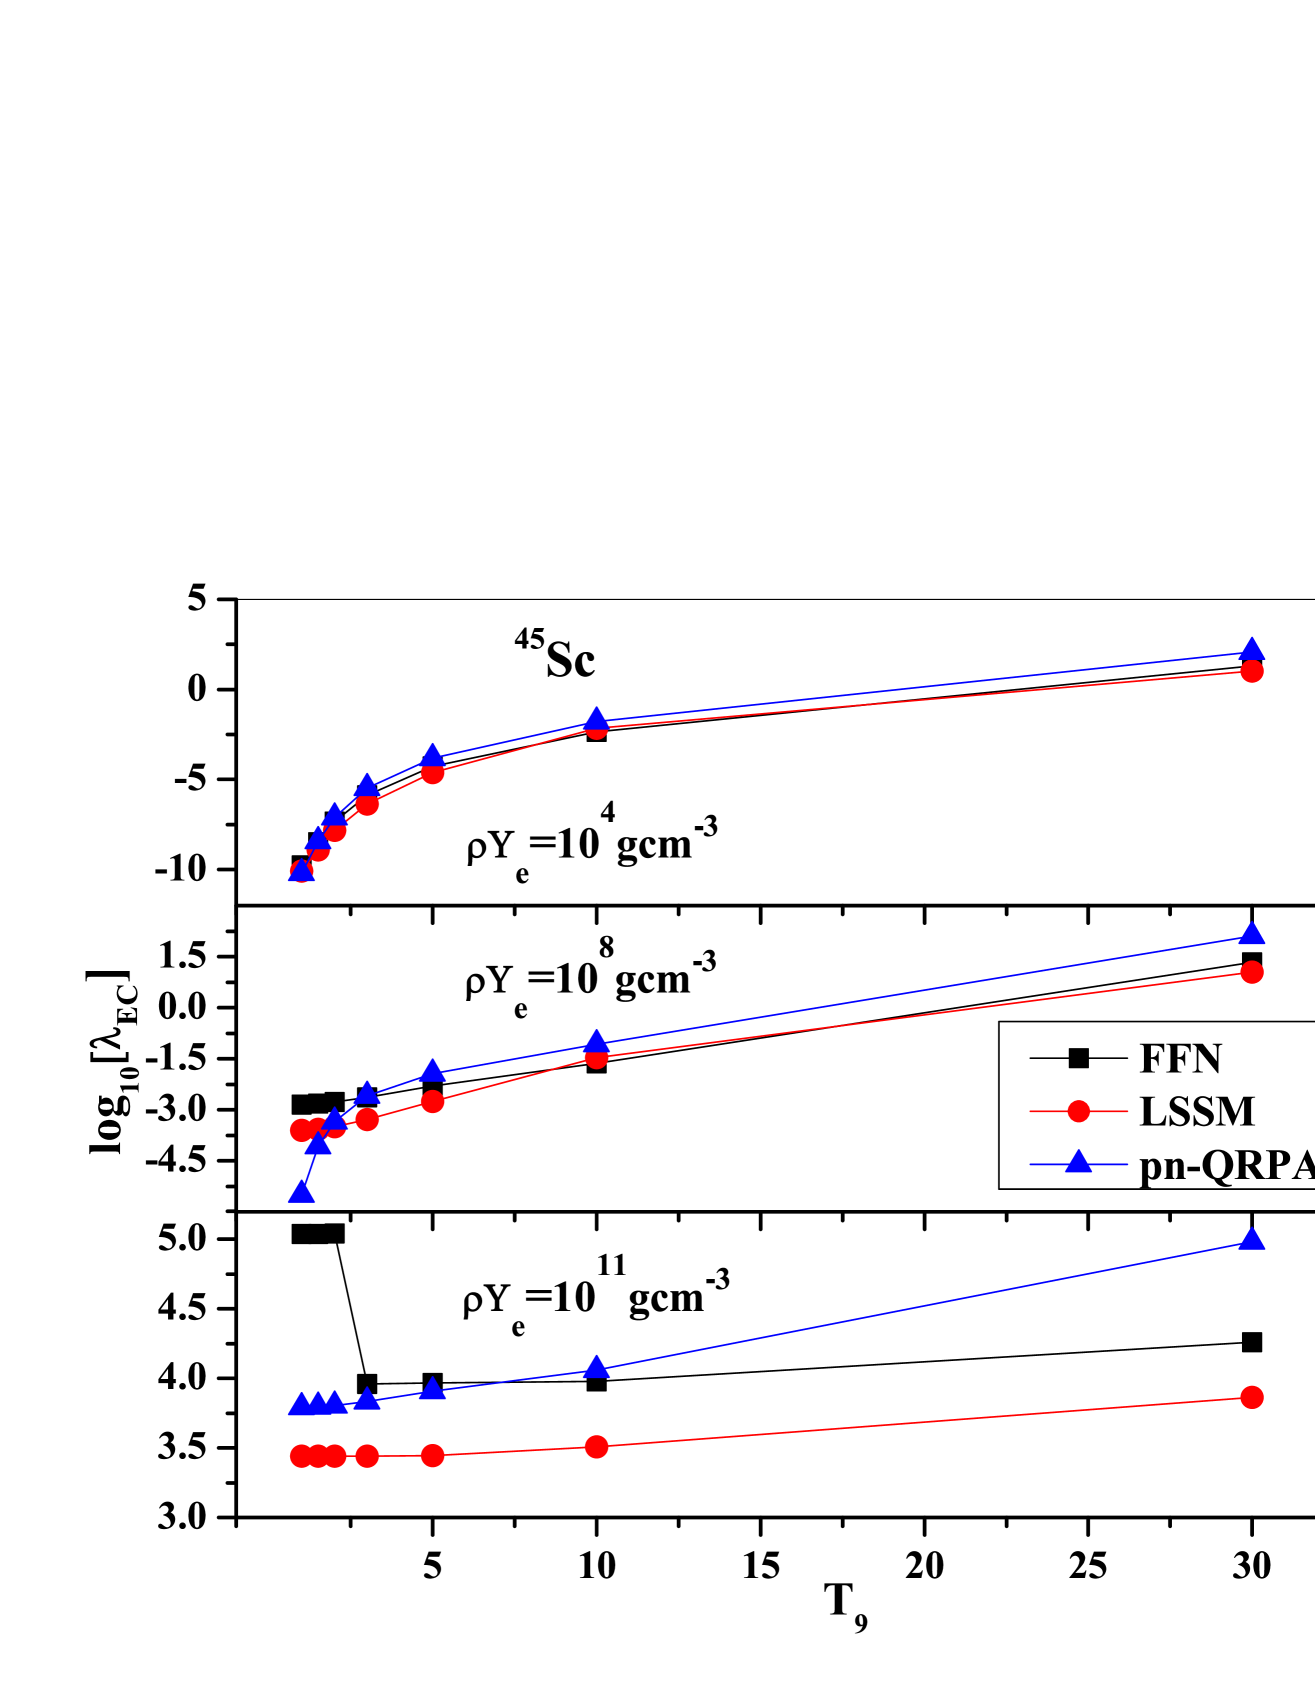
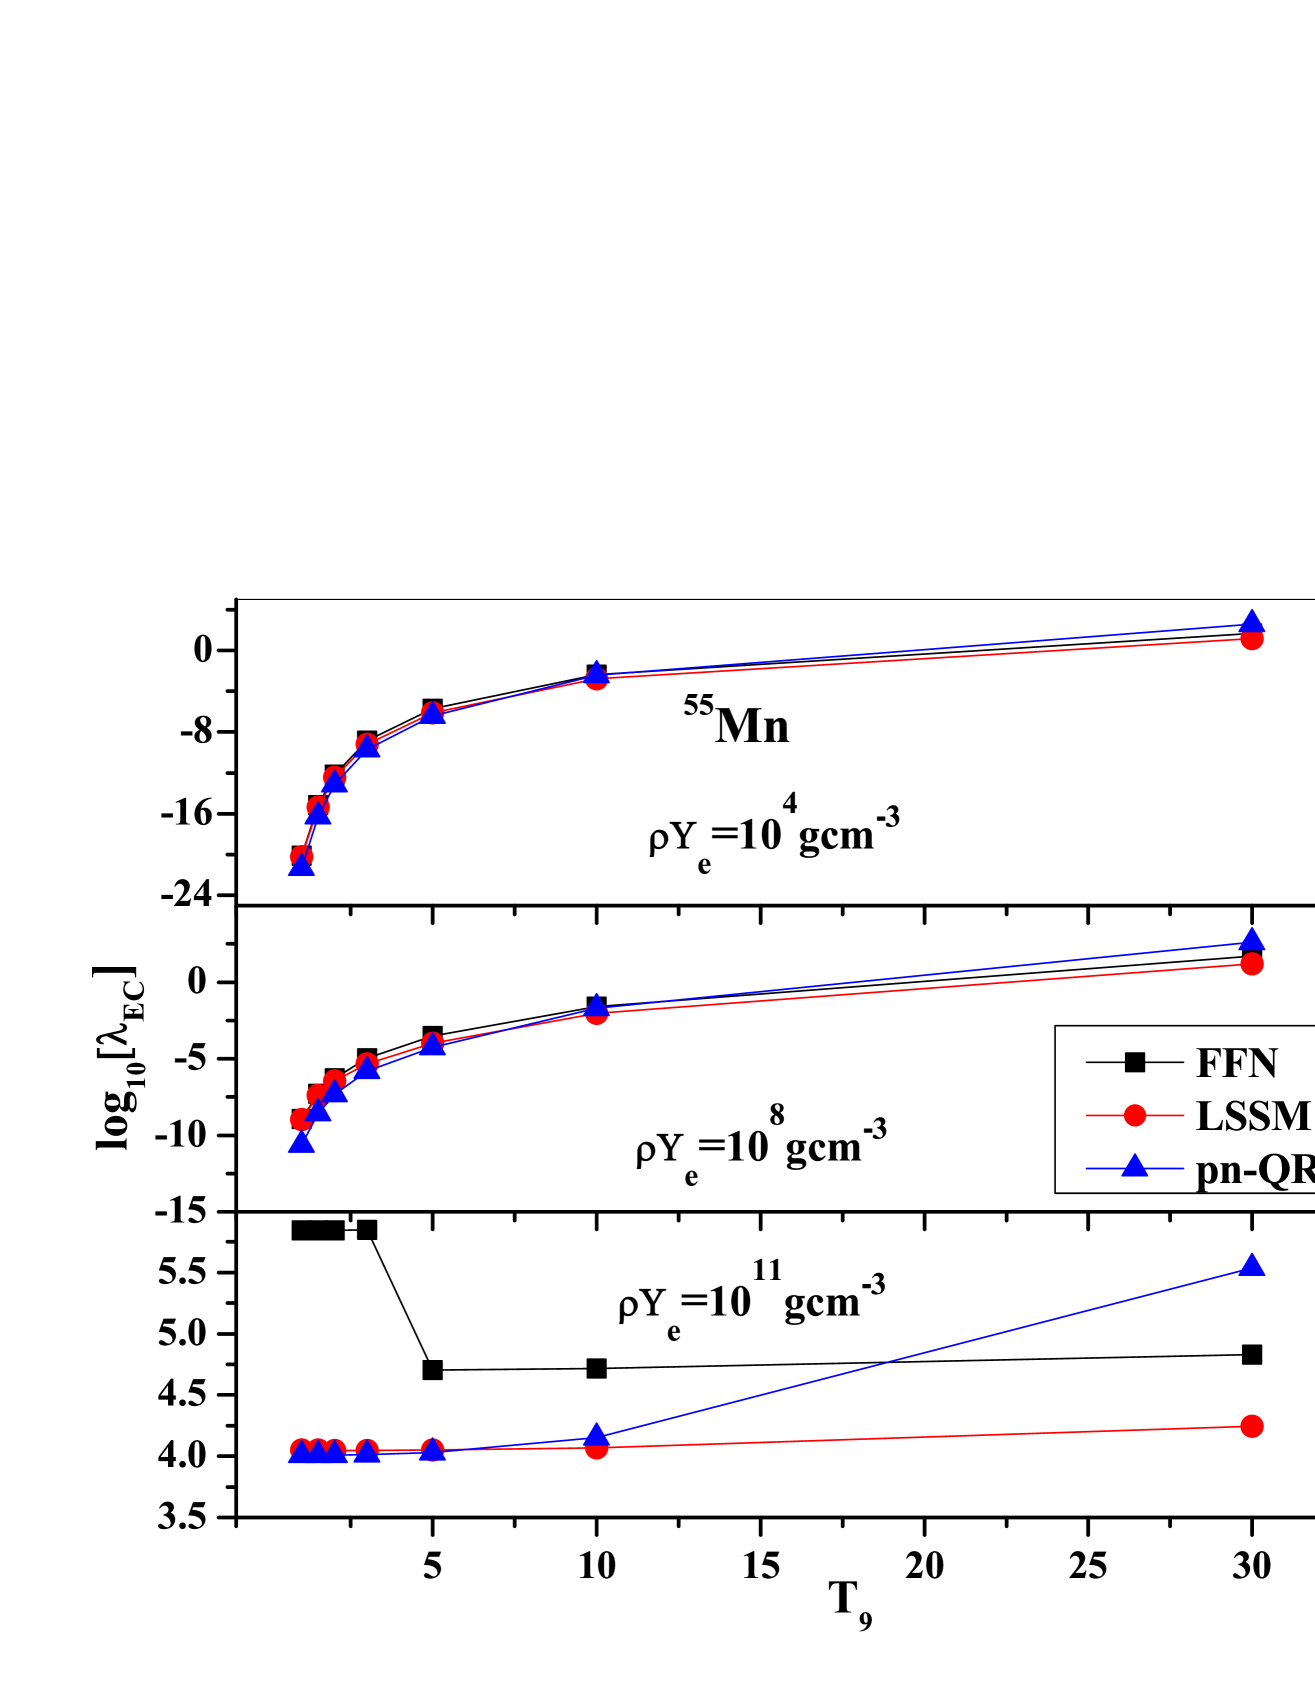
Next we compare the pn-QRPA calculated stellar EC rates with previous calculations of stellar EC rates. Excited parent states contribution were taken into consideration by the large scale shell model (LSSM)[39] and Independent Particle Model (IPM) [3] calculations. The IPM calculation was supplemented with measured transitions strength from -decay reaction experiments. The mutual comparison is shown in Figs. (5 - 6). The LSSM weak interaction rates were used in the simulation of presupernova stellar evolution having masses in the range 11-40 M⊙ [6], while IPM results were employed in several simulation codes (e.g. KEPLER stellar evolution code [40]). Both figures show three panels. The top panel depicts the comparison of calculated EC rates at stellar density () = 104 gcm-3 corresponding to low density region. The middle and bottom panels depict the comparison at stellar densities 108 gcm-3 and 1011 gcm-3, respectively. These correspond, respectively, to medium and high density regions of the core. In IPM calculation, the unmeasured matrix elements for GT strength were given an average value of equal to 5. The results of pn-QRPA and LSSM models are microscopic in nature and show a more realistic image of the phenomena occurring in the astrophysical situations. The overall mutual comparisons show that at low temperatures pn-QRPA computed EC weak reaction rates are in good agreement with LSSM calculated weak-rates. However at high temperatures, as the occupation possibility of excited levels are significant, our calculated EC weak-rates are bigger. In stellar matter these enhanced EC rates may have substantial impact during the late phases of presupernova evolution of high mass stars. At high temperatures, the LSSM calculated values are too small as compared to other calculations, this behavior of LSSM rates can also be seen in Ref.[42], in case of chromium isotopes. The Lanczos-based approach was used by LSSM, which is the main cause for this discrepancy and this was also pointed by Ref. [41]. The computed weak rates of LSSM are function of Lanczos iterations, that are required for the rate convergence and this type of partition functions can effect their computation of EC rates at high temperatures. Moreover our pn-QRPA model incorporates a large model space of 5, which can efficiently handle all parent and daughter excited levels considered in this calculation. Another distinguishing feature of the current calculation is that we do not take into account the Brink-Axel hypothesis (BAH) in our calculation of EC rates, used by IPM and LSSM calculations. BAH presumes that the transition strengths from excited parent levels are same as ground-state distribution, drifted only by the excitation energy of the level. We did a state-by-state computation for EC rates from all parent to daughter levels in a microscopic way. It is suggested that core-collapse simulators may check the effect of our enhanced EC weak-rates. For the case of 55Mn (Fig. 6), the LSSM and pn-QRPA weak-rates are in decent agreement till T9 = 10. This is due to the fact that ground-state rate commands the total EC rates for 55Mn and both LSSM and pn-QRPA models performed a microscopic calculation of ground-state EC rates.
4 Conclusions
EC rates on fp-shell isotopes are significant component for modeling the late phases of stellar evolution that end their lives either as thermonuclear or core-collapse supernovae. For the estimation of these stellar weak rates, it is necessary to study the charge-changing GT transition strength distribution in the EC direction. Stellar models mostly depend on the theoretical approaches, which should be tested against the available measured data.
In this work we have determined the charge-changing GT transitions strength for odd-A medium-heavy nuclei (45Sc and 55Mn) in direction. The model independent Ikeda sum rule was fulfilled in our results. For stellar applications the EC rates over wide range of astrophysical density (10 – 1011 g/cm3) and temperature (0.01 GK – 30 GK) were computed employing the deformed pn-QRPA model. We compared our results both with theoretical (including shell and other QRPA models) and measured charge-changing reaction data. Our results are in decent comparison with the measured data. We also compared our weak reaction rates with the IPM and LSSM results. It was concluded that our rates are enhanced in the presupernova era as compared to previous calculations. From astrophysical point these enhanced electron capture rates may have crucial impact on the late phase evolution of high mass stars and shock waves energetics. It was also concluded that at high stellar density and low temperature regions the PE weak-rates may be neglected in simulation codes.
Acknowledgements
J.-U. Nabi would like to acknowledge the support of the Higher Education Commission Pakistan through project 5557/KPK/NRPU/RD/HEC/2016 and Pakistan Science Foundation through project PSF-TUBITAK/KP-GIKI (02). J.-U. Nabi also acknowledges the support by Tübitak (Turkey) under Program No. 2221-1059B211700192 where part of this project was completed.
References
- [1] A. L. Cole, et al., Phys. Rev. C 86 015809 (2012).
- [2] P. Sarriguren, Phys. Rev. C 87 045801 (2013).
- [3] G. M. Fuller, W. A. Fowler and M. J. Newman, Ap. J. Suppl Ser 42 447 (1980); Ap. J. Suppl Ser 48 279 (1982); Ap. J. Suppl Ser 252 715 (1982).
- [4] E. M. Burbidge, G. R. Burbidge, W. A. Fowler and F. Hoyle, Rev. Mod. Phys. 29 547 (1957); G. Wallerstein et al., Rev. Mod. Phys. 69 995 (1997).
- [5] M. B. Aufderheide, I. Fushiki, S. E. Woosley and D. H. Hartmann, Astro. J. Suppl. Ser. 91 389 (1994).
- [6] A. Heger, S. E. Woosley, G. Martínez-Pinedo and K. Langanke, Ap. J. 560 307 (2001).
- [7] H. A. Bethe, G. E. Brown, J. Applegate and J. M. Lattimer, Nucl. Phys. A 324 487 (1979).
- [8] A. L. Williams, et al., Phys. Rev. C 51.3 1144 (1995).
- [9] F. Osterfeld, Rev. Mod. Phys. 64 491 (1992).
- [10] K. Langanke, E. Kolbe and D. J. Dean, Phys. Rev. C 63 032801 (2001).
- [11] J. M. Sampaio, K. Langanke, G. Martínez-Pinedo, E. Kolbe and D. J. Dean, Nucl. Phys. A 718 440 (2003).
- [12] A. A. Dzhioev, A. I. Vdovin, V. Yu. Ponomarev and J. Wambach, Phys. At. Nucl. 72 1320 (2009).
- [13] A. A. Dzhioev, A. I. Vdovin, V. Yu. Ponomarev, J. Wambach, K. Langanke and G. Martínez-Pinedo, Phys. Rev. C 81 015804 (2010).
- [14] N. Paar, G. Colò, E. Khan and D. Vretenar, Phys. Rev. C 80 055801 (2009).
- [15] A. F. Fantina, E. Khan, G. Colò, N. Paar and D. Vretenar, Phys. Rev. C 86, 035805 (2012).
- [16] Y. F. Niu, N. Paar, D. Vretenar and J. Meng, Phys. Rev. C 83 045807 (2011).
- [17] P. Moller and J. Randrup, Nucl. Phys. A 514 1 (1990).
- [18] S. G. Nilsson, Mat. Fys. Medd. Dan. Vid. Selsk 29 1-68 (1955).
- [19] K. Ikeda, S. Fujii and J. I. Fujita, Phys. Lett. 3 271 (1963).
- [20] I. Ragnarsson and R. K. Sheline, Phys. Scr. 29 385 (1984).
- [21] M. Hirsch, A. Staudt, K. Muto and H. V. KlapdorKleingrothaus, Nucl. Phys. A 535 62 (1991).
- [22] P. Möller, A. J. Sierk, T. Ichikawa and H. Sagawa, At. Data Nucl. Data Tables 109 1-204 (2016).
- [23] G. Audi, et al., Chines Phys. C 36 1157 (2012).
- [24] K. Muto, E. Bender and H. V. Klapdor, Z Phys. A 333 125 (1989).
- [25] J. A. Halbieb and R. A. Sorensen, Nucl. Phys. A 98 542 (1967).
- [26] J. Randrup, Nucl. Phys. A 207 209 (1973).
- [27] A. Staudt, et al., At. Data Nucl. Data Tables, 44 79-132 (1990).
- [28] K. Muto, et al., Z. Phys. A, 341 407-415 (1992)
- [29] J. C. Hardy and I. S. Towner, Phys. Rev. C 055502 (2009).
- [30] J-U. Nabi and H. V. Klapdor-Kleingrothaus, At. Data Nucl. Data Tables 71 149 (1999).
- [31] N. B. Gove and M. J. Martin, At. Data Nucl. Data Tables 10 205 (1971).
- [32] W. P. Alford, et al., Nucl. Phys. A 531 97 (1991).
- [33] M. C. Vetterli, et al., Phy. Rev. C 40 559 (1989).
- [34] T. Rönnqvist, et al., Nucl. Phys. A 563 225 (1993).
- [35] E. Chabanat, P. Bonche, P. Haensel, J. Meyer and R. Schaeffer, Nucl. Phys. A 635 231 (1998).
- [36] P. Moller, J. R. Nix, W. D. Myers and W. J. Swiatecki, At. Data Nucl. Data Tables 59 185 (1995).
- [37] A. Poves, J. Sánchez-Solano, E. Caurier and F. Nowacki, Nucl. Phys. A 694 157 (2001).
- [38] M. Honma, T. Otsuka, B. A. Brown and T. Mizusaki, Phys. Rev. C 65 061301(R) (2004); Phys. Rev. C 69 034335 (2002).
- [39] K. Langanke and G. Martinez-Pinedo, At. Data Nucl. Data Tables 79 1 (2001).
- [40] T. A. Weaver, G. B. Zimmerman and S. E. Woosley, Astrophys. J. 225 1021-1029 (1978).
- [41] J. Pruet and G. M. Fuller, Ap. J. Suppl. Ser. 149 189-203 (2003).
- [42] M. Majid and J-U. Nabi, Rom. Rep. Phys. 68 1447-1465 (2016).

| A | N | B(GT-) | B(GT+) | ISRre (cal) | ISRre (th) |
|---|---|---|---|---|---|
| 45 | 24 | 4.85 | 1.61 | 3.24 | 3.24 |
| 55 | 30 | 8.40 | 3.00 | 5.40 | 5.40 |
| T9 | EC | PE | T9 | EC | PE | ||
|---|---|---|---|---|---|---|---|
| 102 | 0.7 | -13.999 | -18.130 | 108 | 0.7 | -7.342 | -18.130 |
| 102 | 1 | -11.228 | -14.699 | 108 | 1 | -5.504 | -14.699 |
| 102 | 1.5 | -8.587 | -12.053 | 108 | 1.5 | -4.070 | -12.049 |
| 102 | 2 | -7.130 | -10.754 | 108 | 2 | -3.345 | -10.742 |
| 102 | 3 | -5.472 | -9.491 | 108 | 3 | -2.598 | -9.454 |
| 102 | 5 | -3.808 | -6.785 | 108 | 5 | -1.945 | -6.777 |
| 102 | 10 | -1.788 | -3.322 | 108 | 10 | -1.080 | -3.305 |
| 102 | 15 | -0.308 | -2.198 | 108 | 15 | -0.043 | -2.178 |
| 102 | 20 | 0.746 | -1.681 | 108 | 20 | 0.861 | -1.665 |
| 102 | 25 | 1.502 | -1.402 | 108 | 25 | 1.561 | -1.391 |
| 102 | 30 | 2.075 | -1.236 | 108 | 30 | 2.109 | -1.228 |
| 105 | 0.7 | -11.060 | -18.130 | 1011 | 0.7 | 3.794 | -18.130 |
| 105 | 1 | -9.207 | -14.699 | 1011 | 1 | 3.794 | -14.699 |
| 105 | 1.5 | -7.711 | -12.050 | 1011 | 1.5 | 3.796 | -12.049 |
| 105 | 2 | -6.812 | -10.748 | 1011 | 2 | 3.802 | -10.742 |
| 105 | 3 | -5.414 | -9.487 | 1011 | 3 | 3.832 | -9.454 |
| 105 | 5 | -3.799 | -6.785 | 1011 | 5 | 3.907 | -6.777 |
| 105 | 10 | -1.787 | -3.322 | 1011 | 10 | 4.060 | -3.300 |
| 105 | 15 | -0.308 | -2.198 | 1011 | 15 | 4.319 | -2.152 |
| 105 | 20 | 0.746 | -1.681 | 1011 | 20 | 4.600 | -1.609 |
| 105 | 25 | 1.502 | -1.402 | 1011 | 25 | 4.819 | -1.307 |
| 105 | 30 | 2.075 | -1.236 | 1011 | 30 | 4.981 | -1.121 |
| T9 | EC | PE | T9 | EC | PE | ||
|---|---|---|---|---|---|---|---|
| 102 | 0.7 | -29.155 | -36.954 | 108 | 0.7 | -12.599 | -36.954 |
| 102 | 1 | -22.355 | -28.101 | 108 | 1 | -10.607 | -28.101 |
| 102 | 1.5 | -16.413 | -21.208 | 108 | 1.5 | -8.580 | -21.206 |
| 102 | 2 | -13.186 | -17.668 | 108 | 2 | -7.307 | -17.661 |
| 102 | 3 | -9.684 | -13.436 | 108 | 3 | -5.814 | -13.427 |
| 102 | 5 | -6.438 | -9.331 | 108 | 5 | -4.272 | -9.314 |
| 102 | 10 | -2.440 | -5.911 | 108 | 10 | -1.697 | -5.868 |
| 102 | 15 | -0.280 | -4.798 | 108 | 15 | -0.008 | -4.759 |
| 102 | 20 | 1.034 | -4.285 | 108 | 20 | 1.152 | -4.260 |
| 102 | 25 | 1.922 | -4.010 | 108 | 25 | 1.982 | -3.993 |
| 102 | 30 | 2.571 | -3.847 | 108 | 30 | 2.606 | -3.836 |
| 105 | 0.7 | -26.135 | -36.954 | 1011 | 0.7 | 4.010 | -36.954 |
| 105 | 1 | -20.296 | -28.101 | 1011 | 1 | 4.010 | -28.101 |
| 105 | 1.5 | -15.523 | -21.206 | 1011 | 1.5 | 4.010 | -21.206 |
| 105 | 2 | -12.863 | -17.665 | 1011 | 2 | 4.010 | -17.661 |
| 105 | 3 | -9.624 | -13.434 | 1011 | 3 | 4.014 | -13.427 |
| 105 | 5 | -6.428 | -9.331 | 1011 | 5 | 4.029 | -9.314 |
| 105 | 10 | -2.439 | -5.911 | 1011 | 10 | 4.152 | -5.858 |
| 105 | 15 | -0.279 | -4.798 | 1011 | 15 | 4.579 | -4.707 |
| 105 | 20 | 1.035 | -4.285 | 1011 | 20 | 5.021 | -4.163 |
| 105 | 25 | 1.922 | -4.010 | 1011 | 25 | 5.328 | -3.862 |
| 105 | 30 | 2.571 | -3.847 | 1011 | 30 | 5.538 | -3.681 |