Single Document Image Highlight Removal via A Large-Scale Real-World Dataset and A Location-Aware Network
Abstract.
Reflective documents often suffer from specular highlights under ambient lighting, severely hindering text readability and degrading overall visual quality. Although recent deep learning methods show promise in highlight removal, they remain suboptimal for document images, primarily due to the lack of dedicated datasets and tailored architectural designs. To tackle these challenges, we present DocHR14K, a large-scale real-world dataset comprising 14,902 high-resolution image pairs across six document categories and various lighting conditions. To the best of our knowledge, this is the first high-resolution dataset for document highlight removal that captures a wide range of real-world lighting conditions. Additionally, motivated by the observation that the residual map between highlighted and clean images naturally reveals the spatial structure of highlight regions, we propose a simple yet effective Highlight Location Prior (HLP) to estimate highlight masks without human annotations. Building on this prior, we present the Location-Aware Laplacian Pyramid Highlight Removal Network (L²HRNet), which effectively removes highlights by leveraging estimated priors and incorporates diffusion module to restore details. Extensive experiments demonstrate that DocHR14K improves highlight removal under diverse lighting conditions. Our L2HRNet achieves state-of-the-art performance across three benchmark datasets, including a 5.01% increase in PSNR and a 13.17% reduction in RMSE on DocHR14K.

1. Introduction
Imagine trying to scan or photograph a document only to find that glaring reflections and bright spots obscure critical information, making text hard to read and essential details easy to miss. This challenge is all too common in everyday scenarios where ambient lighting creates harsh reflections on glossy or smooth surfaces. These specular highlights not only degrade image quality, but also severely impact the performance of text-related vision tasks such as document enhancement (Kligler et al., 2018), optical character recognition (OCR) (Bissacco et al., 2013; Shi et al., 2016; Qiao et al., 2022; Li et al., 2022), and layout analysis (Zhong et al., 2019; Li et al., 2020; Xu et al., 2020; Li et al., 2022).
Removing highlights from digital document images remains a challenging problem. Traditional physics-based illumination models (Shafer, 1985; Bajcsy et al., 1996; Tan and Ikeuchi, 2005; Yoon et al., 2006; Kim et al., 2013; Akashi and Okatani, 2015; Yang et al., 2014; Guo et al., 2018; Yamamoto and Nakazawa, 2019) often struggle in real-world settings due to their strict assumptions. While recent deep learning approaches (Fu et al., 2021; Wu et al., 2021; Fu et al., 2023; Hu et al., 2024; Guo et al., 2014; Zhang et al., 2024) have shown promise on natural images, they are generally designed for low-resolution, general scenes. As a result, they are less effective on high-resolution document images, where preserving fine details like text and graphics is critical (Li et al., 2023). This challenge is further exacerbated by the lack of large-scale document datasets that capture diverse lighting conditions, limiting the ability of models to generalize and effectively remove highlights across real-world scenarios.
To address these limitations, we introduce DocHR14K, a large-scale dataset comprising 14,902 paired highlight and highlight-free document images. Typical images are given in Figure 1. Unlike existing highlight removal datasets, DocHR14K covers various document types with rich textual content, ranging from books and posters to more uncommon forms like menus and ID cards. Moreover, while prior datasets often assume that specular chromaticity is uniform (i.e., highlight is colorless), our dataset captures images under nine representative colored lighting conditions, enabling better generalization to real-world scenarios. Furthermore, motivated by the observation that the residual map of highlight-contaminated and clean images naturally reveals the spatial structure of highlight regions, we introduce a simple yet effective Highlight Location Prior (HLP) to estimate highlight masks without annotations. Based on HLP, we propose Location-Aware Laplacian pyramid-based Highlight Removal Network (L2HRNet), which incorporates the estimated highlight prior to enhance highlight removal and uses a diffusion module (Sohl-Dickstein et al., 2015; Ho et al., 2020; Song et al., 2020; Saharia et al., 2022) to refine fine details. Specifically, we first decompose the document image into low- and high-frequency components, where the former capture global highlight patterns and the latter preserve fine details. For the low-frequency band, we design a two-stage cascade network: a Highlight Detection Network (HDNet) first predicts a soft highlight mask, which then guides a Highlight Removal Network (HRNet) to suppress global highlights. As for the high-frequency band, we introduce a Diffusion-based Enhancement Module (DEM) to achieve fine-grained textual details recovery. Experiments show that the diverse attributes of DocHR14K enhance model generalization across real-world scenarios, enabling models to handle complex visual variations in document images effectively. Furthermore, our method achieves state-of-the-art performance, not only showing a 5.01% improvement in PSNR and a 13.17% improvement in RMSE on DocHR14K, but also achieving a significant PSNR gain from 24.430dB to 27.558dB on the RD dataset compared to previous methods. Our main contributions are summarized as follows:
-
•
We present DocHR14K, a large-scale, high-resolution dataset for document image highlight removal. Unlike existing datasets, it includes six document types and nine lighting conditions, better reflecting real-world scenarios.
-
•
We design L2HRNet, a location-aware Laplacian Pyramid-based network that leverages the proposed Highlight Location Prior (HLP) to guide highlight removal, and incorporate diffusion-based enhancemnt module (DEM) to restore text information.
-
•
Extensive experiments demonstrate that DocHR14K effectively supports highlight removal under diverse lighting and content conditions. Additionally, our L2HRNet outperforms previous methods across multiple benchmarks.
| Datasets | Source | Number of Pairs | Mean Resolution | Method | Domain | Daily | Color |
|---|---|---|---|---|---|---|---|
| SD1, SD2, RD | PRCV’21 | 30,000 | 512 × 512 | Synthetic + Illumination Toggling | Text In The Wild | No | No |
| SHIQ | CVPR’21 | 10,825 | 200 × 200 | Synthesis | Natural | No | No |
| PSD | TMM’21 | 13,380 | 738 × 512 | Cross Polarization | Natural | No | No |
| SSHR | ICCV’23 | 135,000 | 256 × 256 | Synthesis | Object-Level | No | No |
| SHDocs | NIPS’24 | 19,104 | 1,224 × 1,024 | Cross Polarization | Document | No | No |
| DocHR14K | Ours | 14,902 | 2,319 × 1,553 | Cross Polarization | Document | 3,405 | 2,511 |
2. Related Works
2.1. Image Highlight Removal Dataset
Specular highlight removal has long been recognized as a challenging problem in imaging processing. With the advent of deep learning, several large-scale benchmark datasets have been curated to facilitate the development and evaluation of highlight removal algorithms. Wu et al. (Wu et al., 2021) introduced the first large-scale dataset (PSD) for highlight removal, constructed under controlled laboratory conditions using a cross-polarization setup. Concurrently, Fu et al. (Fu et al., 2021) proposed SHIQ, a dataset targeting natural scenes, generated through post-processed multi-image highlight separation (Guo et al., 2014). To extend the applicability to object-level scenarios, Fu et al. (Fu et al., 2023) further presented SSHR, a synthetic dataset comprising 135K images rendered using 3D object models and high-dynamic-range (HDR) environment maps. More recently, Zhang et al. (Zhang et al., 2024) introduced NSH, a real-world dataset captured under natural lighting using a multi-illumination acquisition system. In the context of document images, Hou et al.(Hou et al., 2021) proposed the first dataset for text image highlight removal, comprising image pairs either synthetically generated or captured by turning off the light source. However, these approaches either fail to reproduce realistic highlight distortions or suffer from inconsistent global illumination between image pairs, limiting their effectiveness for supervised learning. To further advance the field, Leong et al. (Leong et al., 2024) constructed SHDocs, a cross-polarization-based dataset tailored for highlight removal in printed materials. Despite its precise alignment and high capture quality, SHDocs is restricted to grayscale imaging, a limited set of document types, and fixed LED lighting conditions, thereby hindering its generalization to broader real-world scenarios.
In contrast, our dataset is the first high-resolution document highlight dataset that includes a wide variety of document types and lighting conditions, providing a solid foundation for advancing future research in real-world document image highlight removal.
2.2. Image Highlight Removal Method
Highlight removal methods have evolved significantly in recent years.Wu et al. (Wu et al., 2021) proposed a GAN-based framework that integrates global contextual reasoning with highlight detection cues to guide restoration. Fu et al. (Fu et al., 2021) designed a joint highlight detection and removal network based on a physically-inspired highlight formation model, leveraging dilated convolutions to enhance contextual awareness. Subsequently, Fu et al. (Fu et al., 2023) introduced a three-stage decomposition network that separates input images into albedo, shading, and specular residual components for more structured object-level highlight removal. To better capture global dependencies, Guo et al. (Guo et al., 2024) employed a Transformer-based architecture that models inter-channel correlations and long-range spatial interactions, resulting in coherent and perceptually consistent outputs. More recently, Zhang et al. (Zhang et al., 2024) proposed a spatially valid pixel learning framework that selectively restores highlight-contaminated regions using context-aware fusion and location-sensitive feature transformations.
Unlike previous works, we present the first network specifically tailored for high-resolution document images. Our method exploits Laplacian Pyramid decomposition (Burt and Adelson, 1987) to separate and process frequency components, incorporates a residual-based highlight location prior for spatial guidance, and applies a residual diffusion model to restore fine text structures. Together, these innovations enable accurate and detail-preserving highlight removal under complex real-world conditions.


3. DocHR14K Dataset
Existing highlight removal datasets either focus on natural images without textual content or lack diversity in document types and lighting conditions. As highlighted in Table 1, current datasets do not effectively support document highlight removal tasks, as they lack coverage of diverse lighting conditions needed for real-world scenarios. Therefore, we have assembled a collection of 14,902 image pairs from real-world scenarios. These images, with an average resolution of 2319 × 1553, span six representative document categories and are captured under nine standard lighting colors from five distinct angles. The following presents the detailed descriptions of the dataset construction process.
3.1. Dataset Construction
To support highlight removal under diverse lighting conditions, it is necessary to collect pairs of document images, one with highlights and one without, captured under varying illumination settings, including daily-living lighting. However, current techniques such as cross-polarization (Wu et al., 2021; Wolff and Boult, 1991; Wen et al., 2021; Leong et al., 2024), while effective in controlled lab environments, often struggle in everyday settings. Hence, we first refine the cross-polarization method to better suit daily living conditions for collecting image pairs. We then capture images in both laboratory and real-world settings, covering a wide range of document types and lighting conditions to enhance the diversity of the dataset. Finally, the image post-processing is applied to maintain the quality and consistency of the dataset. Details of these strategies are elaborated as follows.


Cross-Polarization Improvement. As shown in Figure 2(d), the prevailing cross-polarization technique (Wu et al., 2021) modifies incident light by positioning a linear polarizer directly in front of the light source, transforming it into polarized light. Subsequently, a circular polarizing lens (CPL) is mounted in front of the camera lens to selectively filter this polarized light, thus capturing a diffuse image. Nevertheless, such an approach proves impractical in real-life settings where light sources, such as ceiling-mounted fluorescent tubes, are not readily accessible for modifications. This limits its applicability in common environments outside controlled setups.
To this end, we re-evaluate the cross-polarization process, identifying the polarization of incident light as the critical step. As shown in Figure 2(e), our improved methodology involves placing the linear polarizer close to the subject of the photograph rather than the light source. This adjustment ensures that all light interacting with the polarizer becomes polarized. When the axis of this linear polarizer is aligned perpendicular to the CPL in front of the camera, a diffuse image is successfully produced (Wu et al., 2021). To manage any residual highlights resulting from light bypassing the linear polarizer, we employ targeted image post-processing techniques. This step is efficient, as highlights typically recur in consistent locations under uniform lighting conditions. Our approach offers two significant benefits: i) it facilitates the capture of diffuse images even in environments with multiple light sources, and ii) it removes the need to attach polarizers to each light source, which is often impractical in real-world settings.
Dataset Diversification and Realization. Laboratory-based image collection provides controlled lighting conditions that enable the simulation of various light colors and intensities. For our dataset, we employ the Nanlite Pavo Slim 60c as our light source and a Nikon Z5 camera for imaging. To mitigate misalignment caused by unwanted movements, we utilize a metal bracket to secure the camera for vertical shots, capturing image pairs remotely via a mobile app, as depicted in Figure 2(a). For non-vertical angles that are more challenging, including 15°, 30°, 45°, and angles greater than 45°, we use a tripod to capture 3,027 image pairs, as shown in Figure 2(b).
During these sessions, a linear polarizer is positioned in front of the LED panel, with a CPL filter placed in front of the camera. Initially, the linear polarizer is adjusted to achieve a diffuse image, illustrated in Figure 2(b). Subsequently, the polarizer is rotated by 90 degrees to capture images with specular highlights, as demonstrated in Figure 2(c). In natural settings, we select four typical lighting conditions: LED lamps, bar lights, ring lights, and fluorescent tubes. A 50 cm square linear polarizer is strategically placed above the document to polarize the incident light. The polarizer is first adjusted to secure a diffuse image, followed by a vertical rotation to capture the highlight image.
Post Processing. After collecting image pairs, we first organize highlight-diffuse pairs into corresponding folders and crop out areas with unwanted highlight residuals. Next, we remove misaligned pairs by calculating the residual image and checking for image misalignment outside the highlight region. Each image pair is then annotated with its document category and light color, providing fine-grained labels to support related tasks. Additionally, quality control is made by stratified sampling based on document category, lighting type, language, shooting angle, and environment. 111Detail of quality control can be found in Section A of the supplementary material.
3.2. Characteristics of DocHR14K Dataset
Our DocHR14K dataset stands out from existing highlight removal datasets due to several distinctive and challenging characteristics. Please refer to Figure 1 for visualizations of the resultant examples from our dataset.
(1) High-resolution image pairs. As shown in Table 1, our dataset is a high-resolution highlight removal dataset, with the highest average resolution (2319 × 1553) among existing datasets.
(2) Diverse document categories. As illustrated in Figure 3(a), we provide 6 document types with corresponding labels: single leaf, book, poster, menu, card, and plastic-sleeved document. Each image is labeled with its corresponding document categories.
(3) Varied light sources. As shown in Figure 3(b), our dataset has 4 primary categories of lighting conditions: cold light, white light, warm light, which are frequently encountered in real-life settings, and color lighting conditions. The color lighting category further comprises six representative colors, selected at 60-degree intervals in the HSV color space: red (0 degrees), yellow (60 degrees), green (120 degrees), cyan (180 degrees), blue (240 degrees), and purple (300 degrees). Each image is labeled with its corresponding color information.
(4) Varied shooting angles. As shown in Figure 3(c), We collect 3,027 image pairs captured at non-vertical angles to simulate scenarios where a vertical digital copy of the document is hard to obtain. Specifically, we provide 4 progressively increasing angles, ranging from 15 to 60 degrees, to reflect diverse real-world conditions.
(5) Daily-living lighting conditions. As shown in Figure 3(d), We collect 3,405 image pairs in everyday lighting scenarios, including desk lamps, bar lights, ring lights, and fluorescent tubes. This is the first highlight removal dataset that includes common lighting conditions benefiting from our improved cross-polarization pipeline.222Real world illustrations of the improved cross-polarization method are given in Section C of the supplementary material.
4. L2HRNet

In this section, we first present the Highlight Location Prior (HLP), which generates structurally aligned pseudo highlight masks. Then, we describe the structure of our tailored Location-Aware Laplacian Pyramid-based Highlight Removal Network (L2HRNet), which performs global highlight removal in the low-frequency band guided by the estimated highlight mask, and refines fine textural details in the high-frequency band via the Diffusion-based Enhancement Module (DEM).
| Dataset | Method | ACC | BER |
|---|---|---|---|
| RD | Wu et al. (Wu et al., 2023) | 0.89 | 50.48 |
| Input + Otsu (baseline) | 0.37 | 36.3 | |
| Residual + Otsu | 0.97 | 4.58 | |
| Residual + Stretch + Otsu | 0.98 | 5.79 | |
| SHIQ | JSHDR (Fu et al., 2021) | 0.93 | 5.92 |
| Wu et al. (Wu et al., 2023) | 0.97 | 5.92 | |
| Input + Otsu (baseline) | 0.59 | 21.9 | |
| Residual + Otsu | 0.93 | 3.90 | |
| Residual + Stretch + Otsu | 0.97 | 2.16 |


4.1. Highlight Location Prior
Precise localization of specular highlights is critical for effective highlight removal. However, fine-grained manual annotation is both labor-intensive and time-comsuming. To address this, we propose a simple yet effective highlight location prior derived directly from aligned image pairs.
We compute a residual map by subtracting the highlight-free grayscale image from the highlighted one and retaining only the positive values. We compute the residual map m as follows:
| (1) |
where represents the low-frequency component of the ground truth image. This residual naturally captures the spatial structure introduced by highlight regions. We apply contrast stretching by clipping the residual map below a lower percentile threshold , where is set to 80% in our experiments. This suppresses weak background noise and enhances the visibility of strong highlight regions. The resulting grayscale residual is used directly as a soft spatial prior—without any hard thresholding—enabling smooth supervision and preserving boundary transitions.
To assess the effectiveness of the residual prior, we additionally apply Otsu(Otsu et al., 1975) thresholding to obtain binary highlight masks for evaluation, as the metrics require binary masks. However, during training, we retain the continuous-valued residual map to preserve richer information. For comparison, we also apply Otsu thresholding directly to the original highlight image. This comparison helps demonstrate that even a simple residual map—without any learned model—can achieve strong spatial alignment with ground-truth highlights. Two widely used metrics (Fu et al., 2021; Wu et al., 2023), accuracy (ACC) and balanced error rate (BER), are used to evaluate the generated masks. As shown in Table 2, residual-based masks significantly outperform the baseline and even surpass recent learning-based detectors (Fu et al., 2021; Wu et al., 2023) on SHIQ dataset (Fu et al., 2021). Additionally, as illustrated in Figure 5, the residual map effectively captures the highlight regions, and the resulting binary masks align closely with the ground truth, which further validates the effectiveness of our residual-based approach.
4.2. Laplacian Pyramid
As illustrated on the left side of Figure 4, we first use the LP to decompose the document image into high-frequency components , which preserve textures and edges, and a low-frequency component that retains overall global illumination information. Here, represents the total number of decomposition levels. Then, we process the low-frequency component with HLP guidance to achieve location-aware highlight removal, resulting in , shown in the lower middle of Figure 4. Furthermore, the high-frequency components undergo high-frequency-specific processing to restore text clarity and edge details, producing outputs , depicted in the upper middle of Figure 4. Finally, we reconstruct the highlight-free image by iteratively combining these processed layers, yielding the final output displayed on the right side of Figure 4.
4.3. Low-frequency Location-Aware Highlight Removal
As illustrated in Figure 4, we design a two-stage cascaded architecture to remove global highlights in the low-frequency band. The first stage estimates a spatially continuous highlight prior, while the second stage performs spatially guided restoration.
Stage 1: Highlight Prior Estimation. The spatial prior is supervised using pseudo masks generated from residual maps between highlight and highlight-free images (see Sec. 4.1). We use a Highlight Detection Network (HDNet) to predict the soft highlight location prior from the low-frequency input :
| (2) |
Stage 2: Prior-guided Highlight Removal. The estimated prior is concatenated with the low-frequency input and passed to a Highlight Removal Network (HRNet), enabling spatially adaptive highlight removal:
| (3) |
This two-stage approach effectively estimates and utilizes the prior to guide highlight removal in the low-frequency band.
4.4. High-frequency Detail Recovery
While our cascade network can effectively achieve global illumination recovery, fine-grained text edge informations are missing in the high-frequency band, which are important for OCR and text recognition by human. Therefore, in the high-frequency band, we employ Diffusion-based Enhancement Module (DEM), which has shown effectiveness in restoring fine document details in previous works (Yang et al., 2023; Cicchetti and Comminiello, 2024), to accurately recover high-frequency elements. Additionally, to optimize memory usage and improve inference speed, we apply the diffusion model only to the high-frequency component , which has a manageable resolution. The process is illustrated by the brown arrows in Figure 4.
The diffusion model loss is defined as:
| (4) |
where represents the target residual with denoting the LP decomposition component from layer of the ground truth image. The conditioning input , where denotes the upsampling operation. is the denoising network that predicts , is the accumulated noise scaling factor, is Gaussian noise, and denotes the timestep in the diffusion process. It is worth noting that directly predicting can improve detail recovery quality but slightly reduces diversity according to (Yang et al., 2023; Cicchetti and Comminiello, 2024). However, this is acceptable for highlight removal tasks since it is the recovery task instead of the creation task. To further increase efficiency, we utilize the DPM-Solver (Lu et al., 2022) to minimize the number of iterations in the reverse process, enabling faster convergence without compromising high-frequency detail recovery. For other high-frequency components (e.g., ), we progressively refine details through convolution layers, residual blocks, and a texture recovery module, as shown by the purple arrows in Figure 4.
4.5. Loss Function
HDNet is trained in a supervised manner using the pseudo mask generated by HLP:
| (5) |
where represents the balancing weight for the Total Variation loss (Rudin et al., 1992), which could smooth predictions and reduce artifacts and is chosen as 0.00005 in our experiment.
To preserve the original details, we use the Mean Squared Error loss () (Ren et al., 2016), and Structural Similarity Index Measure loss () (Wang et al., 2004) to compare the recovered image with the ground truth image . The diffusion loss is utilized to enhance high-frequency detail recovery. Additionally, we incorporate a structure consistency loss (Simonyan and Zisserman, 2014) to ensure structural consistency:
| (6) |
where VGG(·) is the feature extractor from the pre-trained VGG19 model. The total loss function can be expressed as follows:
| (7) |
where , , , are the weights to balance each item.
5. Experiment


5.1. Experimental Setups
Implementation Details. Our network is implemented using PyTorch and trained on six NVIDIA RTX 4090 GPUs for a duration of two and a half days. We initialize the learning rate at and set the batch size to . We train the L2HRNet for an extensive 1000 epochs in an end-to-end manner. The coefficients of our network, , , and are experimentally determined to be 0.4, 1.0, 0.1 and 0.5, respectively. For the denoising network , we use a lightweight variant of nonlinear activation-free network (Cicchetti and Comminiello, 2024; Chen et al., 2022). To enhance robustness and generalization, we apply random flips and rotations for data augmentation.
Benchmark Datasets and Evaluation Metrics. In addition to DocHR14K, we conduct highlight removal experiments on two benchmark datasets: (1) RD (Liang et al., 2021) dataset includes 1800 training and 255 testing pairs (highlight images and highlight-free images). (2) SHIQ dataset (Fu et al., 2021), a widely used benchmark for image specular highlight removal, which comprises of 9825 training and 1000 testing pairs of highlight and highlight-free images. All methods are evaluated with three common-used full-reference metrics, i.e. PSNR, SSIM (Wang et al., 2004), and RMSE. PSNR focuses on pixel-level accuracy, SSIM emphasizes perceptual quality and structural similarity, and RMSE provides a straightforward numerical error to evaluate the quality.
| Methods | Venue/Year | DocHR14K | RD | SHIQ | ||||||
|---|---|---|---|---|---|---|---|---|---|---|
| PSNR | SSIM | RMSE | PSNR | SSIM | RMSE | PSNR | SSIM | RMSE | ||
| Yang et al. (Yang et al., 2010) | ECCV/2010 | 15.505 | 0.688 | 49.670 | 12.094 | 0.493 | 66.660 | 23.168 | 0.772 | 23.147 |
| Akashi et al. (Akashi and Okatani, 2015) | ACCV/2014 | 18.519 | 0.640 | 32.908 | 15.849 | 0.394 | 42.314 | 21.953 | 0.633 | 22.156 |
| SpecularityNet (Wu et al., 2021) | TMM/2021 | 22.783 | 0.836 | 19.943 | 22.325 | 0.874 | 20.944 | 30.008 | 0.933 | 9.776 |
| JSHDR (Fu et al., 2021) | CVPR/2021 | 18.449 | 0.695 | 32.665 | 12.112 | 0.482 | 65.778 | 34.131 | 0.860 | - |
| TSHRNet (Fu et al., 2023) | ICCV/2023 | 21.057 | 0.781 | 24.508 | 19.082 | 0.835 | 29.482 | 32.086 | 0.928 | 7.117 |
| DHAN-SHR (Guo et al., 2024) | ACM MM/2024 | 25.439 | 0.871 | 14.984 | 23.674 | 0.894 | 17.772 | 32.425 | 0.930 | 7.134 |
| HighlightRemover (Zhang et al., 2024) | ACM MM/2024 | 26.650 | 0.918 | 12.754 | 24.377 | 0.884 | 16.622 | 30.231 | 0.947 | 10.226 |
| DocShadowNet (Li et al., 2023) | ICCV/2023 | 26.600 | 0.919 | 13.015 | 24.430 | 0.886 | 16.158 | 31.982 | 0.951 | 7.494 |
| L2HRNet | Ours | 27.995 | 0.928 | 11.301 | 27.558 | 0.905 | 11.921 | 32.710 | 0.961 | 6.780 |
5.2. Comparison with State-of-the-Art Methods
Quantitative Comparison. As shown in Table 3, we evaluate six highlight removal methods: Yang et al. (Yang et al., 2010), Akashi et al. (Akashi and Okatani, 2015), SpecularityNet (Wu et al., 2021), JSHDR (Fu et al., 2021), TSHRNet (Fu et al., 2023), and DHAN-SHR (Guo et al., 2024). Additionally, we assess a document shadow removal method DocShadowNet (Li et al., 2023), which is a laplacian pyramid based image restoration method. Table 3 shows the quantitative results on the testing sets over DocHR14K, RD and SHIQ, respectively. The results demonstrate that our method outperforms all the metrics on DocHR14K and RD dataset, which consist of real-world document or text-related images, demonstrating the effectiveness of our approach for document image highlight removal. As for the SHIQ dataset, a widely used benchmark for natural image highlight removal, our method achieves the best performance in SSIM and RMSE, further showing its applicability beyond document images. These results highlight the superior performance and strong generalization ability of our method on different dataset.
Qualitative Comparison. Figure 6 presents the visual results of four SOTA methods compared with our L2HRNet on DocHR14K.333Due to space limitations, we present a subset of qualitative results in Figure 6. Additional results are provided in Section D of the supplementary material. Note that the results from JSHDR are obtained using the executable file provided by the authors. The outcomes show that methods designed for low-resolution inputs (i.e., JSHDR and TSHRNet) struggle to effectively remove highlights, resulting in residual highlights and a loss of important high-frequency details, possibly because they are designed for low-resolution images. On the other hand, while DHAN-SHR and DocShadowNet can handle high-resolution images, they lack explicit highlight localization mechanisms, making them suboptimal in terms of both highlight removal and text detail restoration. In contrast, our L2HRNet achieves superior global highlight suppression and sharper textual recovery, which can be attributed to the spatial guidance provided by the residual-based highlight location prior and the refinement capability of the proposed diffusion enhancement module. 444Additional qualitative comparison results of our method against SOTA methods in RD and SHIQ dataset are given in Section D of the supplementary material.
5.3. Ablation Study and Discussions
Effectiveness of Different Components in L2HRNet. To assess the effectiveness of each component, we conduct an ablation study on DocHR14K, evaluating three key components: the highlight detection network (HDNet), the diffusion-based enhancement module (DEM), and the highlight-aware supervision loss . Removing results in a decrease in performance, demonstrating the benefit of highlight location prior. Excluding the DEM also leads to a reduction in performance, likely due to its role in restoring high-frequency details essential for document highlight removal. Similarly, removing both HDNet and results in a performance drop, underscoring the importance of the detection network and the associated supervision in improving highlight removal. Note that removing HDNet also eliminates , as depends on the output of HDNet. The best results are achieved when all components are included, highlighting the crucial role of each component.
| Model Configurations | PSNR | SSIM | RMSE | ||
|---|---|---|---|---|---|
| HDNet | DEM | ||||
| ✓ | 27.164 | 0.923 | 12.267 | ||
| ✓ | ✓ | 27.585 | 0.926 | 11.738 | |
| ✓ | 27.482 | 0.924 | 11.985 | ||
| ✓ | ✓ | 27.546 | 0.925 | 11.871 | |
| ✓ | ✓ | ✓ | 27.995 | 0.928 | 11.301 |
Effectiveness of Different Characteristics of DocHR14K. To evaluate the effectiveness of the different characteristics of our new dataset, three sets of experiments are given, which represent the document categories, color lighting, and images captured by different angles. For each characteristic ablation study, we first create a “w/o” training set, then identify the corresponding “full” training set with the same remaining variables (e.g., number of images). To make a fair comparison, all the experiments are realized based on DocShadowNet (Li et al., 2023), a SOTA method for document image restoration, with the same testing set. As shown in Table 5, training the model with additional dataset characteristics consistently improves performance over the baseline, demonstrating the importance of its diverse attributes. The results indicate that models trained on DocHR14K are better suited for handling a broad range of real-world scenarios, underscoring the advantages of DocHR14K for robust document highlight removal under various conditions.
| Ablation Study | PSNR | SSIM | RMSE |
|---|---|---|---|
| w/o cards | 24.732 | 0.907 | 16.393 |
| full document category | 26.533 | 0.919 | 13.145 |
| w/o color lighting | 23.703 | 0.895 | 18.619 |
| full light category | 24.660 | 0.906 | 16.341 |
| w/o non-vertical shooting | 20.908 | 0.850 | 25.727 |
| full shooting angle | 22.015 | 0.870 | 23.173 |
Discussion on Downstream Application. We further conduct experiments to evaluate the downstream application of DocHR14K and L2HRNet. We first evaluate five mainstream LLMs’ text recognition performance on document images disturbed by the highlight from DocHR14K. 555More details about LLMs and text-similarity are given in Section B of the supplementary material. We observe that only GPT-4o (Achiam et al., 2023) could obtain performance close to human recognition under the highlight disturbance, with a text-similarity of 80.9% provided by o1-preview, while the rest are below 50%. Next, we evaluate whether de-highlighted document results could enhance the performance of LLMs. Table 6 reports the outcomes from two SOTA methods JSHDR (Fu et al., 2021), DocShadowNet (Li et al., 2023) and ours. Experiments show that only L2HRNet could improve the recognition performance of GPT-4o, from 80.9% to 83.5%, which indicates that L2HRNet not only effectively recovers the global illumination feature but also the local underlying text information and could provide less highlight disturbed document images for downstream tasks.
| Method | JSHDR | DocShadowNet | Ours |
|---|---|---|---|
| Text-Similarity | 18.3% | 78.8% | 83.5% |
6. Conclusion
In this paper, we advance the document image highlight removal task by proposing a large-scale real-world dataset and a location-aware network. Specifically, We present DocHR14K, a high-resolution dataset comprising 14,902 image pairs across six document categories and various lighting conditions. This dataset provides a comprehensive foundation for developing and benchmarking highlight removal methods tailored to document scenarios. Moreover, we propose L2HRNet, a location-aware framework that removes highlights in the low-frequency band with spatial guidance and restores fine-grained textural details in the high-frequency band via the diffusion-based enhancement module. Extensive experiments demonstrate that the diverse characteristics of our DocHR14K contribute to improved highlight removal across various conditions and show the effectiveness of our L2HRNet, which achieves state-of-the-art performance in multiple benchmarks with a large margin.
References
- (1)
- Achiam et al. (2023) Josh Achiam, Steven Adler, Sandhini Agarwal, Lama Ahmad, Ilge Akkaya, Florencia Leoni Aleman, Diogo Almeida, Janko Altenschmidt, Sam Altman, Shyamal Anadkat, et al. 2023. Gpt-4 technical report. arXiv preprint arXiv:2303.08774 (2023).
- Akashi and Okatani (2015) Yasuhiro Akashi and Takayuki Okatani. 2015. Separation of reflection components by sparse non-negative matrix factorization. In ACCV. 611–625.
- Bajcsy et al. (1996) Ruzena Bajcsy, Sang Wook Lee, and Aleš Leonardis. 1996. Detection of diffuse and specular interface reflections and inter-reflections by color image segmentation. IJCV 17, 3 (1996), 241–272.
- Bissacco et al. (2013) Alessandro Bissacco, Mark Cummins, Yuval Netzer, and Hartmut Neven. 2013. Photoocr: Reading text in uncontrolled conditions. In ICCV. 785–792.
- Burt and Adelson (1987) Peter J Burt and Edward H Adelson. 1987. The Laplacian pyramid as a compact image code. In Readings in computer vision. Elsevier, 671–679.
- Chen et al. (2022) Liangyu Chen, Xiaojie Chu, Xiangyu Zhang, and Jian Sun. 2022. Simple baselines for image restoration. In ECCV. 17–33.
- Cicchetti and Comminiello (2024) Giordano Cicchetti and Danilo Comminiello. 2024. NAF-DPM: A Nonlinear Activation-Free Diffusion Probabilistic Model for Document Enhancement. arXiv preprint arXiv:2404.05669 (2024).
- Fu et al. (2021) Gang Fu, Qing Zhang, Lei Zhu, Ping Li, and Chunxia Xiao. 2021. A multi-task network for joint specular highlight detection and removal. In CVPR. 7752–7761.
- Fu et al. (2023) Gang Fu, Qing Zhang, Lei Zhu, Chunxia Xiao, and Ping Li. 2023. Towards high-quality specular highlight removal by leveraging large-scale synthetic data. In ICCV. 12857–12865.
- Guo et al. (2018) Jie Guo, Zuojian Zhou, and Limin Wang. 2018. Single image highlight removal with a sparse and low-rank reflection model. In ECCV. 268–283.
- Guo et al. (2014) Xiaojie Guo, Xiaochun Cao, and Yi Ma. 2014. Robust separation of reflection from multiple images. In CVPR. 2187–2194.
- Guo et al. (2024) Xiaojiao Guo, Xuhang Chen, Shenghong Luo, Shuqiang Wang, and Chi-Man Pun. 2024. Dual-Hybrid Attention Network for Specular Highlight Removal. In ACM MM. 10173–10181.
- Ho et al. (2020) Jonathan Ho, Ajay Jain, and Pieter Abbeel. 2020. Denoising diffusion probabilistic models. NIPS (2020), 6840–6851.
- Hou et al. (2021) Shiyu Hou, Chaoqun Wang, Weize Quan, Jingen Jiang, and Dong-Ming Yan. 2021. Text-aware single image specular highlight removal. In PRCV. 115–127.
- Hu et al. (2024) Kun Hu, Zhaoyangfan Huang, and Xingjun Wang. 2024. Highlight Removal Network Based on an Improved Dichromatic Reflection Model. In ICASSP. 2645–2649.
- Kim et al. (2013) Hyeongwoo Kim, Hailin Jin, Sunil Hadap, and Inso Kweon. 2013. Specular reflection separation using dark channel prior. In CVPR. 1460–1467.
- Kligler et al. (2018) Netanel Kligler, Sagi Katz, and Ayellet Tal. 2018. Document enhancement using visibility detection. In CVPR. 2374–2382.
- Leong et al. (2024) Jovin Leong, Koa Di, Benjamin Cham, and Shaun Heng. 2024. SHDocs: A dataset, benchmark, and method to efficiently generate high-quality, real-world specular highlight data with near-perfect alignment. NIPS (2024), 96924–96938.
- Li et al. (2022) Junlong Li, Yiheng Xu, Tengchao Lv, Lei Cui, Cha Zhang, and Furu Wei. 2022. Dit: Self-supervised pre-training for document image transformer. In ACM MM. 3530–3539.
- Li et al. (2020) Minghao Li, Yiheng Xu, Lei Cui, Shaohan Huang, Furu Wei, Zhoujun Li, and Ming Zhou. 2020. DocBank: A benchmark dataset for document layout analysis. arXiv preprint arXiv:2006.01038 (2020).
- Li et al. (2023) Zinuo Li, Xuhang Chen, Chi-Man Pun, and Xiaodong Cun. 2023. High-resolution document shadow removal via a large-scale real-world dataset and a frequency-aware shadow erasing net. In ICCV. 12415–12424.
- Liang et al. (2021) Jie Liang, Hui Zeng, and Lei Zhang. 2021. High-resolution photorealistic image translation in real-time: A laplacian pyramid translation network. In CVPR. 9392–9400.
- Lu et al. (2022) Cheng Lu, Yuhao Zhou, Fan Bao, Jianfei Chen, Chongxuan Li, and Jun Zhu. 2022. Dpm-solver: A fast ode solver for diffusion probabilistic model sampling in around 10 steps. NIPS (2022), 5775–5787.
- Otsu et al. (1975) Nobuyuki Otsu et al. 1975. A threshold selection method from gray-level histograms. Automatica 11, 285-296 (1975), 23–27.
- Qiao et al. (2022) Liang Qiao, Hui Jiang, Ying Chen, Can Li, Pengfei Li, Zaisheng Li, Baorui Zou, Dashan Guo, Yingda Xu, Yunlu Xu, Zhanzhan Cheng, and Yi Niu. 2022. DavarOCR: A Toolbox for OCR and Multi-Modal Document Understanding. In ACM MM. 7355–7358.
- Ren et al. (2016) Shaoqing Ren, Kaiming He, Ross Girshick, and Jian Sun. 2016. Faster R-CNN: Towards real-time object detection with region proposal networks. TPAMI 39, 6 (2016), 1137–1149.
- Rudin et al. (1992) Leonid I Rudin, Stanley Osher, and Emad Fatemi. 1992. Nonlinear total variation based noise removal algorithms. Physica D: nonlinear phenomena 60, 1-4 (1992), 259–268.
- Saharia et al. (2022) Chitwan Saharia, Jonathan Ho, William Chan, Tim Salimans, David J Fleet, and Mohammad Norouzi. 2022. Image super-resolution via iterative refinement. TPAMI 45, 4 (2022), 4713–4726.
- Shafer (1985) Steven A Shafer. 1985. Using color to separate reflection components. Color Research & Application 10, 4 (1985), 210–218.
- Shi et al. (2016) Baoguang Shi, Xiang Bai, and Cong Yao. 2016. An end-to-end trainable neural network for image-based sequence recognition and its application to scene text recognition. TPAMI 39, 11 (2016), 2298–2304.
- Simonyan and Zisserman (2014) Karen Simonyan and Andrew Zisserman. 2014. Very deep convolutional networks for large-scale image recognition. arXiv preprint arXiv:1409.1556 (2014).
- Sohl-Dickstein et al. (2015) Jascha Sohl-Dickstein, Eric Weiss, Niru Maheswaranathan, and Surya Ganguli. 2015. Deep unsupervised learning using nonequilibrium thermodynamics. In ICML. 2256–2265.
- Song et al. (2020) Jiaming Song, Chenlin Meng, and Stefano Ermon. 2020. Denoising diffusion implicit models. arXiv preprint arXiv:2010.02502 (2020).
- Tan and Ikeuchi (2005) Robby T Tan and Katsushi Ikeuchi. 2005. Separating reflection components of textured surfaces using a single image. TPAMI 27, 2 (2005), 178–193.
- Wang et al. (2004) Zhou Wang, Alan C Bovik, Hamid R Sheikh, and Eero P Simoncelli. 2004. Image quality assessment: from error visibility to structural similarity. TIP 13, 4 (2004), 600–612.
- Wen et al. (2021) Sijia Wen, Yinqiang Zheng, and Feng Lu. 2021. Polarization guided specular reflection separation. TIP 30 (2021), 7280–7291.
- Wolff and Boult (1991) Lawrence B. Wolff and Terrance E. Boult. 1991. Constraining object features using a polarization reflectance model. TPAMI 13, 07 (1991), 635–657.
- Wu et al. (2023) Zhongqi Wu, Jianwei Guo, Chuanqing Zhuang, Jun Xiao, Dong-Ming Yan, and Xiaopeng Zhang. 2023. Joint specular highlight detection and removal in single images via Unet-Transformer. CVM 9, 1 (2023), 141–154.
- Wu et al. (2021) Zhongqi Wu, Chuanqing Zhuang, Jian Shi, Jianwei Guo, Jun Xiao, Xiaopeng Zhang, and Dong-Ming Yan. 2021. Single-image specular highlight removal via real-world dataset construction. TMM 24 (2021), 3782–3793.
- Xu et al. (2020) Yiheng Xu, Minghao Li, Lei Cui, Shaohan Huang, Furu Wei, and Ming Zhou. 2020. Layoutlm: Pre-training of text and layout for document image understanding. In ACM SIGKDD. 1192–1200.
- Yamamoto and Nakazawa (2019) Takahisa Yamamoto and Atsushi Nakazawa. 2019. General improvement method of specular component separation using high-emphasis filter and similarity function. ITE Trans. Media Technol. Appl. 7, 2 (2019), 92–102.
- Yang et al. (2014) Qingxiong Yang, Jinhui Tang, and Narendra Ahuja. 2014. Efficient and robust specular highlight removal. TPAMI 37, 6 (2014), 1304–1311.
- Yang et al. (2010) Qingxiong Yang, Shengnan Wang, and Narendra Ahuja. 2010. Real-time specular highlight removal using bilateral filtering. In ECCV. 87–100.
- Yang et al. (2023) Zongyuan Yang, Baolin Liu, Yongping Xxiong, Lan Yi, Guibin Wu, Xiaojun Tang, Ziqi Liu, Junjie Zhou, and Xing Zhang. 2023. Docdiff: Document enhancement via residual diffusion models. In ACM MM. 2795–2806.
- Yoon et al. (2006) Kuk-Jin Yoon, Yoojin Choi, and In So Kweon. 2006. Fast separation of reflection components using a specularity-invariant image representation. In ICIP. 973–976.
- Zhang et al. (2024) Ling Zhang, Yidong Ma, Zhi Jiang, Weilei He, Zhongyun Bao, Gang Fu, Wenju Xu, and Chunxia Xiao. 2024. HighlightRemover: Spatially Valid Pixel Learning for Image Specular Highlight Removal. In ACM MM. 10046–10054.
- Zhong et al. (2019) Xu Zhong, Jianbin Tang, and Antonio Jimeno Yepes. 2019. Publaynet: largest dataset ever for document layout analysis. In ICDAR. 1015–1022.
In this supplementary material, Section 1 first provides the details and results of the quality control for DocHR14K. Next, Table 8 details the assessment of LLMs’ recognition performance under highlight disturbances. Then, Section 3 presents additional details for DocHR14K. Furthermore, Section 4 provides more qualitative comparisons of three benchmark datasets to support the main paper. Finally, Section 5 discusses the limitations of our approach and outlines directions for future work.
1. Quality Control
The details of the quality control process are outlined below. To comprehensively evaluate our dataset, we employ stratified sampling based on document category, lighting type, language, shooting angle, and environment. We select 10% of the image pairs from DocHR14K, resulting in 1,490 samples. These samples are then randomly divided into three groups and evaluated by three well-trained personnel by answering the following four questions:
-
•
: Is the highlighted image captured clearly without any blur?
-
•
: Has the corresponding highlight been completely removed in the ground truth image?
-
•
: Is the text in the non-highlighted document image clear and legible?
-
•
: Are there any new artifacts or distortions in the non-highlighted document image?
| Question | ||||
|---|---|---|---|---|
| Rating | 100% | 98.3% | 99.5% | 98.7% |
As reported in Table 7, indicates that all the evaluated images are well-captured without any blurring. Additionally, demonstrates that the majority of diffuse images are completely free from highlight residuals. Furthermore, , shows that almost all text information in the diffuse images is clear and legible, which is suitable to be the reference. Finally, presents that only minimal artifacts or distortions, such as illumination or color inconsistencies, are introduced in the diffuse images. In summary, Table 7 indicates that DocHR14K achieves high standards in image clarity, highlight removal, text preservation, and artifact minimization, which also proves the effectiveness of our highlight-diffuse image-collecting procedure.
2. Evaluation of LLMs
Recently, large language models (LLMs), particularly vision language models, have demonstrated strong proficiency in processing both image and text information. Hence, we conduct experiments to evaluate the performance of LLMs under the disturbance of highlight.
In detail, we select 50 samples from DocHR14K and send them to the LLMs with the prompt to let them give the recognition outcome. We note that some of the LLMs will give a combination of the recognition answer and meaningless result on the document image degraded by highlight. To make a fair comparison, we use the SOTA model GPT “o1-preview” to assess the text similarity between the output result and the ground truth text information recognized by humans. Five LLMs are evaluated: LLaVA-7B, LLaVA-13B, mPLUG-Owl, Qwen-VL, and GPT-4o . As exhibited in Table 8, GPT-4o achieves similar results compared with humans, while other LLMs are less than 50%. Exhibited in Figure 7, We also observe that GPT-4o prefers to overlook the degraded regions and gives answers like “I’m sorry, I can’t read some parts of the text due to the image quality and lighting.” In contrast, other LLMs tend to give unrelated answers when the highlight disturbs severely. The experiment above indicates that GPT-4o could achieve better recognition performance under the highlight disturbance during text recognition.
| Models | LLaVA-7B | LLaVA-13B | mPLUG-Owl 2 | Qwen-VL | GPT-4o |
|---|---|---|---|---|---|
| Text-Similarity | 0.295 | 0.352 | 0.209 | 0.446 | 0.809 |

3. More Details of DocHR14K
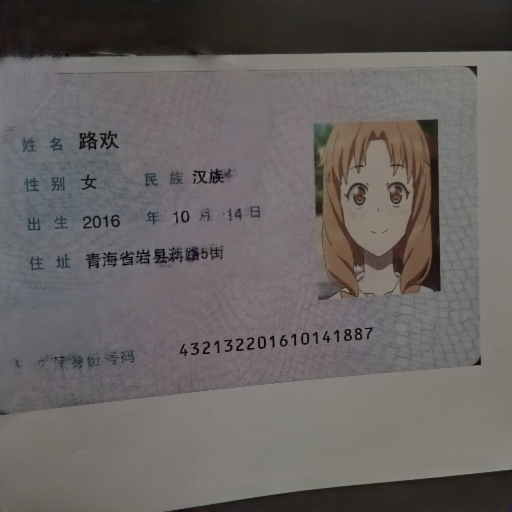
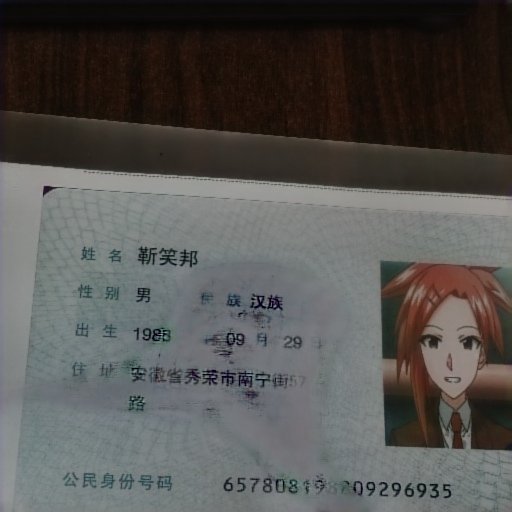
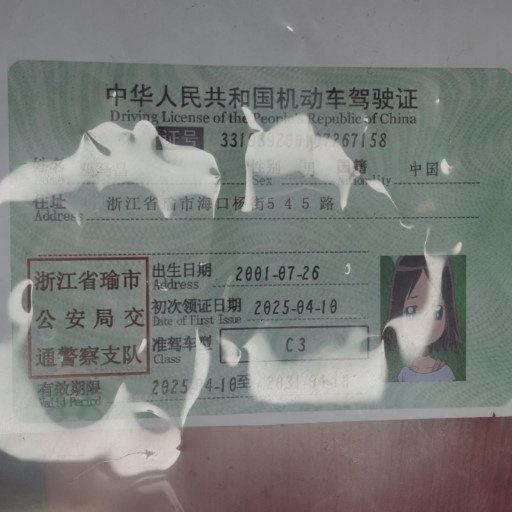
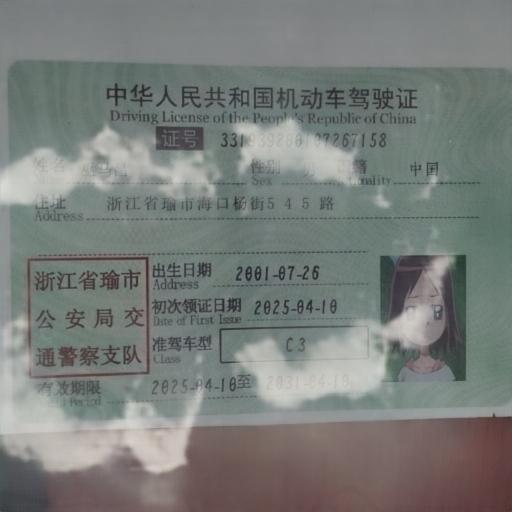
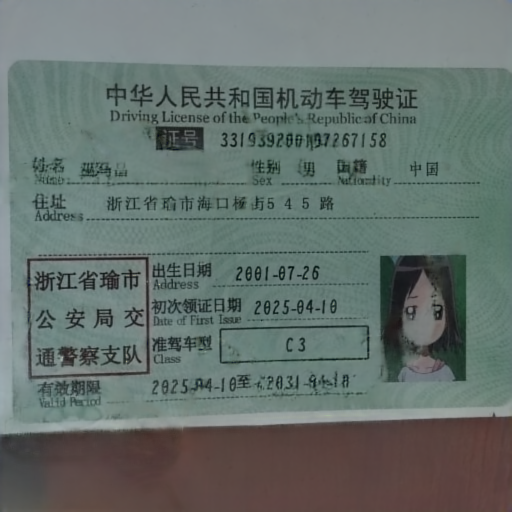
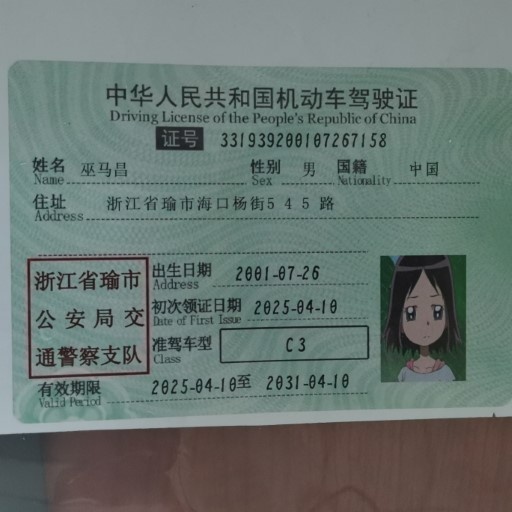
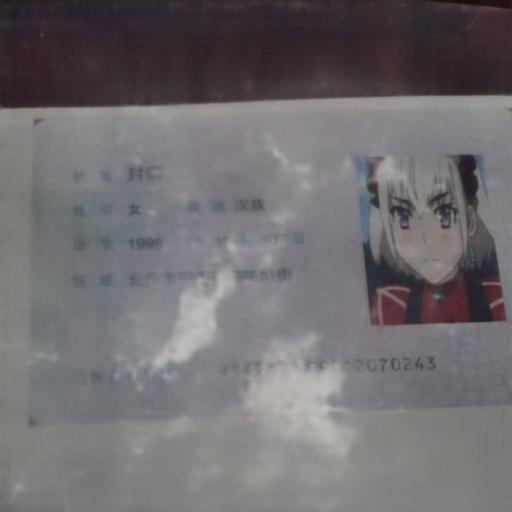
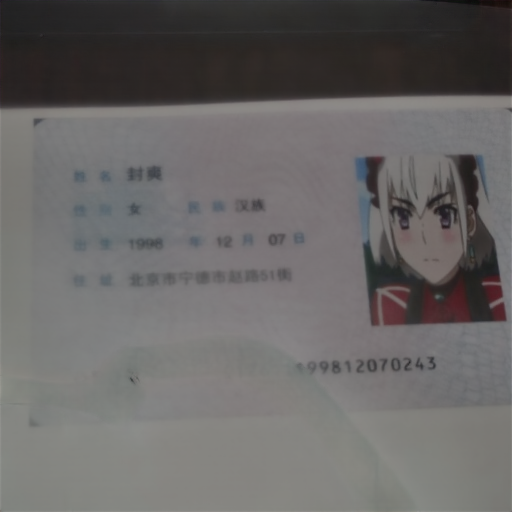
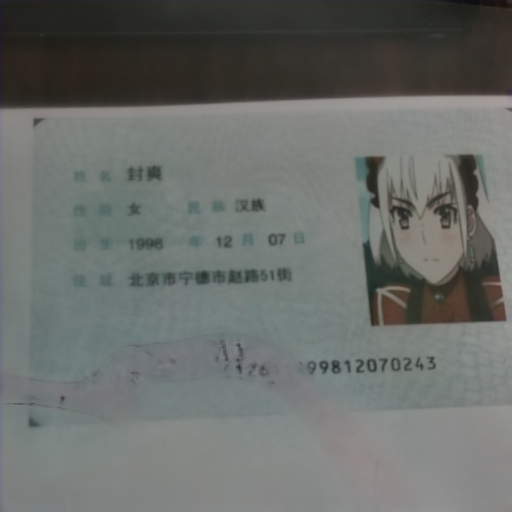
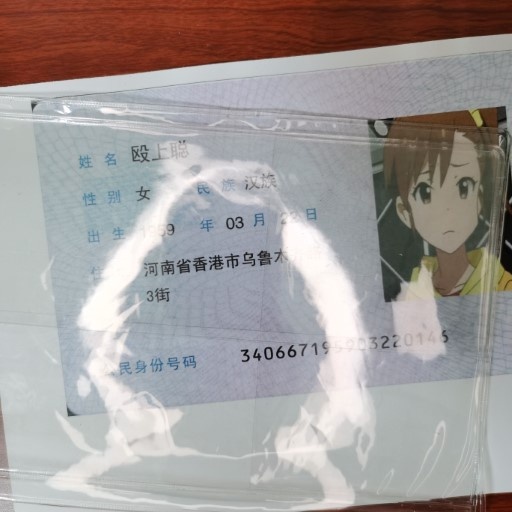
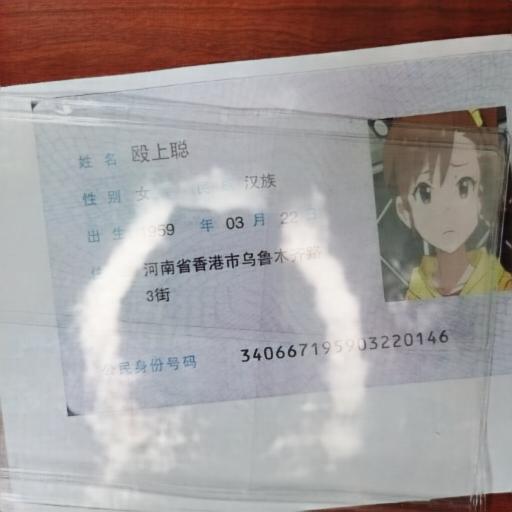
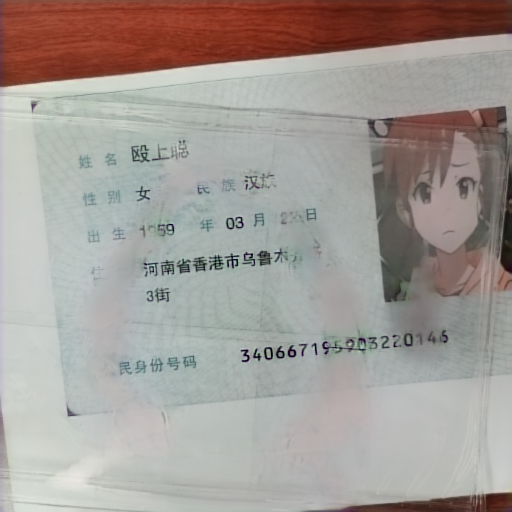
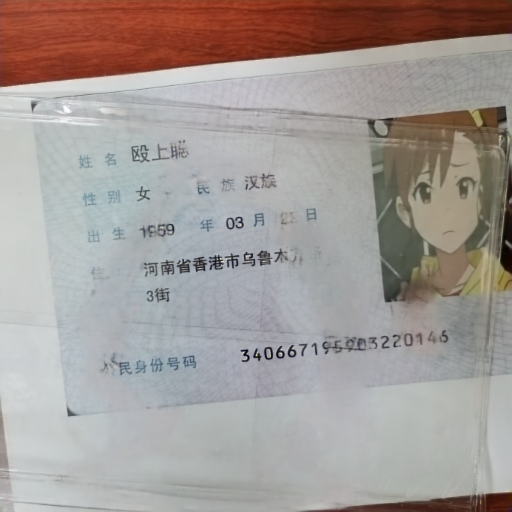
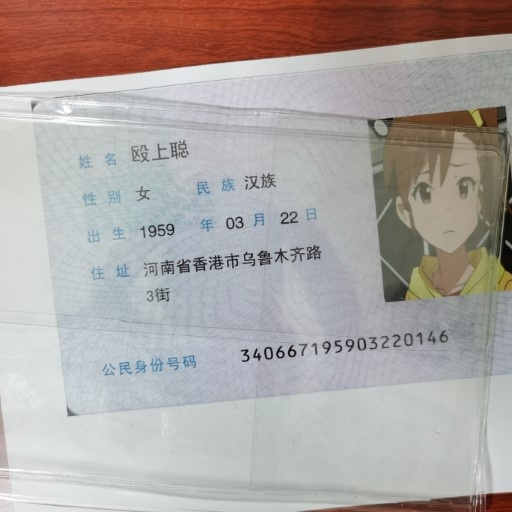
For training our L2HRNet, DocHR14K is randomly divided into 11,922 pairs for training, 1,490 pairs for validation, and 1,490 pairs for testing. To enhance the model’s applicability in real-world scenarios, we incorporate digital card images sourced from the open-access platform Wikimedia Commons, including bank cards, ID cards, and driver’s licenses. These digital images were printed onto PVC materials commonly used for ID cards to simulate real-world usage conditions. To support the main paper, we also provide the real-world illustration of our refined cross-polarization, which is shown in Figure 8. Our dataset and source code will be released after the paper is accepted.
4. More Qualitative Comparisons
Figure 9, Figure 10 and Figure 11 provide more visual comparisons among SOTA methods and our L2HRNet on DocHR14K, RD, and SHIQ dataset, respectively. As illustrated, our method achieves more effective global highlight removal with fewer highlight residuals and sharper text details compared to existing SOTA approaches. These results demonstrate the effectiveness of our proposed highlight location prior and the diffusion-based enhancement model, which operates on the low- and high-frequency bands decomposed by the Laplacian Pyramid.
5. Limitations and Future Work
While our method excels at removing highlights in document images, it has two main limitations: (1) under extreme overexposure, the original content can be lost forever and cannot be recovered; and (2) our diffusion‐based enhancement, even when paired with a DPM‐Solver, still incurs relatively slow inference. In future work, we plan to (i) integrate image inpainting to fill truly missing regions using semantic cues, and (ii) switch to faster latent‐space approaches—such as flow‐matching methods or latent diffusion models—to dramatically reduce runtime.