Neutrino cooling rates due to nickel isotopes for presupernova evolution of massive stars
Abstract
As per simulation studies, the weak reaction rates on nickel isotopes play a substantial role in affecting the ratio of electron-to-baryon content of stellar interior during the late stages of core evolution. (Anti)neutrinos are produced in weak-decay processes, and escape from the stellar content having densities less than 1011 g cm-3. They take away energy and reduce the stellar core entropy. In this paper we report on the microscopic calculation of neutrino and antineutrino cooling rates due to weak rates on nickel isotopes in mass range . The calculations are accomplished by employing the deformed pn-QRPA model. Recent studies on GT strength properties of nickel isotopes show that the deformed pn-QRPA model well explained the experimental charge-changing transitions. Our calculated beta decay half-lives for selected nickel isotopes are in excellent comparison with experimental data. The (anti)neutrino cooling rates are determined over temperatures in the range of 0.01109 – 30109K and densities in the range of 10 – 1011 g cm-3 domain. The computed rates are compared with previous theoretical calculations. For neutron rich nuclide, at high temperatures, our computed cooling rates are enhanced as compared to previous calculations.
keywords:
Gamow-Teller transitions; pn-QRPA model; neutrino cooling rates; core-collapse1 Introduction
Massive stars (M⊙) play a fundamental role in the progression of the universe. Their life begins by combustion of hydrogen in their core under the conditions of hydrostatic burning. The exhaustion of hydrogen induces the burning of next fuel, helium, until it finally results into the formation of an iron core, which halts the process of nuclear energy generation. When core’s mass surpasses the Chandrasekhar limit of about 1.4 M⊙, the degeneracy pressure of electrons becomes insufficient to counter the force of gravity and renders the core instable. This may lead to a process known as core-collapse supernova (type II supernova) which marks the death of a massive star.
Supernova explosions are considered as major means by which elements synthesized in stars are injected into the interstellar medium and recycled into formation of new generations of stars. Therefore, they are important in controlling much of the chemical enrichment of galaxies. Apart from the dissemination of the nuclei produced in the stellar evolution, the explosion also synthesizes elements heavier than iron via r-process nucleosynthesis [1]. Therefore, a broader comprehension into the dynamics of explosion is necessary for analyzing the nucleosynthesis problem and fate of star’s life.
For almost half a century, understanding the mechanism of supernova explosion has been in forefront of research in the field of astronomy and astrophysics. The supernova explosion still largely remains a mystery. The complexity of the explosion mechanism calls for a complete analysis of the physical processes. Weak-interaction-mediated processes are considered important for an improved understanding of the presupernova phases of stellar evolution and hence their extensive consideration becomes necessary. Weak processes, e.g., nuclear -decay and electron capture, alter the overall lepton-to-baryon ratio (Ye) of the presupernova star [2] as well as its core entropy. The number or quantity of electrons present for pressure support are decreased via electron capture processes whereas -decay acts oppositely. Thus, these nuclear reactions are vital for a better understanding of the collapse dynamics.
Weak interactions also result in copious production of (anti)neutrinos which for stellar densities, up to g cm-3, escape the core and assist in the cooling of core by taking away its energy and entropy [3, 4]. At higher core densities (g cm-3), where neutrino diffusion time exceeds the time required to complete the collapse [5], the neutrinos are trapped by elastic scattering on nucleons. When the inner core reaches nuclear densities (g cm-3), the collapse halts and produces a shock wave with energy. The outward progress of the shock wave is stalled by energy losses from the disintegration of heavy nuclei across the shock and through neutrino emission. This standing shock is thought to be energized by neutrino-heating mechanism, as suggested by Wilson [6] and Bethe Wilson [7]. However, even after 3 decades, the simulation studies of the neutrino-heating mechanism has not confirmed it as the trigger of explosion. Now, there is a large agreement that one dimensional models generally fail to convert the collapse into an explosion except for the low mass progenitor stars [8, 9]. This has lead a shift towards two- and three-dimensional (3D) models where multidimensional effects, such as rotation, convection, turbulence and instabilities are considered (see e.g., [10, 11]). Many of these works have demonstrated that multidimensional effects are crucial and generally aid an explosion.
Neutrinos from core-collapse supernova play an indispensable part to understand the microphysics of the supernova. They act as a major source of transporting and removing energy from collapsing stars. They can provide information about various events from collapse to explosion, e.g., the neutronization, the bounce and shock formation, propagation and stagnation of the shock and the phase of neutrino cooling. Neutrino energy loss or cooling rates calculated over a broad domain of stellar temperature and density scales are essential input parameters for core-collapse simulation of massive stars [12]. A reliable and microscopic computation of these rates is necessary to execute a thorough investigation of the last phases of stellar development.
Nuclear weak interactions during final stages of the evolvement of a high mass star are known to be governed by Gamow-Teller (GT) charge-changing transitions [13]. In particular GT transition strengths for -/-shell nuclide are of fundamental significance for core-collapse supernova physics [14] and play a decisive character in many astrophysical matters, involving stellar evolution and the related nucleosynthesis problem. At the initial stages of the collapse, when the electron chemical potential, , is more or less same as the nuclear Q-values, the detailed calculation of GT strengths is needed for the relevant weak-interaction rates. Whereas at a later stage, for higher stellar densities (where ), the electron capture rates largely depend on the total GT strength. A precise determination of the GT transitions is a complex problem, as the weak-interaction-mediated processes in the massive stars occur at relatively high temperatures and GT transitions from thermally populated excited states can contribute significantly and hence must be taken into account.
The first considerable attempt to measure the astrophysical weak rates over broad dimensions of temperature and density was accomplished by Fuller, Fowler and Newman (FFN) [14]. They measured not only the lepton capture and emission rates but also the (anti)neutrino energy loss/cooling rates of 226 different nuclide having mass in the range 21-60. They employed zeroth-order shell model to estimate the excitation energies and GT strength distributions by incorporating measured data present at that time. Later, the FFN work was expanded for more heavy nuclei with by Aufderheide and collaborators [15]. They adopted a similar formalism as used by FFN. In their studies, the quenching of the charge-changing transitions strength was considered by minimizing the zeroth-order shell model calculation for the Gamow-Teller resonance contribution by a typical factor of 2. Results of the charge-changing reactions such as, (n,p) and (p,n) measurements [16, 17], have exposed the misplacing of the charge-changing strength centroid used in the calculations of Aufderheide and FFN. This energized theoretical attempts for improvements in the weak rates by considering their microscopic calculations. Among several theories, the deformed pn-QRPA [18] and the large-scale shell model (LSSM) [19] are the most effective theories which have been applied largely for the microscopic computation of astronomical weak reaction rates.
The deformed pn-QRPA model has two main advantages over the previous ways of estimation of weak reaction rates. Firstly, in this model one can use a huge model space up to shells for calculation. This space suffices for the calculation of strength functions for any arbitrary heavy nucleus. Secondly, this model does not utilize the Brink-Axel hypothesis [20] (as employed in the computations of LSSM and FFN) to evaluate GT transitions from parent excited states. It, on the contrary, permits a microscopic state by sate estimation of GT charge-changing transitions from ground and excited levels. This feature of the pn-QRPA model makes it more reliable for the estimation of astronomical weak rates and thus is being successfully used in recent calculations. Nabi and Klapdor-Kleingrothaus [18] were the first who used this model for the computation of weak-decay rates over a broad dimensions of density and temperature for 709 nuclei () in the stellar matter. They have performed calculation of lepton capture and decay rates, the associated energy loss/cooling weak-rates, probabilities and energy rates of -delayed particle emissions, and gamma heating rates in stellar matter [21, 22]. The calculations were later further refined, on case-to-case basis (e.g., Refs. [23, 24]), using more proficient algorithms, embodiment of latest experimental results and improvement of the model parameters. A discussion on the accuracy and reliability of the pn-QRPA theory may be found in [22].
Nickel isotopes are abundant in the presupernova environment and are considered to play a substantial part in the evolutionary process of high mass stars. The simulation studies of Aufderheide et al., [15] and of Heger et al. [25] of the late phases of development of massive stars show that the electron captures (EC) on 56-61,63-65,67-69Ni and -decay rates of 63,65-69,71Ni isotopes are significantly important in affecting in stellar environment. The results of GT strength distribution and the EC rates due to 56Ni, estimated using the pn-QRPA model were first reported and compared with previous measurements in Ref. [26]. The possible employment of these calculated rates in the stellar environment was also discussed there. The calculations were later improved and extended to heavier nickel isotopes (with the mass range = 57-65) [27]. Recently, the GT± transitions properties and weak-decay rates, on Ni isotopes were calculated in Refs. [28, 32]. In the present work, the deformed pn-QRPA model is used to compute the (anti)neutrino cooling rates of nickel isotopic chain having mass number between 56 and 71. Our results have also been compared with previous results computed by FFN, LSSM and by Pruet and Fuller (PF) [33].
The paper is organized as follows. In the next section, the theoretical formalism used in the computation of GT strength and the related (anti)neutrino cooling weak-rates has been presented. Our results and their comparison with other model calculations are given in Section 3. In the last section, we summarize our work and present the conclusions.
2 Formalism
The deformed pn-QRPA model was considered for the theoretical calculation of (anti)neutrino cooling rates of nickel (Ni) isotopes. The Hamiltonian (H) selected for this model was considered as
| (1) |
where represents the Hamiltonian of single particle (), represents the pairing force (treated in the BCS approximation), and are the particle-hole () and particle-particle () Gamow-Teller (GT) potentials (forces), respectively. Nilsson model was used for the estimation of wave functions and energies [34], in which the nuclear deformation () was considered. The and interaction constants were characterized by and , respectively. These parameters were selected in order to reproduce the available experimental half-lives and satisfy the Ikeda sum rule (ISR) [35]. In this work, we took equal to 4.2/A (MeV), displaying a dependence [36, 37, 38] and to be 0.10 MeV. The values of these parameters are same as considered in the recent calculation of lepton capture rates for Ni isotopes [28]. Nilsson potential parameters were chosen from Ref. [34]. The estimated half-lives (T1/2) values weakly rely on the and [39]. The conventional values of
| (2) |
were taken in this paper. The nuclear deformation was determined by using the formula
| (3) |
where denote the electric quadrupole moment chosen from Ref. [40]. Q-values of reactions were chosen from Ref. [41]. The charge-changing transitions, in pn-QRPA model, are defined in terms of phonon creation operators. The pn-QRPA phonons are expressed as
| (4) |
In above equation the summation was taken on all the proton-neutron pairs having = mp-mn = -1, 0, 1, where mp(mn) represent the angular momentum third component of proton(neutron). The a represents the creation operator of a quasi-particle (q.p) state of proton(neutron), whereas denotes the time reversed state of p. The ground level of the theory with respect to the QRPA phonons is expressed as the vacuum, A = 0. The phonon operator A, having excitation energy () and amplitudes (X) were achieved by solving the renowned RPA matrix equation. Detailed solution of RPA matrix equation can be seen in Refs. [39, 43].
The (anti)neutrinos in stellar environment are produced mainly through four different weak-interaction processes: by emission of positron and electron, and due to captures of positron and electron (from continuum as they are not assumed to be in bound states) . It is further assumed that during the presupernova evolutionary stages the (anti)neutrinos produced can pass through the stellar matter and due to energy transfer the stellar core cools itself. The (anti)neutrino energy loss weak-rates can be calculated as
| (5) | |||||
The constant D value was chosen as 6143s [44] and was considered to be -1.2694 [45]. B(GT) and B(F) represent the Gamow-Teller and Fermi transition probabilities, respectively and are specified as
| (6) | |||||
| (7) |
here and show the spin and the isospin operators, respectively. For the daughter and parent excited levels construction and estimations of matrix elements, within the framework of deformed pn-QRPA model, see Ref. [18]. The phase space integrals () were taken over total available energy and were calculated using the following relations.
| (8) |
(for positron emission lower sign is used while for electron emission upper sign is used), and the phase space integral for positron capture (PC) (lower sign) and electron capture (EC) upper sign is given as
| (9) |
where represent the electron total kinetic energy (K.E) plus its rest mass, while the total lepton capture threshold energy for PC and EC is denoted by . F(,) represent the Fermi functions and are determined by using the same method as considered in Ref. [46]. We used the natural units in Eqs. (8) and (9). G+ and G- represent the positron and electron distribution functions, respectively, and are expressed as
| (10) |
| (11) |
where E = (w - 1) represents the electron K.E and denote the electrons Fermi energy.
Due to the high stellar core temperature, there exist a definite possibility of occupation of parent excited levels. The total (anti)neutrino energy loss weak-rates per unit time per nuclide is specified as
| (12) |
where the probability of occupation of parent excited levels is represented by , which obeys the normal Boltzmann distribution. In Eq. (12), the summation runs on all final and initial levels until convergence is achieved in the rate calculations.
3 Results and Discussions
Nickel (Ni) nuclide are considered to play a crucial role in the evolutionary phases of massive stars. Previous simulation results demonstrate that Ni nuclei (56-61Ni, 63-69Ni and 71Ni) appreciably alter the lepton fraction of the astrophysical core of high mass stars [15, 25]. The lepton capture and stellar -weak rates are controlled by Gamow-Teller (GT) charge-changing transitions (and to a much minor extent by Fermi strength). The GT charge-changing transitions are of spin-isospin () type and play significant role in nuclear weak-decay routes. The charge-changing GT strength distributions on 56-65Ni nuclei have been discussed in detail recently (see [32]). The authors in Ref. [32], have considered four different QRPA models and have compared their calculated GT strength with previous theoretical work and experimental data, where it was found that the current deformed pn-QRPA model results are in decent accordance with experimental data. For detailed description on GT transitions strength on 56-65Ni, see Figs. 5-11 of Ref. [32].
| Nuclei | T1/2 (Cal) | T1/2 (Exp) | Re-ISRCal | Re-ISRTh |
|---|---|---|---|---|
| 56Ni | 5.37 105 | 5.25 105 | 0.00 | 0.00 |
| 57Ni | 1.31 105 | 1.28 105 | 1.08 | 1.08 |
| 58Ni | - | - | 2.16 | 2.16 |
| 59Ni | 3.47 1012 | 3.19 1012 | 3.24 | 3.23 |
| 60Ni | - | - | 4.32 | 4.32 |
| 61Ni | - | - | 5.40 | 5.40 |
| 62Ni | - | - | 6.47 | 6.47 |
| 63Ni | 3.41 109 | 3.19 109 | 7.56 | 7.56 |
| 64Ni | - | - | 8.64 | 8.64 |
| 65Ni | 9.12 103 | 9.06 103 | 9.72 | 9.71 |
| 66Ni | 2.11 105 | 1.97 105 | 10.80 | 10.80 |
| 67Ni | 21.87 | 21.00 | 11.87 | 11.88 |
| 68Ni | 30.61 | 29.00 | 12.96 | 12.96 |
| 69Ni | 11.48 | 11.50 | 14.02 | 14.04 |
| 70Ni | 6.04 | 6.00 | 15.12 | 15.12 |
| 71Ni | 2.70 | 2.56 | 16.19 | 16.20 |
The GT± transitions properties and the corresponding lepton capture rates, on heavier 66-71Ni isotopes were recently calculated in Ref. [28]. It has been observed that, experimentally measured GT strength is generally less than that expected from nuclear models. This observation applies to transitions between single, defined energy levels as well as to entire GT strength functions. This discrepancy in shell model calculations is normally explained by high order configuration mixing and intrinsic excitations of the nucleons. Most nuclear models then renormalize the GT strength by some fixed quenching factor. For RPA calculation a quenching factor () of 0.6 is mostly used (e.g. in [29, 30, 31]) and is also employed in current calculation. The relation for Ikeda sum rule (ISRr-n), in re-normalized form, in our model is specified as
| (13) |
In this paper we would like to discuss the
calculated terrestrial half-lives (T1/2) and the corresponding
(anti)neutrino cooling weak rates on Ni nuclide with mass ranging
from A = 56 to 71. These nuclide include both stable (58Ni,
60-62Ni and 64Ni) and unstable nuclei.
Table 1 depicts that our calculated T1/2 values
are in excellent comparison with the measured data. The measured
T1/2 values were chosen from [41]. As mentioned
earlier, 58Ni,
60-62Ni and 64Ni are stable isotopes of nickel.
Table 1 demonstrate that our calculated ISRr-n
values are in decent comparison with the theoretical predictions.
Thus the current calculations well satisfied the model independent ISR.
Our study suggests that the Brink-Axel hypothesis (BAH) [20]
is a poor estimation to be used in the computation of stellar
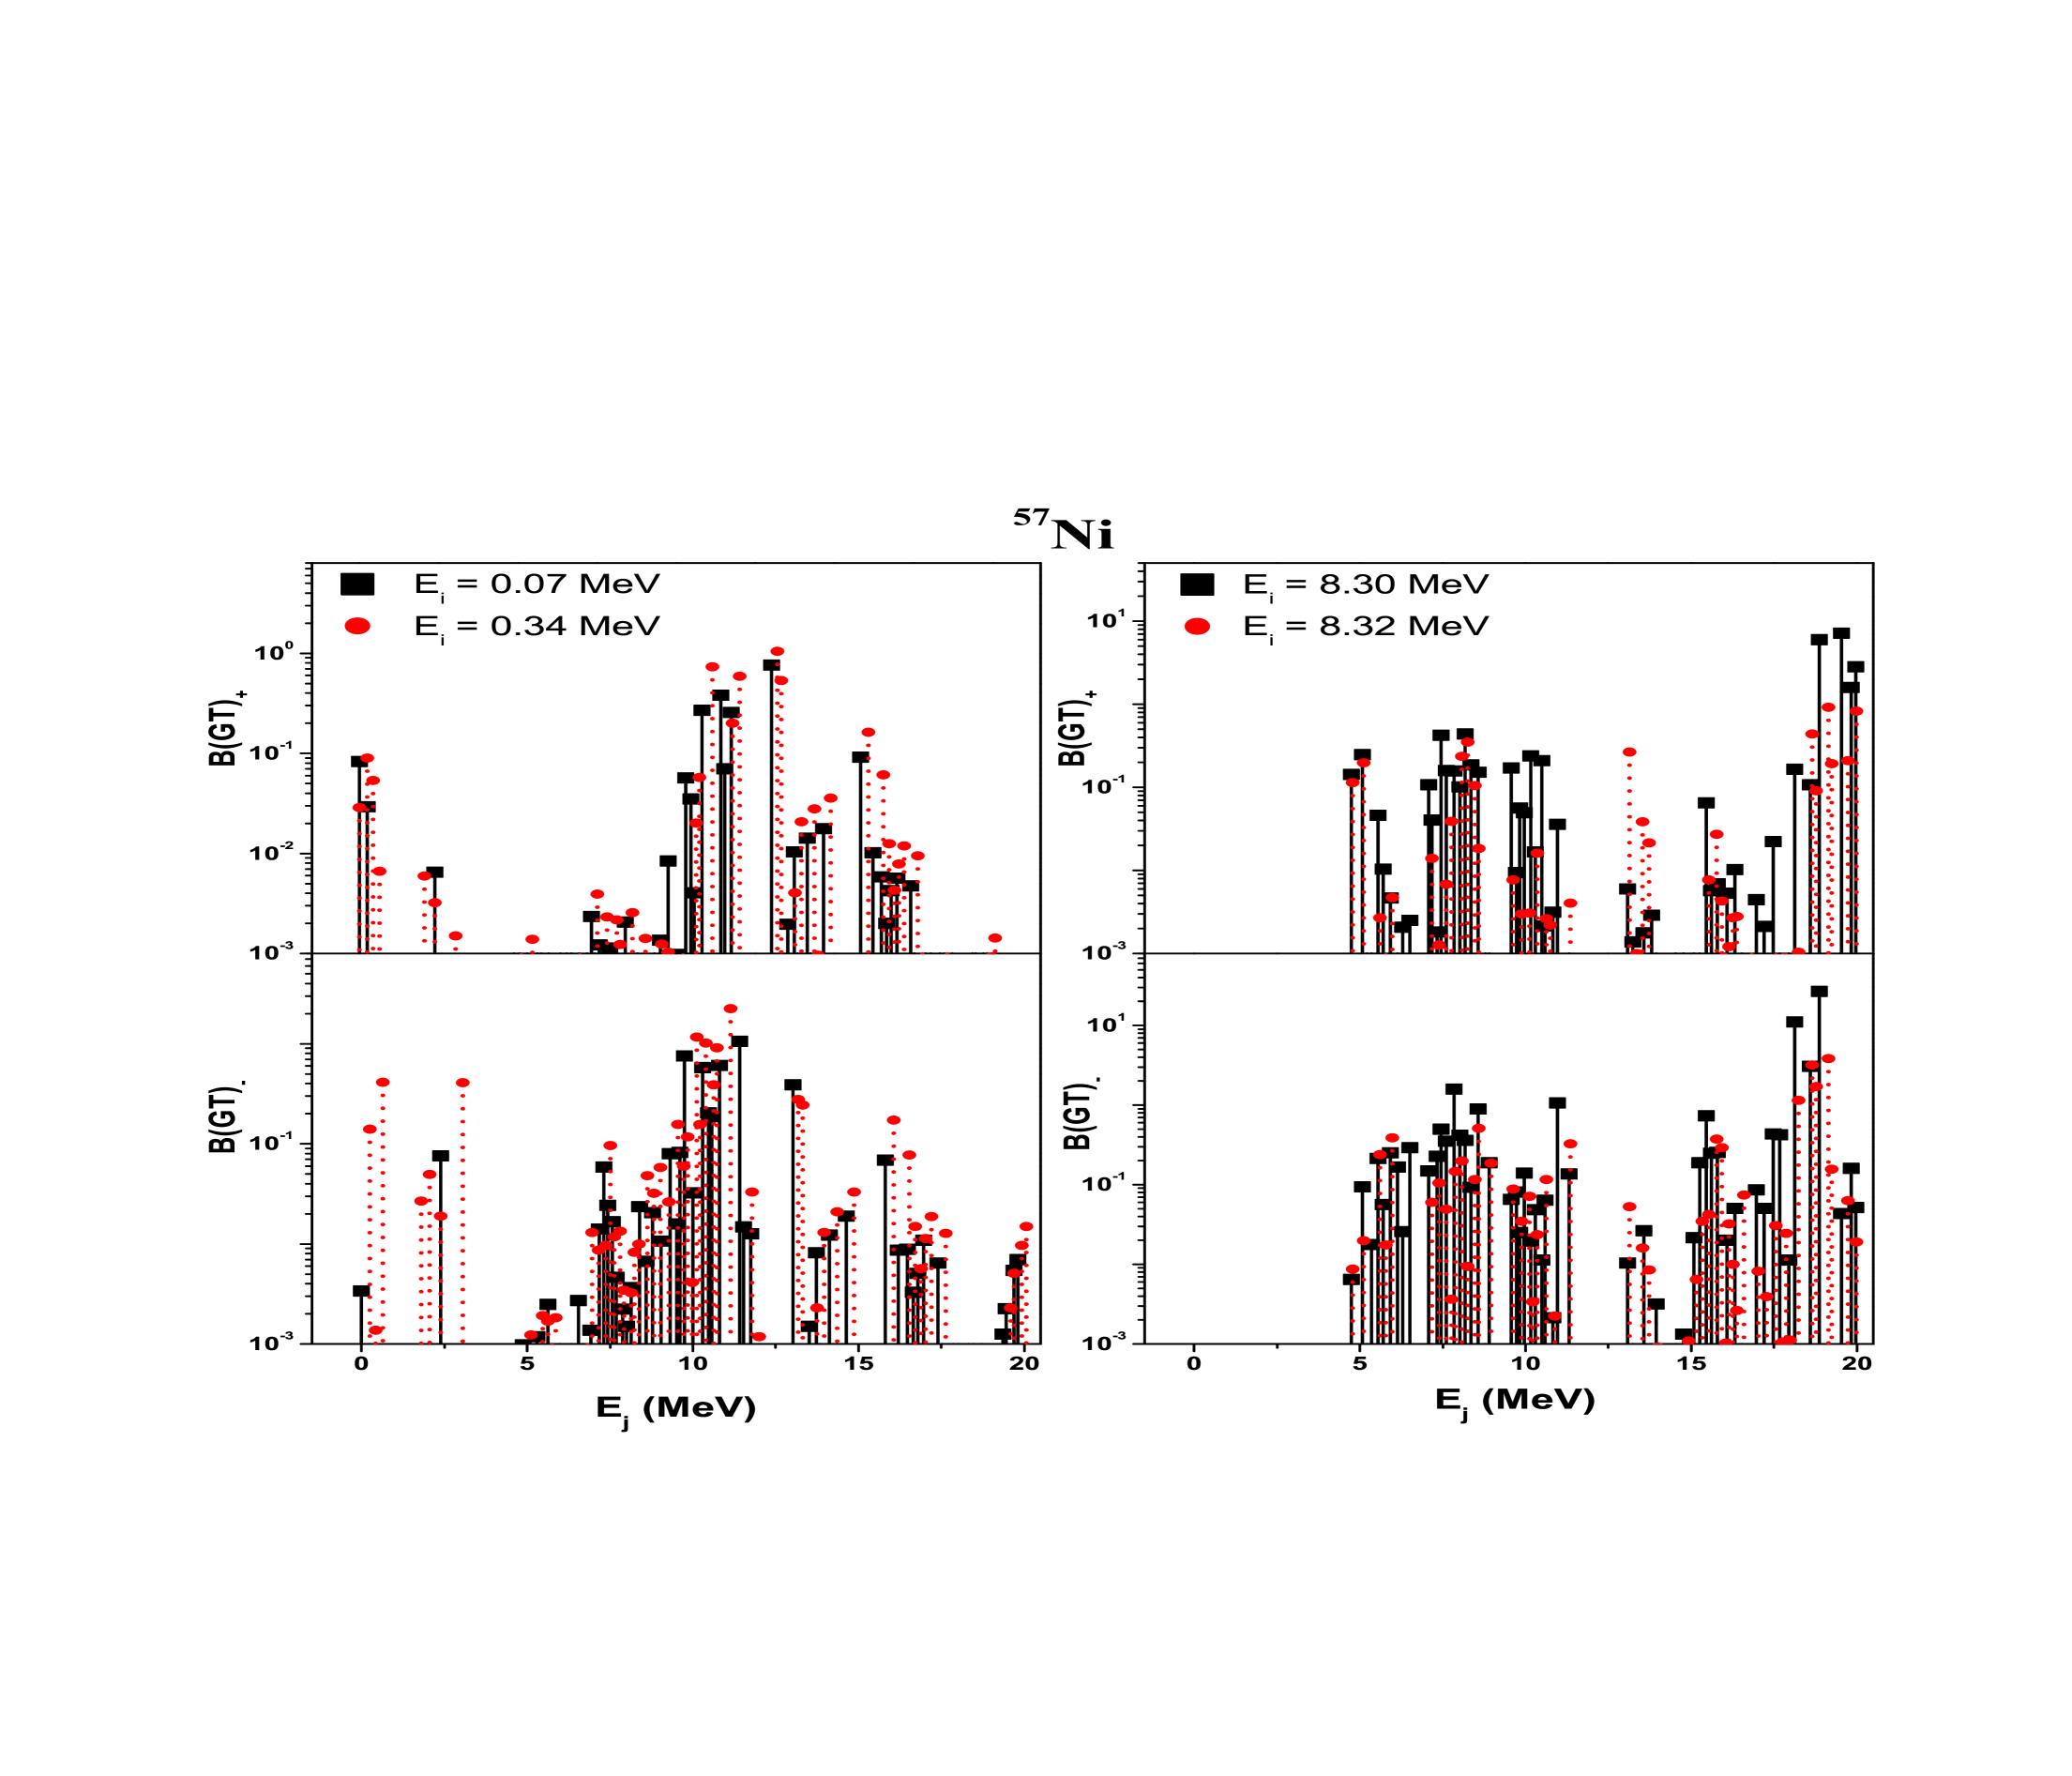
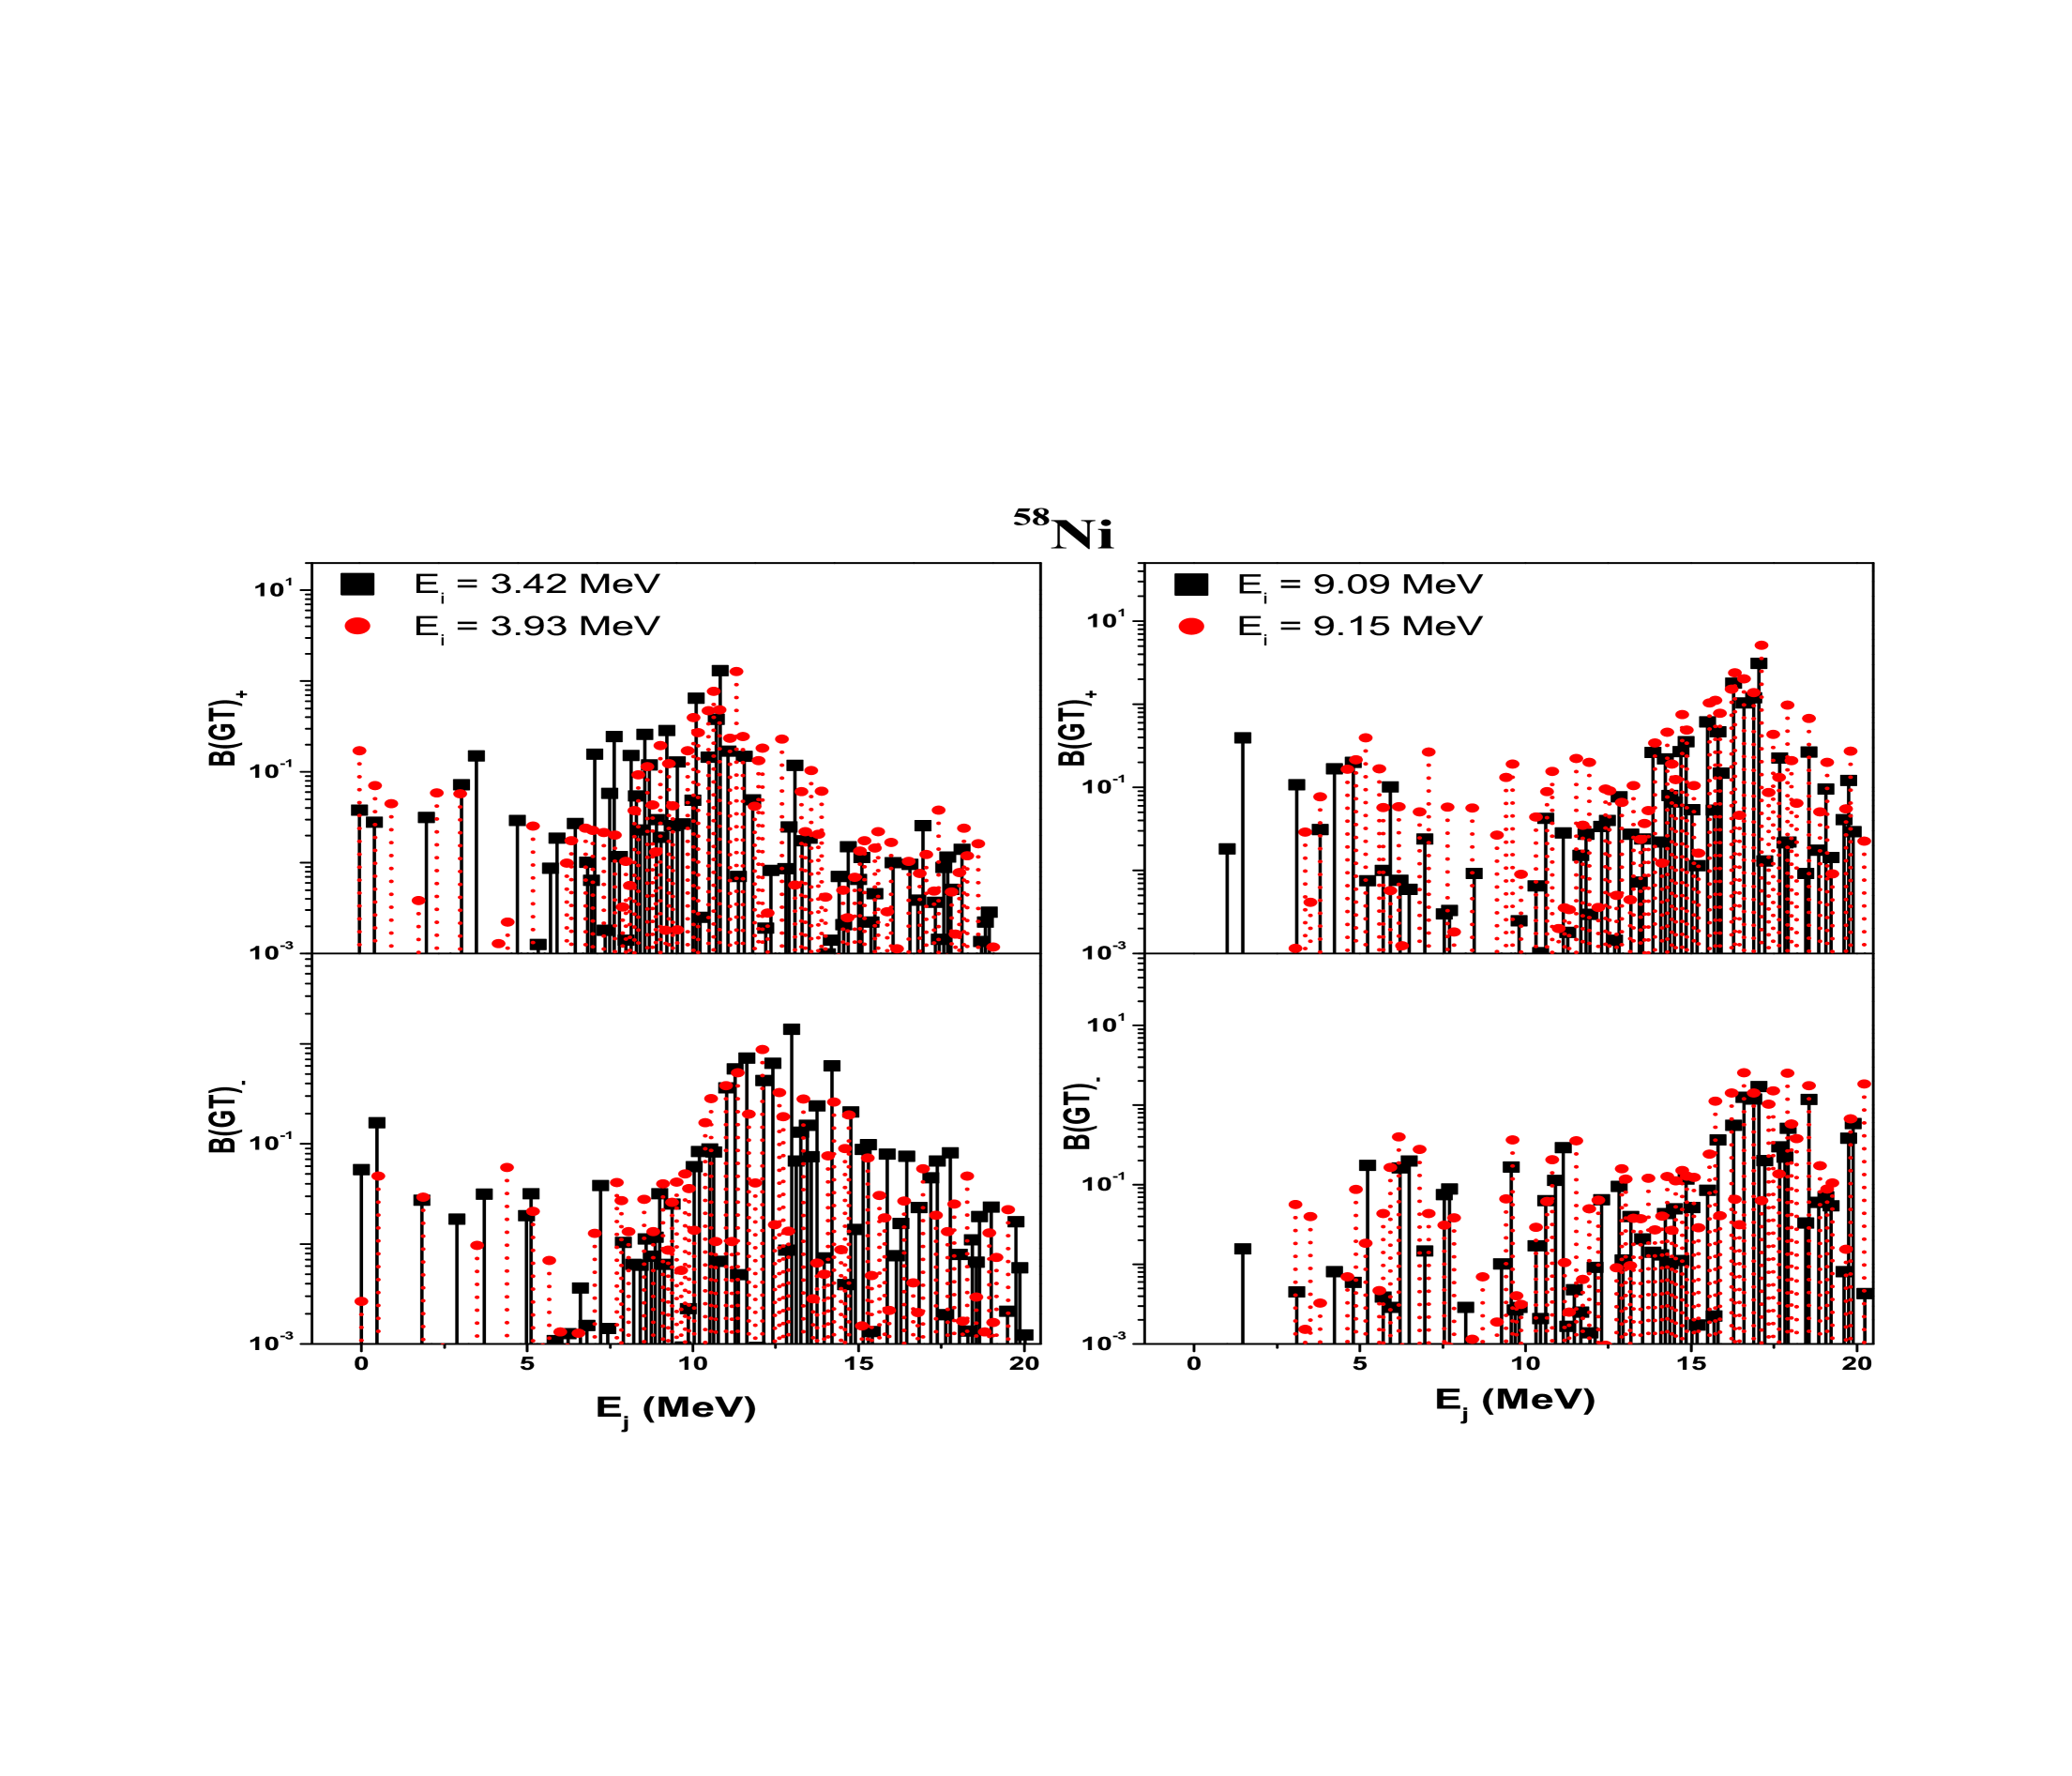
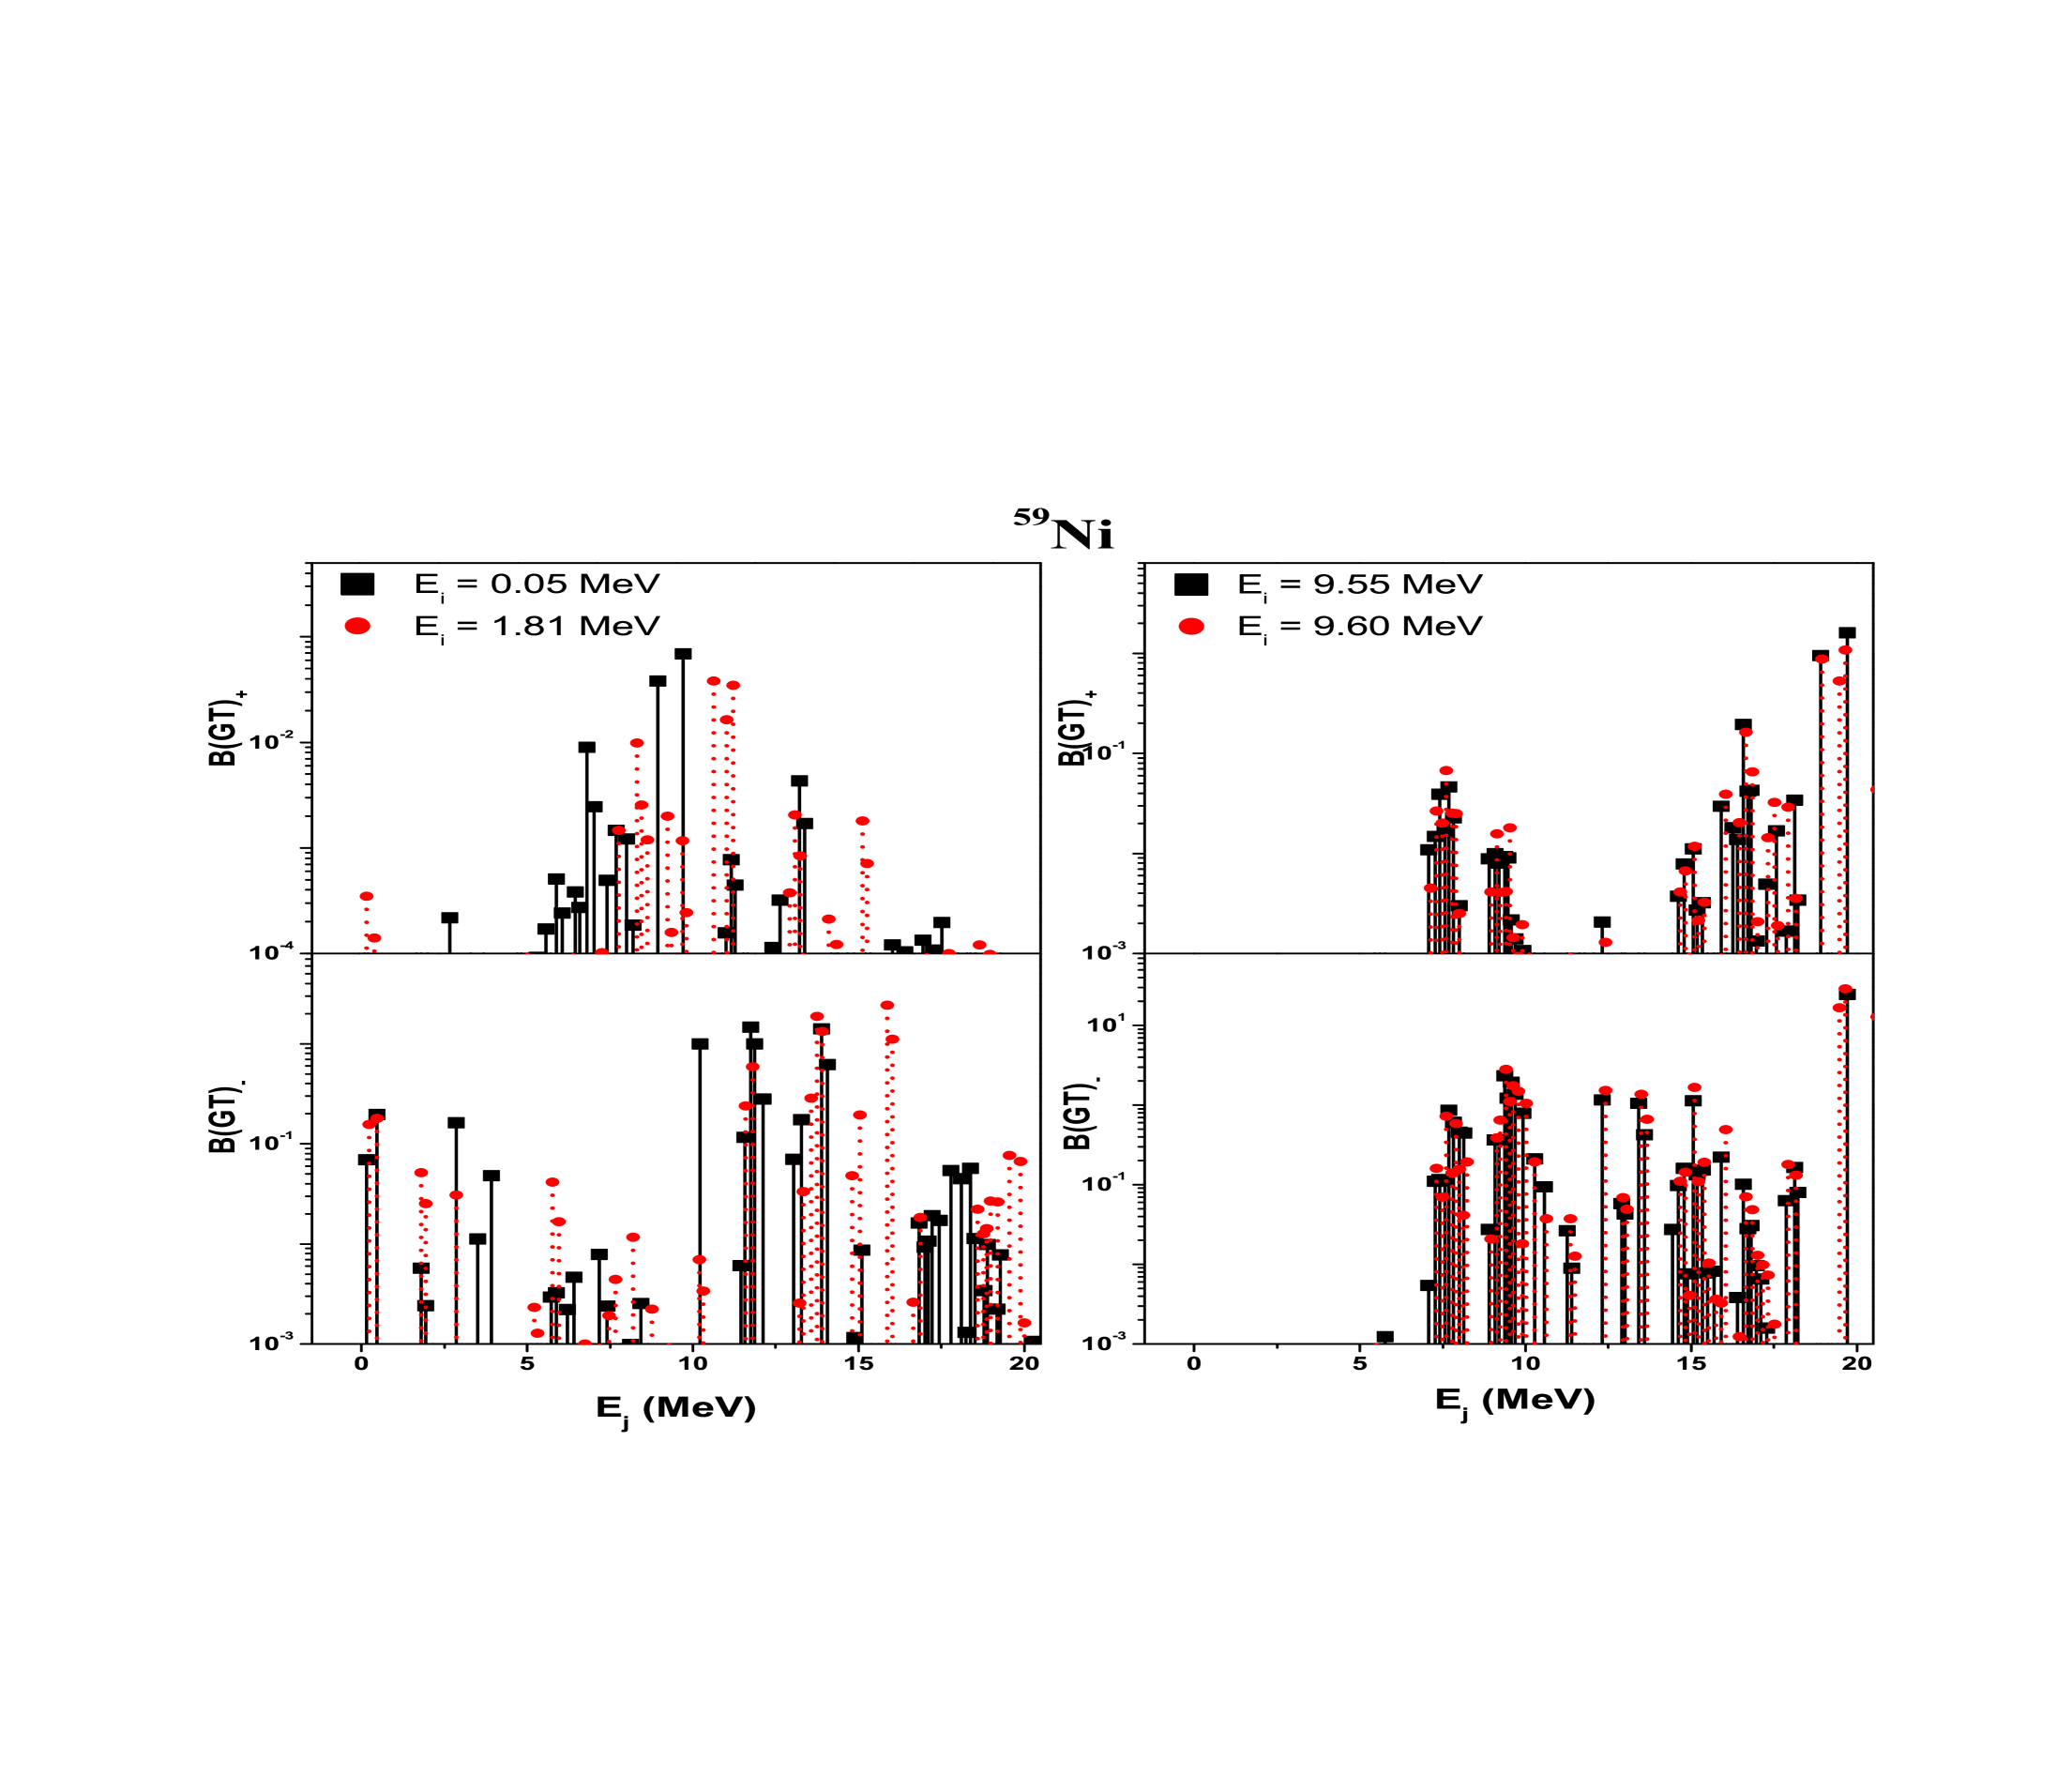
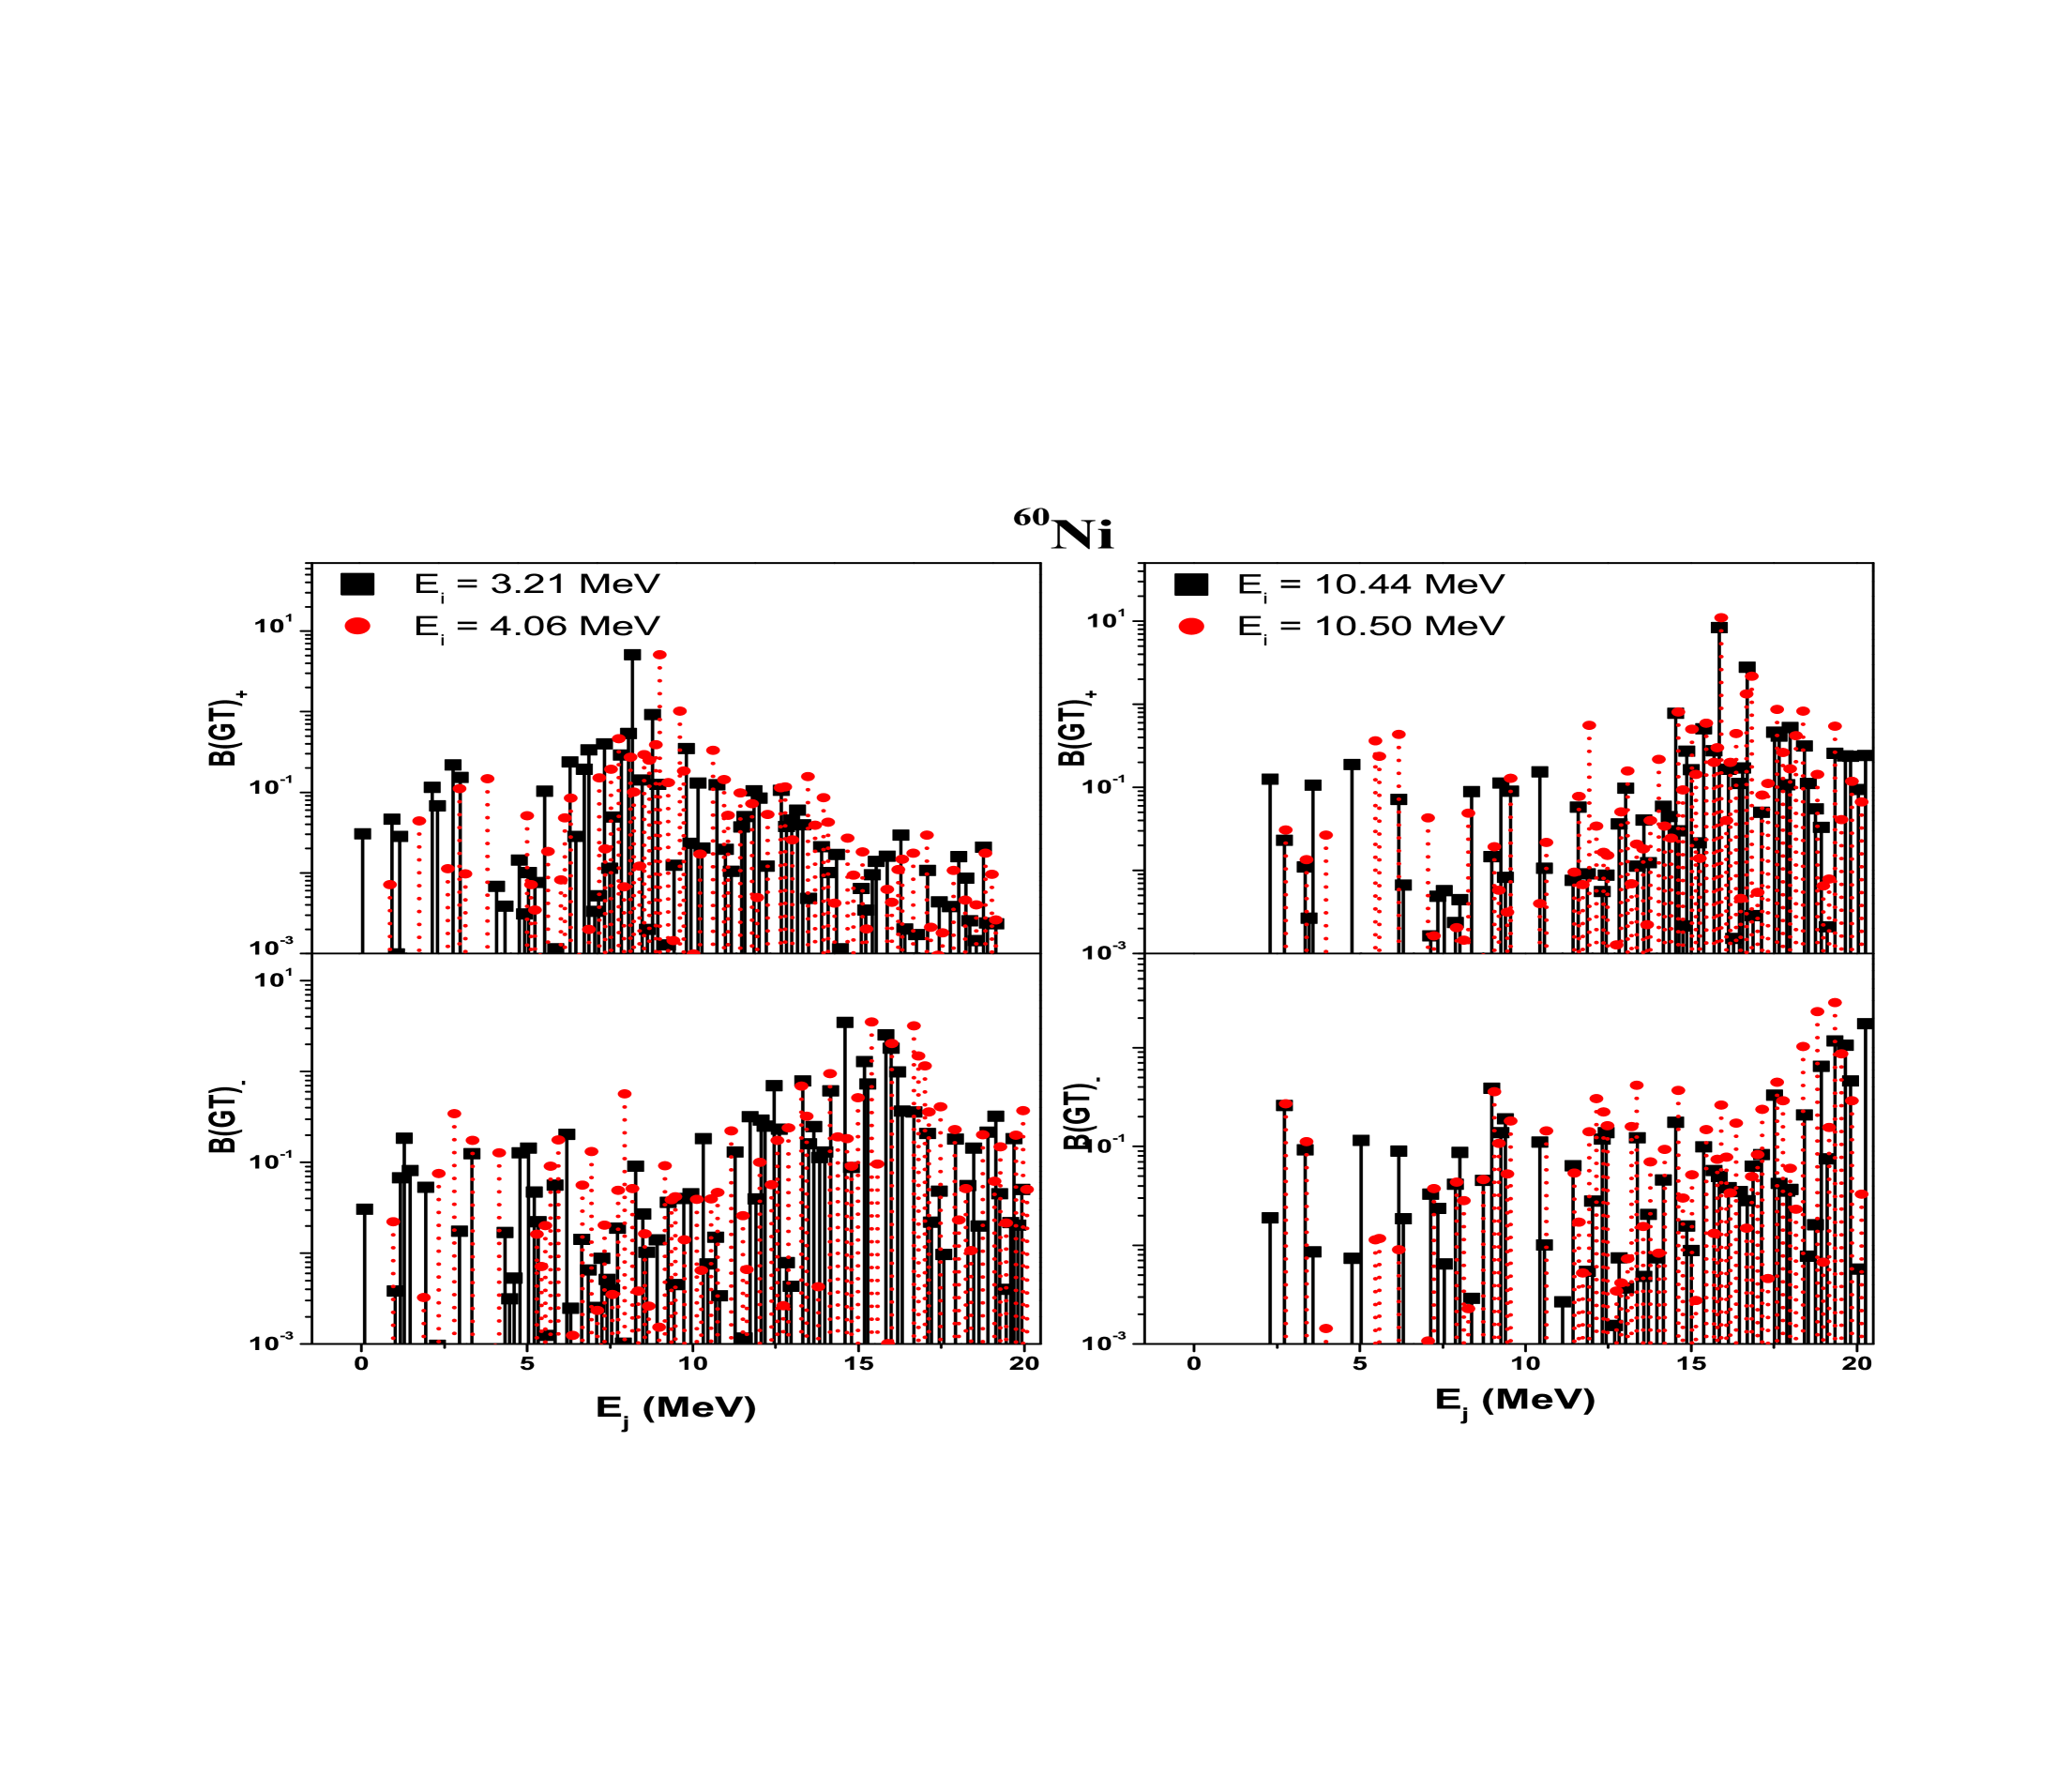
weak-decay rates. The pn-QRPA calculated GT strength distributions
for 57-60Ni, as a function of daughter excitation energy
(), along electron capture (-decay) direction (top
panels) and positron capture (-decay) direction (bottom
panels) are shown in Figures 1-4. The left
panels show GT strength distributions for low-lying excited states
of the parent nucleus, whereas right panels show GT strength
distributions for high-lying excited states of the parent nucleus.
It is to be noted that we calculate GT strength distributions from
all calculated parent states of all selected Ni isotopes and are not
shown here due to space consideration. The ASCII files of all
allowed GT strength distributions may be requested from the
corresponding author. It can be seen that the calculated GT strength
distributions for excited states are different from each other. For
nickel isotopes these excited state GT strength distributions
contribute to the stellar weak-decay rates during the core
contraction and collapse phases of massive stars. The weak decay
rates are exponentially sensitive to the position of Gamow-Teller
resonance [42].
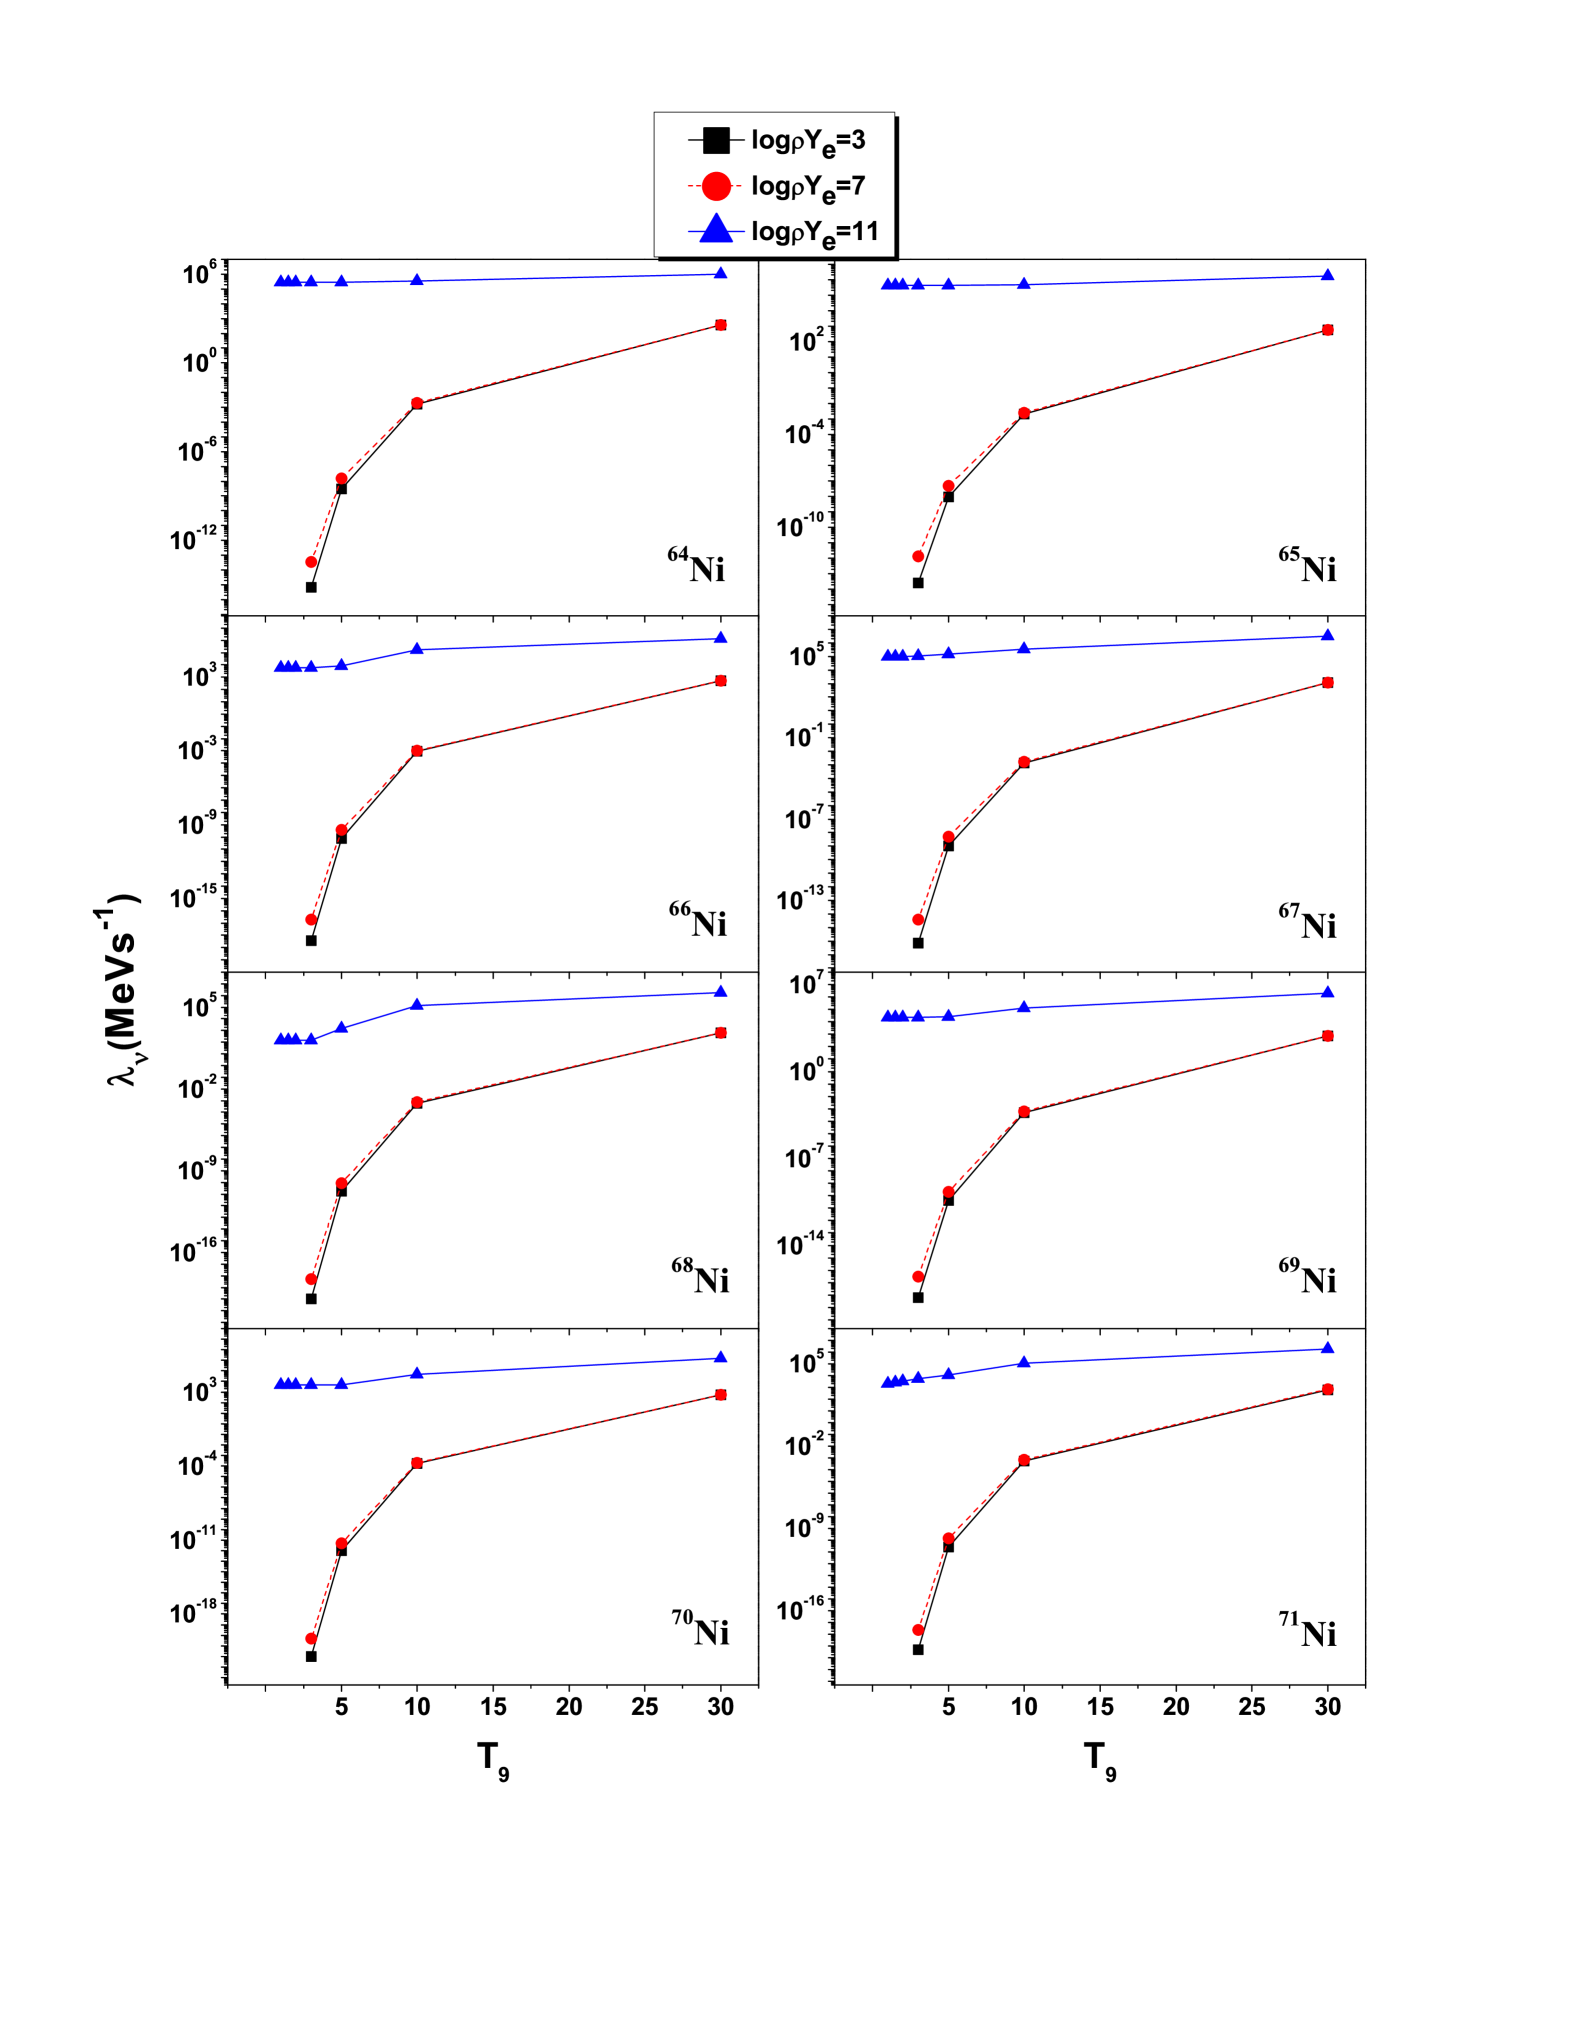
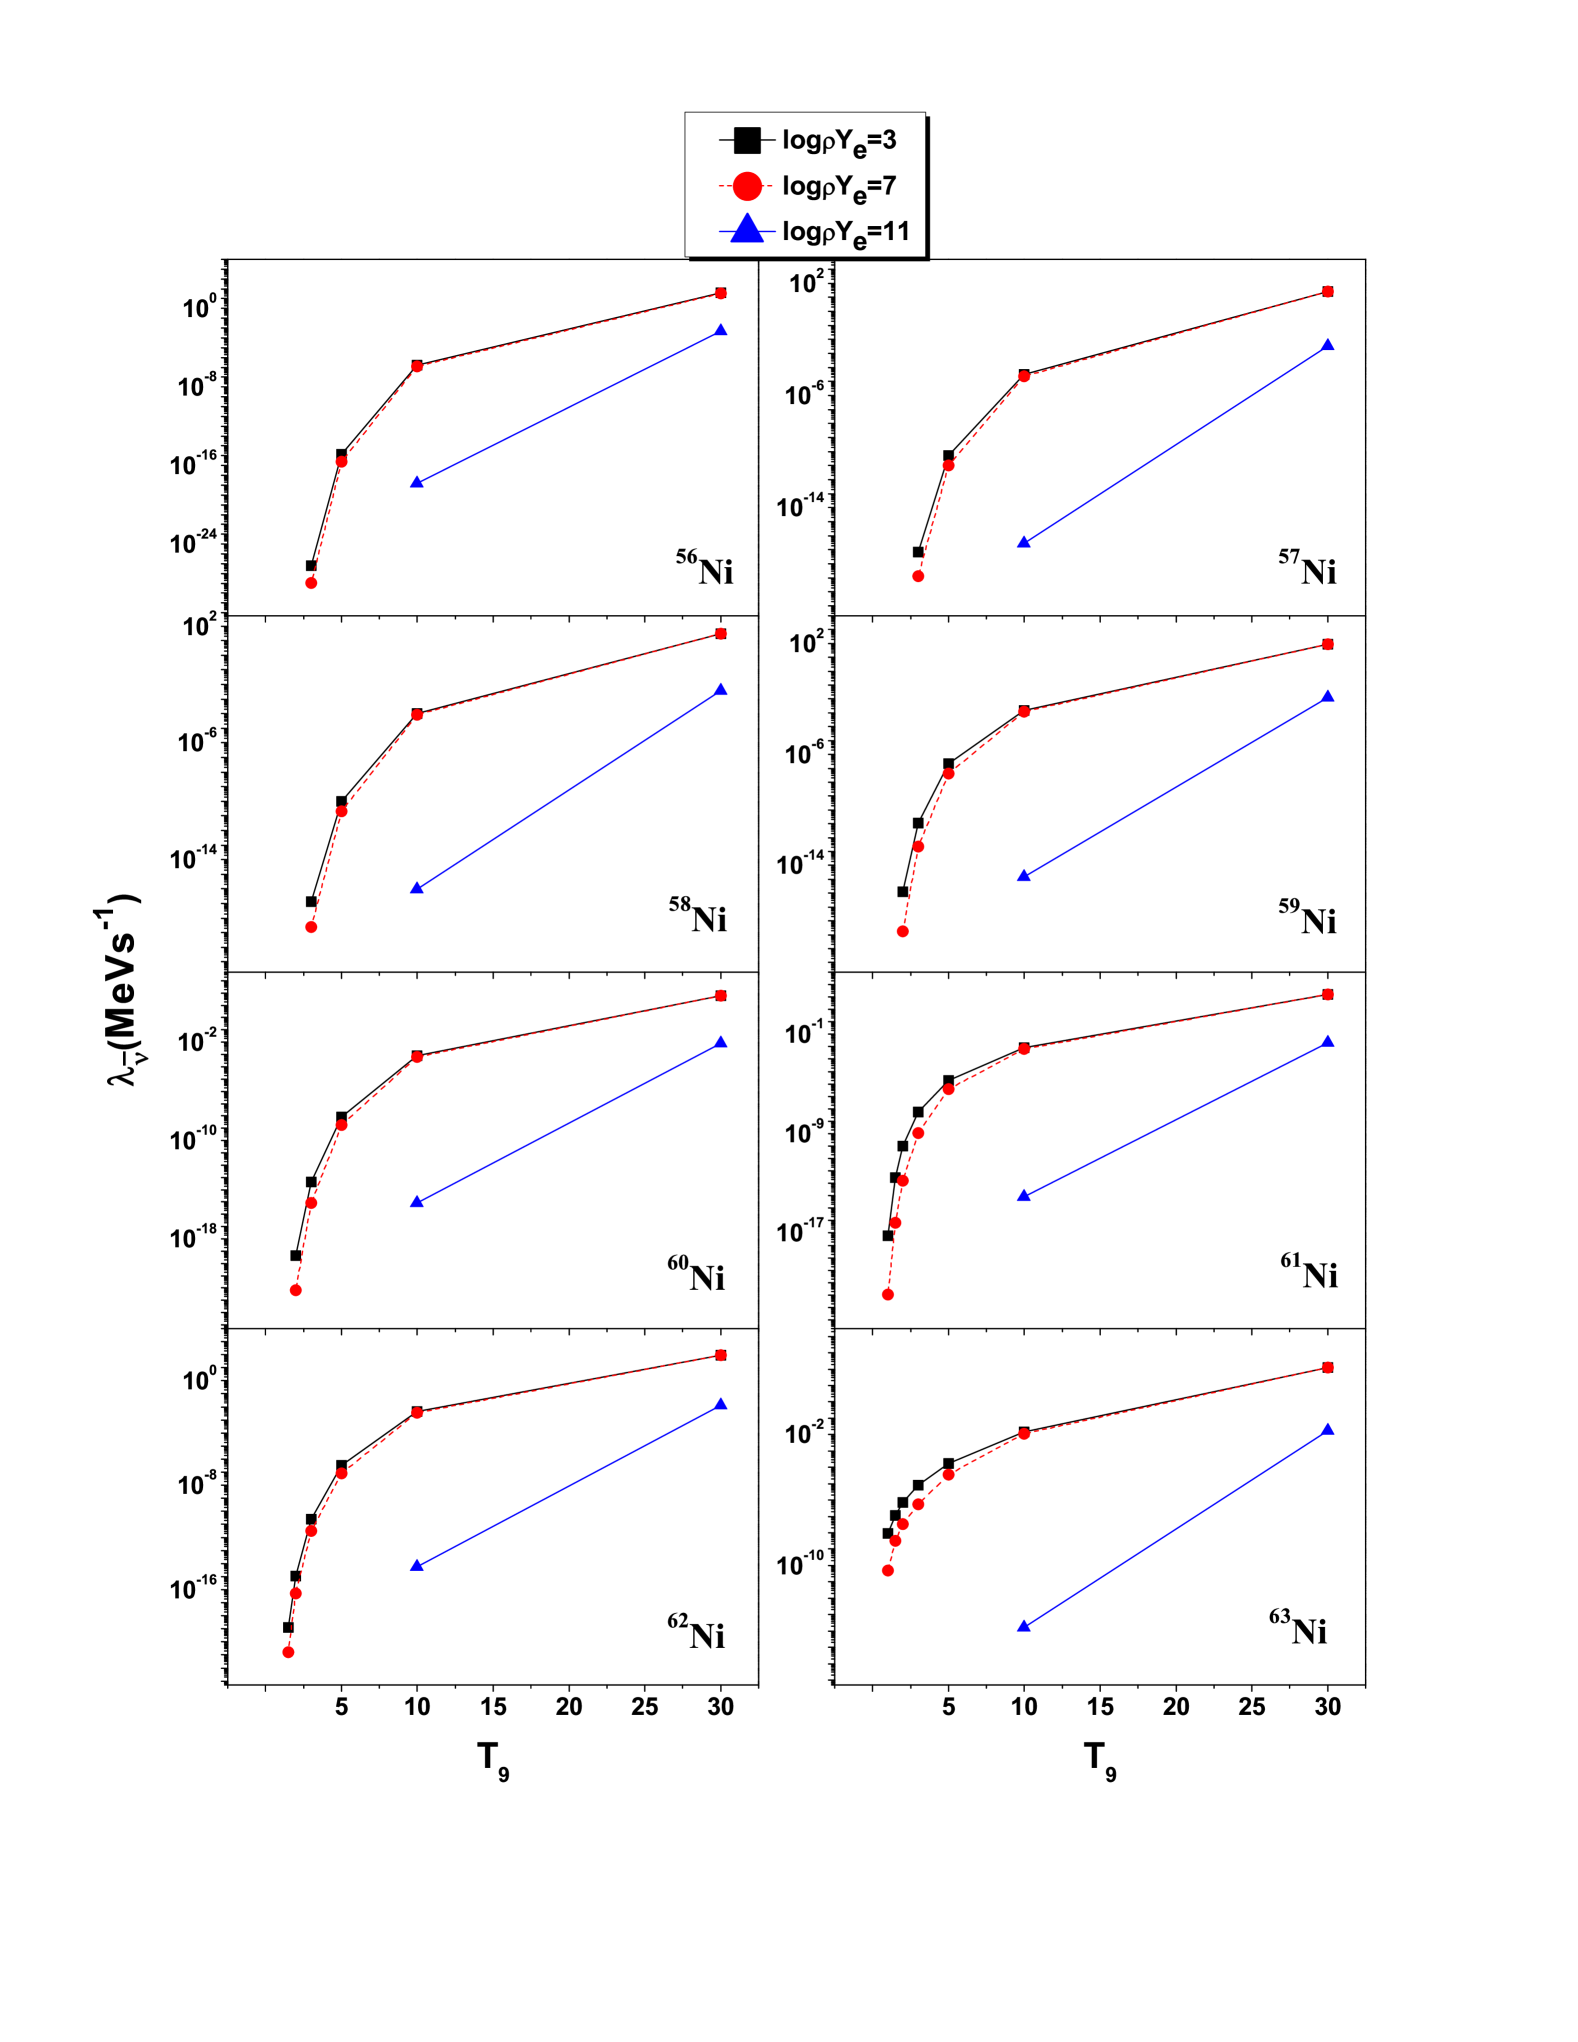
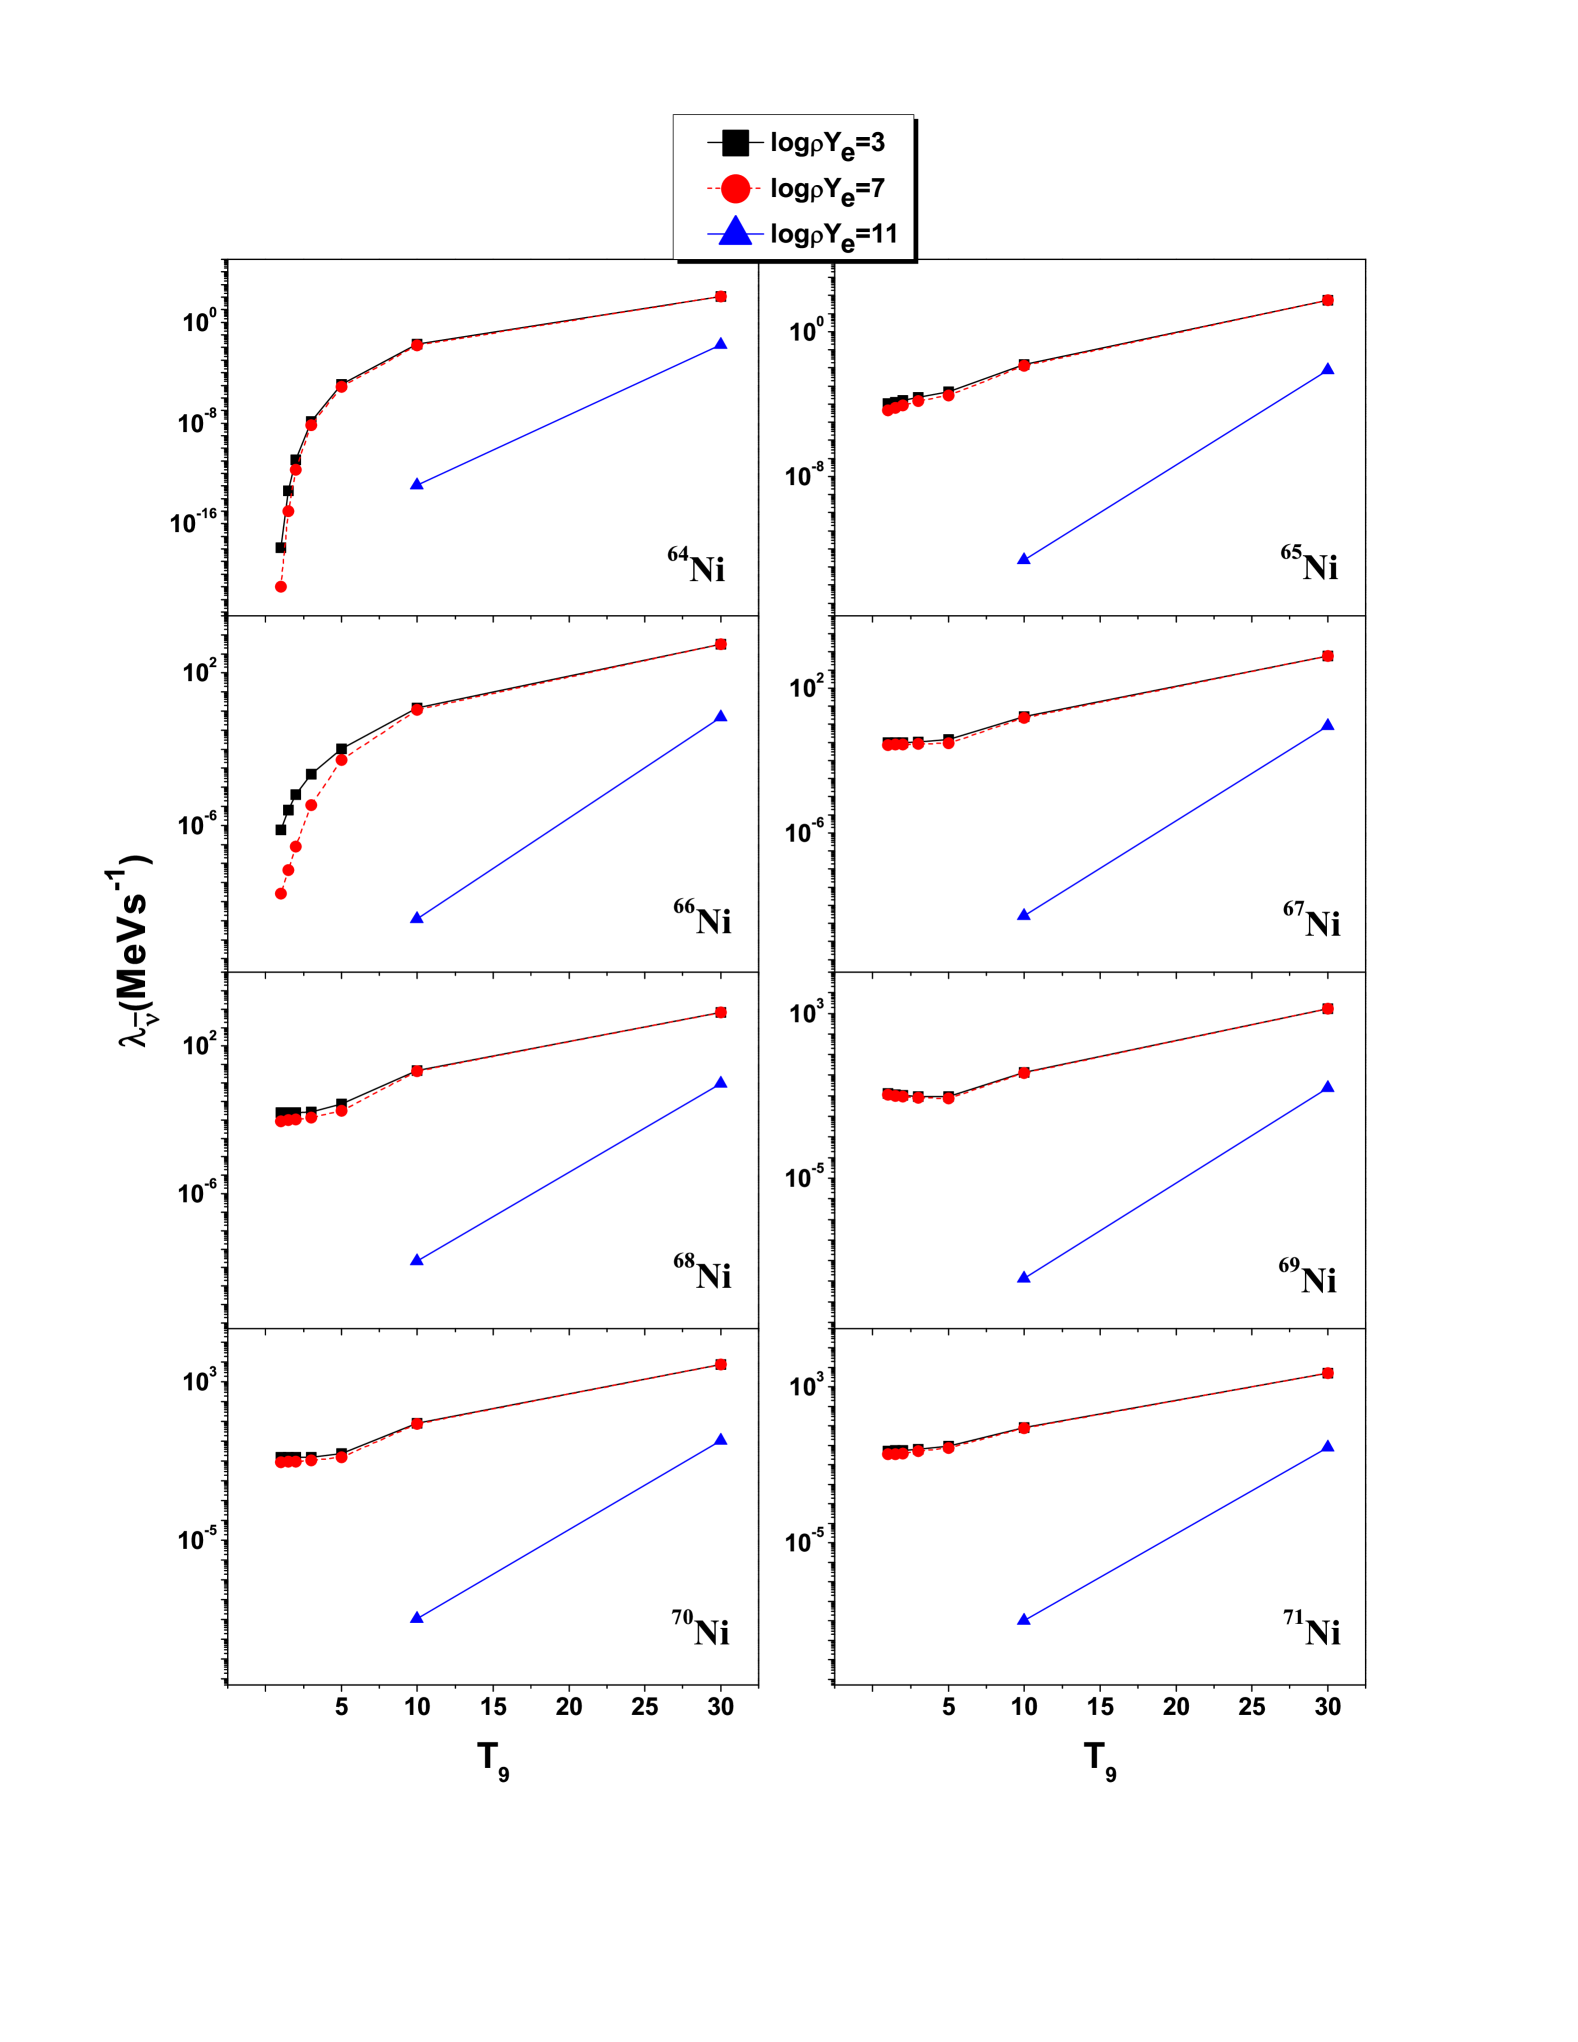
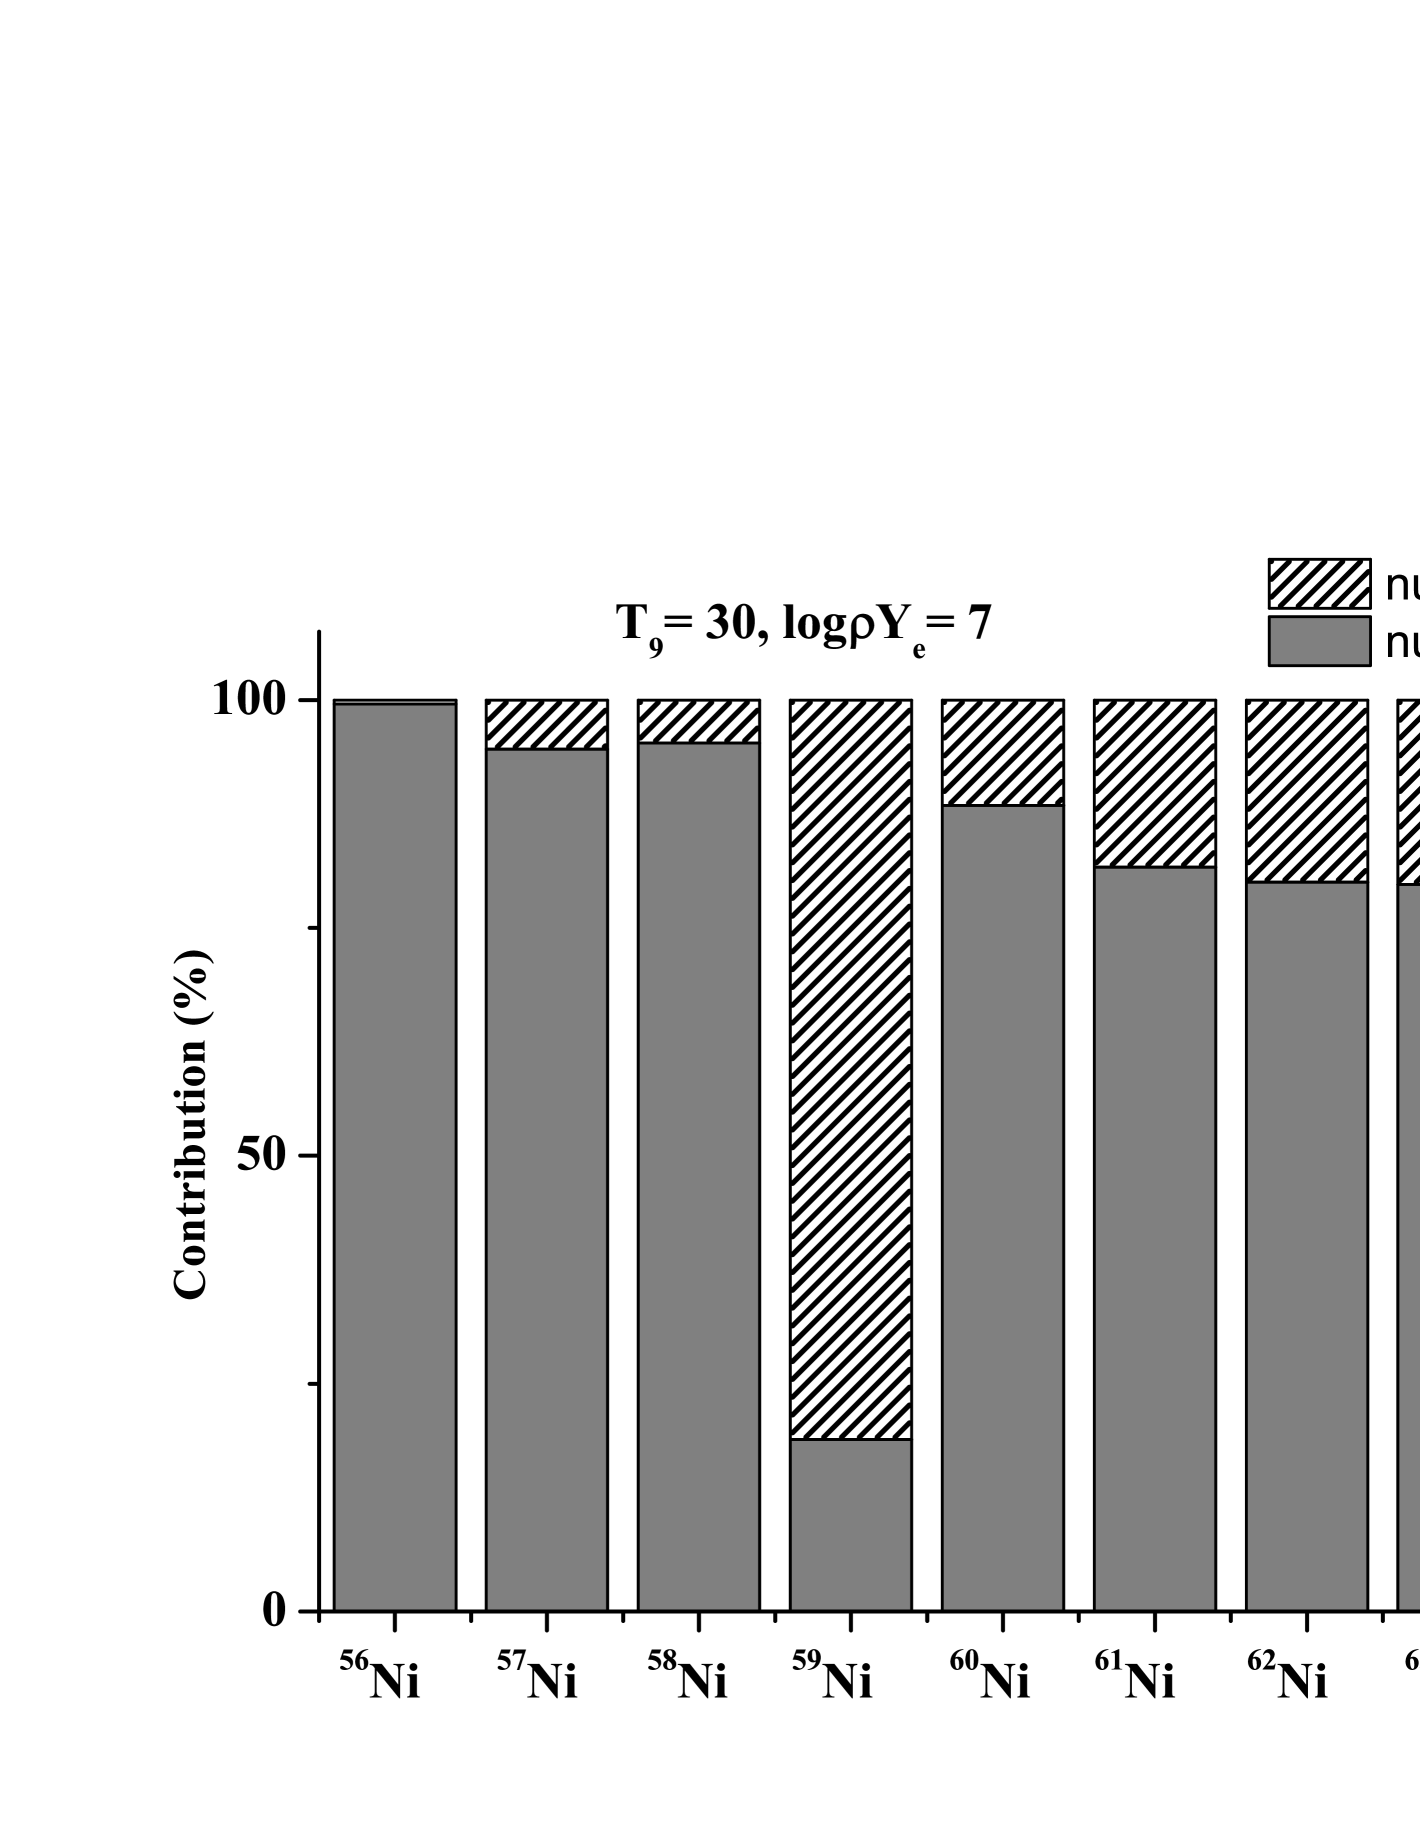
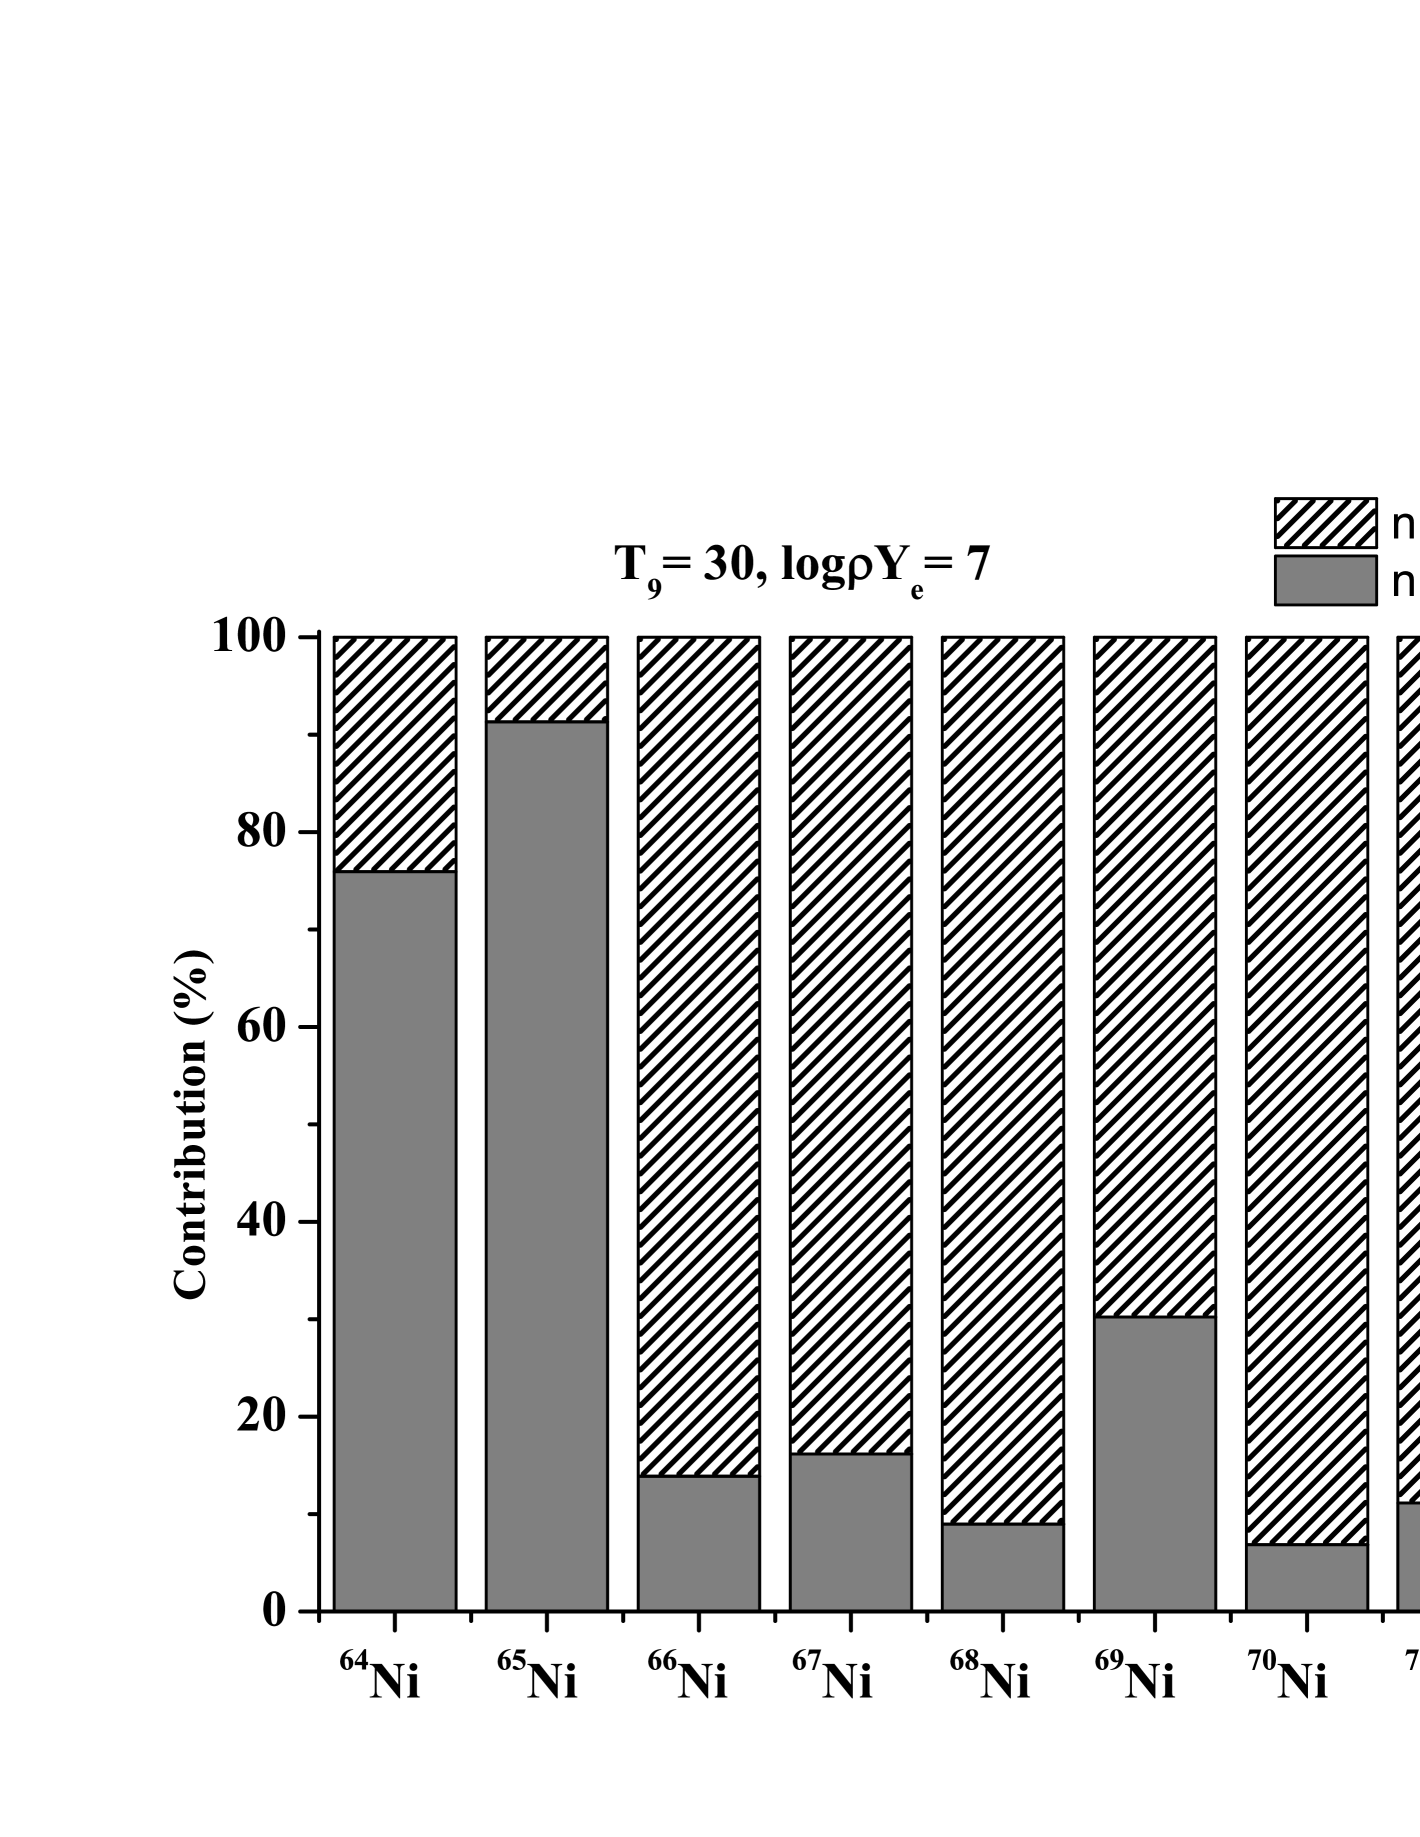
The deformed pn-QRPA model (anti)neutrino cooling rates on 56-71Ni isotopes are depicted in Figures 5-8. In each of these figures, the calculated energy loss rates are presented as a function of stellar temperature (T9 in units of K) ranging from 1 to 30, at three chosen values of stellar densities (Ye = 3, 7, 11, in units of g.cm-3). These values roughly represent low, medium and high stellar density regions. and , represent total neutrino and antineutrino cooling rates, respectively. () possesses contributions from positron emissions and electron captures (positron captures and electron emissions) on nickel isotopes. It can be seen from Figures 5-6, with the rise of core temperature up to T in the low and medium density regions, neutrino cooling rates increase exponentially. After this temperature, there is a drastic reduction in the slope of the weak-rates as the core density rises. The cooling rates due to antineutrinos are shown in Figures 7-8. With increasing core temperature, there is also an increase in the antineutrino weak-rates. However, the antineutrino weak-rates in the high density region are orders of magnitude smaller than the ones in the domain of low and medium densities, especially at low temperatures. Figure 9 shows the relative contribution of neutrino and antineutrino weak-rates for 56-71Ni nuclide at Ye = 7 and T9 = 30.
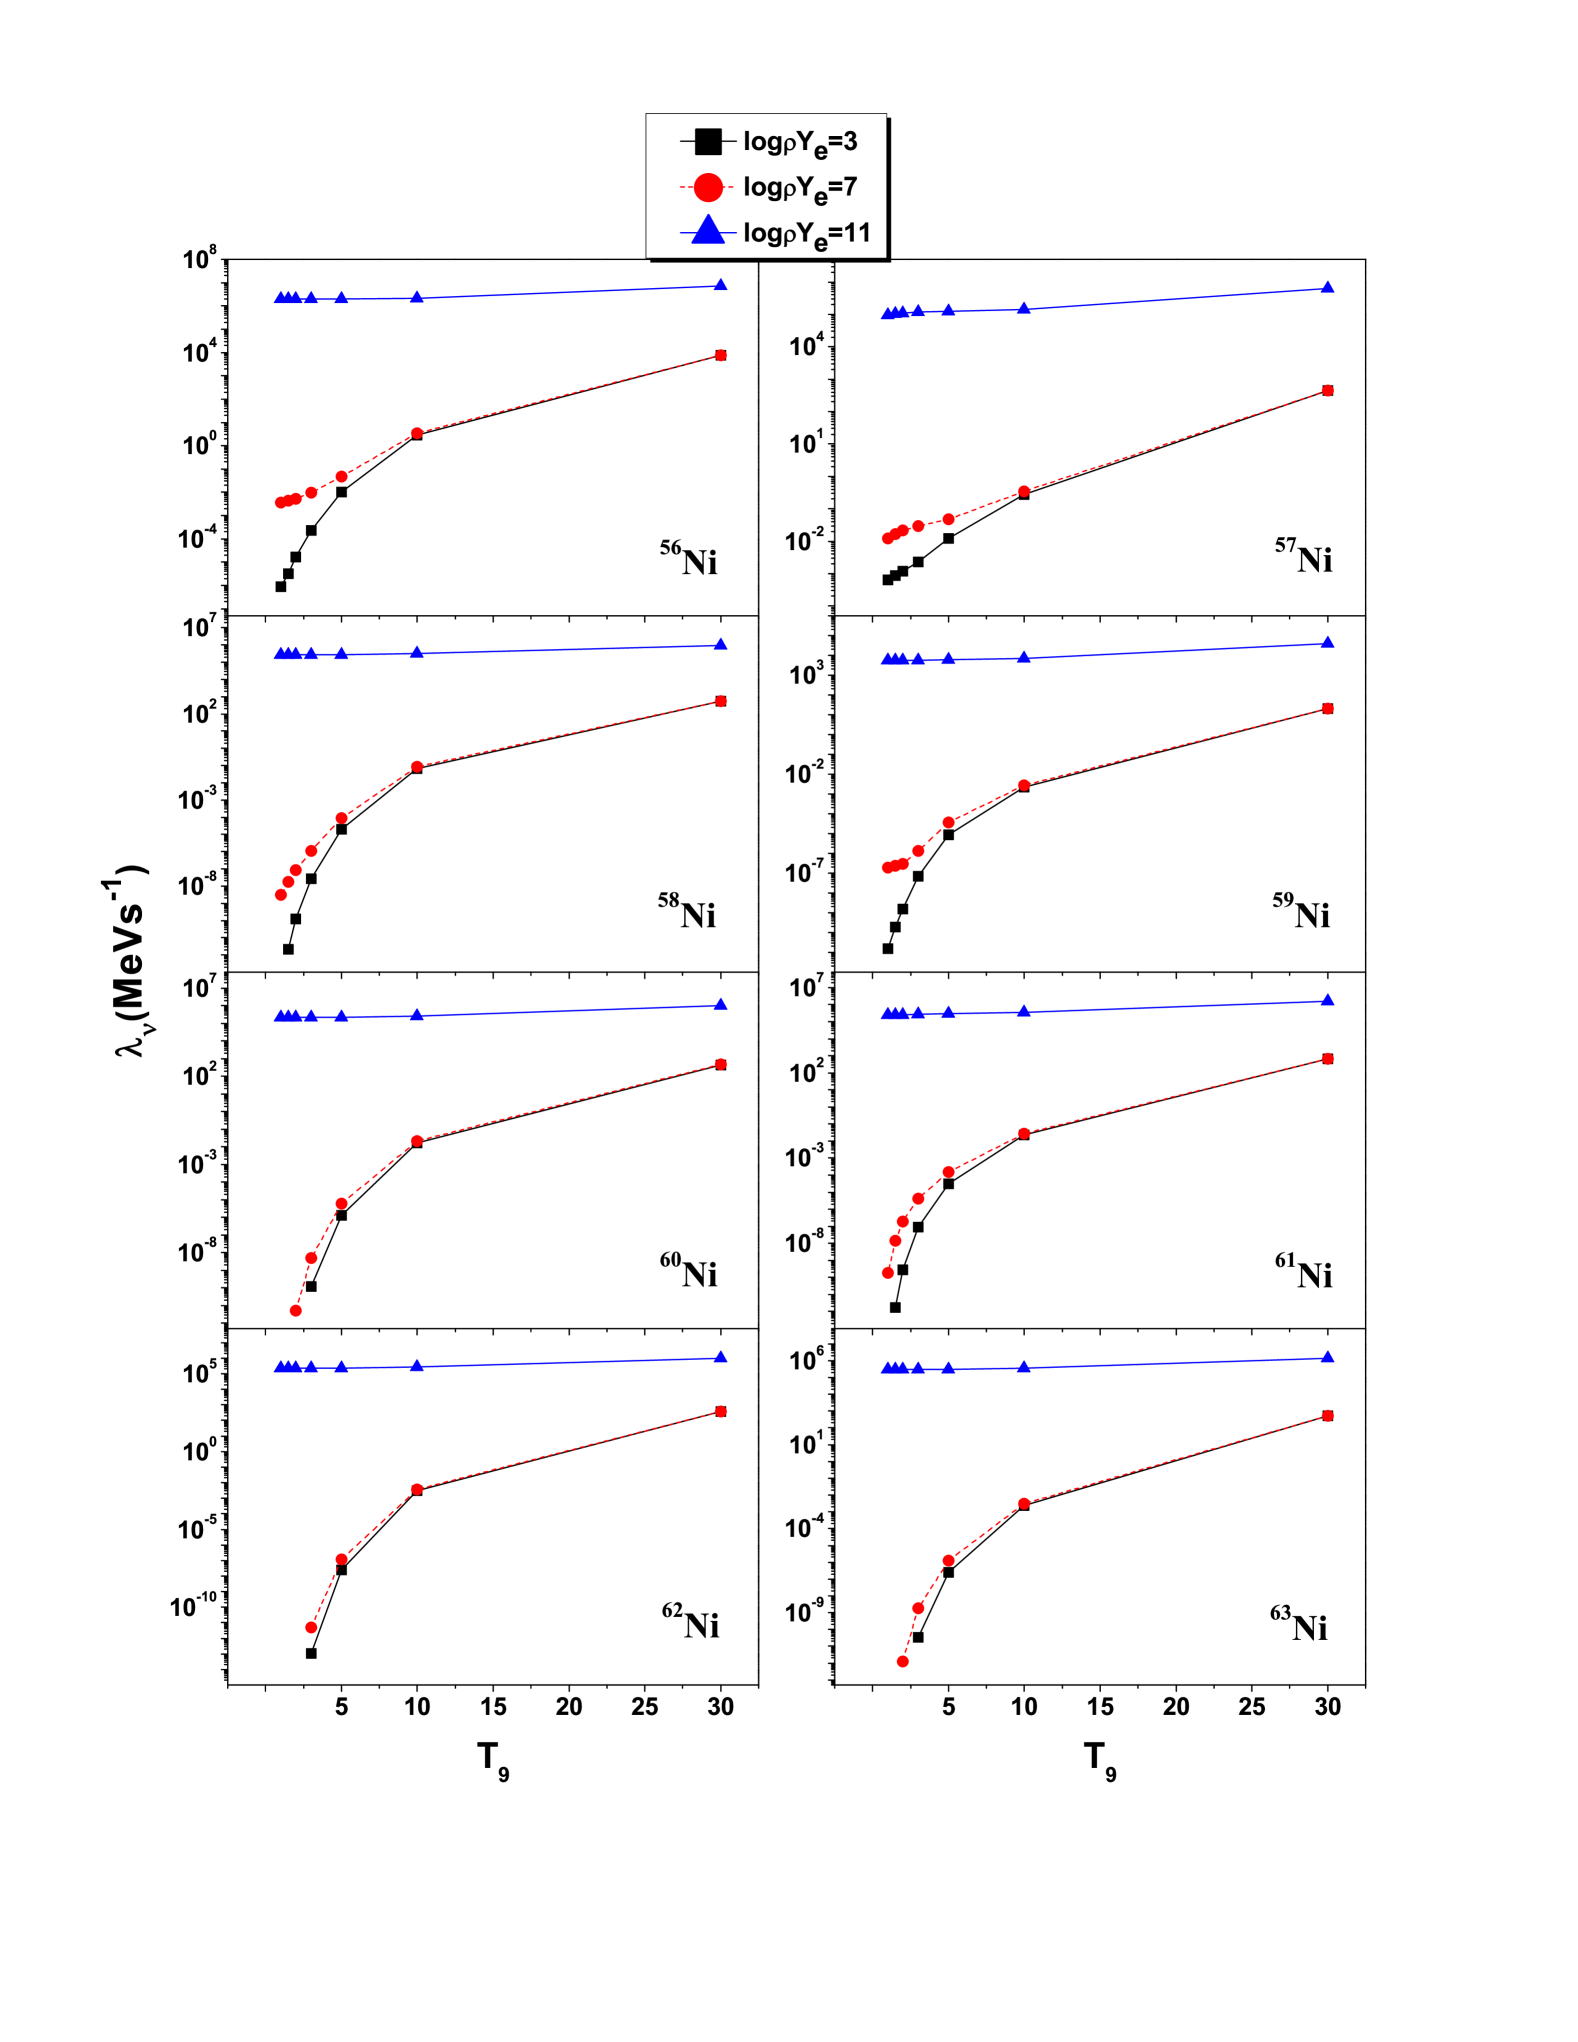
Our calculated cooling rates on selected nickel isotopes are also compared with earlier calculations done by LSSM [19], FFN [14] and PF [33]. Tables 2-8 exhibit ratios of the calculated values of (anti)neutrino weak-rates due to 56-71Ni nuclide for selected density and temperature values. In the first column of the tables, the selected values of Ye in units of g/cm3 are given. The second column specifies stellar temperatures (T9). R(LSSM), R(FFN) and R(PF) denote the ratios of our computed rates to LSSM, FFN and PF rates, respectively. For our list of nickel isotopes, for the mass range A=56-60, comparison is made with both FFN and LSSM calculations. For A=61-65 only LSSM rates, whereas from A=66 to 71, only PF rates were available for the sake of comparison. As per studies of Aufderheide et. al. [15], 56Ni is amongst the top 3 capture nuclei that decrease Ye. Table 2 shows that, for 56Ni, at low densities and low temperature (T9 = 1), the pn-QRPA estimated energy loss rates are larger as compared to LSSM (FFN) computed rates by nearly a factor of 25 (24). As temperature rises to T9 = 30, and also at medium stellar densities, our rates are still larger than the LSSM and FFN computed rates by a factor of 2-6. At high stellar density, the mutual comparison between the three model calculations improves to within a factor 2. In case of 57Ni, at low temperatures, for low and medium densities, our computed rates surpass LSSM and FFN computed rates by up to 1-2 orders of magnitude, whereas at higher temperatures (T 5) and in the high density region, LSSM (FFN) results surpass our rates by a factor 3-11 (6-30). For 58,59,60Ni (see also Table 3), it is observed that in our selected domain of density and temperature, LSSM and FFN calculated energy loss rates in general exceed our rates. Excluding the case of 59Ni, the agreement generally gets better at high temperature and in the high density region. In case of 61Ni and 63Ni, the LSSM and pn-QRPA neutrino loss rate calculations are in decent comparison (within a factor of 3-4). For the cases of 62,64,65Ni (as in Table 4), at low and medium densities and low temperatures, the LSSM rates are larger than our calculated rates, whereas at high temperature and stellar density, our computed rates get bigger.
| Ye | T9 | 56Ni | 57Ni | 58Ni | |||
|---|---|---|---|---|---|---|---|
| Rν(LSSM) | Rν(FFN) | Rν(LSSM) | Rν(FFN) | Rν(LSSM) | Rν(FFN) | ||
| 3.0 | 1.00 | 2.48E+01 | 2.38E+01 | 4.56E+02 | 2.95E+02 | 2.75E+00 | 1.11E-01 |
| 3.0 | 1.50 | 6.31E+00 | 6.17E+00 | 1.67E+02 | 5.11E+01 | 3.46E-01 | 1.60E-02 |
| 3.0 | 2.00 | 4.80E+00 | 4.56E+00 | 5.62E+01 | 1.55E+01 | 1.66E-01 | 9.16E-03 |
| 3.0 | 3.00 | 3.97E+00 | 3.80E+00 | 1.65E+01 | 4.81E+00 | 1.17E-01 | 8.95E-03 |
| 3.0 | 5.00 | 2.47E+00 | 1.89E+00 | 3.60E+00 | 1.41E+00 | 1.48E-01 | 2.21E-02 |
| 3.0 | 10.00 | 2.36E+00 | 1.16E+00 | 4.04E-01 | 1.73E-01 | 3.71E-01 | 1.71E-01 |
| 3.0 | 30.00 | 5.75E+00 | 1.37E+00 | 3.85E-01 | 1.08E-01 | 7.60E-01 | 2.43E-01 |
| 7.0 | 1.00 | 4.54E+00 | 4.31E+00 | 8.67E+00 | 8.24E+00 | 3.18E+01 | 6.00E+00 |
| 7.0 | 1.50 | 4.45E+00 | 4.29E+00 | 1.09E+01 | 9.51E+00 | 1.23E+00 | 1.09E-01 |
| 7.0 | 2.00 | 4.34E+00 | 4.28E+00 | 1.16E+01 | 8.00E+00 | 3.16E-01 | 2.60E-02 |
| 7.0 | 3.00 | 3.97E+00 | 3.86E+00 | 9.77E+00 | 4.31E+00 | 1.24E-01 | 1.14E-02 |
| 7.0 | 5.00 | 2.80E+00 | 1.95E+00 | 3.91E+00 | 1.46E+00 | 1.47E-01 | 2.07E-02 |
| 7.0 | 10.00 | 2.38E+00 | 1.16E+00 | 4.14E-01 | 1.75E-01 | 3.76E-01 | 1.71E-01 |
| 7.0 | 30.00 | 5.75E+00 | 1.37E+00 | 3.84E-01 | 1.08E-01 | 7.62E-01 | 2.43E-01 |
| 11.0 | 1.00 | 1.63E+00 | 6.27E-01 | 8.95E-02 | 3.38E-02 | 4.45E-01 | 1.43E-01 |
| 11.0 | 1.50 | 1.63E+00 | 6.25E-01 | 9.59E-02 | 3.62E-02 | 4.46E-01 | 1.43E-01 |
| 11.0 | 2.00 | 1.62E+00 | 6.25E-01 | 1.02E-01 | 3.82E-02 | 4.45E-01 | 1.43E-01 |
| 11.0 | 3.00 | 1.62E+00 | 6.25E-01 | 1.11E-01 | 4.11E-02 | 4.44E-01 | 1.43E-01 |
| 11.0 | 5.00 | 1.62E+00 | 6.24E-01 | 1.22E-01 | 4.40E-02 | 4.39E-01 | 1.43E-01 |
| 11.0 | 10.00 | 1.75E+00 | 6.58E-01 | 1.35E-01 | 4.76E-02 | 4.59E-01 | 1.49E-01 |
| 11.0 | 30.00 | 4.12E+00 | 1.32E+00 | 3.92E-01 | 1.33E-01 | 8.71E-01 | 2.80E-01 |
| Ye | T9 | 59Ni | 60Ni | 61Ni | ||
|---|---|---|---|---|---|---|
| Rν(LSSM) | Rν(FFN) | Rν(LSSM) | Rν(FFN) | Rν(LSSM) | ||
| 3.0 | 1.00 | 4.23E-03 | 1.87E-03 | 1.61E-01 | 1.53E-02 | 3.13E-01 |
| 3.0 | 1.50 | 2.12E-03 | 8.13E-04 | 1.12E-01 | 1.13E-02 | 4.54E-01 |
| 3.0 | 2.00 | 2.24E-03 | 7.01E-04 | 8.51E-02 | 9.48E-03 | 5.83E-01 |
| 3.0 | 3.00 | 7.76E-03 | 1.57E-03 | 8.67E-02 | 1.17E-02 | 8.47E-01 |
| 3.0 | 5.00 | 3.35E-02 | 5.16E-03 | 1.50E-01 | 2.76E-02 | 1.33E+00 |
| 3.0 | 10.00 | 1.94E-02 | 7.73E-03 | 4.25E-01 | 1.29E-01 | 1.02E+00 |
| 3.0 | 30.00 | 3.37E-02 | 1.08E-02 | 1.00E+00 | 2.83E-01 | 2.33E+00 |
| 7.0 | 1.00 | 7.05E-03 | 1.65E-03 | 2.68E-01 | 2.61E-02 | 3.57E-01 |
| 7.0 | 1.50 | 2.60E-03 | 7.55E-04 | 1.24E-01 | 1.23E-02 | 4.72E-01 |
| 7.0 | 2.00 | 1.82E-03 | 4.90E-04 | 7.82E-02 | 8.69E-03 | 5.87E-01 |
| 7.0 | 3.00 | 4.26E-03 | 8.24E-04 | 7.38E-02 | 9.93E-03 | 8.22E-01 |
| 7.0 | 5.00 | 3.06E-02 | 4.58E-03 | 1.48E-01 | 2.62E-02 | 1.32E+00 |
| 7.0 | 10.00 | 1.95E-02 | 7.73E-03 | 4.28E-01 | 1.29E-01 | 1.03E+00 |
| 7.0 | 30.00 | 3.37E-02 | 1.08E-02 | 1.01E+00 | 2.83E-01 | 2.34E+00 |
| 11.0 | 1.00 | 8.67E-03 | 2.96E-03 | 5.43E-01 | 1.29E-01 | 7.74E-01 |
| 11.0 | 1.50 | 8.75E-03 | 2.96E-03 | 5.43E-01 | 1.29E-01 | 7.74E-01 |
| 11.0 | 2.00 | 8.83E-03 | 2.95E-03 | 5.43E-01 | 1.29E-01 | 7.91E-01 |
| 11.0 | 3.00 | 8.95E-03 | 2.95E-03 | 5.47E-01 | 1.29E-01 | 8.39E-01 |
| 11.0 | 5.00 | 9.16E-03 | 2.98E-03 | 5.65E-01 | 1.29E-01 | 9.14E-01 |
| 11.0 | 10.00 | 1.04E-02 | 3.38E-03 | 6.35E-01 | 1.44E-01 | 1.05E+00 |
| 11.0 | 30.00 | 3.73E-02 | 1.22E-02 | 1.32E+00 | 3.37E-01 | 2.90E+00 |
| Ye | T9 | 62Ni | 63Ni | 64Ni | 65Ni |
|---|---|---|---|---|---|
| Rν(LSSM) | Rν(LSSM) | Rν(LSSM) | Rν(LSSM) | ||
| 3.0 | 1.00 | 3.91E-02 | 3.48E-01 | 4.12E-02 | 4.19E-01 |
| 3.0 | 1.50 | 4.55E-02 | 4.37E-01 | 6.92E-02 | 4.65E-01 |
| 3.0 | 2.00 | 5.19E-02 | 5.00E-01 | 1.36E-01 | 5.07E-01 |
| 3.0 | 3.00 | 6.64E-02 | 5.70E-01 | 3.27E-01 | 5.83E-01 |
| 3.0 | 5.00 | 1.24E-01 | 5.32E-01 | 6.59E-01 | 9.57E-01 |
| 3.0 | 10.00 | 4.59E-01 | 5.05E-01 | 1.51E+00 | 2.55E+00 |
| 3.0 | 30.00 | 1.36E+00 | 2.61E+00 | 2.74E+00 | 6.44E+00 |
| 7.0 | 1.00 | 2.03E-02 | 3.61E-01 | 4.14E-02 | 4.22E-01 |
| 7.0 | 1.50 | 3.30E-02 | 4.43E-01 | 6.95E-02 | 4.69E-01 |
| 7.0 | 2.00 | 4.44E-02 | 5.06E-01 | 1.36E-01 | 5.14E-01 |
| 7.0 | 3.00 | 6.37E-02 | 5.77E-01 | 3.29E-01 | 5.87E-01 |
| 7.0 | 5.00 | 1.26E-01 | 5.40E-01 | 6.65E-01 | 9.66E-01 |
| 7.0 | 10.00 | 4.62E-01 | 5.07E-01 | 1.52E+00 | 2.56E+00 |
| 7.0 | 30.00 | 1.37E+00 | 2.61E+00 | 2.74E+00 | 6.43E+00 |
| 11.0 | 1.00 | 1.28E+00 | 1.67E+00 | 4.79E+00 | 5.27E+00 |
| 11.0 | 1.50 | 1.28E+00 | 1.69E+00 | 4.80E+00 | 5.53E+00 |
| 11.0 | 2.00 | 1.28E+00 | 1.71E+00 | 4.79E+00 | 5.66E+00 |
| 11.0 | 3.00 | 1.28E+00 | 1.75E+00 | 4.75E+00 | 5.74E+00 |
| 11.0 | 5.00 | 1.31E+00 | 1.80E+00 | 4.44E+00 | 5.64E+00 |
| 11.0 | 10.00 | 1.45E+00 | 1.91E+00 | 4.53E+00 | 5.53E+00 |
| 11.0 | 30.00 | 2.30E+00 | 3.90E+00 | 5.25E+00 | 9.38E+00 |
| Ye | T9 | 66Ni | 67Ni | 68Ni | 69Ni | 70Ni | 71Ni |
|---|---|---|---|---|---|---|---|
| Rν(PF) | Rν(PF) | Rν(PF) | Rν(PF) | Rν(PF) | Rν(PF) | ||
| 3.0 | 1.00 | 4.94E+00 | 5.09E+00 | 9.51E+02 | 8.30E+00 | 2.19E+02 | 1.73E+02 |
| 3.0 | 1.50 | 7.73E+00 | 5.19E+00 | 9.57E+02 | 5.97E+00 | 2.96E+02 | 1.85E+02 |
| 3.0 | 2.00 | 1.04E+01 | 6.18E+00 | 9.42E+02 | 4.93E+00 | 3.47E+02 | 1.90E+02 |
| 3.0 | 3.00 | 1.60E+01 | 9.91E+00 | 8.67E+02 | 4.30E+00 | 3.91E+02 | 1.94E+02 |
| 3.0 | 5.00 | 3.27E+01 | 1.86E+01 | 6.81E+02 | 6.32E+00 | 3.61E+02 | 1.87E+02 |
| 3.0 | 10.00 | 2.28E+01 | 2.10E+01 | 2.54E+02 | 2.12E+01 | 8.95E+01 | 1.26E+02 |
| 3.0 | 30.00 | 1.26E+01 | 1.44E+01 | 2.52E+01 | 1.10E+01 | 2.65E+01 | 1.53E+01 |
| 7.0 | 1.00 | 4.98E+00 | 5.16E+00 | 9.59E+02 | 8.38E+00 | 2.21E+02 | 1.75E+02 |
| 7.0 | 1.50 | 7.78E+00 | 5.21E+00 | 9.64E+02 | 6.01E+00 | 2.98E+02 | 1.86E+02 |
| 7.0 | 2.00 | 1.04E+01 | 6.21E+00 | 9.46E+02 | 4.95E+00 | 3.48E+02 | 1.91E+02 |
| 7.0 | 3.00 | 1.60E+01 | 9.91E+00 | 8.67E+02 | 4.30E+00 | 3.90E+02 | 1.94E+02 |
| 7.0 | 5.00 | 3.30E+01 | 1.86E+01 | 6.84E+02 | 6.32E+00 | 3.68E+02 | 1.87E+02 |
| 7.0 | 10.00 | 2.37E+01 | 2.13E+01 | 2.59E+02 | 2.14E+01 | 9.25E+01 | 1.27E+02 |
| 7.0 | 30.00 | 1.26E+01 | 1.45E+01 | 2.52E+01 | 1.10E+01 | 2.64E+01 | 1.53E+01 |
| 11.0 | 1.00 | 2.56E-01 | 2.85E+00 | 1.10E-02 | 7.18E-01 | 5.22E-01 | 1.23E-01 |
| 11.0 | 1.50 | 2.56E-01 | 2.88E+00 | 1.10E-02 | 7.16E-01 | 5.24E-01 | 1.44E-01 |
| 11.0 | 2.00 | 2.56E-01 | 2.87E+00 | 1.10E-02 | 7.24E-01 | 5.24E-01 | 1.86E-01 |
| 11.0 | 3.00 | 2.62E-01 | 3.09E+00 | 1.16E-02 | 7.43E-01 | 5.42E-01 | 3.10E-01 |
| 11.0 | 5.00 | 3.76E-01 | 4.12E+00 | 1.08E-01 | 7.96E-01 | 5.73E-01 | 6.08E-01 |
| 11.0 | 10.00 | 6.50E+00 | 8.89E+00 | 9.27E+00 | 3.76E+00 | 4.63E+00 | 5.90E+00 |
| 11.0 | 30.00 | 1.94E+01 | 2.82E+01 | 3.75E+01 | 2.06E+01 | 3.86E+01 | 2.63E+01 |
The differences seen in our and previous calculations (LSSM and FFN) are due to the following reasons. Primarily, we did not consider the Brink-Axel hypothesis (BAH) as used in shell model and FFN work. The pn-QRPA model performs a state-by-state calculation of astrophysical weak-rates from parent to daughter levels in a microscopic way. Recent calculations [47, 48] have shown that for a reliable estimation of stellar rates the BAH is a poor approximation. In addition, the shell model calculation also suffered with convergence problem (as pointed by Ref. [33]). On the other hand the FFN calculations had issues with placement of GT transitions centroids. The pn-QRPA nuclear model did not posses such types of problems and is fully microscopic in nature.
| Ye | T9 | 57Ni | 58Ni | 59Ni | 60Ni | |||
|---|---|---|---|---|---|---|---|---|
| R(FFN) | R(LSSM) | R(FFN) | R(LSSM) | R(FFN) | R(LSSM) | R(FFN) | ||
| 3.0 | 1.00 | 3.83E-06 | 3.66E-04 | 1.74E-04 | 1.63E-03 | 1.25E-03 | 5.86E-03 | 1.95E-03 |
| 3.0 | 1.50 | 3.51E-04 | 5.55E-03 | 2.89E-03 | 5.09E-02 | 3.80E-02 | 2.08E-02 | 5.89E-03 |
| 3.0 | 2.00 | 2.93E-03 | 1.82E-02 | 9.95E-03 | 2.65E-01 | 1.82E-01 | 4.35E-02 | 1.14E-02 |
| 3.0 | 3.00 | 1.95E-02 | 5.24E-02 | 2.90E-02 | 1.21E+00 | 6.58E-01 | 8.67E-02 | 2.12E-02 |
| 3.0 | 5.00 | 6.40E-02 | 1.26E-01 | 6.19E-02 | 2.81E+00 | 1.09E+00 | 1.65E-01 | 4.23E-02 |
| 3.0 | 10.00 | 1.16E-01 | 6.01E-01 | 1.98E-01 | 2.24E+00 | 7.03E-01 | 7.52E-01 | 1.86E-01 |
| 3.0 | 30.00 | 2.36E-01 | 3.43E+00 | 2.19E-01 | 6.56E+00 | 6.49E-01 | 3.63E+00 | 3.51E-01 |
| 7.0 | 1.00 | 3.82E-06 | 2.65E-04 | 1.74E-04 | 1.42E-03 | 1.25E-03 | 9.33E-03 | 3.94E-03 |
| 7.0 | 1.50 | 3.52E-04 | 4.12E-03 | 2.88E-03 | 4.11E-02 | 3.81E-02 | 1.59E-02 | 7.03E-03 |
| 7.0 | 2.00 | 2.91E-03 | 1.41E-02 | 9.68E-03 | 1.90E-01 | 1.82E-01 | 2.70E-02 | 1.25E-02 |
| 7.0 | 3.00 | 1.86E-02 | 4.43E-02 | 2.54E-02 | 7.21E-01 | 6.55E-01 | 4.48E-02 | 2.22E-02 |
| 7.0 | 5.00 | 6.03E-02 | 1.20E-01 | 5.48E-02 | 1.90E+00 | 1.06E+00 | 1.08E-01 | 4.17E-02 |
| 7.0 | 10.00 | 1.15E-01 | 5.98E-01 | 1.96E-01 | 2.18E+00 | 6.70E-01 | 7.33E-01 | 1.76E-01 |
| 7.0 | 30.00 | 2.36E-01 | 3.43E+00 | 2.19E-01 | 6.56E+00 | 6.50E-01 | 3.63E+00 | 3.51E-01 |
| 11.0 | 1.00 | – | – | – | – | – | – | – |
| 11.0 | 1.50 | – | – | – | 5.68E-03 | 7.28E-04 | – | – |
| 11.0 | 2.00 | 6.25E-04 | 2.31E-03 | 9.71E-04 | 2.46E-03 | 3.13E-04 | 6.30E-04 | 5.48E-05 |
| 11.0 | 3.00 | 5.51E-03 | 9.55E-03 | 4.39E-03 | 1.53E-02 | 1.87E-03 | 1.02E-03 | 7.89E-05 |
| 11.0 | 5.00 | 3.00E-02 | 3.78E-02 | 1.99E-02 | 7.71E-02 | 8.61E-03 | 4.16E-03 | 2.73E-04 |
| 11.0 | 10.00 | 1.00E-01 | 3.74E-01 | 1.64E-01 | 4.75E-01 | 4.34E-02 | 1.49E-01 | 8.85E-03 |
| 11.0 | 30.00 | 2.34E-01 | 3.33E+00 | 2.17E-01 | 6.27E+00 | 6.07E-01 | 3.42E+00 | 3.27E-01 |
| Ye | T9 | 61Ni | 62Ni | 63Ni | 64Ni | 65Ni |
|---|---|---|---|---|---|---|
| R(LSSM) | R(LSSM) | R(LSSM) | R(LSSM) | R(LSSM) | ||
| 3.0 | 1.00 | 2.96E-02 | 3.44E-03 | 3.12E+00 | 5.97E-06 | 1.54E-01 |
| 3.0 | 1.50 | 1.80E-01 | 9.42E-03 | 3.10E+00 | 2.14E-04 | 1.45E-01 |
| 3.0 | 2.00 | 6.47E-01 | 2.07E-02 | 3.08E+00 | 1.50E-03 | 1.58E-01 |
| 3.0 | 3.00 | 1.96E+00 | 5.22E-02 | 3.20E+00 | 1.79E-02 | 1.89E-01 |
| 3.0 | 5.00 | 2.96E+00 | 1.48E-01 | 1.82E+00 | 1.07E-01 | 1.49E-01 |
| 3.0 | 10.00 | 1.96E+00 | 8.13E-01 | 6.89E-01 | 5.06E-01 | 1.08E-01 |
| 3.0 | 30.00 | 6.85E+00 | 3.85E+00 | 5.02E+00 | 2.66E+00 | 5.93E-01 |
| 7.0 | 1.00 | 2.85E-01 | 6.03E-01 | 9.75E-01 | 1.95E-03 | 1.34E-01 |
| 7.0 | 1.50 | 3.13E-01 | 6.03E-01 | 1.01E+00 | 2.49E-02 | 1.33E-01 |
| 7.0 | 2.00 | 6.30E-01 | 4.53E-01 | 1.15E+00 | 1.06E-01 | 1.52E-01 |
| 7.0 | 3.00 | 1.45E+00 | 2.02E-01 | 1.23E+00 | 2.38E-01 | 1.97E-01 |
| 7.0 | 5.00 | 1.75E+00 | 1.18E-01 | 8.41E-01 | 1.69E-01 | 1.69E-01 |
| 7.0 | 10.00 | 1.82E+00 | 7.59E-01 | 6.07E-01 | 4.69E-01 | 1.04E-01 |
| 7.0 | 30.00 | 6.84E+00 | 3.85E+00 | 5.01E+00 | 2.66E+00 | 5.93E-01 |
| 11.0 | 1.00 | – | – | – | – | – |
| 11.0 | 1.50 | 3.45E-04 | 6.65E-03 | 2.47E-03 | 1.93E-02 | 1.49E-02 |
| 11.0 | 2.00 | 8.30E-04 | 6.00E-03 | 2.58E-03 | 1.62E-02 | 1.62E-02 |
| 11.0 | 3.00 | 3.28E-03 | 5.25E-03 | 2.51E-03 | 1.33E-02 | 1.77E-02 |
| 11.0 | 5.00 | 1.31E-02 | 6.53E-03 | 2.49E-03 | 1.62E-02 | 1.77E-02 |
| 11.0 | 10.00 | 1.14E-01 | 6.37E-02 | 1.31E-02 | 6.71E-02 | 2.07E-02 |
| 11.0 | 30.00 | 6.17E+00 | 3.48E+00 | 3.98E+00 | 2.22E+00 | 5.37E-01 |
| Ye | T9 | 66Ni | 67Ni | 68Ni | 69Ni | 70Ni | 71Ni |
|---|---|---|---|---|---|---|---|
| R(PF) | R(PF) | R(PF) | R(PF) | R(PF) | R(PF) | ||
| 3.0 | 1.00 | 9.91E-01 | 1.33E+00 | 8.18E-01 | 1.16E+00 | 7.26E-01 | 4.53E-01 |
| 3.0 | 1.50 | 3.11E+00 | 1.15E+00 | 8.20E-01 | 8.38E-01 | 7.24E-01 | 3.71E-01 |
| 3.0 | 2.00 | 3.79E+00 | 9.82E-01 | 8.13E-01 | 6.27E-01 | 7.14E-01 | 3.05E-01 |
| 3.0 | 3.00 | 3.97E+00 | 6.90E-01 | 6.22E-01 | 3.69E-01 | 4.35E-01 | 2.14E-01 |
| 3.0 | 5.00 | 2.79E+00 | 3.71E-01 | 1.63E-01 | 1.39E-01 | 5.85E-02 | 1.22E-01 |
| 3.0 | 10.00 | 2.09E+00 | 9.38E-01 | 4.84E-01 | 1.50E-01 | 2.21E-01 | 2.90E-01 |
| 3.0 | 30.00 | 1.41E+01 | 1.57E+01 | 1.75E+01 | 3.09E+00 | 1.41E+01 | 7.80E+00 |
| 7.0 | 1.00 | 5.96E-01 | 1.28E+00 | 6.37E-01 | 1.47E+00 | 5.36E-01 | 3.16E-01 |
| 7.0 | 1.50 | 2.34E-01 | 1.10E+00 | 6.59E-01 | 9.91E-01 | 5.48E-01 | 2.66E-01 |
| 7.0 | 2.00 | 2.58E-01 | 9.33E-01 | 6.71E-01 | 7.00E-01 | 5.52E-01 | 2.29E-01 |
| 7.0 | 3.00 | 8.99E-01 | 6.38E-01 | 4.56E-01 | 3.82E-01 | 3.34E-01 | 1.73E-01 |
| 7.0 | 5.00 | 1.21E+00 | 2.77E-01 | 8.26E-02 | 1.28E-01 | 3.96E-02 | 1.00E-01 |
| 7.0 | 10.00 | 1.89E+00 | 8.43E-01 | 4.72E-01 | 1.41E-01 | 2.11E-01 | 2.64E-01 |
| 7.0 | 30.00 | 1.41E+01 | 1.57E+01 | 1.75E+01 | 3.10E+00 | 1.41E+01 | 7.80E+00 |
| 11.0 | 1.00 | – | – | – | 2.01E+04 | – | 7.13E+10 |
| 11.0 | 1.50 | 5.30E+05 | 2.30E+14 | 1.62E+11 | 1.36E+20 | 3.84E+14 | 2.69E+24 |
| 11.0 | 2.00 | 7.29E+04 | 4.12E+10 | 6.31E+08 | 7.35E+14 | 1.67E+11 | 8.75E+17 |
| 11.0 | 3.00 | 7.93E+03 | 5.79E+06 | 1.95E+06 | 3.16E+09 | 6.92E+07 | 2.03E+11 |
| 11.0 | 5.00 | 9.33E-01 | 1.35E-01 | 1.73E+01 | 1.42E-01 | 5.33E-01 | 8.04E-03 |
| 11.0 | 10.00 | 6.19E-01 | 2.79E-01 | 2.24E+00 | 1.09E-01 | 8.07E-01 | 7.78E-02 |
| 11.0 | 30.00 | 1.39E+01 | 1.52E+01 | 1.76E+01 | 2.82E+00 | 1.43E+01 | 5.86E+00 |
Table 5 shows the comparison of our estimated neutrino cooling rates on 66-71Ni nuclide with the ones calculated by PF. For 66,69Ni, at low and medium density, our calculated rates are bigger than PF rates. At high stellar density, the two rates are in reasonable comparison. In case of 67Ni, our reported rates are factor 3-28 bigger than PF rates for the entire domain of selected density and temperature. For 68,70,71Ni, the pn-QRPA and PF comparison shows similar trend, where in the low and medium density regions pn-QRPA computed energy loss rates are greater by up to 2 orders of magnitude than PF rates. At high stellar temperature (where the occupation probability of parent excited states increases) our computed rates are enhanced by an order of magnitude as compared to PF rates. For these neutron rich nuclide our rates are enhanced due to the reason that we have used a large model space in pn-QRPA calculations (up to seven major oscillator shells) which can effectively handle all excited levels both in parent and daughter nuclide.
Now we move towards the comparison of antineutrino energy loss rates due to 57-71Ni isotopes with the previous calculations, which has been presented in Tables . The antineutrino cooling rates in the high density domain are orders of magnitude smaller than the ones in the low and medium density regions, especially at low temperatures. Generally, smaller the results for energy loss rates, larger the differences are observed with the previous calculations. At Ye = 11, for temperatures, T, the rates are reported to have values even lower than MeV. The comparison is not made for such low values of the rates. With the increasing stellar temperature, the magnitude of the estimated energy loss rates increases and the comparison between the different calculations improves. For 57-60Ni, the FFN rates are available for the comparison. At low temperatures, FFN rates exceed pn-QRPA computed rates by up to 2-5 orders of magnitude for different isotopes. The comparison between the results of two models improves with the increasing temperature, but the FFN rates are still factor 2-4 larger than our rates at . For 58-65Ni, our estimated energy loss rates are also compared with the ones calculated by LSSM. In case of even isotopes (58,60,62,64Ni), for temperatures, T, LSSM computed rates surpass our rates, whereas at T, our estimated rates are factor 3-4 larger. The comparison of pn-QRPA and LSSM computed antineutrino cooling rates due to 59,61,63Ni is fairly good for temperatures, T in the domain of low and medium densities. In the high density region, LSSM calculated rates exceed by up to 3 orders of magnitude at lower temperatures. At T, our rates get bigger by up to a factor of 7. In case of 65Ni, LSSM estimated cooling rates exceed our rates in all regions of selected density and temperature. At T, the agreement between the two results is better but still LSSM rates are factor two bigger. These differences in the comparison appears due to the reasons discussed earlier.
For the next six isotopes, 66-71Ni, the pn-QRPA estimated cooling rates have been compared with PF calculations. As can be noted from Table 8, for these neutron rich isotopes, in the low and medium density domain and at low temperatures, the comparison of our calculated cooling rates is fairly good against the ones made by PF. At high stellar density, where the calculated cooling rates are very small, large differences (up to several orders of magnitude) in the two results can be observed especially at low temperatures (T). At higher temperatures, the mutual comparison between the two results improves. At T9 = 30, our rates are larger by up to an order of magnitude as in case of neutrino rates.
4 Conclusions
Gamow-Teller (GT) charge-changing transitions on nickel nuclide play a crucial role in the evolutionary stages of massive stars. Lepton capture and decay rates on nickel nuclide notably affect the lepton-to-baryon fraction. Neutrinos and antineutrinos, produced in weak-decay reactions, are transparent to stellar core and escape from the stellar interior. (Anti)neutrinos reduce the stars entropy and take away energy, thereby cools the stellar interior. The deformed pn-QRPA theory having a decent track record of terrestrial half-lives values was employed to predict the (anti)neutrinos cooling rates on nickel nuclide in stellar scenario. Our calculated beta decay half-lives for selected nickel isotopes are in excellent comparison with measured values.
We have computed the neutrino and antineutrino cooling rates over broad range of densities (10 – 1011g/cm3) and stellar temperatures (0.01109 – 30109K) domains. The comparison of computed neutrino cooling rates with the earlier theoretical work of FFN and LSSM (wherever possible) was done. It should be noted that the calculations of FFN and LSSM employed the Brink-Axel hypothesis, not adopted in our pn-QRPA calculation. The LSSM calculation also suffered with convergence problem (as pointed by Ref. [33]). On the other hand FFN calculations had issues with placement of GT transitions centroids. Our nuclear model did not encounter these problems. The current calculations are fully microscopic in nature. For neutron-rich nickel nuclide we compared our results with that of Pruet and Fuller work. At high stellar temperature (T9 = 30) our rates are higher by up to an order of magnitude than PF. Specially for neutron rich nickel isotopes, at high core temperatures, our computed cooling rates are enhanced as compare to previous calculations. We recommend core-collapse simulators to test run our computed neutrino cooling rates which we believe not only are different than previous calculations but are also more reliable for reasons stated before.
Acknowledgements
J.-U. Nabi would like to acknowledge the support of the Higher Education Commission Pakistan through project numbers 5557/KPK/NRPU/RD/HEC/2016 and 9-5(Ph-1-MG-7)Pak-Turk/RD/HEC/2017 and Pakistan Science Foundation through project number PSF-TUBITAK/KP-GIKI (02).
References
References
- [1] Cowan J J and Thielemann F-K 2004 Phys. Today, October Issue 47.
- [2] Langanke K and Martinez-Pinedo G 2003 Rev. Mod. Phys. 819.
- [3] Heger A et al., 2001 Phys. Rev. Lett. 1678.
- [4] Janka H-T et al., 2007 Phys. Rep. 38.
- [5] Bethe H A 1990 Rev. Mod. Phys. 801.
- [6] Wilson J R 1985 in Numerical Astrophys., ed. Centrella J M, Leblanc J M and Bowers R L, 422.
- [7] Bethe H A and Wilson J R 1985 Astrophys. J. 14.
- [8] Bruenn S W et al., 2001 Astrophys. J. 326.
- [9] Janka H-T et al., 2008 Ast. Astrophys. 199.
- [10] Fryer C L and Heger A 2000 Astrophys. J. 1033.
- [11] Melson T et al., 2015 Astrophys. J. L24.
- [12] Strother T and Bauer W 2009 Prog. Part. Nucl. Phys. 468.
- [13] Bethe H A et al., 1979 Nucl. Phys. A 487.
- [14] Fuller G M, Fowler W A and Newman M J, Astrophys. J. Suppl. Ser. 1980 42 447; 1982 48, 279; 1985 Astrophys. J. 293, 1.
- [15] Aufderheide M B et al., 1994 Astrophys. J. Suppl. 389.
- [16] Rapaport J et al., 1983 Nucl. Phys. A 371.
- [17] El-Kateb S et al., 1994 Phys. Rev. C 3129.
- [18] Nabi J-U and Klapdor-Kleingrothaus H V 1999 Eur. Phys. J. A 337.
- [19] Langanke K and Martínez-Pinedon G 2000 Nucl. Phys. A 481.
- [20] Brink D 1955 D. Phil. Thesis, Oxford University, Unpublished; Axel P 1962 Phys. Rev. 126 671.
- [21] Nabi J-U and Klapdor-Kleingrothaus H V 1999 At. Data Nucl. Data Tables 149.
- [22] Nabi J-U and Klapdor-Kleingrothaus H V 2004 At. Data Nucl. Data Tables 237.
- [23] Nabi J-U and Sajjad M 2007 Phys. Rev. C 055803.
- [24] Nabi J-U and Sajjad M 2008 Phys. Rev. C 045801.
- [25] Heger A et al., 2001 Astrophys. J. 307.
- [26] Nabi J-U and Rahman M-U 2005 Phys. Lett. B 190.
- [27] Nabi J-U 2012 Eur. Phys. J. A 84.
- [28] Nabi J-U and Majid M 2017 Int. J. Mod. Phys. E 26 1750005.
- [29] Gaarde C, 1983 Nucl. Phys. A 396 127c.
- [30] Vetterli M C et al., 1989 Phy. Rev. C 559.
- [31] Rönnqvist T et al., 1993 Nucl. Phys. A 563 225
- [32] Cakmak S, Nabi J-U and Babacan T 2018 Nucl. Phys. A 970 86.
- [33] Pruet J and Fuller G M 2003 Astrophys. J. Suppl. Ser. 189.
- [34] Nilsson S G 1955 Mat. Fys. Medd. Dan. Vid. Selsk 29 1-68.
- [35] Ikeda K, Fujii S and Fujita J I 1963 Phys. Lett. 3 271.
- [36] Homma H, Bender E, Hirsch M, Muto K, Klapdor-Kleingrothaus H V and Oda T 1996 Phys. Rev. C 54 2972.
- [37] Nabi J-U, Cakmak N, Majid M and Salam J 2017 Nucl. Phys. A 957 1.
- [38] Majid M, Nabi J-U and Daraz G 2017 Astrophys. Space Sci. 362 108.
- [39] Hirsch M et al., 1991 Nucl. Phys. 535 62.
- [40] Möller P, Nix J R, Myers W D and Swiatecki W J 1995 At. Data Nucl. Data Tables 59 185.
- [41] Audi G et al., 2012 Chin. Phys. C 36 1157.
- [42] Aufderheide M B et al., Phys. Rev. C 53 (1996) 3139-3142.
- [43] Muto K, Bender E and Klapdor H V 1989 Z. Phys. A333 125.
- [44] Hardy J C and Towner I C 2009 Phys. Rev. C , 055502.
- [45] Nakamura K and Particle Data Group 2010 J. Phys. G: Nucl. and Part. Phys. , 075021.
- [46] Gove N B and Martin M J 1971 At. Data Nucl. Data Tables 205.
- [47] Misch G W et al., 2014 Phys. Rev. C 90 065808.
-
[48]
Johnson C W 2015 Phys. Lett. B 750 72.