Complexity at Scale: A Quantitative Analysis of an Alibaba Microservice Deployment
Abstract
Microservice architectures are increasingly prevalent in organisations providing online applications. Recent studies have begun to explore the characteristics of real-world large-scale microservice deployments; however, their operational complexities, and the degree to which this complexities are consistent across different deployments, remains under-explored. In this paper, we analyse a microservice dataset released by Alibaba along three dimensions of complexity: scale, heterogeneity, and dynamicity. We find that large-scale deployments can consist of tens of thousands of microservices, that support an even broader array of front-end functionality. Moreover, our analysis shows wide-spread long-tailed distributions of characteristics between microservices, such as share of workload and dependencies, highlighting inequality across the deployment. This diversity is also reflected in call graphs, where we find that whilst front-end services produce dominant call graphs, rarer non-dominant call graphs are prevalent and could involve dissimilar microservice calls. We also find that runtime dependencies between microservices deviate from the static view of system dependencies, and that the deployment undergoes daily changes to microservices. We discuss the implications of our findings for state-of-the-art research in microservice management and research testbed realism, and compare our results to previous descriptions of large-scale microservice deployments to begin to build an understanding of their commonalities.
I Introduction
Microservice architectures (MSAs) have become the leading method for building large-scale distributed applications [1]. These architectures are built using small, distinct, microservices (MSs) that communicate with each other over well defined APIs. This architectural style facilitates small agile development teams, rapid development of new features, and fine-grained scaling. Yet, these characteristics can also lead to unique challenges associated with MSAs, such as increased operational complexity, MS co-ordination , and scale [2], rendering system maintenance, and integrity and uptime assurance, extremely complicated. However, on the other hand, online application downtime can be associated with extremely high costs, with Fortune 1000 companies reporting losses of up to $1 million per hour of disruption [3, 4].
To address these challenges extensive research has been carried out into novel approaches to detect faults [5], pinpoint root causes [6], and provide efficient auto-scaling through workload prediction [7]. Research has explored data-driven approaches for optimising MSA design and minimising anti-patterns [8, 9]. However, such approaches are often motivated and subsequently designed based only on theoretical understandings of MSAs stemming from perceived common design practices and the challenges associated with them. This issue is further exacerbated by the reliance on small-scale open-source testbeds [10] due to the scarce access to industrial-scale datasets with ground truth. Whilst such testbeds are designed based on best practices, they do not match the complexity associated with real-world large-scale MSAs [10]. This puts into question the efficacy of any such derived methodologies.
Recently, a few investigations have begun to characterise the properties of large-scale MSAs, e.g., [11, 12]. However, these studies lack a comprehensive view of characteristics, challenges, and potential guiding principles associated with such systems. An exception to this is the recent study of Meta’s MSA [13] which provides insights toward improving the realism of MS testbeds. However, the implications for state-of-the-art approaches for MSA management were not explored in depth. Furthermore, being the first empirical investigation to take a general approach to understanding the governing principles of enterprise-grade MSAs, it is yet unclear the extent to which the findings are representative of other deployments.
In this paper we aim to contribute to this emerging literature by analysing a large-scale microservice dataset released by Alibaba [14]. Our analysis is articulated around three key dimensions of MSAs associated with operational and management challenges from the literature: scale, heterogeneity, and dynamicity [2, 10, 15, 16, 17, 18, 19, 20]. Throughout the paper, we discuss the implications of our findings along these three main axes for state-of-the-art research in MSA management and design, as well as the development of more realistic research testbeds, providing insights to motivate future research to better meet the challenges of real-world MSAs. Where applicable, we discuss our findings in light of those found at Meta [13], thus providing the first comparative analysis of enterprise-grade MSAs. The main findings of our investigation can be summarised as below.
- (1)
-
(2)
Topological characteristics: the dependency structure at Alibaba is sparse (III-D). It demonstrates similar local characteristics to Meta (IV-D) and sees similar scales of daily churn in MSs (V-C). We also find that the local dependency structure of MSs at Alibaba diverges from the static view at runtime.
- (3)
- (4)
-
(5)
Deployment and operational variability: MS instances are deployed across a large number of hosts and can be co-located with a large number of different MSs (IV-B). The workload experienced by the system is highly variable over a daily period (III-C), however, not all MSs horizontally scale in response to this changing system workload (V-B).
In the following section, we briefly summarise some key aspects of the dataset.
II Alibaba’s Microservice Architecture and Dataset
The Alibaba MSA has been described previously in their existing publications [7]. Below, we provide a brief overview of the dataset released by Alibaba from this MSA that we study in this paper [14]. Alibaba adopt Kubernetes [21] to manage their cloud [22]. In this architecture, both online services and jobs that run offline co-exist on the same bare-metal nodes to minimise resource under-utilisation. Stateful MSs, such as databases and in-memory stores, are deployed within a dedicated cluster which is not shared with stateless MS. Alibaba adopt the Application Real-Time Monitoring Service (ARMS) [23, 24] to collect monitoring information from their deployment, which is similar to Google’s Dapper [25]. The data collected by ARMS over 14 days of operation of deployed MSs in 2022 has been open-sourced [14]. The dataset is split into several parts, each covering specific monitoring information; in this paper we utilise the data associated with microservice calls and microservice resource usage, from hereafter referred to as the call data and resource data.
Each row of the call data corresponds to a single call made between an upstream and downstream microservice, denoted as ‘um’ and ‘dm’, acting as the consumer and provider MSs respectively. Each row also contains a number of auxiliary fields. The RPC type signifies the communication paradigm used by the call: remote procedure calls (‘rpc’), HTTP requests (‘http’), message queues (‘mq’), memcached calls (‘mc’), and database calls (‘db’). The Trace ID identifies the collection of calls made between microservices that are associated with a single front-end request. The RPC ID is used to reconstruct the call graph structure of a call collection identified by a given Trace ID. RPC IDs provide information as to the invocation order of calls starting from the entry microservice, in a dot-separated format. For example, the two calls made by an entry-level microservice A to microservices B and then C will have the RPC IDs ‘0.1’ and ‘0.2’ respectively. If B subsequently made a call to D the RPC ID for that call would be ‘0.1.1’, whereas if C made this call it would have the value ‘0.2.1’. Finally, the Service ID associates each call within the data with the invocation of a specific front-end service functionality. Examples of such functionalities include searching products, ordering, and delivering111Service IDs are also associated with sporadic non-user activities such as management and testing, and thus this interpretation of Service IDs is not completely straightforward, as seen in Section III-B. However, no information is provided about top-level applications and thus we cannot know which Service IDs are associated with which business domains at Alibaba.
Each row of the resource data contains a single sample of CPU and memory utilisation from stateless MS instances, sampled every 60 seconds across the full 14 days. Each row contains a MS Instance ID and MS ID which correspond to the stateless MS names found in the call data. Each row also contains a Node ID which denotes the specific host in which the MS instance is deployed at the time of the sample.
III Scale
Microservice architectures, whilst conceived for individual MS simplicity and modularity, can often evolve into highly complex, sprawling architectures as they organically grow to meet business demands. This scale imparts significant operational challenges for MSA management [2]. In this section, we present quantitative insights into how scale manifests at the architectural, service, and microservice levels.
III-A Microservices and Microservice Instances
| Entry | Leaf | Middle | Total | |
| MS | 8,591 (13%) | 25,201 (39%) | 30,959 (48%) | 67,760 |
| MSI | 137,547 (7%) | 436,263 (23%) | 1,292,281 (69%) | 1,866,091 |
| Ratios | 16 | 17 | 41 | 28 |
Scale is measured in tens of thousands of microservices and a million instances: in total, we identified 64,751 unique MSs that were deployed as 1,866,091 instances in 14 days (see Table I); on average, each MS was deployed as 29 instances.
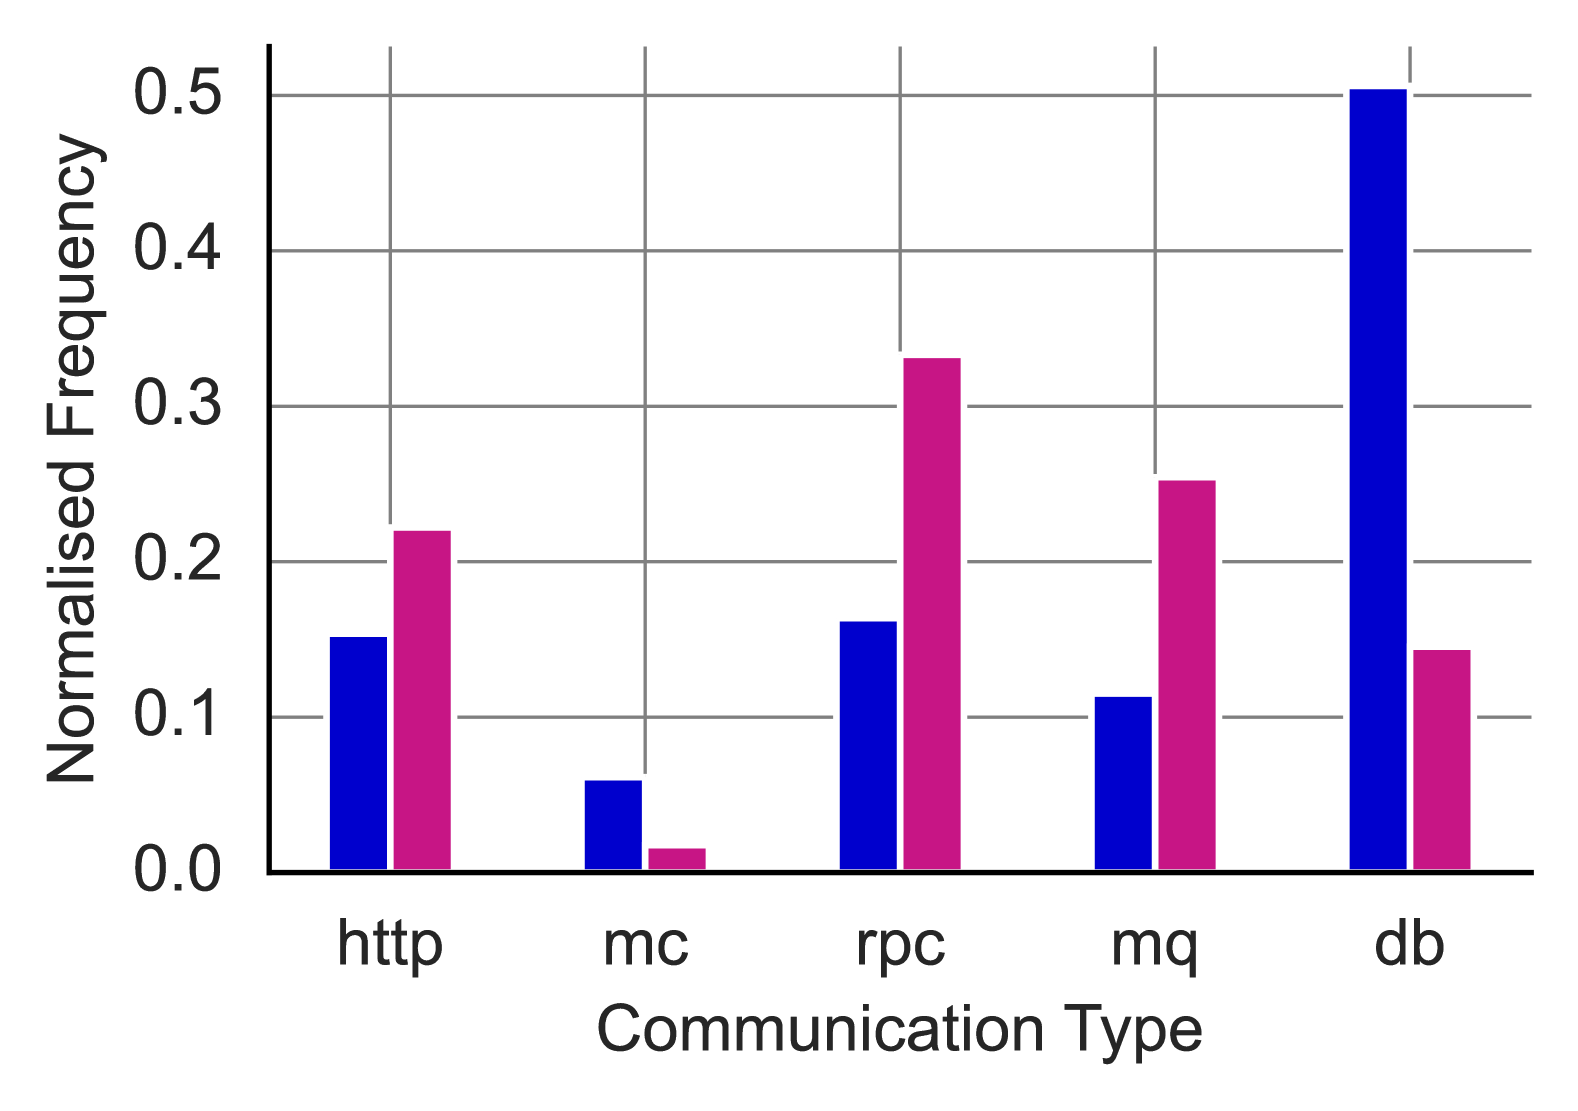
Most MSs both make and receive calls: We found that 8,591 MSs were responsible for handling entry calls222An entry call is the initial request made from an external client or system that enters the microservice deployment. and 25,201 of MSs never made calls across the 14 days, meaning that the majority, 30,959 of MSs, both received from, and made calls to, other MSs. When investigating the types of RPC calls received by all MSs and leaf MSs, (see Figure 1), we found that database and memcached RPC types were disproportionately represented for leaf MSs. This demonstrates that these nodes primarily consist of stateful MSs.
MS that both make and receive calls had more deployed instances: Across all MS instances we found that 728,544 (92.6%) appeared downstream at least once, whereas 1,429,828 (76.6%) appeared upstream. Microservices that only received calls made up a lower than expected share of microservice instances – 34.3% of microservices but only 23.4% of instances. This finding may be attributed to reduced scaling due to higher horizontal scaling overheads from the need for data replication, consistency, and distributed transaction management. Overall, microservices that both received and made calls comprised the majority of microservice instances, 69.3%, indicating that these microservices experience higher or more varied workloads, or their functionality is associated with higher computational costs.
Alibaba’s MSA is larger in number of unique MSs but Meta’s is larger in number of replications: Whilst Meta had overall fewer unique microservices (18,500 vs 64,800) these microservices were deployed as considerably more instances than at Alibaba (12 million vs 1.8 million). These differences could be a result of the divergent purposes of each deployment, with Meta providing primarily social-media services, and Alibaba providing a mix of e-commerce, financial, and digital media services, driving different engineering considerations. Another possibility, which may also be linked to the purpose of each deployment, is that Alibaba opts for much finer-grained MSs, with each MS handling a smaller slice of functionality, whereas Meta consolidates broader functionalities into fewer, more heavily replicated MSs. Overall, these results reflect architectural design differences between the two organisations at the MS and MS instance level.
III-B Services

The number of Service IDs is significantly inflated by sporadic non-user functionality: Across the dataset, we identified 166,093,303 unique services, dwarfing the number of microservices identified in Section III-A. However, Service IDs can also be associated with non-user functionality such as testing. When investigating the number of invocations of each service across the 14 days we found that only 7,352,480 (4.4%) had more than a single invocation, and only 536,958 (0.3%) had more than 100 total invocations. As it is expected that Alibaba’s online services are generally used by a very large number of users, this suggests that the number of unique services is drastically inflated by sporadic non-user facing functionality.
Many Service IDs share an identical set of MS call repertoires For each Service ID, we grouped all associated MS calls into a deduplicated list. This list represents all of the back-end MSs that front-end service functionality relies on, which we refer to as a Service ID’s call fingerprint.
Since we noted a large inflation in Service IDs, we explored to what extent different Service IDs had overlapping call fingerprints, and thus overlapping functionality. We did so by converting call fingerprints into MinHashes and using locality-sensitive hashing (LSH) to find Service ID fingerprints that could be matched. Overall, we found that 159 million (99.39%) Service ID fingerprints were non-unique, and could be matched to at least one other Service ID fingerprint. The most matched fingerprint was associated with 16 million (10%) of all Service IDs.
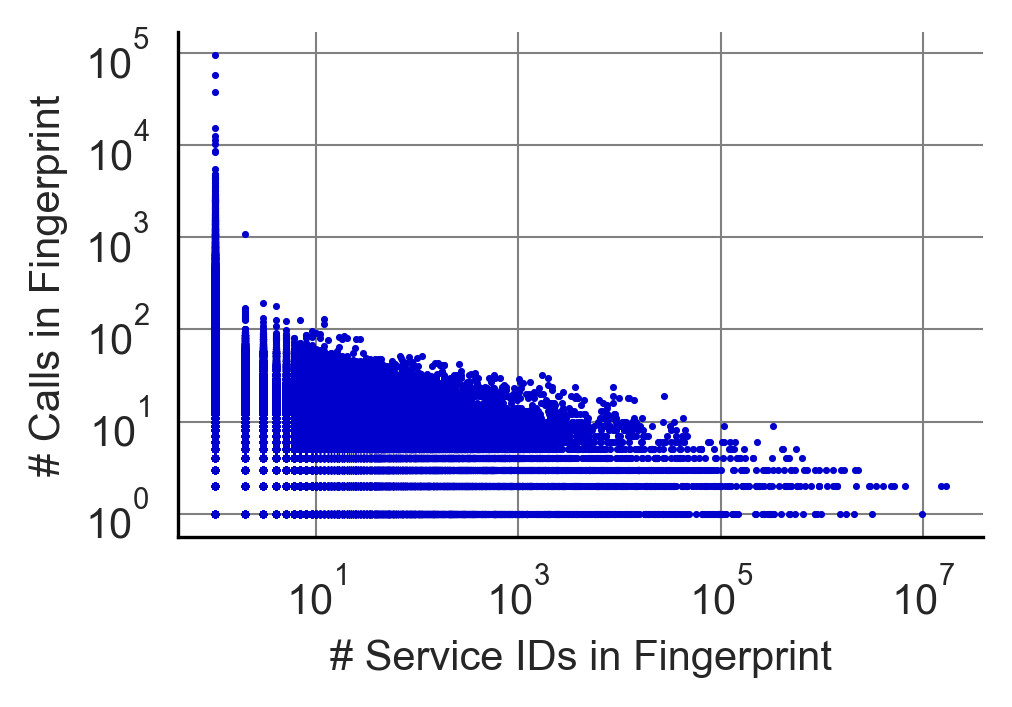
Previously, we observed that for the vast majority of Service IDs there were very few total invocations, and we found that many Service IDs had overlapping call fingerprints. One hypothesis is that many unique Service IDs are given to the same non-user functionality due to intentional management choices. Therefore, based on the assumption that user-facing front-end functionality is likely to involve a richer repertoire of MS calls, we investigated the relationship between the number of overlapping call fingerprints and the number of MS calls within those call fingerprint. Overall, our results revealed an inverse relationship (see Figure 2): the more a call fingerprint was shared among different Service IDs, the fewer MS calls were associated with it. Notably, the most common call fingerprint, accounting for 10% of all Service ID call fingerprints, comprised only two calls between three known MS.
Sporadic Service IDs are associated with non-unique MSs call fingerprints with a low number of calls.
Above, we found that a large number of Service IDs have call fingerprints that are identical to other Service IDs, and these call fingerprints often involved very few MS calls. To understand if these same Service IDs are generally responsible for the large number of Service IDs with very low total invocations we investigated the median number of invocations of Service IDs associated with each call fingerprint from a random 10,000 sample of all call fingerprints. Again, we found an inverse relationship (see Figure 3): the more a call fingerprint was shared among different Service IDs, the fewer invocations each Service ID had within that call fingerprint. Combined with our previous findings, this suggests that a major contributor to Service ID inflation is simple, and therefore non-user facing, sporadic activity that appears under different Service IDs despite likely representing the same front-end service functionality. This functionality likely corresponds to a form of management or probing activity that is repeatedly assigned a new Service ID across the 14 days.
Based on our findings, we conclude that our call fingerprints, which reduce the number of front-end functionalities from 166 to 1.2 million, better represent the true repertoire of front-end functionality provided by the deployment. Therefore, in what follows, we use Service ID groupings based on these call fingerprints rather than raw Service ID values.
III-C Workload
The total number of front-end requests and MS calls is measured in billions: Overall there were 97 billion calls made between microservices across the 14 days of operation, associated with 15 billion front-end service invocations. The total number of calls made between MSs is an order of magnitude higher than the total number of user requests, reflecting the recruitment for multiple MSs to provide front-end functionality.
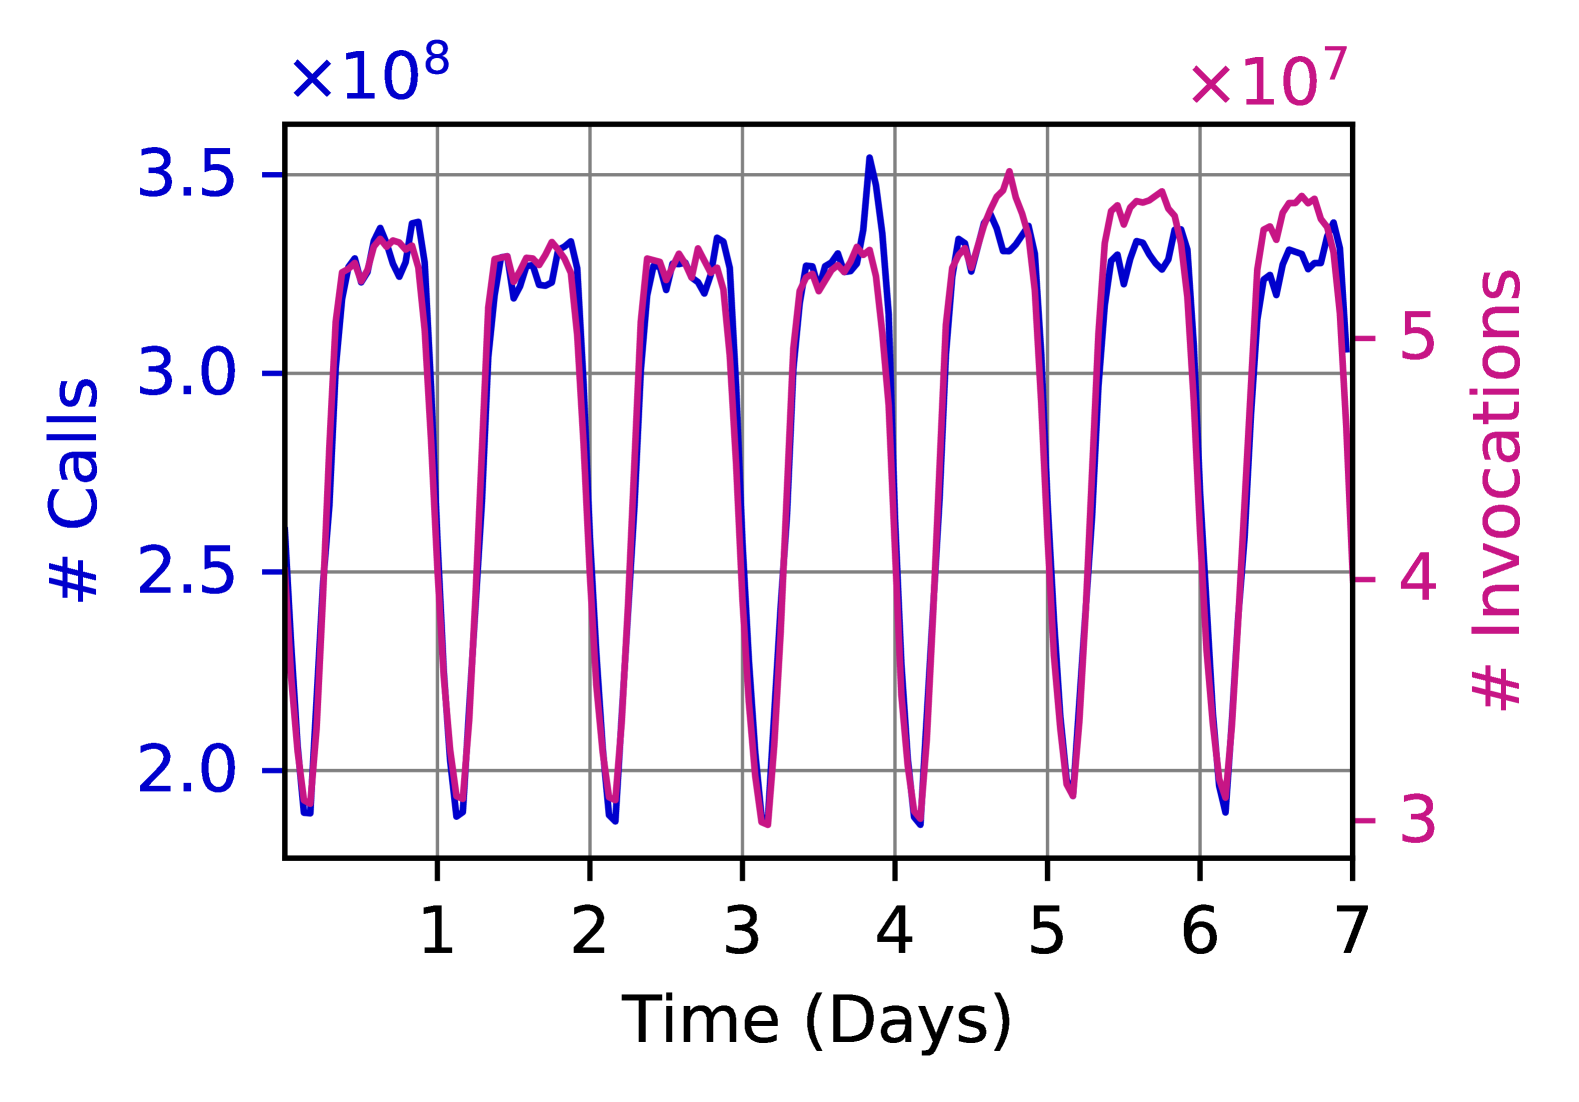
Workload significantly fluctuates across each day: The number of calls and invocations fluctuated significantly across the 14 days, with a strong 24-hour periodicity. The average daily trough-to-peak increase was 80% for MS calls and 79% for front-end invocations. The considerable difference between lowest and highest total daily workload highlights the importance of predictive scaling, with MSAs that do not incorporate scaling, or do so inaccurately, potentially wasting a large amount of resources during periods of low usage. Conversely, due to the sharp increases in demand throughout the day, inaccurate predictive scaling of MSs could significantly impact user experience.
III-D Microservice Dependency Topology
Microservices are sparsely interconnected: We constructed the microservice dependency network from all calls made between microservices across the 14 days of operation. In this network, a directed edge between node A and B indicates that at least one call was made between MS A and MS B during the 14 days. Overall we found 543,948 edges between MS, which is significantly lower than the theoretical maximum of a fully connected network of the same size (4.2 Billion). The edge density of the dependency topology is also considerably sparser than that reported by Meta (0.0001 vs 0.001). The 10-fold higher density of edges found at Meta may be a by-product of the MS granularity conjectured in Section III-A. If MSs at Meta encapsulate broader functionality, each MS may have more interactions with other MSs to fulfil this functionality, which would result in a topology with fewer MSs but higher dependency density.
III-E Scale Implications
The number of front-end services functionalities and back-end MSs within a large-scale MSA can be extremely large:
The number of MSs in the dataset is several orders of magnitude larger than the popular testbeds used for research [26, 27, 28, 29]. This substantial disparity in scale likely contributes to the limited focus on scalability in current state-of-the-art approaches for MS anomaly detection and localisation. For example, one set of popular approaches construct causal graphs to capture the relationships between MS metrics during a fault [30, 31, 32, 33, 34, 35, 36, 37, 38, 39]. However, the causal structural modelling methods used by these approaches such as the PC algorithm and LiNGAM, have poor time complexity as the number of variables increases [40, 41, 42, 43]. Another approach is to train models in a supervised manner, either through the injection of faults to produce a diverse labelled corpus of fault data or through historical root cause information [44, 45, 46]. However, with such a large number of MSs and diverse set of front-end functionality they support, the feasibility of collecting enough labelled data to adequately cover the huge combination of failure conditions is unclear even when leveraging mitigation techniques such as Positive-Unlabelled (PU) learning [47, 48].
One strategy for reducing the challenges associated with characterising the normal behaviour of a diverse MSA is to model the normal behaviour of individual MSs or the collection of MSs associated with individual front-end services [49, 50]. However, in this dataset, we identified 8,000 front-end services, such that training and maintaining a model for each individual front-end service may be costly. Furthermore, we identified a potential 1.2 million distinct front-end functionalities associated with these front-end services. As each front-end functionality is likely associated with its own usage patterns and call graphs, this brings into question whether simply building a model for each front-end service substantially reduces the problem of scale and diversity. On the other hand, building individual models for all 1.2 million front-end functionalities is unlikely to be feasible outside of very light-weight approaches [51].
IV Heterogeneity
MSAs are lauded for their flexibility and scalability [52, 53], achieved through the independent development and deployment of loosely coupled microservices. Yet, this independence naturally leads to a diverse and complex ecosystem, where heterogeneity is evident at multiple levels. In practice, MS heterogeneity manifests in many dimensions, from the distribution of instances across hosts and the co-location of multiple MSs in shared hardware, to distribution of workloads and the intricate web of dependencies that link them together. Furthermore, microservices can be variably integrated to provide diverse front-end service functionality, generating further avenues for heterogeneity. In this section, we explore how these facets of heterogeneity manifest in this dataset.
IV-A Microservice Instances
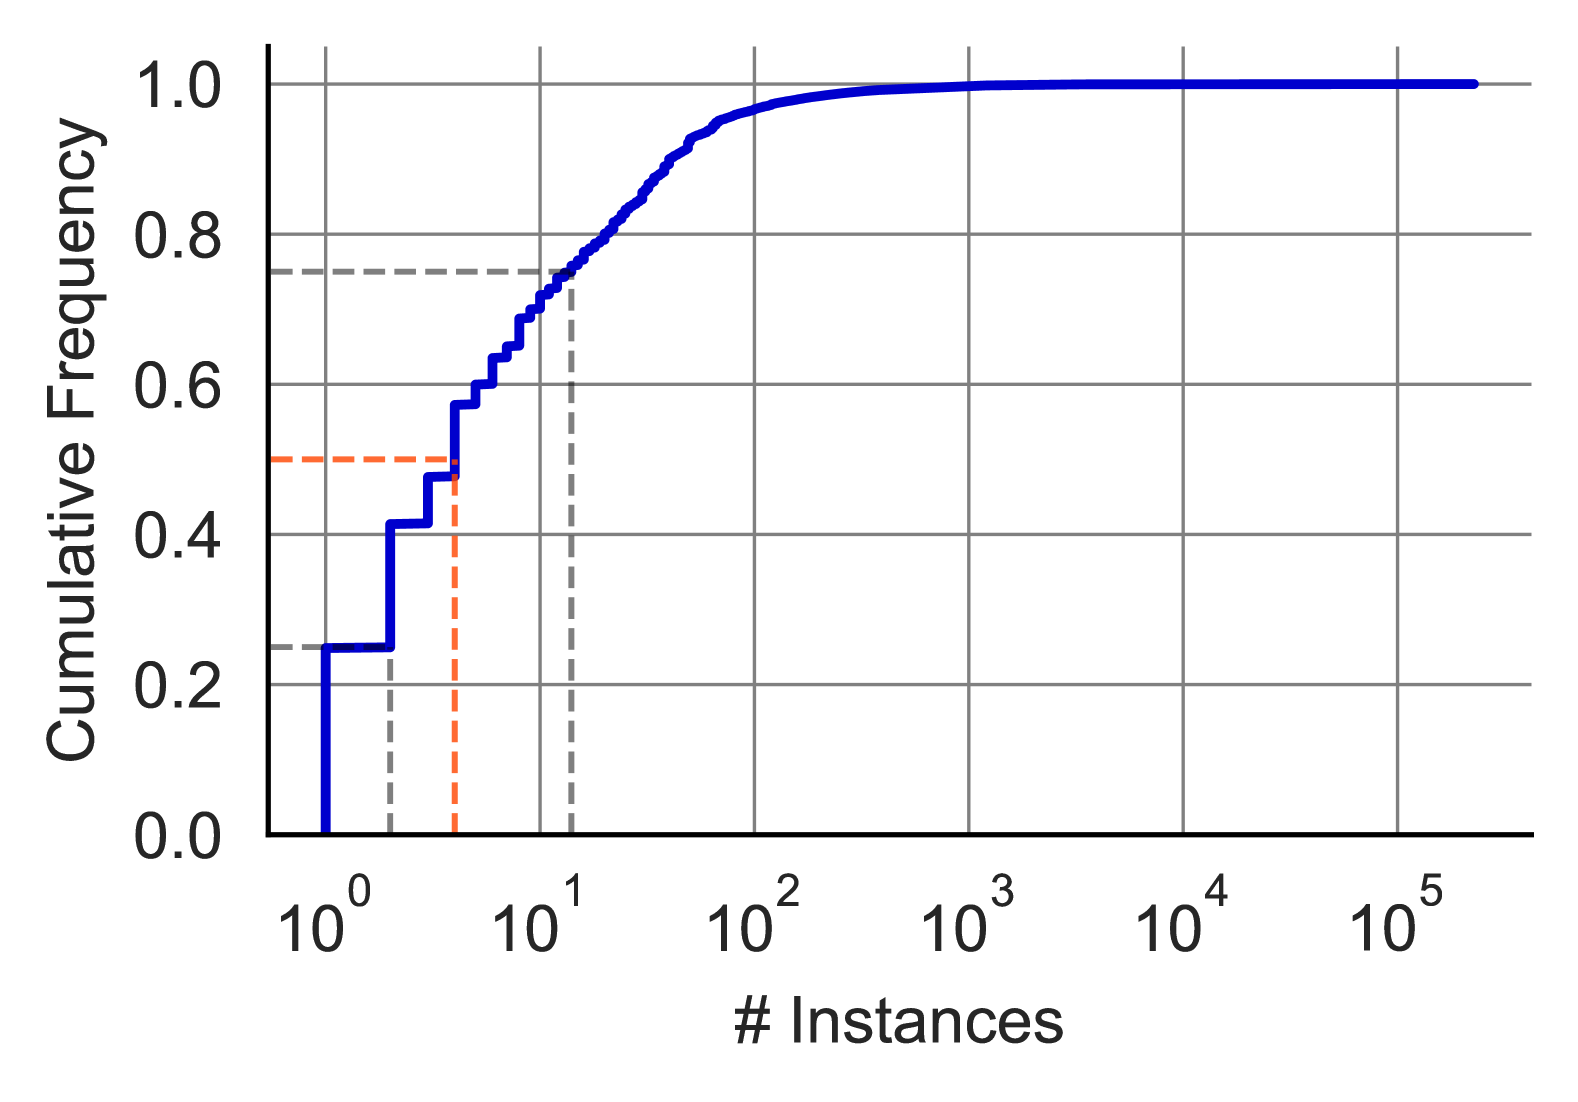
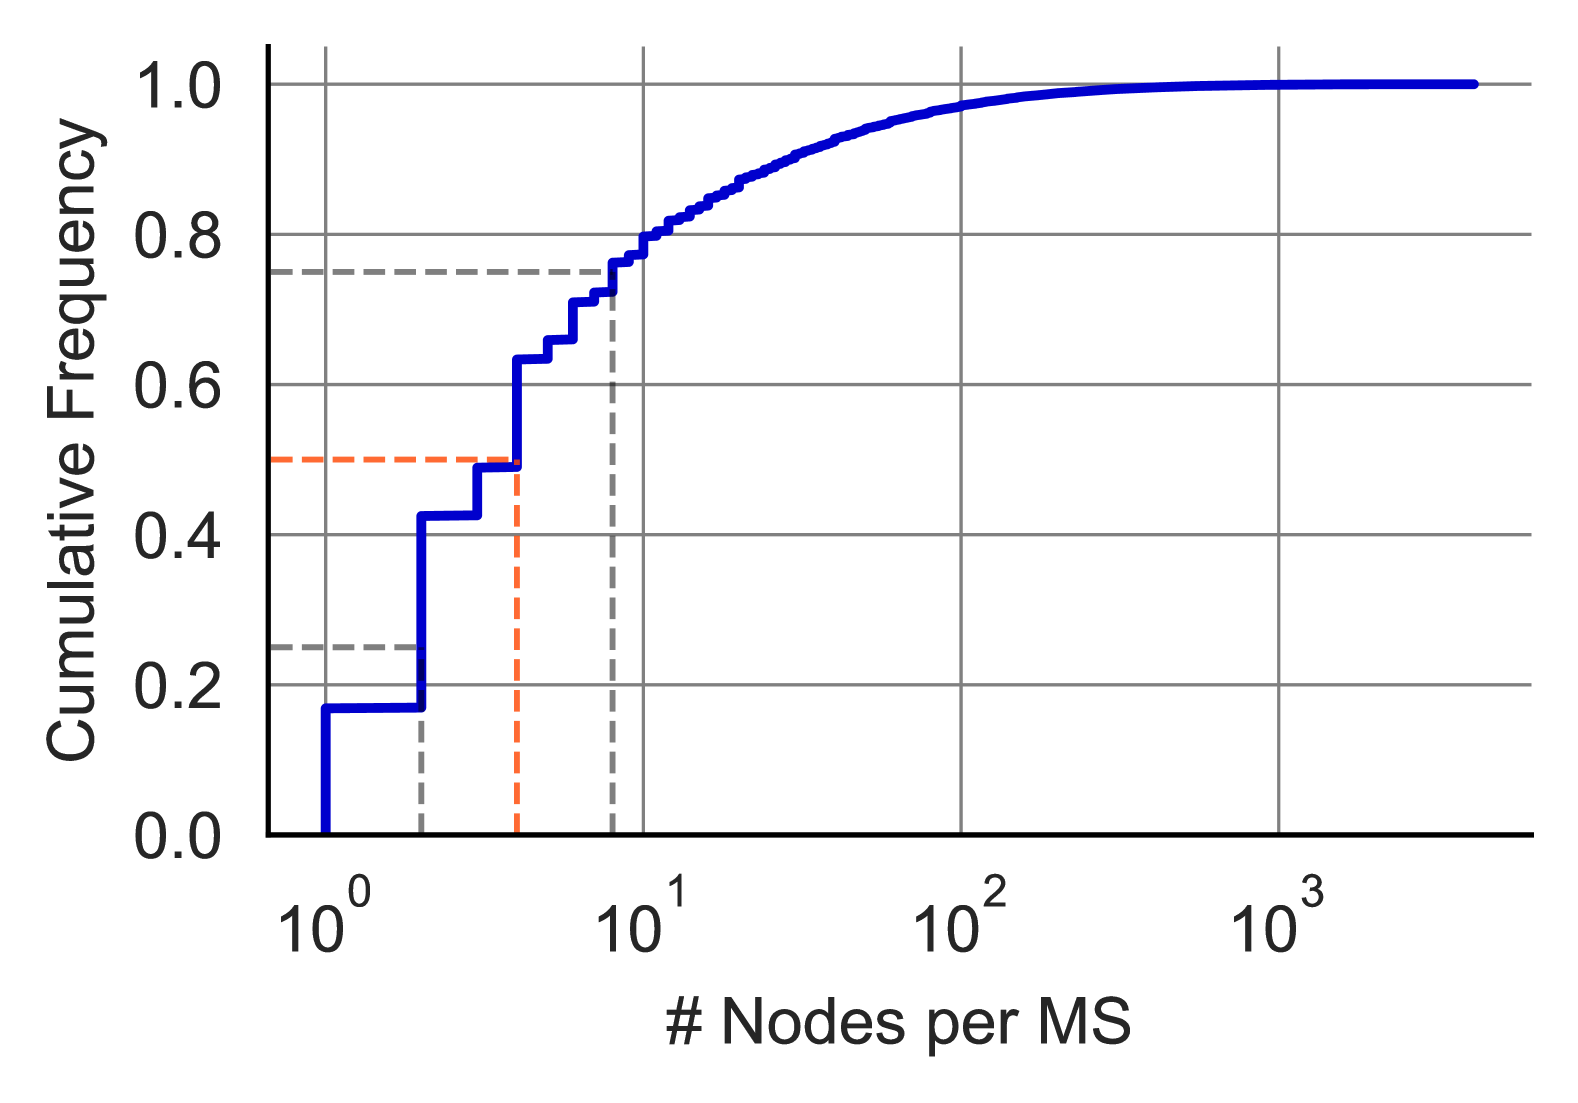
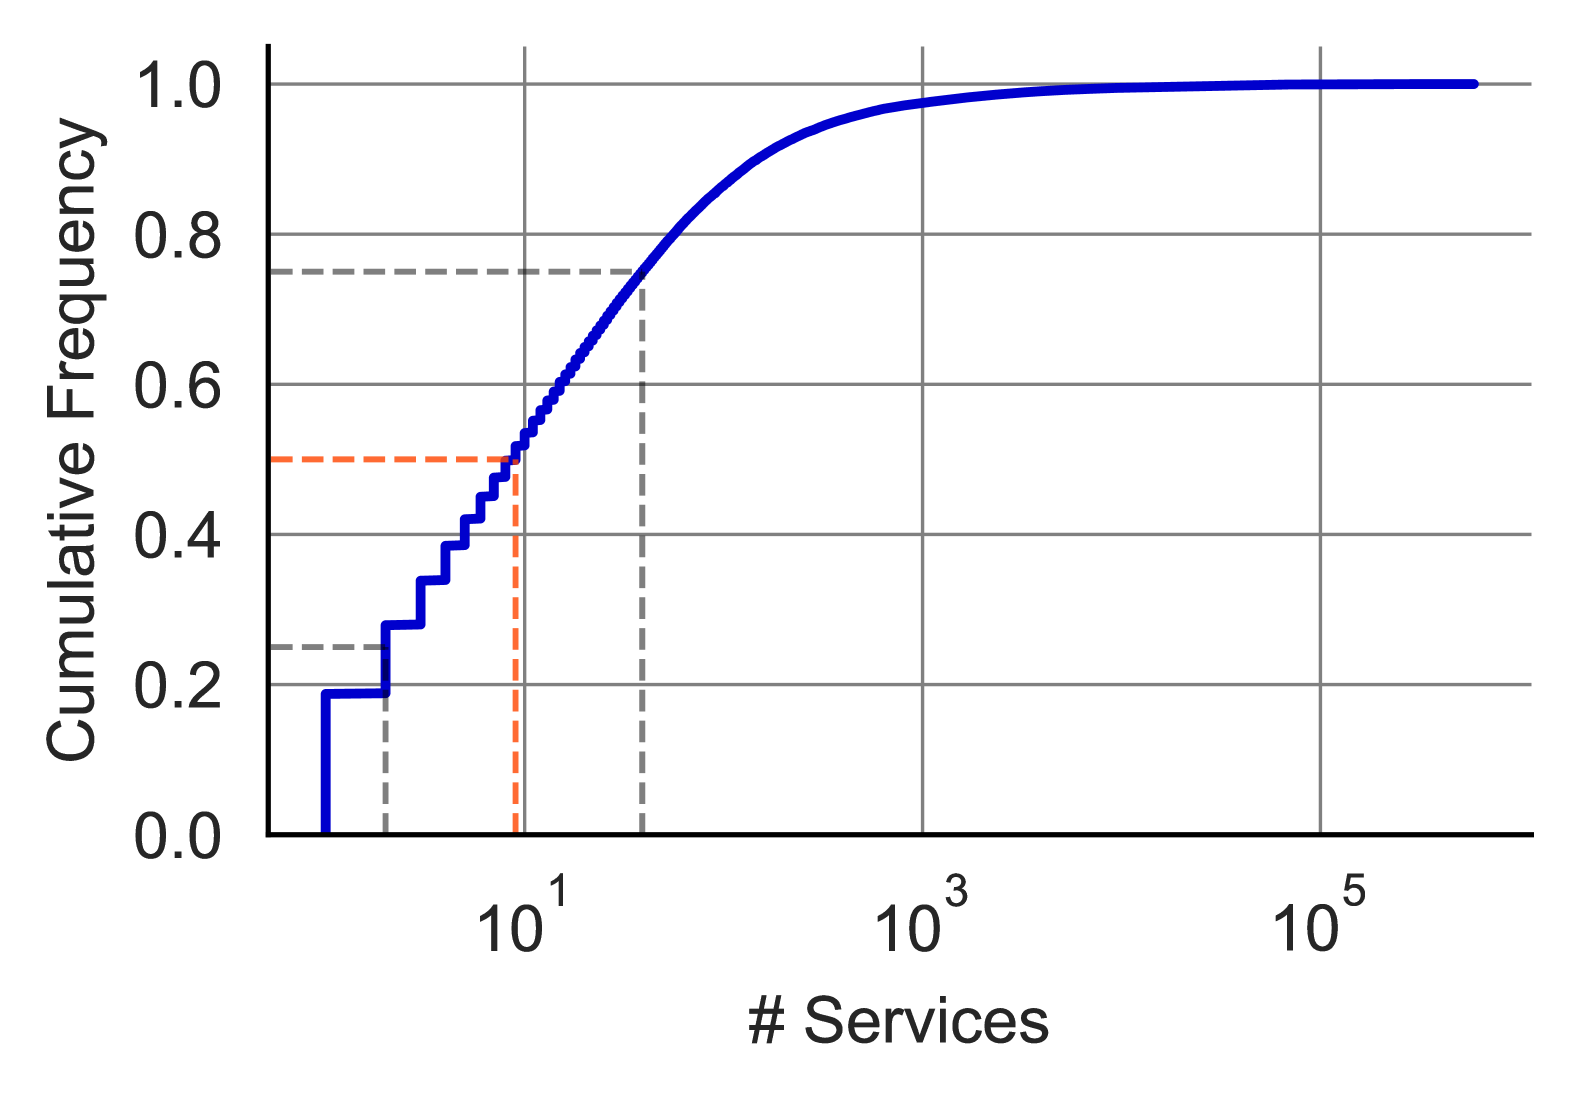
The number of deployed instances per MS is highly imbalanced: We collected all unique MS instance IDs associated with each MS in all calls within the data set. The results revealed that the distribution of the number of instances deployed per MS is heavy tailed, as shown in Figure5. We found that a large number of MSs (24.8%) were deployed only as a single instance; the median number of deployed instances per MS was 4. On the other hand, the highest number of instances per MS was over 227,000, making up for 12.7% of all deployed MS instances across the 14 days. Furthermore, the top 1% of MSs accounted for around 895,000 instances, making up half (50.1%) of all deployed MS instuiances. Since we aggregated the number of deployed instances across the full dataset, the number of instances can either mean that a MS is generally deployed with a large number of instances or that a MS is regularly horizontally scaled up and down, resulting in a substantial fluctuation in the number of instances across the dataset. We explore the horizontal scaling behaviour of microservices in Section V-B.
| Alibaba | Meta | |
|---|---|---|
| Min | 1 | 1 |
| Median | 4 | 34 |
| Average | 28 | 668 |
| P99 | 309 | 9,220 |
| Max | 227,049 | 557,156 |
Microservices at Alibaba and Meta demonstrate similar distributions and maximum instance counts: When comparing the distribution of deployed instances per MS with that of Meta (see Table II), we found that both exhibit a heavy tail, however, the median, average and 99-th percentile values for the Meta data are all an order of magnitude higher. Recalling that Section III-A showed that the total number of instances deployed at Meta is also an order of magnitude higher, this means that the central tendencies for both distributions when normalising by the total number of instances are similar, indicating that the typical MS within both deployments represents a similar fraction of the overall deployed instances. However, notably, we found that the maximum number of instances for a single microservice were remarkably similar (227,000 vs 557,000) despite this order of magnitude difference in the total number of instances. This indicates that the heavy-tail is more pronounced in this dataset, with the maximum instance accounting for 12.4% of the total number of instances compared to Meta’s 4.6%. The convergence of the maximum values despite the difference in the total number of instances might suggest that, regardless of scale, there are common operational ceilings when it comes to scaling. This ceiling could be a result of coordination overhead, such as managing load balancing between a larger number of instances, or non-linear performance gains due to resource contention for shared resources such as databases, caches, and network bandwidth.
IV-B Nodes and Microservices
MS instances can be deployed across a large number of host machines: One challenge associated with characterising how many hosts a MS is deployed across is that MSs are expected to have ephemeral instances due to horizontal scaling. Therefore, to get an accurate understanding as to the deployment of MS instances across nodes at a single point in time, we analysed the MS instances and their associated nodes within the first minute of resource data. This time period was arbitrarily chosen, but assumed to be representative of the dataset.
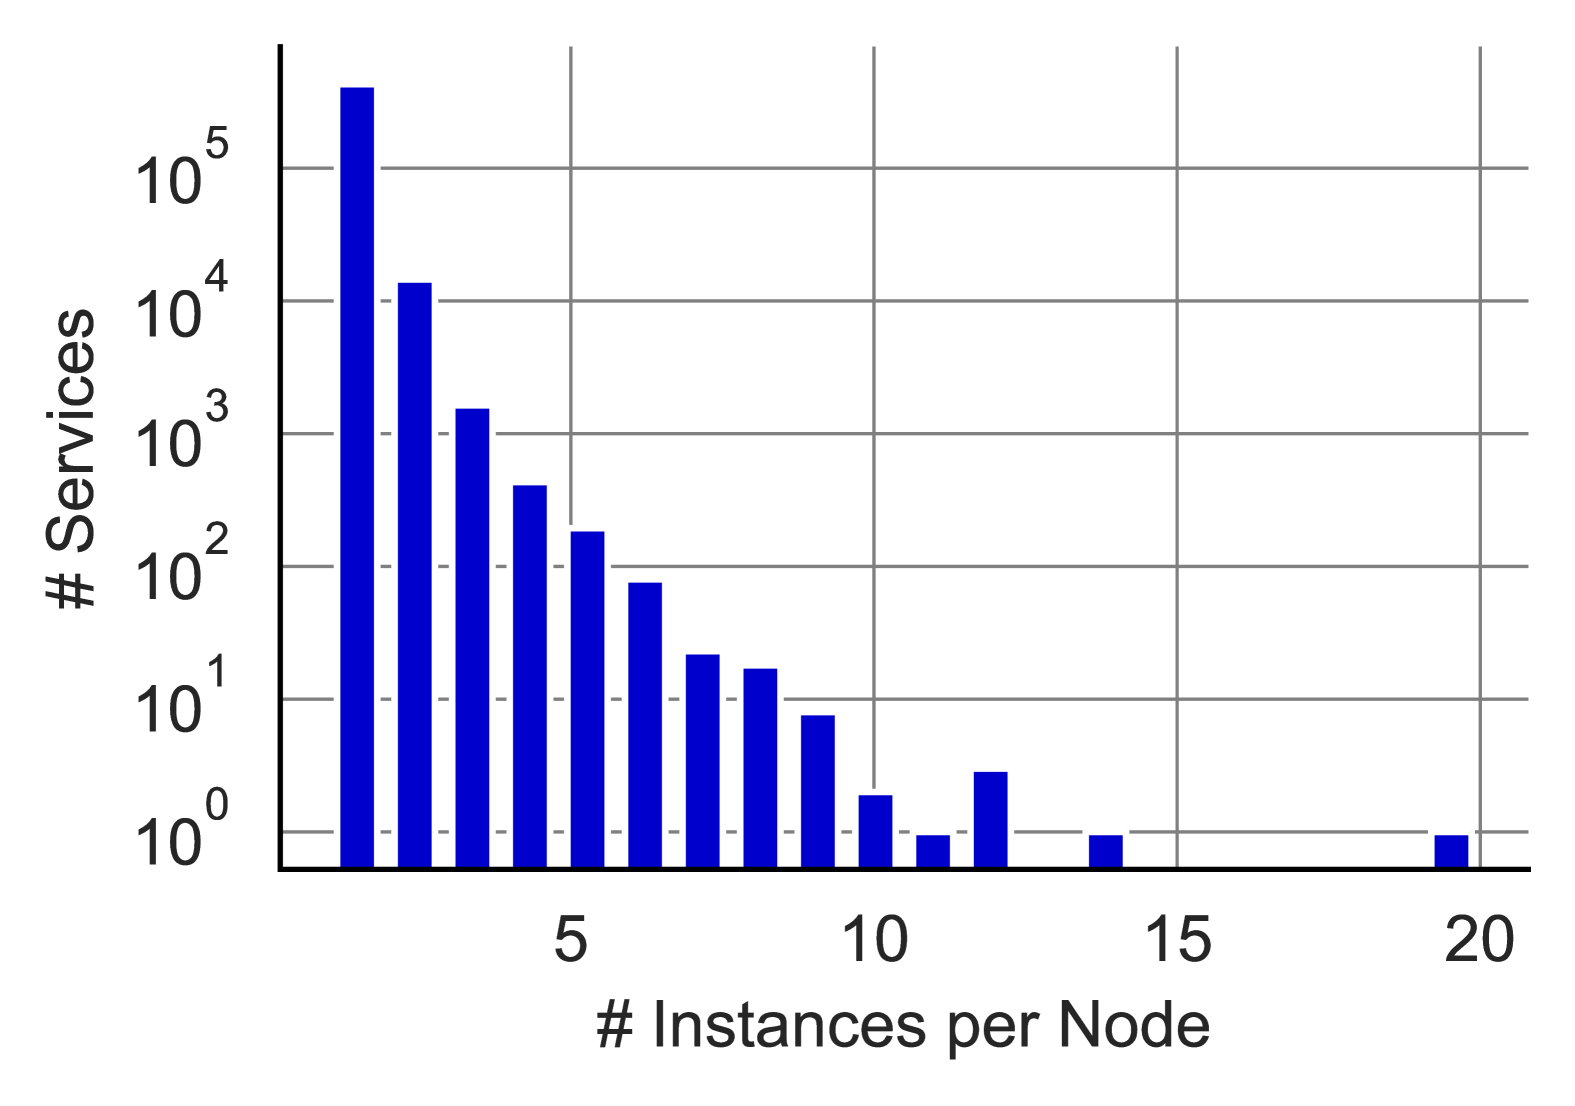
Our analysis revealed that 84% of these MSs were concurrently deployed on more than one node - with the median being 4 nodes and one MS spanning as many as 4,114 nodes, as shown in Figure 6. Moreover, we found that, in most cases, MSs were only deployed once per node, with 96% of MSs having a single instance per node, as shown in Figure 7. These findings suggest a deliberate isolation strategy to minimise single-node dependencies, reducing the impact of node-level faults on system health. However, the existence of a minority of MSs who were deployed many times on a single node suggests some edge-cases. These could be a result of scheduling anomalies or misconfiguration, or indicate a small subset of MSs that may benefit from running on the same physical node such as for shared local resources or reducing communication overhead [54, 55]. Such cases may indicate architectural weak-spots, where a specific microservice is abnormally vulnerable to node-level faults and disruptions.
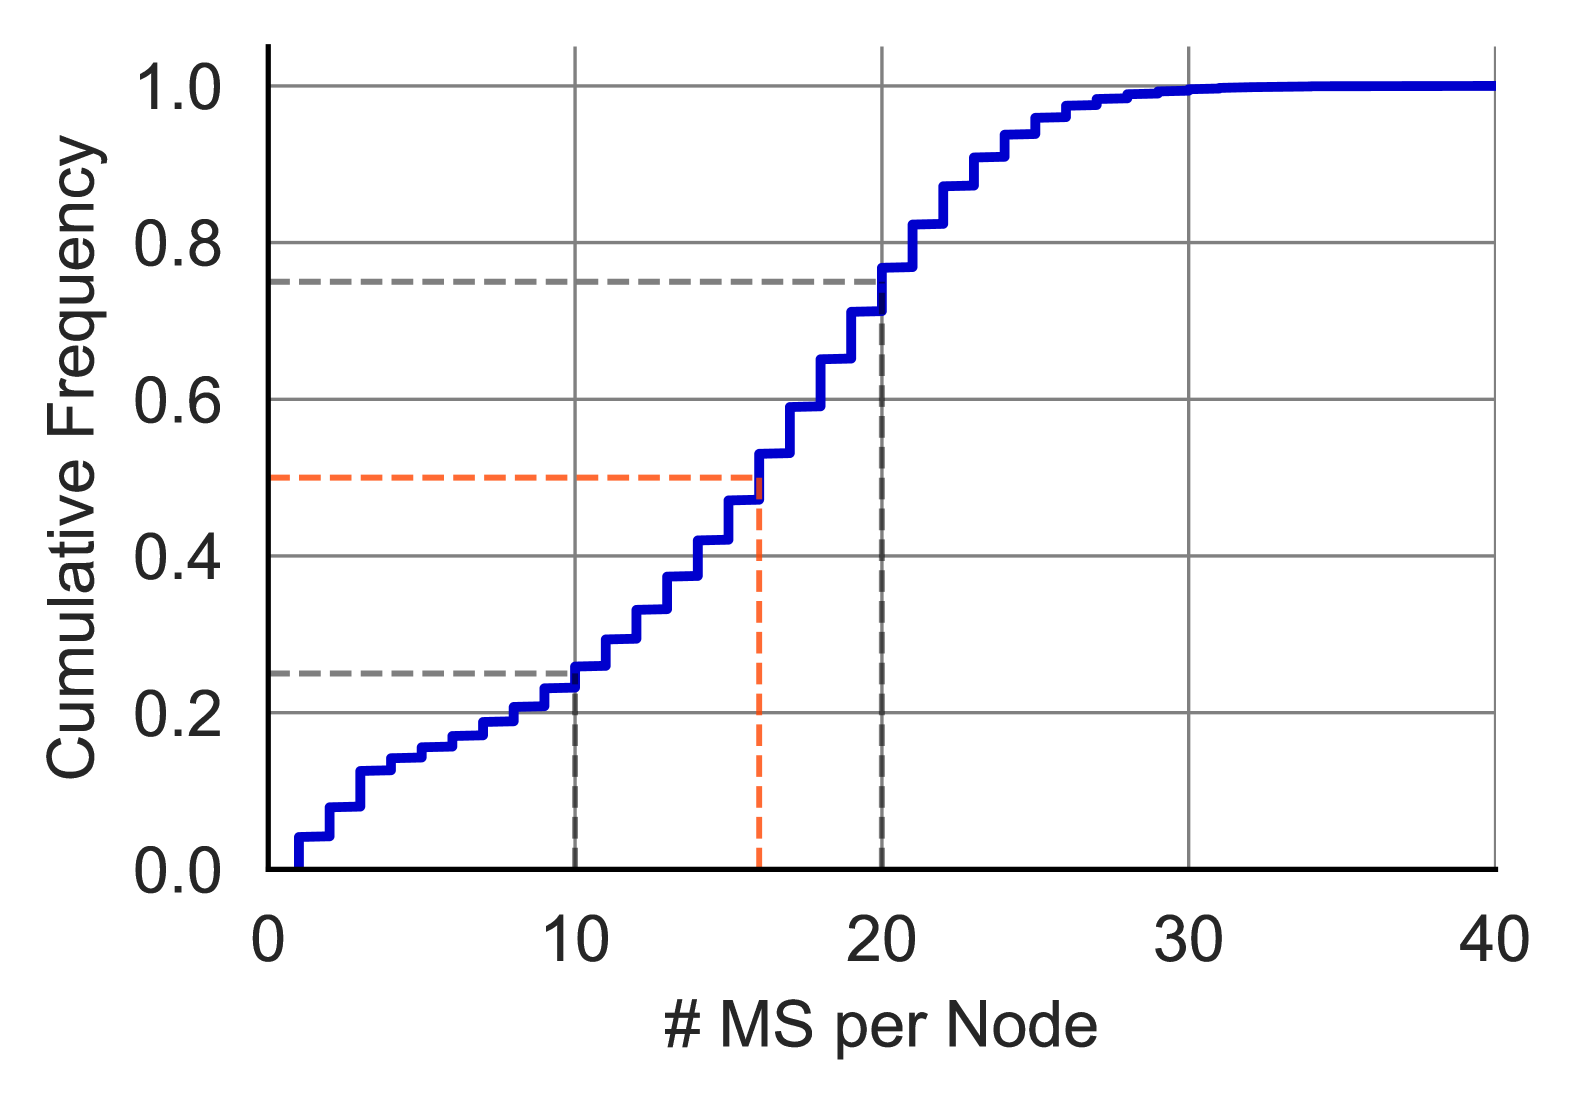
MS instances generally cohabit with a large number of other MS: We found that nodes hosted between 1 and 38 MS instances, on average housing 15 MS instances each, with only 9.1% of nodes hosting a single MS instance (see Figure 6). This demonstrates a high degree of co-location of MSs within the same host machines. Overall, this horizontal distribution of MSs is likely a result of both optimising load balancing and system resilience, ensuring nodes are neither under- nor over-utilised while mitigating the impact of single node-level failures.
IV-C Microservice Workload
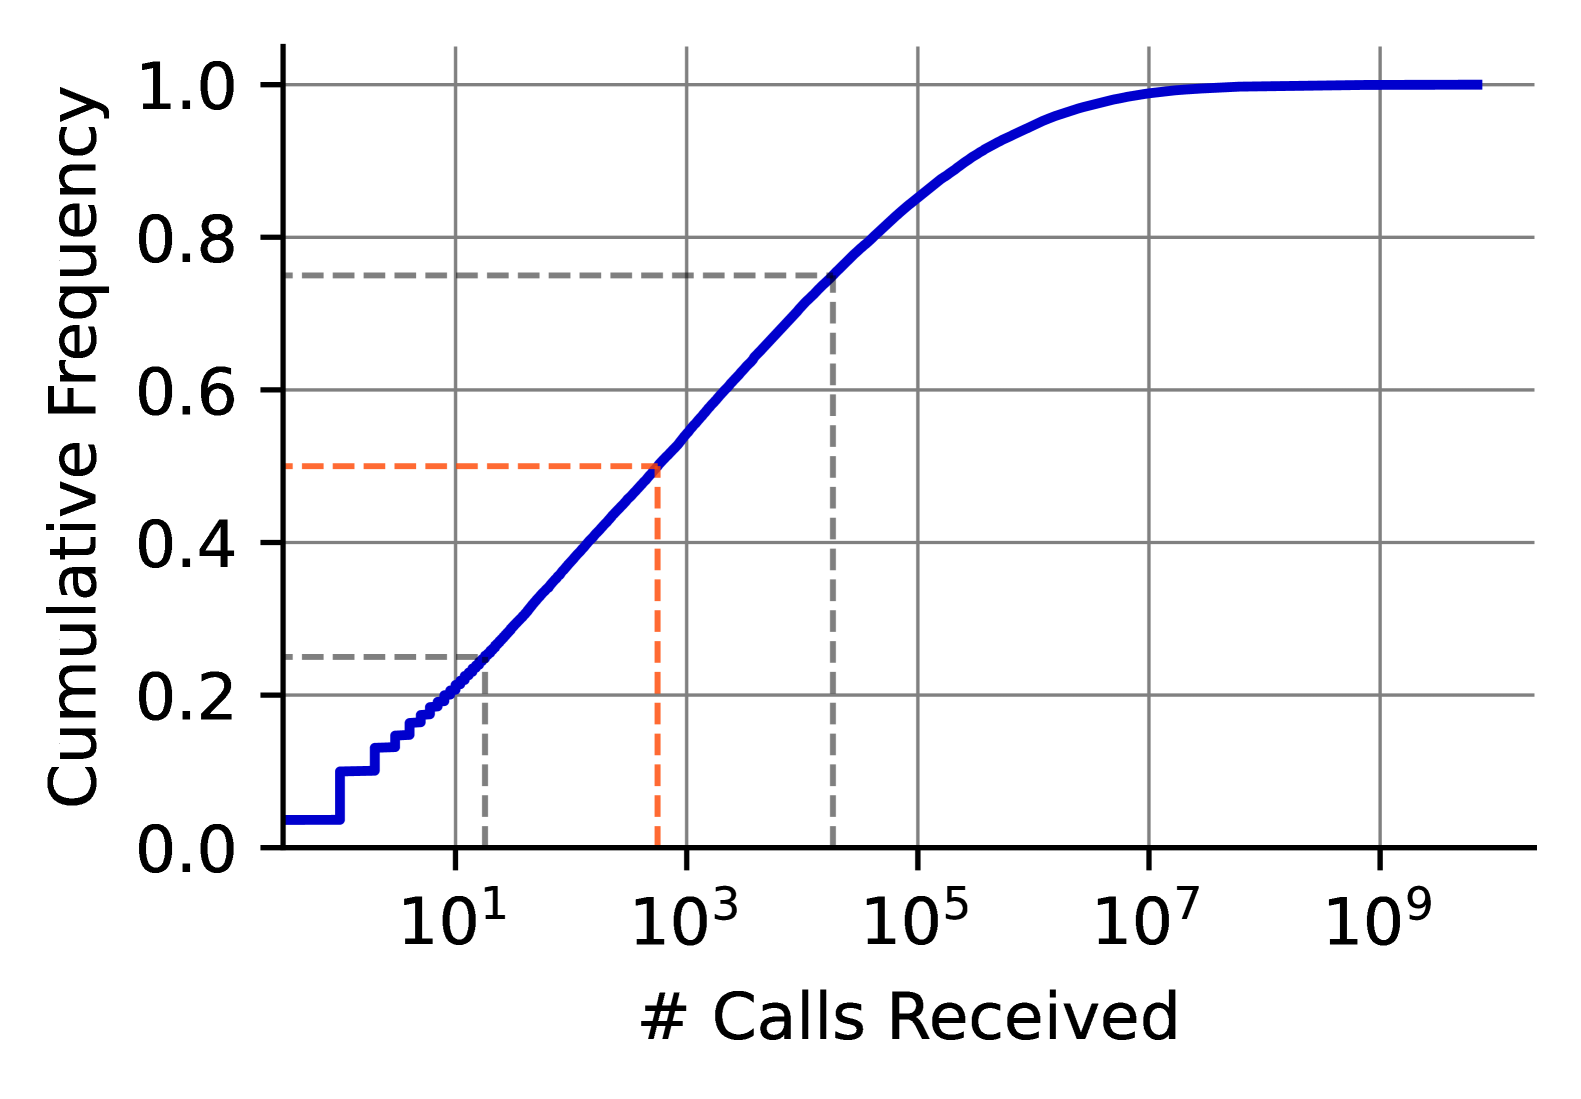
The distribution of workload across MSs is extremely uneven: In a MSA, MSs receive requests from many different upstream sources; the accumulation of these requests over a time period can be defined as their workload [7]. To investigate how this total workload was distributed throughout the dataset, we aggregated the total calls received by each MS over the full 14-day period.
Our analysis revealed a vast variation in workload across MSs - receiving from a single call to as many as 6.9 billion calls - 7.1% of all calls made over the two weeks (See Figure 9. The cumulative workload distribution was heavy-tailed: 21% of MSs received fewer than 10 calls, whereas the top 1% accounted for 87% of all calls. These results are in line with previous research reporting heavy-tailed MS workloads [7], finding that the top 10% of MS were responsible for 75.2% of CPU usage.
IV-D Microservice Dependencies
| Alibaba | Meta | |||
| In-Degree | Out-Degree | In-Degree | Out-Degree | |
| Min | 1 | 1 | 1 | 1 |
| Median | 2 | 4 | 4 | 4 |
| Average | 8.2 | 12.2 | 14 | 12 |
| P99 | 89 | 110 | 86 | 101 |
| Max | 13,030 | 2,245 | 14,084 | 5,865 |
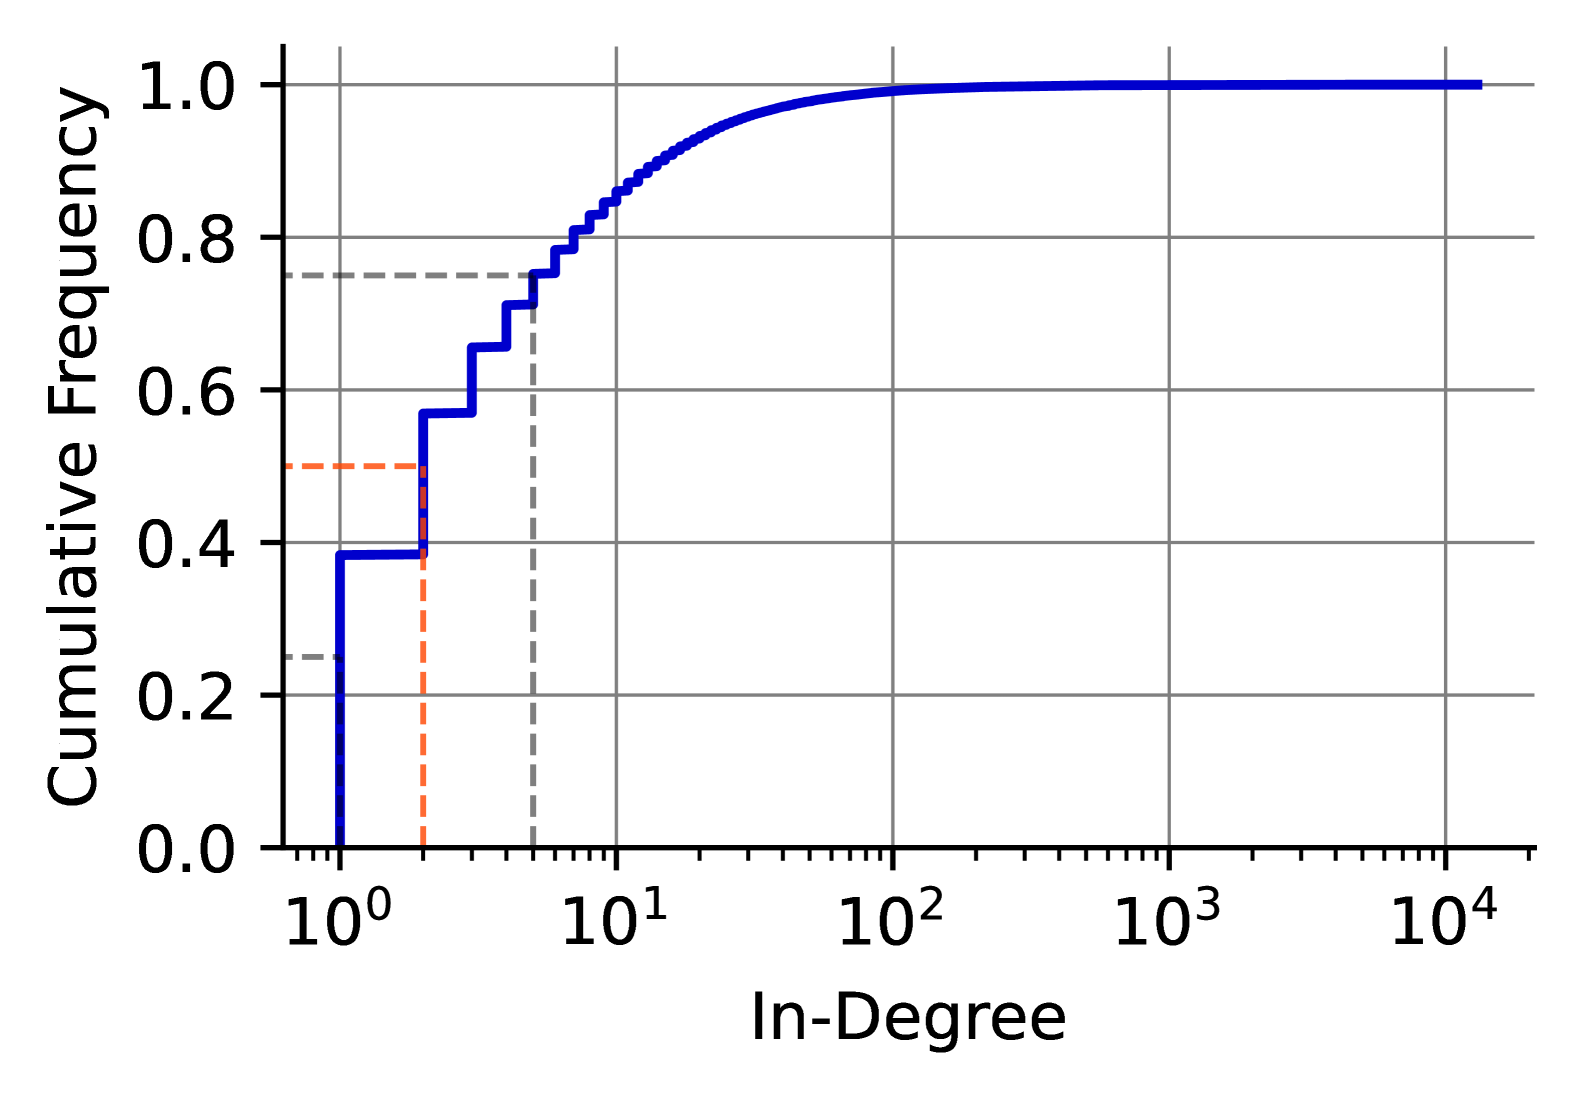
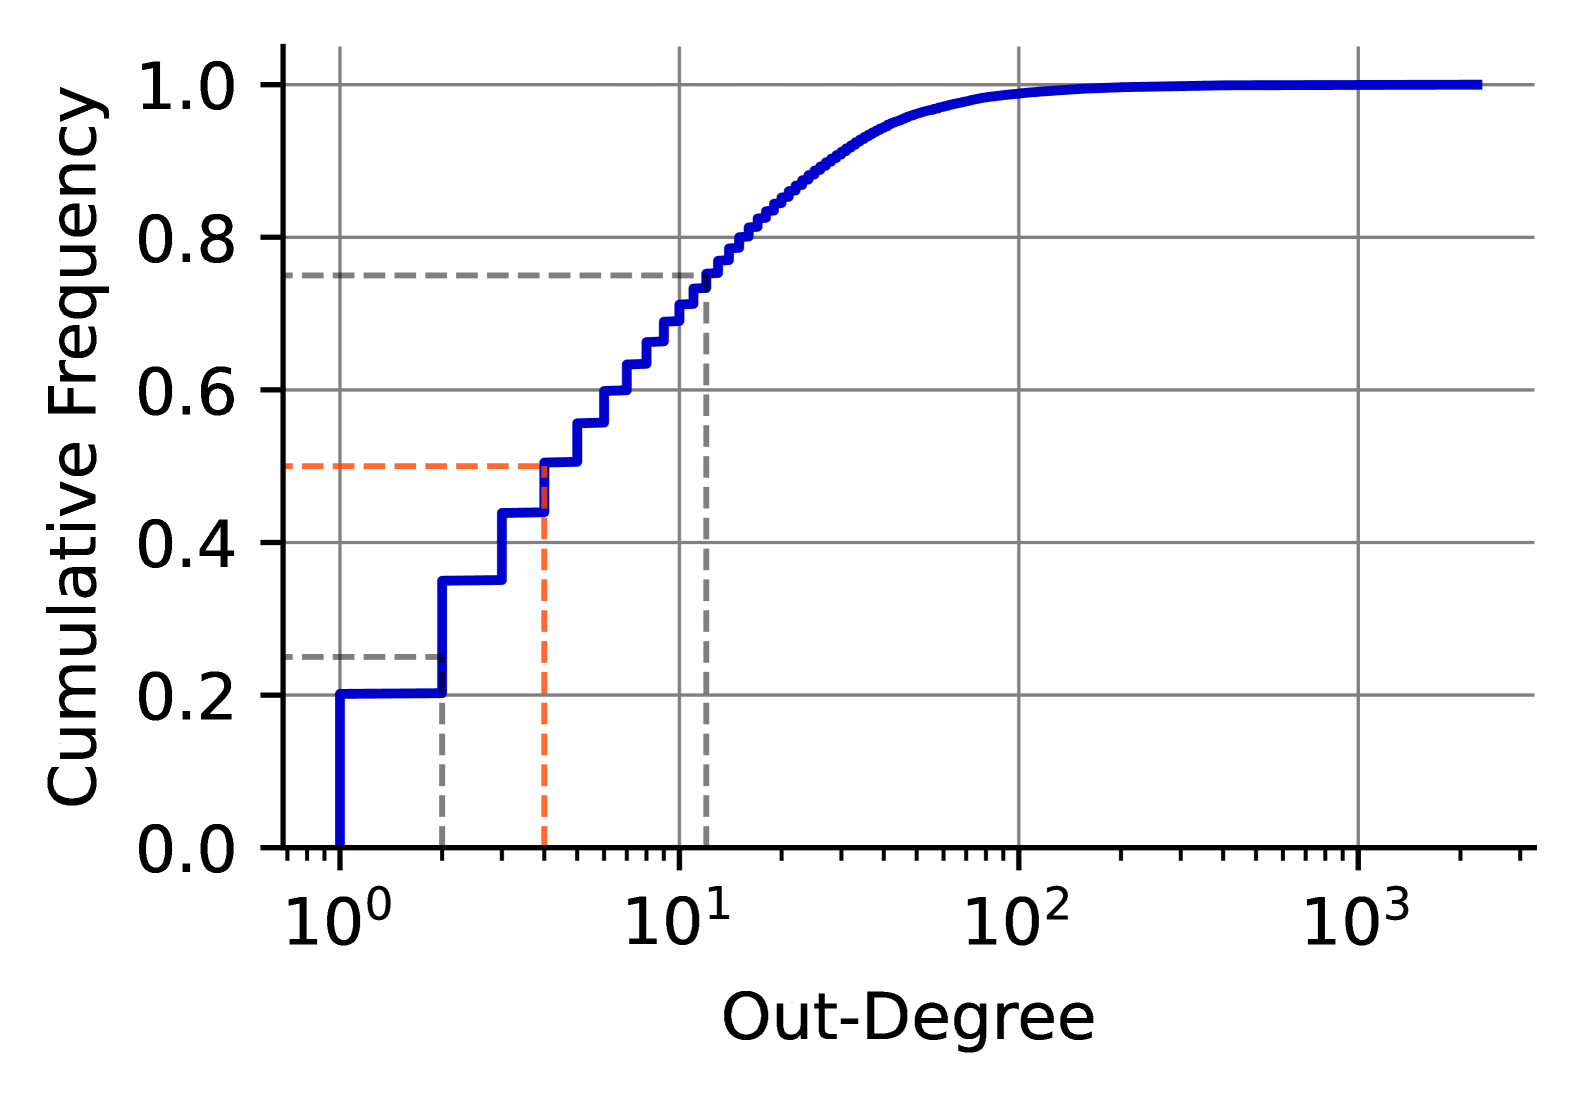
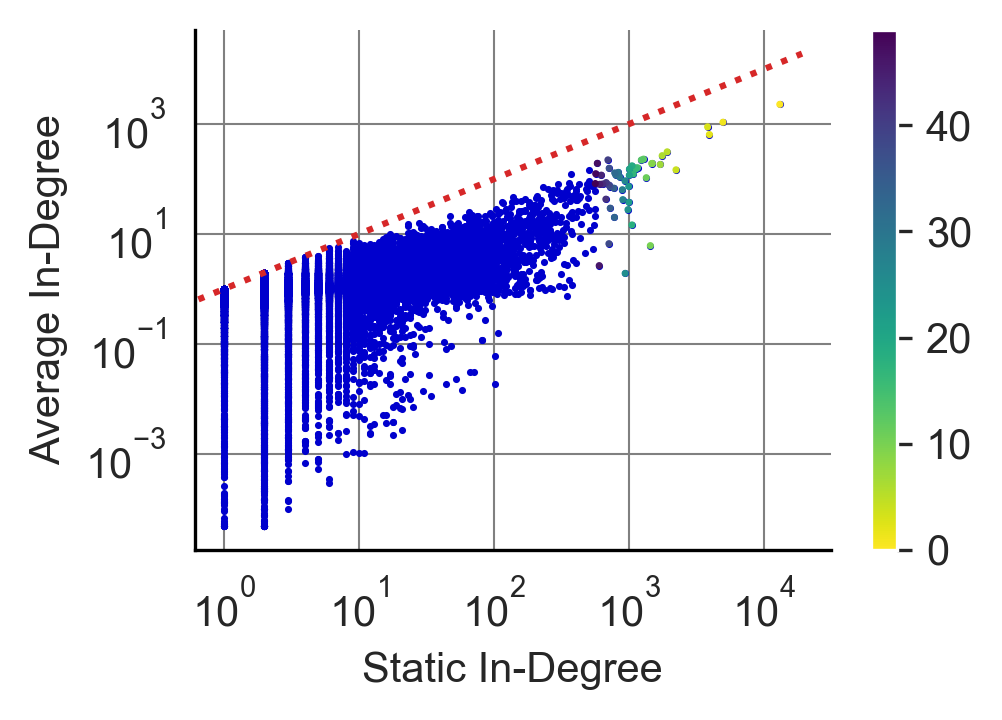
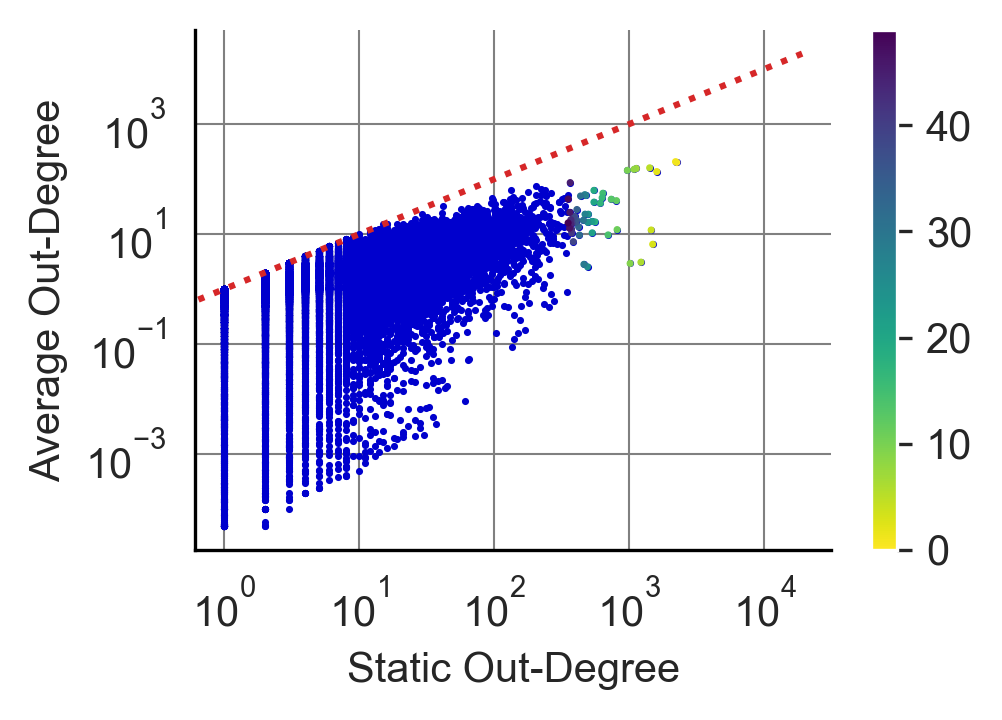
In Section III-D, we explored the global dependency structure using metrics such as edge counts, density, and clustering coefficients. An important complementary perspective comes from analysing the local structure, such as MS in-degree and out-degree, which has been explored by previous quantitative explorations [11, 13]. Here, the in-degree of a MS indicates how many other MSs call it, while the out-degree reflects how many other MSs it calls. Although previous work has used these metrics to indicate bottleneck anti-patterns [8], we contend that they more aptly capture the importance of a MS within the architecture. A high in-degree signals a critical hub that many MSs rely on and is shared across a large amount of front-end functionality, and a high out-degree suggests a highly composite MS that aggregates the functionality of many downstream MSs. Mismanaging or failing to scale these pivotal MSs could disproportionately affect overall system stability.
A small number of MSs have a disproportionately large number of dependencies: Using the aggregate dependency network constructed in Section III-D, we found that both in-degree and out-degree distributions exhibited a heavy tail. For example, 38.5% of MSs have an in-degree of only 1, with a median of 2, yet the maximum in-degree reaches 13,030 – with one MS called by 19.2% of all other MSs. In contrast, while only 20.2% of MSs have an out-degree of 1 the median out-degree is slightly higher at 4. However, the maximum out-degree is slightly lower than maximum in-degree at 2,245 - meaning that 3.31% of all MSs are called by this MS. Despite the higher maximum value for in-degree, the distributions indicate that generally most MSs call more peers than they are called by. This conclusion is in contrast to that of Meta [13] but is supported by previous research at Alibaba [11]. Our finding that both in- and out-degrees display a heavy-tailed distribution suggests a small set of hubs that are central to system functionality; these architectural hot-spots have also been identified in previous research [11]. This observation aligns with the idea that common core MSs, that are shared between applications or business domains such as authentication, logging, or data access, tend to emerge as highly depended-upon nodes [53].
As these hubs are involved with a large amount of MSA-wide functionality, they present unique challenges for management and scaling, with disruptions to their functionality likely affecting system-wide health. Therefore, as discussed earlier, high-accuracy scaling and fault management for such MSs are expected to play a key role in meeting service-level agreements and maintaining system health.
Alibaba and Meta’s local dependency topology structure is similar: In Section III-D we noted that this dataset’s global dependency structure was considerably sparser than that of Meta’s. Yet, we found the local degree distributions to be strikingly similar, as shown in Table III. Greater sparsity, as found in Section III-D, in conjunction with a larger number of MSs and a local structure resembling Meta’s, suggests that new MSs are incorporated by establishing dependencies with only a limited subset of peers, thereby avoiding the theoretical quadratic increase in dependencies. This observation, coupled with the similarity in local dependency structures, that likely arise from different organisational structures, technology stacks, and scales at Alibaba and Meta, suggests a convergence in the design of their MSAs. Such convergence likely arises due to universal constraints, such as performance, reliability, and maintainability, that drive MSA design toward bounded complexity.
IV-E Instances, Workload, and Dependencies
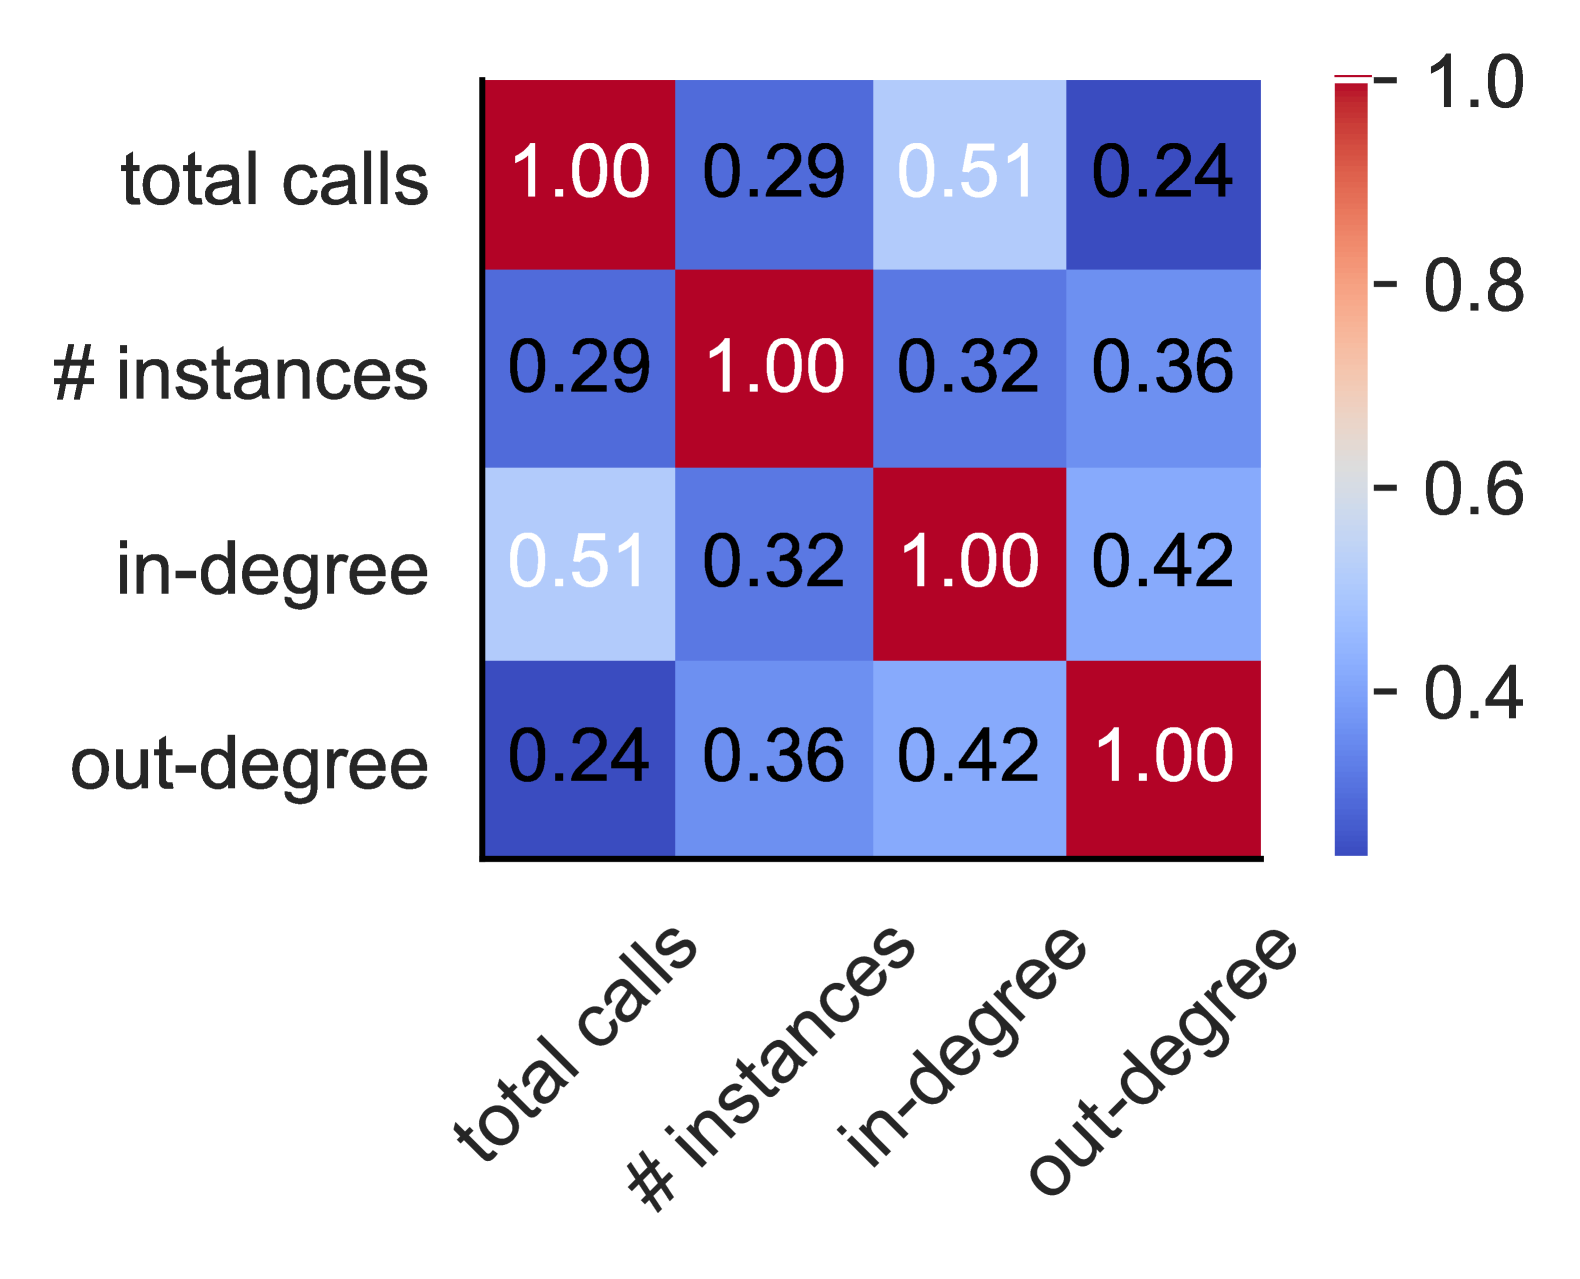
There is only a weak relationship between the number of instances, work load, and number of dependencies of MS: So far we demonstrated that instances, workload, and dependencies all display a heavy-tailed distribution, with a small number of MSs in all cases representing the majority. Therefore, we explored whether these variables are correlated with each other using Kendall’s Tau. Overall, the resultant correlation matrix shown in Figure 12 reveals a weak relationship between all four variables. The highest correlation is found between total calls received and in-degree, suggesting that to some extent MSs that receive a wider array of different calls from more MSs also receive more calls overall; this provides some supporting evidence for the hub-like properties of some of these MSs discussed in Section IV-D. Interestingly, we found a weak relationship between total calls received and the number of instances deployed for a specific MS. This implies that total workload is not necessarily a good sole predictor of total number instances, suggesting that other factors such as variability of workload, CPU requirements of functionality, and MS-specific scaling rules, must play a significant role in shaping the number of instances deployed, rather than being solely a product of high demand.
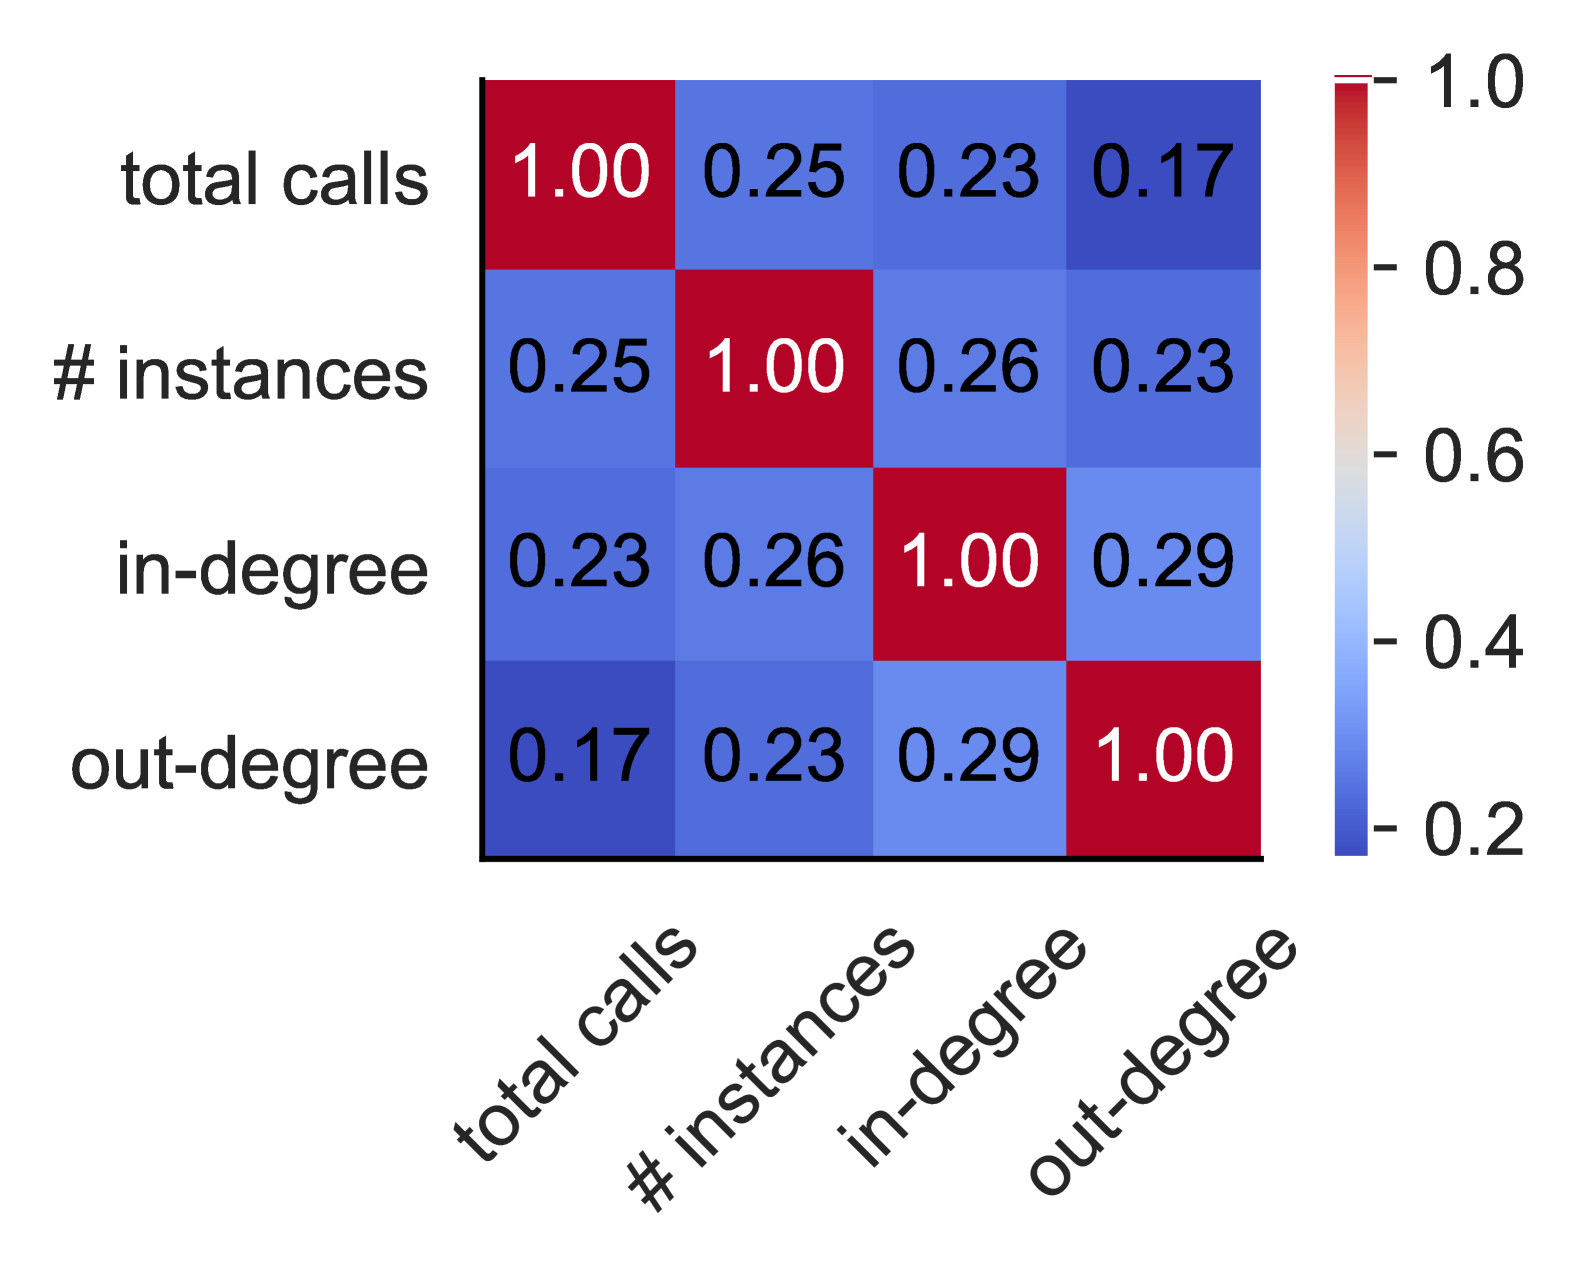
The top 1% of MS with the most workload, instances, and number of dependencies are generally different: As we found heavy-tailed distributions for all of the above variables, it is possible that relationships only exist within certain parts of the distribution. Therefore, we narrowed our investigation to the top 1% of MSs for each category, to specifically understand whether these were generally the same outlier MSs. We calculated the Jaccard similarity between the set of MSs that comprised the top 1% of each category to give us a similarity matrix, shown in Figure 13. Our findings reveal that although there is some overlap between the top 1% of each category, generally there is a low degree of overlap between categories, this lack of overlap being particularly pronounced for out-degree and total received calls. This suggests that generally speaking it is not the same set of MSs that are overrepresented in each category.
IV-F Services and Microservices
Microservices can be shared across many front-end functionalities: Large-scale MSAs support many different front-end applications which can cut across different business domains. As MSs within these architectures are designed for reusability – that is, they provide a specific function which can be utilised by potentially an array of front-end applications –, this can mean that MSs can be multiplexed by varied front-end requests.
To explore this question, we used the Service ID call fingerprints constructed in Section III-B. For each MS within the dataset we searched all call fingerprints and stored the ID of every call fingerprint that included that MS within its associated calls.
Our results, Figure 14, reveal that overall each microservice was involved in a significant number of front-end functionalities, with a median number of 9 and an average of 306. The distribution was heavy-tailed with the maximum number of front-end functionalities fulfilled by a single MS being 590,255, meaning that 49.8% of all identified Service ID call fingerprints involve this MS.
IV-G Call Graph Variability
In real-world MSAs, the calls graphs associated with front-end services are dynamic [11, 7] due to factors such as conditional inputs from users, graceful degradation [53], and incomplete data within in-memory stores [11]. This variability can contribute greatly to the heterogeneity of MS call behaviour observed within a MSA. Previously, research has investigated the number of call graph clusters per front-end service using graph learning [11], however, that work does not fully investigate how different call graphs can be from the same front-end service fulfilling the same functionality. Therefore, we expand on it by directly investigating the unique call graphs associated with Service IDs, representing a specific function of a front-end service.
Given the very large size of the dataset we made several important design choices when reconstructing call graphs to reduce computational requirements. Firstly, we aggregated call graphs on a per-datafile basis, corresponding to 3 minutes of data in total. Secondly, we did not reconstruct the full topological structure of call graphs in accordance with RPC IDs, instead we represented call graphs as de-duplicated lexicographically ordered sets of calls. To quantify the similarity between these call graphs we then used locality-sensitive hashing (LSH) to generate hashes from these sets, which could be used to efficiently estimate the Jaccard similarity between any two pairs of call graph sets.
Whilst our approach greatly reduces the computational requirements of the analysis, there are inconsistencies within the dataset that could impact our results. Firstly, call graphs can be incomplete, either through gaps in call chains or through missing microservice IDs. This means that two call graphs could be determined to be different simply due to missing data in one or both call graphs, rather than due to a true difference in the actual call patterns. Whilst it is difficult to evaluate the prevalence of all missing data, the authors of [56] found that these specific types of missing data are highly prevalent in the dataset, and therefore one might conjecture that they are more a result of systematic instrumentation choices.
Hypothesis: Missing values within the call graph dataset are primarily a result of systematic distributed tracing instrumentation choices leading to missing observability of specific microservices.
To test this hypothesis, we collected all call graphs from the first 12 hours of the dataset, as was done in [56]. We then followed the steps outlined in [56] to restore missing values based on overlapping information within the call graph. For example, a call with a missing value in the upstream microservice can be recovered if the previous call in the call chain does not have a missing value in the downstream microservice (and vice versa for a missing downstream microservice). Next, we compared all 8.2 million call graphs that had at least one restored missing value to the original set of call graphs to see if we could find any matches. The intuition behind this process is that if a restored call graph matches another call graph then that restored call graph can appear without the missing values, and therefore is not a result of systematic instrumentation choices but instead random data loss. Overall, we found that only 10,022 (0.12%) of the restored traces could be matched. As call graphs with missing data generally appear with that same missing data, our call graph set representations would remain unaffected.
When reconstructing call graph sets on a file-by-file basis, we did so based on the assumption that generally the total time taken for all of the calls to occur for a trace was in the order of milliseconds, which would mean that very few traces would be split by overlapping different datafiles. However, when analysing the first 24-hour period we found that a small fraction of traces (0.009%) spanned more than 3 minutes. Whilst a small portion of these overlapping traces could be attributed by traces being split across the two datafiles (29.2%), the majority of these traces (70.3%) could not, and were associated with message queue (MQ) RPC Types. When investigating the total execution time of these MQ traces, calculated as the difference between the root timestamp and the final timestamp in the trace, we found that these MQ traces had an average total execution time of just over 30 minutes, with the maximum total execution time being just under 12 hours. The extreme timescale of these execution times suggest that some message queues employ features that schedule specific calls to be delayed rather than being a result of message queue congestion. Furthermore, in very rare cases (0.5%) we identified Trace IDs that had been used more than once for different call graphs. Overall, we found that, on average, 97% of all overlapping Trace IDs occur within 80 data files. Therefore, to address these inconsistencies in our construction of call graph sets, we first preprocessed the dataset to collect all Trace IDs that spanned more than a single data file with a horizon of 80 files.
Our approach of representing call graphs as de-duplicated and ordered vectors of MS call pairs has a few caveats for the interpretation of results. Firstly, invocation order is not preserved, meaning that two call graphs with the same calls that occur in different orders would be considered identical. However, the invocation order of MSs are not random as they are based on underlying logic, and therefore two call graphs that have identical MS invocations are likely to be very similar in topological structure. Secondly, the number of times a call occurs within a call graph is not considered in our set representation. This means that two identical call graphs may actually be different due to any number of permutations of repeated calls. Overall, this means that the results provided may somewhat underestimate the true variability.
The number of unique call graphs is measured in millions and front-end functionality can be associated with a large number of different call graphs: Based on this analysis, we identified 79,737,924 unique call graph sets. However, the median number of unique call graph sets per service was 1, with 59% of Service IDs being associated with a single call graph set. This is likely a result of sporadic non-user facing functionality identified in Section III-B that presents with a limited number of calls. Nonetheless, a significant portion of Service IDs still showed variability in their call graphs, with a mean number of unique call graph sets per service of 31, and a maximum number of unique call graph sets of just over 3 million. These values are higher than found in previous work at Alibaba [11], however, these differences may be explained by the use of graph learning and clustering, grouping together graphs that demonstrate similarity in their call graph structure.
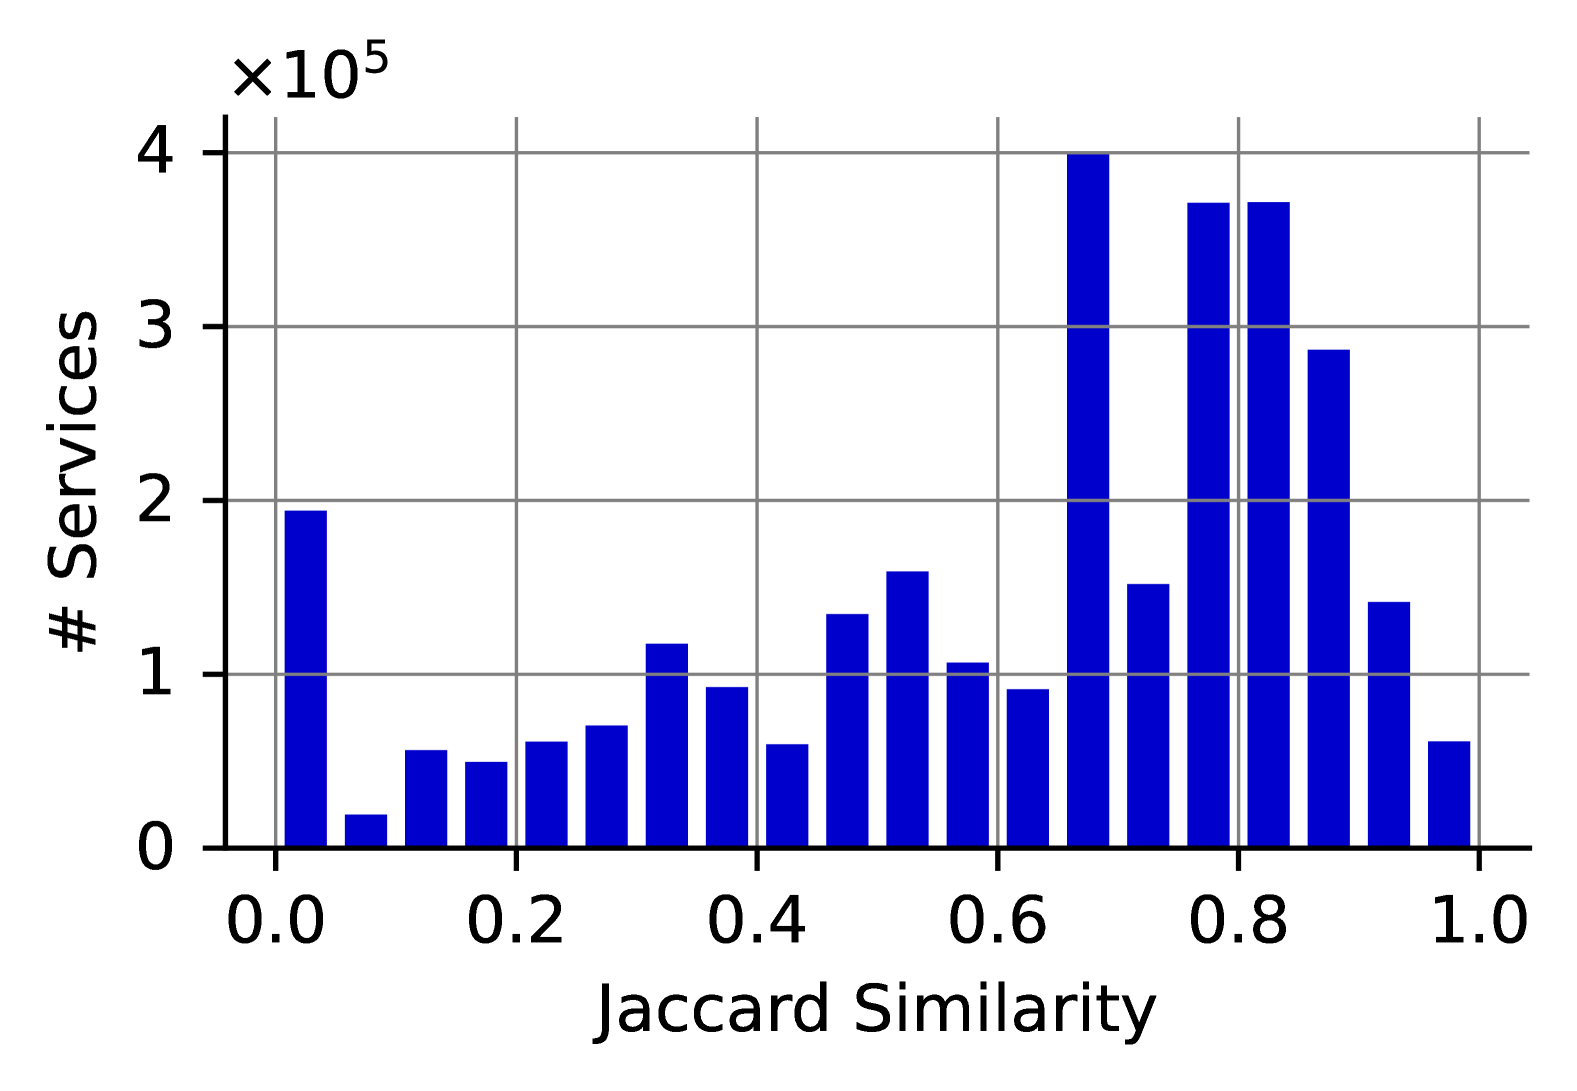
Call graphs from the same service are not necessarily similar in their MS calls: A high number of unique call graph sets does not necessarily imply a high degree of call graph variability per service, as each call graph may only display small deviations in call patterns. Therefore, we further investigated the average Jaccard similarity between call graph sets for each front-end service that produced more than a single unique call graph set. The distribution of similarities, considering the frequency of each call graphs occurrence, shows a grouping of high average similarities between 0.65 and 0.9, accounting for 52.8% of all services. On the other hand, we also found that a substantial number of services (28.5%) demonstrated less than 0.5 similarity between their call graph sets on average, with 6.5% of service showing no similarity. Overall, call graph sets produced by the same front-end service functionality only share 60% of the same MS calls. As we account for the number of times each call graph set occurred in our analysis, the cluster of higher average similarities may be caused by the existence of dominant call graph sets per service. This logically follows from microservice design principles, where a given front-end feature typically relies on a core set of microservice calls with small deviations occurring due to conditional events or alternatives in functionality.
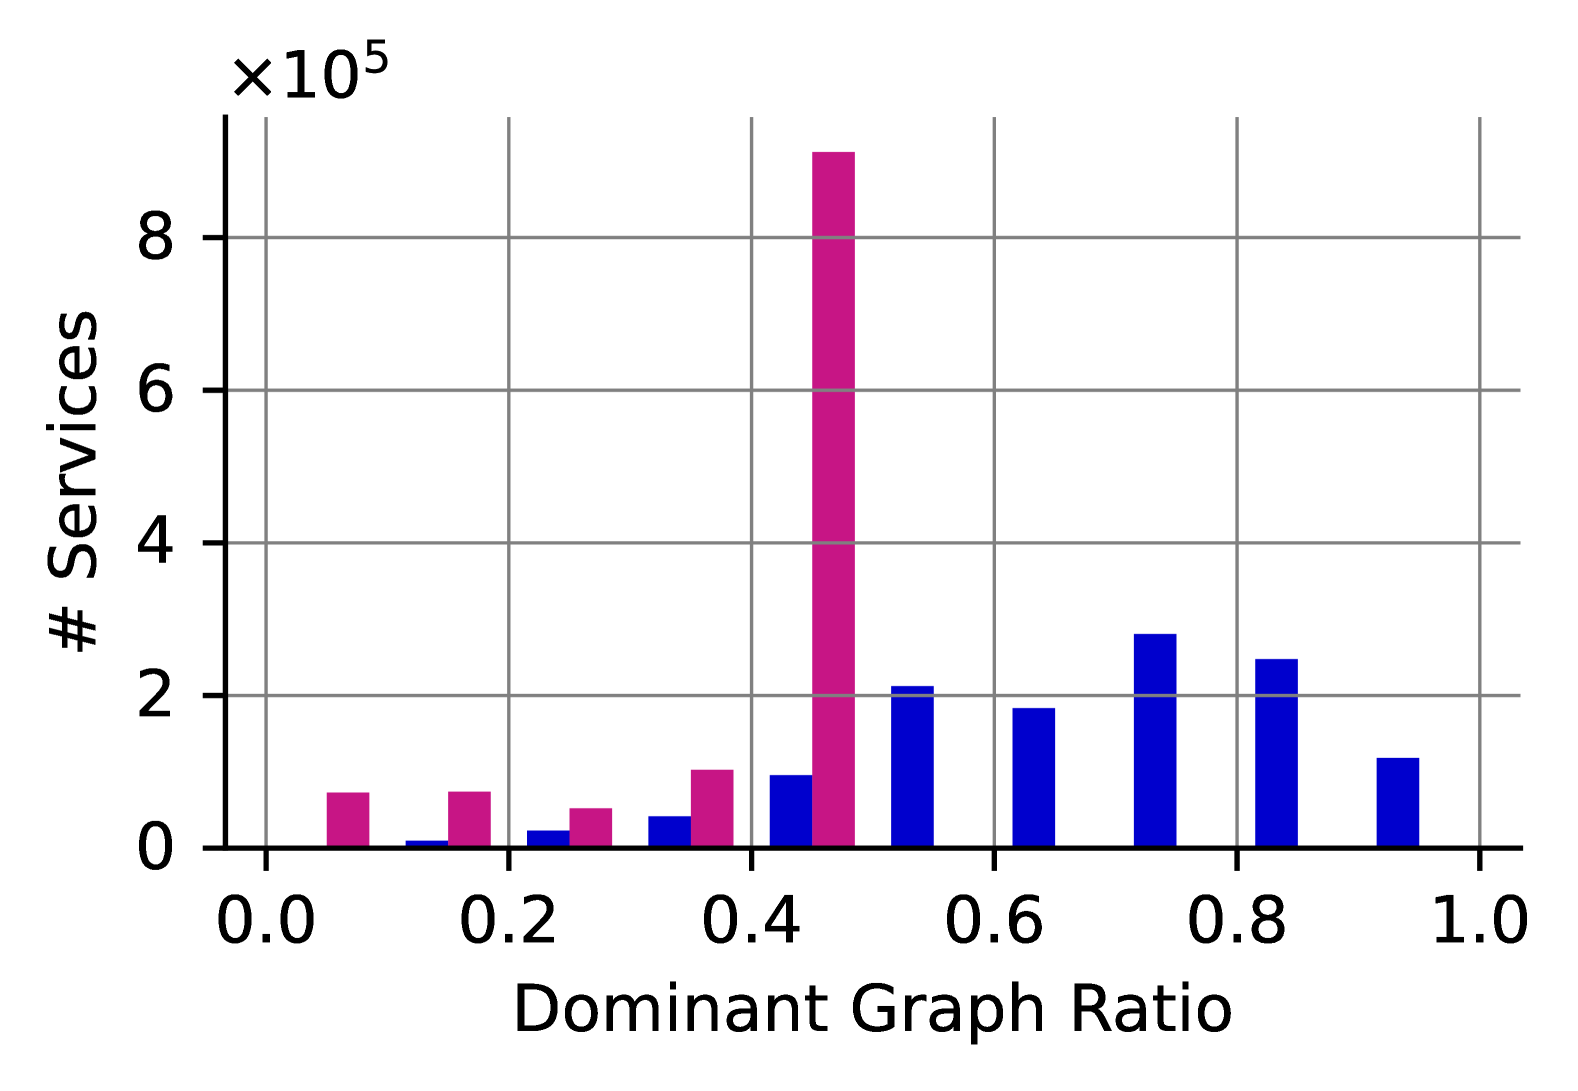
Front-end functionality often has a dominant call graph: To further understand the prevalence of dominant call graphs, we explored the proportion of the total call graph sets produced by each service that matched the most commonly occurring call graph. In a first analysis we found that there were a large number of services (13.4%) that only produced two unique call graphs each only appearing once, resulting in a spike of ratios at 0.5. Such cases do not provide much valuable information as to the prevalence of dominant call graphs and thus we excluded them from the subsequent analysis. The resulting distribution, shown in Figure 16, reveals a significant skew of the ratio of the dominant call graph set towards higher values than would be expected if all call graph sets had an equally likely probability to occurrence, with 82% of Service IDs demonstrating higher ratios than the maximum possible ratio if all call graphs were equally likely. This confirms that services generally have a dominant call graph that disproportionally occurs during service invocation, with rarer non-dominant call graphs.
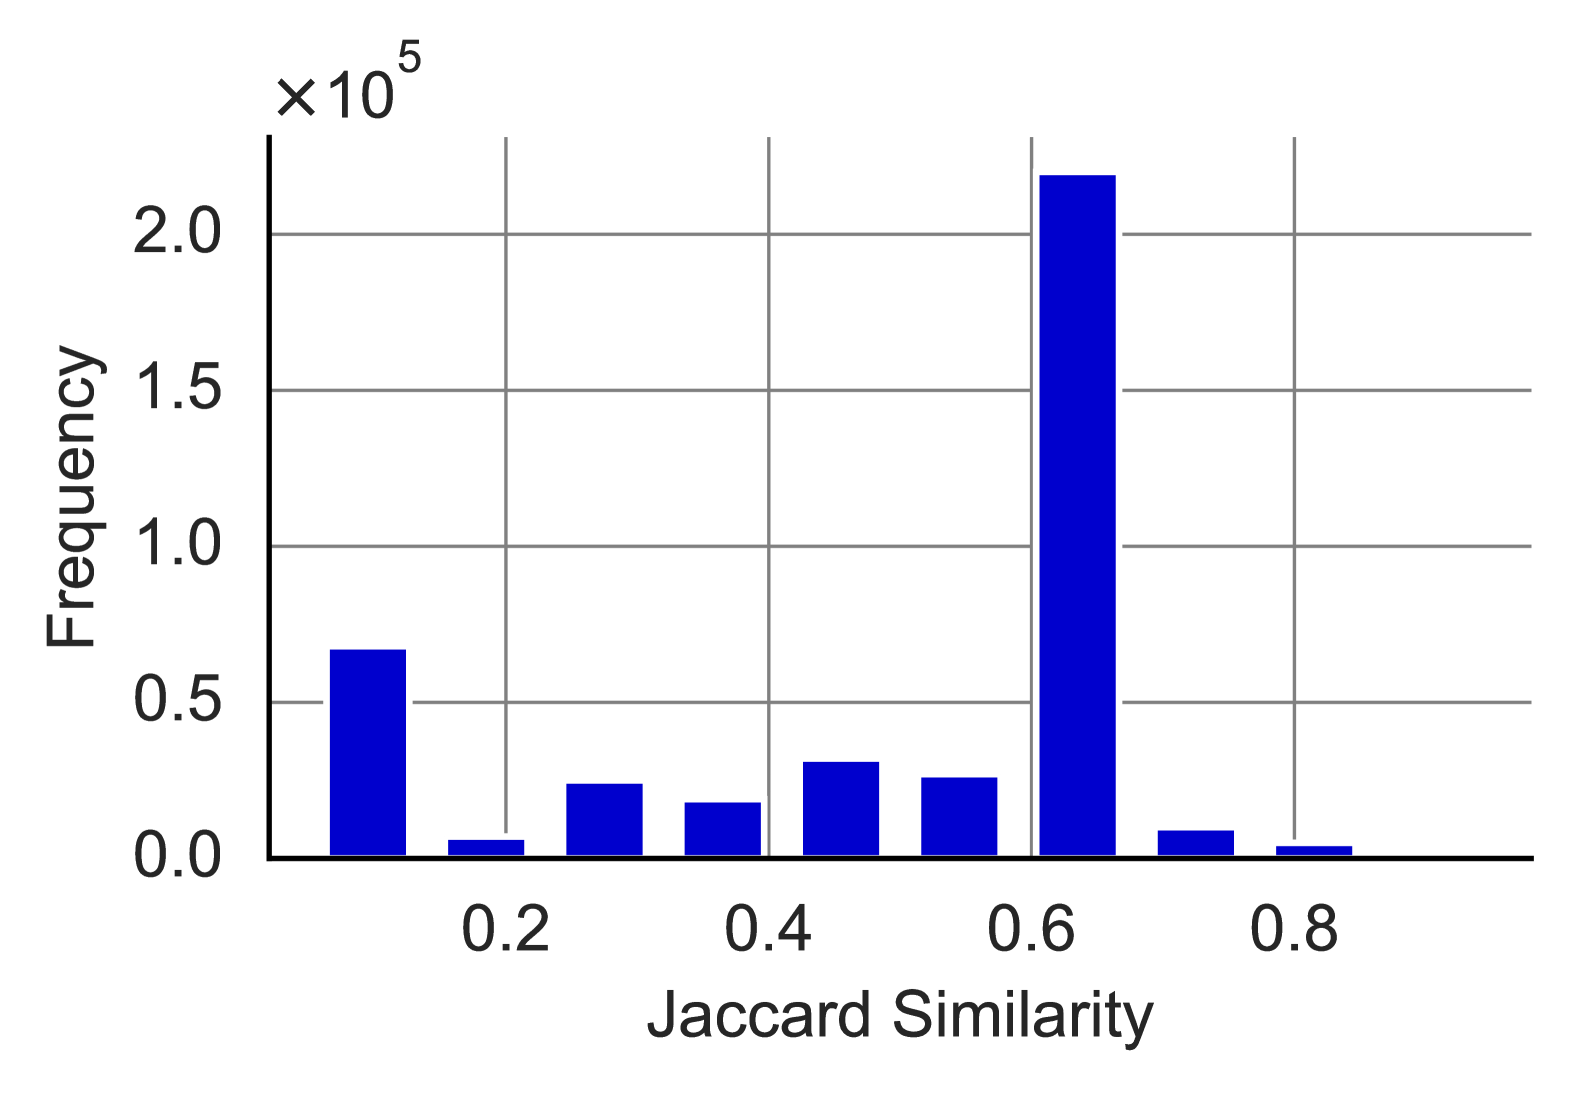
Non-dominant do not necessarily show high similarity to the dominant call graph pattern of a front-end service’s functionality: Subsequently, we sought to characterise the level of similarity between dominant and non-dominant call graphs. We focused our investigation on services with a high prevalence of dominant call graphs (0.75). For each Service ID we found the average Jaccard similarity between the dominant call graph set and all other call graph sets. The resulting distribution, shown in Figure 17, reveals that non-dominant call graphs show some similarity to non-dominant call graphs, with an average Jaccard similarity of 0.6, meaning that non-dominant call graphs shared 60% of calls. However, we found that 35% of non-dominant call graphs share less than 50% of the same calls, with 15% of non-dominant call graphs demonstrating zero similarity with non-dominant call graphs.
Overall, our findings extend previous observations of significant variability in MS call graphs within large-scale MSAs at both Alibaba and Meta [11, 13]. This illustrates that not only are call graphs from the same front-end functionality or service potentially highly variable, but non-dominant call graphs can show high degrees of dissimilarity in the types of MS calls involved. Furthermore, we note that the total number of different call graphs produced by the wide array of front-end service functionality included in the dataset is significant.
IV-H Heterogeneity Implications
Microservices can be multiplexed by a large variety of other microservices and front-end functionality (Sections IV-D, IV-F). A common idea that has been employed by many fault localisation and detection approaches is that the behaviour of microservices is naturally correlated with the usage of front-end applications. This concept has been utilised to detect anomalies such as the deviation in the behaviour of microservice KPIs and front-end SLO’s [57, 58] and for localising the root cause of faults by weighting analysis based on the correlation of microservice metrics with front-end fault patterns, such as increased end-to-end latency [33, 36, 37, 59, 60]. However, our results suggest that the microservices might be involved with providing functionality for potentially thousands of front-end service functionalities. This inevitably results in signal mixing as the observed behaviour of microservices is the aggregate of many independent front-end service functionality usage patterns. Without appropriate treatment of such signal mixing, for instance through blind source separation [61], such approaches are likely to incorrectly detect and misattribute faults.
Another commonly used approach for anomaly detection from MS metric data is statistical threshold-based anomaly detection, such as the use of the 3-Sigma rule [20, 62, 63, 64] or the extreme studentized deviate test [65], where data points that deviate significantly beyond a determined threshold are flagged as anomalous. However, such approaches often work under the assumption of approximately normally distributed data. Instead, our findings suggest that MSs can be multiplexed by a very large array of potentially heterogeneous front-end service functionality. This means that the resultant MS metric time series may form a non-Gaussian mixture from the aggregation of workloads with individual means and variance. Additionally, the mixture of a workload from different front-end services could lead to different tail behaviours than would be predicted of a normal model and non-stationary signals due to the dominance of different workloads at different time periods. Overall, these characteristics could lead to increased false alarms and decreased detection accuracy from such approaches.
One set of popular approaches for leveraging distributed tracing data for anomaly detection and localisation treat the calls within traces as sequences of events [66, 67, 68]. Sequence-learning approaches, such as recurrent neural networks, have then been used to learn the normal sequences of calls between microservices. Such models can then be used to flag anomalous calls that fall below some threshold of expected next event. However, we found that MSs can have very large out-degrees, in other words, a vast number of possible next events. This can dramatically increase the amount of training data required. Additionally, a dispersed probability distribution over many potential next events could make such approaches extremely sensitive to threshold parameters. Furthermore, picking a one-size-fits-all threshold for the heavy-tailed distribution of potential next events across different MSs is likely to lead to unsatisfactory false negatives for MSs with low out-degree and false positives for those with high out-degree.
Large‑scale MSAs generate many call graphs, with each front‑end function following a common structure but sometimes producing rare, divergent ones: (Section IV-G)
A common approach employed by many fault detection and localisation approaches is to learn the structure of normal system traces. For example, one set of approaches leverage structural modelling to construct propagation graphs based on the structure of normal tracing data [50, 69]. However, rare call graphs may be missing from historical data used to construct these models, especially when considering the trace sampling commonly employed in large-scale MSAs, leading to incomplete models and unsatisfactory false positives at runtime. An alternative popular approach is to use distance-based clustering, such as through tree-edit distance, to group historical traces based on their structure [70, 71]. At runtime, new traces are matched against these clusters, and any trace that fails to match is flagged as anomalous. However, we identified 79 million unique call graphs, making a pair-wise structural distance calculation between these computationally prohibitive. Furthermore, we found that unique call graphs, even when from the same front-end functionality, can be dissimilar, meaning that such an approach could produce a large number of normal trace groupings. As each new trace at runtime must be structurally compared to medoids of these clusters, and on average this deployment receives 44 million front-end invocations per hour (Section III-C, the computational overhead of such approaches may once again be prohibitive. Furthermore, similar to propagation graph approaches, rare traces may not be captured in historical data, and thus lead to unsatisfactory anomaly detection performance.
The spread of workload across microservices is highly uneven (Section IV-C).
Our findings, which corroborate previous findings [11, 7], suggest that focusing on more accurate workload prediction for a small subset of high-demand MSs could yield higher than expected returns in resource savings and SLA compliance. Conversely, the vast majority of MSs, which receive very few calls, may not justify the cost of developing and maintaining sophisticated predictive scaling algorithms. This may be particularly true for MSs that receive such a low amount of workload that they are unlikely to need to scale at all, or could do so efficiently based on more simplistic heuristic rules. Overall, this invites future work on more tailored auto-scaling strategies that focus on optimising prediction accuracy where it matters most.
Microservice instances are deployed across a large number of nodes and can be co-located with a large number of different microservice instances (Section IV-B).
Many approaches for anomaly detection and fault localisation within MSAs leverage distributed tracing data to capture the direct relationships between MSs [60, 50, 69, 62, 72, 17, 16]. However, in real-world MSAs, MS instances are co-located on the same host to minimise resource underutilisation, as evidenced by our findings in Section IV-B. Due to this characteristic, anomalies can also propagate indirectly between co-located MSs, that do not share a direct calling relationship but share hardware, due to mechanisms such as resource interference and contention [30]. Our findings indicate that on average each MS is exposed to large numbers of co-located MSs across its instances (See Section IV-B). This exposes MSs to a large degree of possible sources of complex indirect fault propagation. As approaches that solely leverage distributed traces cannot capture such faults, future research must be carried out to explore the prevalence of such indirect fault propagation, and how these failure conditions could be incorporated into more comprehensive fault management approaches.
V Dynamicity
As discussed in Section IV, MSAs provide flexibility and resilience due to the loosely coupled nature of MS design. However, this characteristic means that MSAs are inherently dynamic. Whilst dependencies are fixed in underlying code, at runtime, calls between MSs are transient, only occurring based on a front-end request. Furthermore, the deployment of MS instances is elastic, with instances being scaled up and down in response to changes in demand and performance. In addition to runtime MS dynamicity, the whole architecture is prone to change as MSs are added, removed, and updated to evolve the functionality of the system [53]. In this section, we explore how this dynamicity manifests in the dataset.
V-A Time-Varying Dependencies
A common perspective when discussing MSs within a MSA is the overall dependency structure between MSs based on the dependencies within the underlying code [13, 73], as we have done in Section III-D IV-D. This view has been used to investigate and understand MSA design and detect anti-patterns [8]. However, it fails to account for differences in the behaviour of the system at runtime. Indeed, more recent research has shown the value of investigating the temporal behaviour of MSAs at runtime [9, 12]. Still, little research has been carried out to understand to what extent the temporal behaviour of a MSA differs from the static view of the system. As a first step to contributing to this question, we explored the differences in time-varying degree of MSs at runtime by ingesting the call dataset into Raphtory [74] as a temporal graph database.
Runtime dependencies can vary greatly from the static view of the system:
To understand how much the static in- and out-degree dependency views differ from the temporal views for MSs, we first calculated the average temporal in- and out-degree for each MS, sampled in 1 minute snapshots and then plotted these against their corresponding static degrees from Section III-D. Our results indicate that the temporal degree of MSs at runtime does not necessarily directly correspond to their degree in the static view of the system, see Figures 18 19. For both in- and out-degree, we found that, whilst the highest static degree MSs tend to also have a high average degree, this relationship quickly deteriorates. For example, the 26th highest static in-degree MS actually only has the 4,809th highest average in-degree. The discrepancy is even more apparent for out-degree, with the 4th highest static out-degree MS only having the 19,774th highest out-degree and the 6th highest static out-degree MS having the 7,296th highest average out-degree.
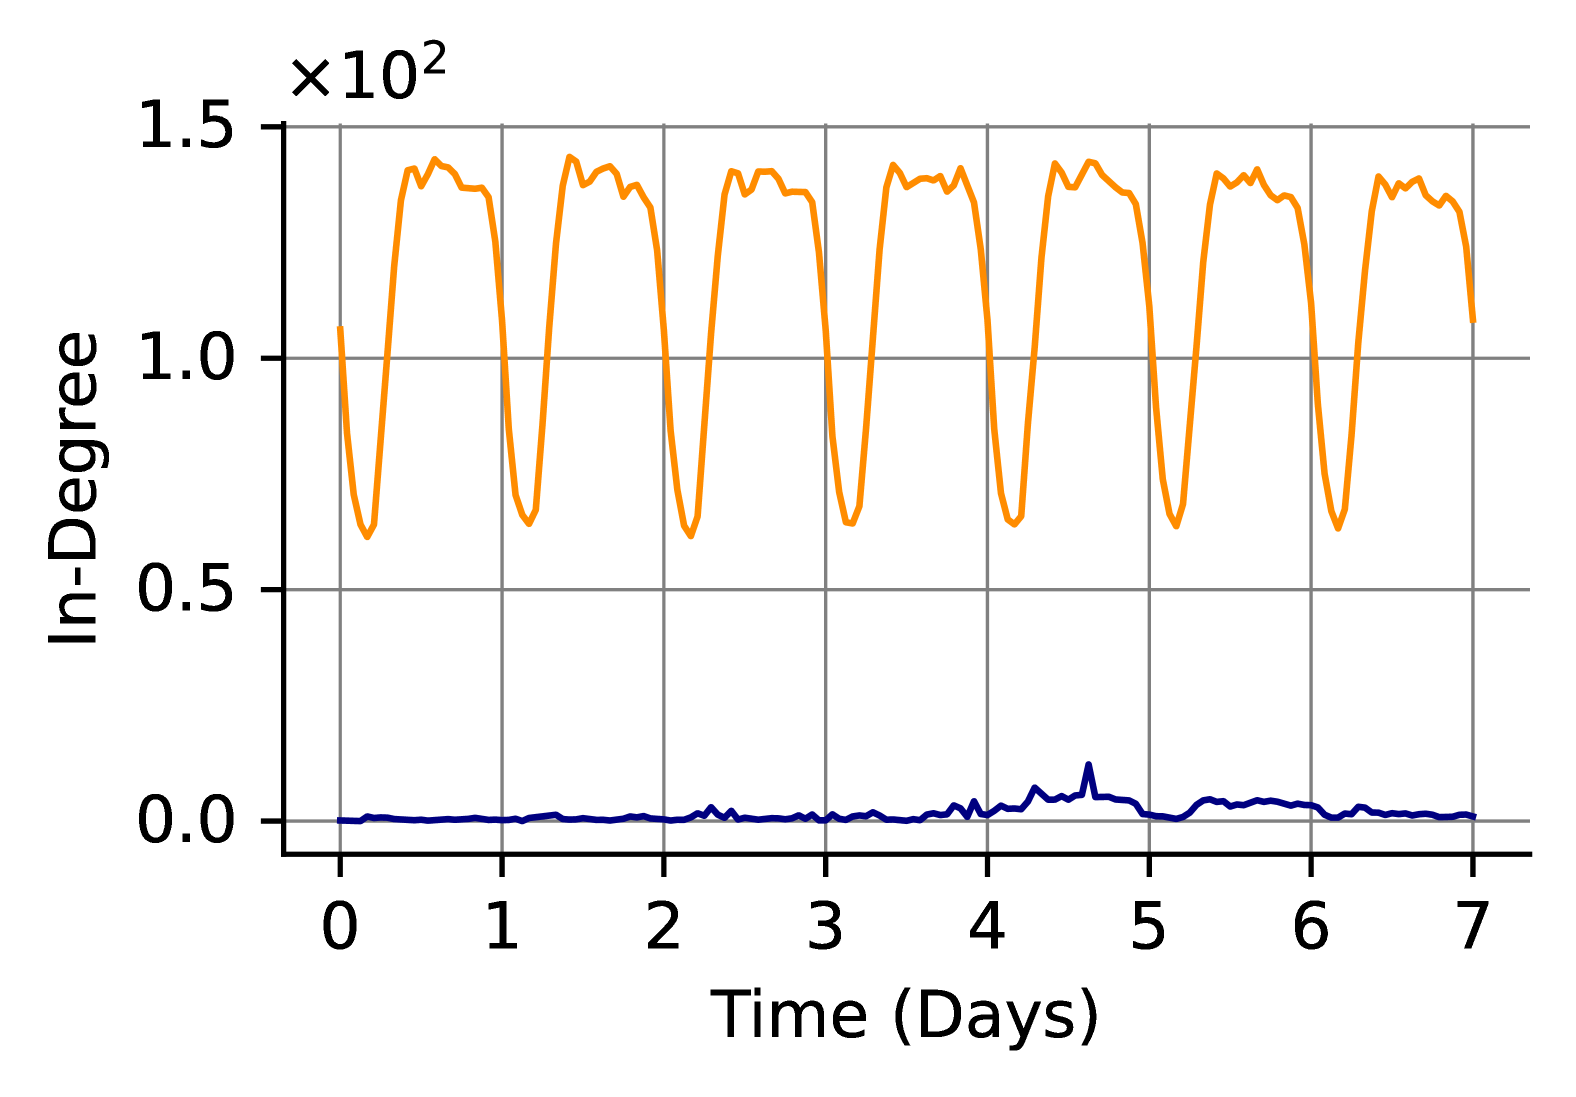
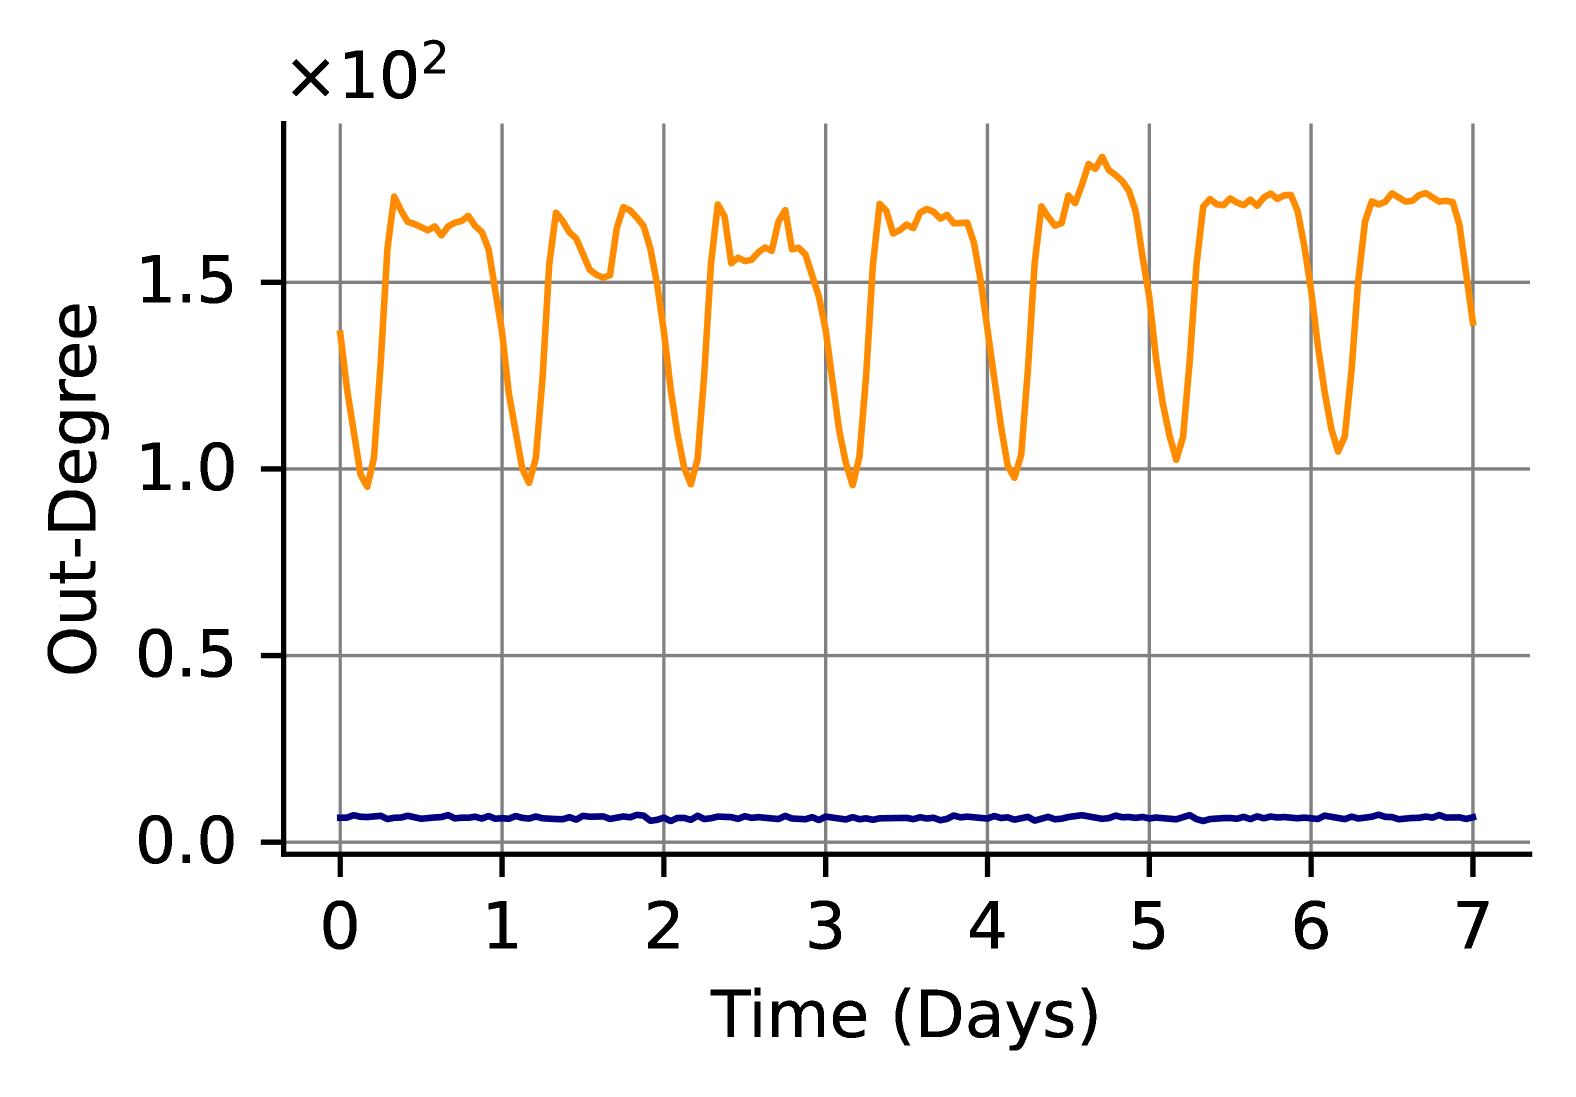
To understand the differences between microservice dependencies at runtime that lead to these discrepancies, we compared the runtime degrees of two of the notable outliers mentioned previously for in and out degree, see Figure 21 and 20 respectively. In both cases, we found that, when compared to the MS directly preceding it in static degree ranking, these MS displayed much less regular changes in dependencies with weak daily periodicity and a significantly lower number of dependencies on a one minute basis at runtime. This suggests that these MS are not involved in a large amount of system functionalities on a moment-by-moment basis, but rather call, or are called, by a large number of different MSs over time. This inflates their in- or out-degree in the static view of the system when compared to MSs that instead are consistently involved with large number of MSs and functionalities at runtime.
V-B Horizontal Scaling
A fundamental feature of MSAs is their ability to independently scale the number of instances on a per-MS basis, known as horizontal scaling. This scaling adds additional complexity to MSAs, as instances can be ephemeral. Horizontal scaling is also the primary domain of application for MS workload prediction research [7]. However, the question remains as to how horizontal scaling is handled in real-world, large-scale MSAs, how much are MS actually scaled, and how beneficial could workload prediction-based auto-scaling be?
The majority of MS do not horizontally scale:
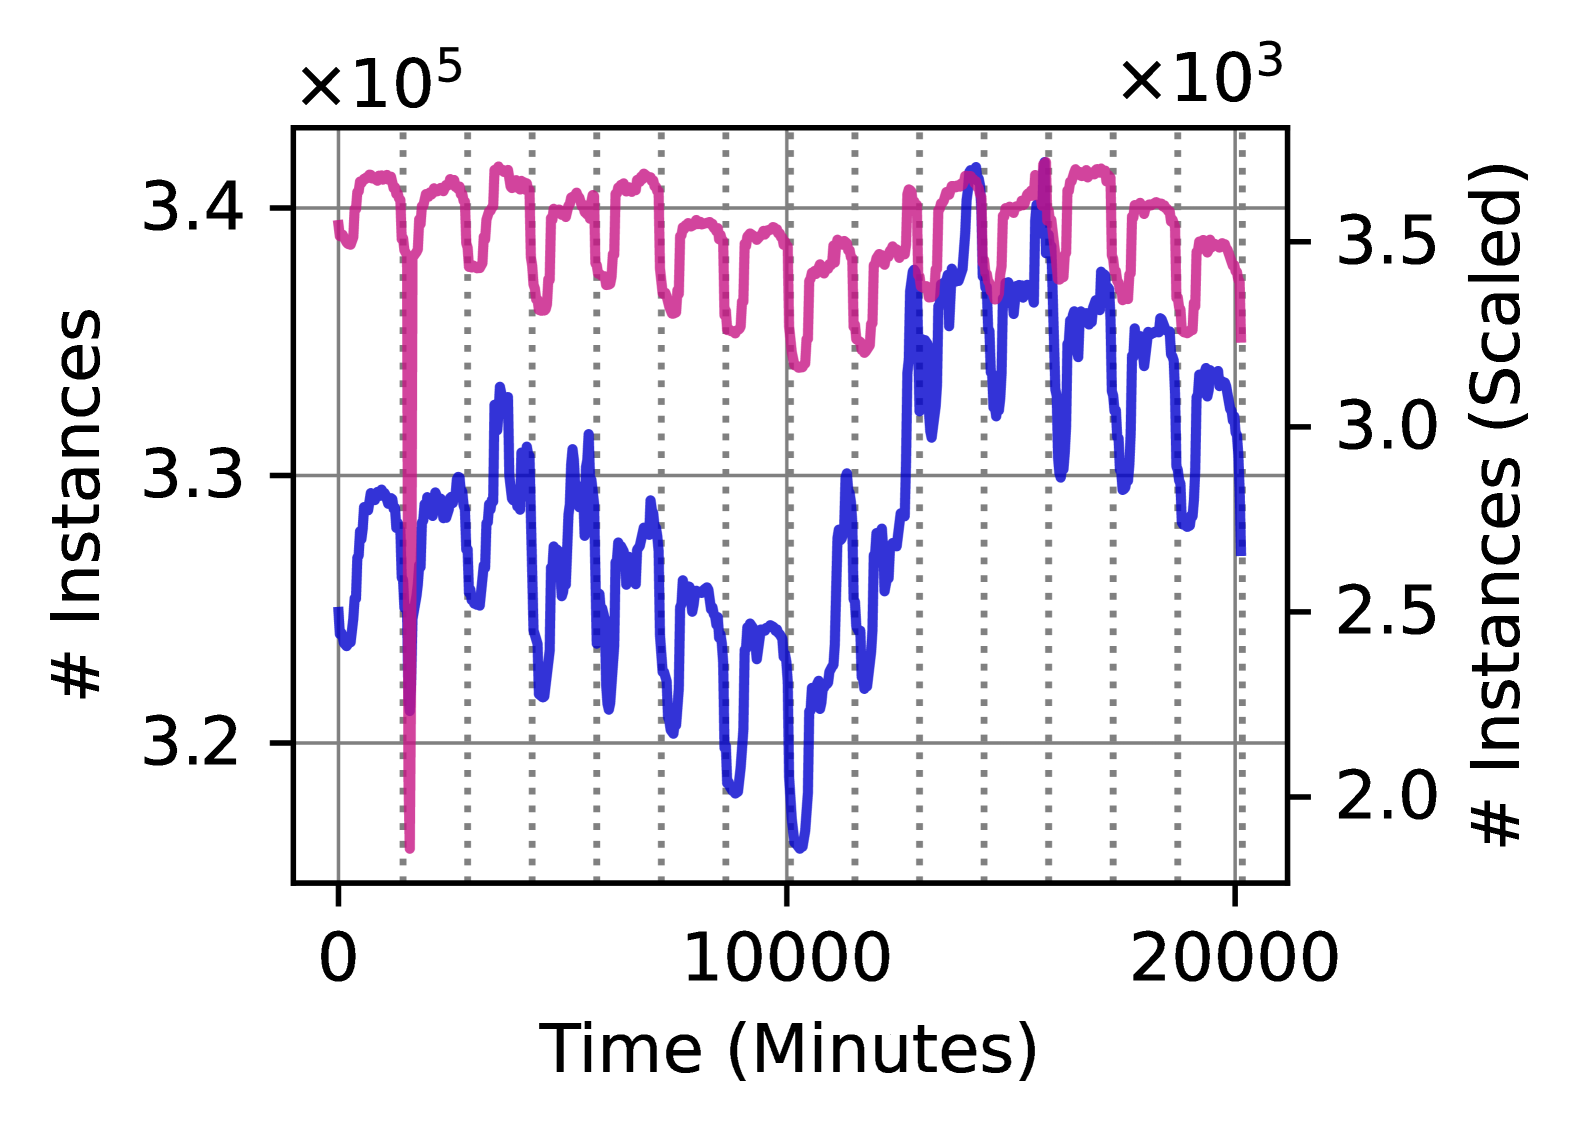
As the resource data includes samples from all deployed MS instances every minute, we use it to explore the changes in the number of deployed instances per MS over the 14 days. Of the 28,000 stateful MSs in the resource dataset, we found that although there was a substantial fluctation in the total number of deployed instances across the 14 days, see Figure 22, the vast majority (76.9%) maintained the same number of instances across the full 14 days, thus demonstrating no horizontal scaling.
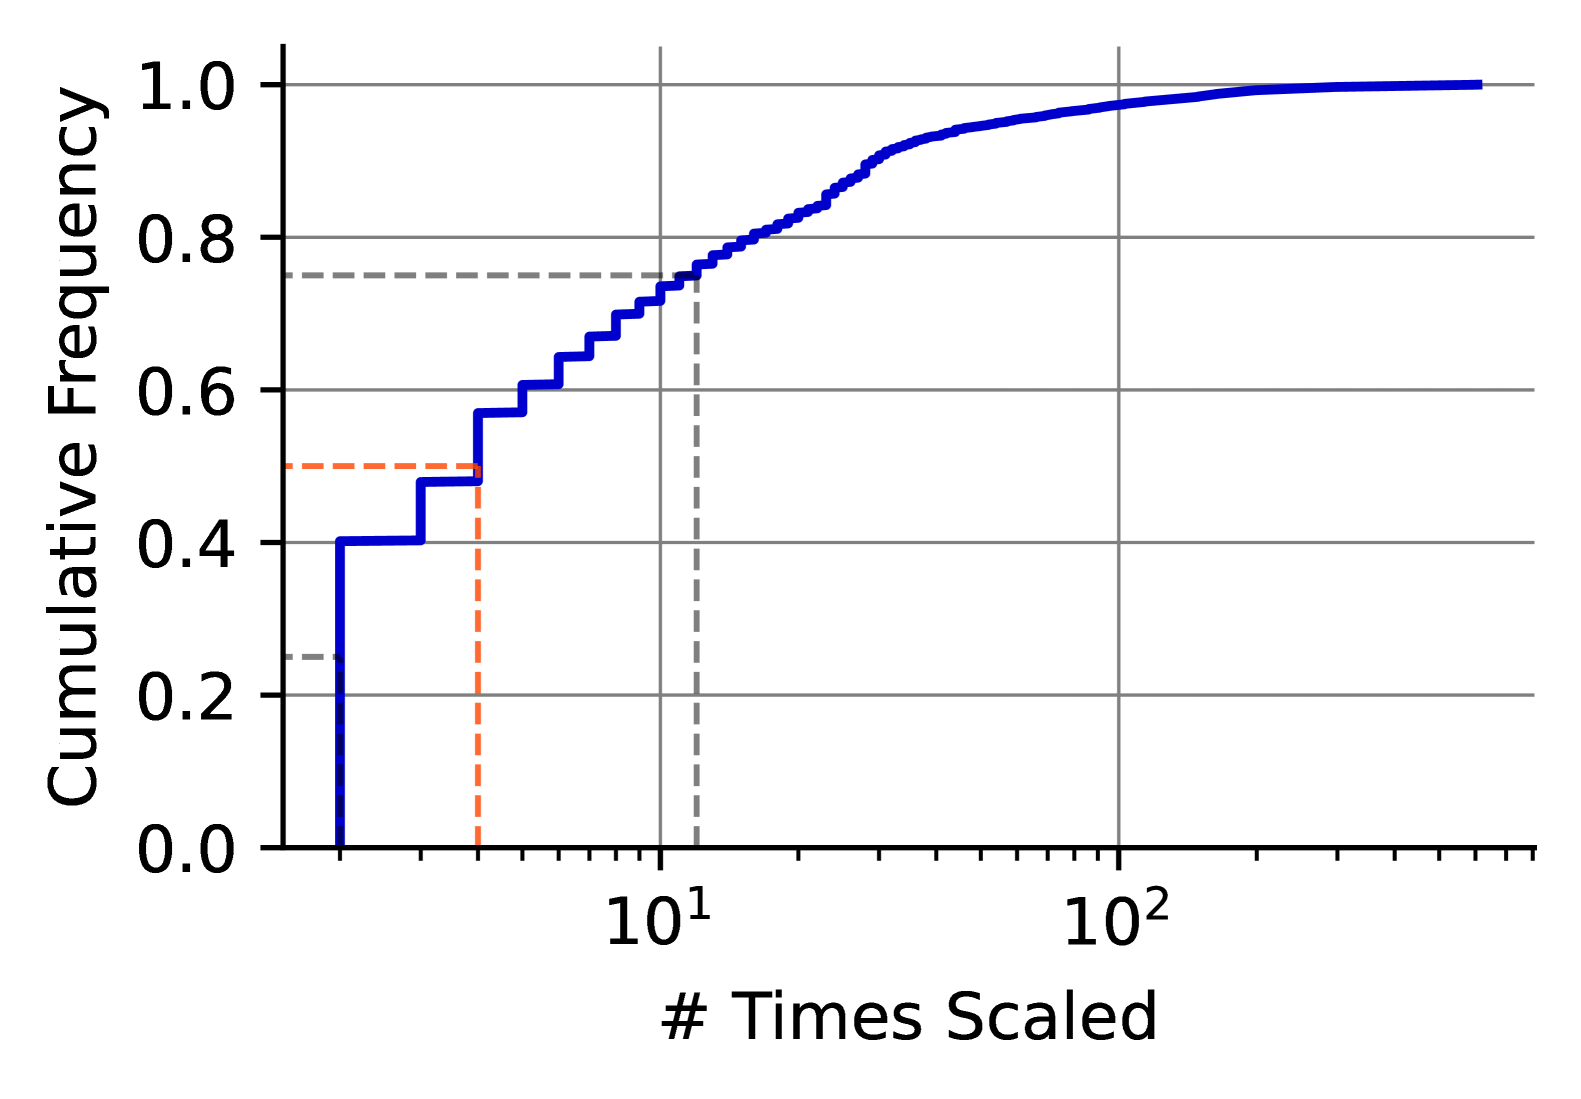
MS that scale do not generally do so in response to daily fluctuations in demand: Of the remaining 33.1% of MSs we found that only just over half of them (51.2%) scaled more than twice over the 14 days (see Figure 23), suggesting a low degree of daily scaling of MSs. Despite this low level of overall scaling, we found that the average change in total instances per 30 minutes was 502 instances, or 0.1% of the total number of instances. This means that per day there was a rough turnover of around 5% of total instances.
To determine daily periodicity, we extracted both time- and frequency-domain features using the auto-correlation function (ACF) and fast Fourier transform (FFT). Using the ACF, we derived the ACF ratio by comparing the autocorrelation at a 24-hour lag to that of lag 1, providing a measure of the daily cycle’s prominence relative to short-term correlations. Using the FFT derived power spectrum, we calculated the power ratio as a fraction of total spectral power concentrated at the 24-hour frequency. These two features were used as predictors in a Random Forest classifier trained on a manually labelled subset (200 samples) of MSs to identify those exhibiting significant 24-hour periodic scaling. Using this approach, we identified 1,240 MSs that demonstrated strong daily periodicity, accounting for only 18.8% of all MSs that scale (i.e., 4.4% of all MS).
MS that scale daily can have a large change in the number of instances: For those MSs that demonstrated strong daily periodicity, we found that the average daily peak to trough change in the number of instances per MS was 13, meaning on average the minimum to maximum change in the number of instances per MS was 43.1%.
Overall, these results demonstrate that the majority of MSs do not appear to be scaled in a daily manner to match customer demand. However, those MSs that are scaled demonstrate significant changes in the number of instances across each day, on average doubling the number of instances between their lowest and highest scaled points.
V-C Evolutionary Architecture
The decoupled nature of microservices provides bounded context, meaning that incremental changes can be made to individual MSs without breaking an application. This has allowed MSAs to fully embrace modern DevOps practices of continuous integration and delivery, leading to an architecture that grows and changes continuously [53, 13]. As Alibaba did not provide information as to the creation and deprecation of MSs, we investigate the extent to which the deployment undergoes such evolution. For this, we used the resource data due to its deterministic sampling of all deployed MS instances.
Churn occurs on a daily basis: To differentiate between potential scale-to-zero or missing data and true deprecation instances, we carried out two data processing steps. We first identified every MS that had zero instances across the 14 days. If a MS had never had any instances before, it was flagged as a creation candidate. If a MS never regained any instances after, it was flagged as a deprecation candidate. Next, to differentiate between scale-to-zero cases that happen to occur at the start and end of the dataset we further investigated candidates that had more than a single period of zero instances. For each of these candidates, the distribution of zero instance period durations was calculated, and the candidate pre-creation or post-deprecation period was compared to this distribution. Only cases where the candidate period was greater than 3 standard deviations above the mean were considered as genuine deprecation or creation events.
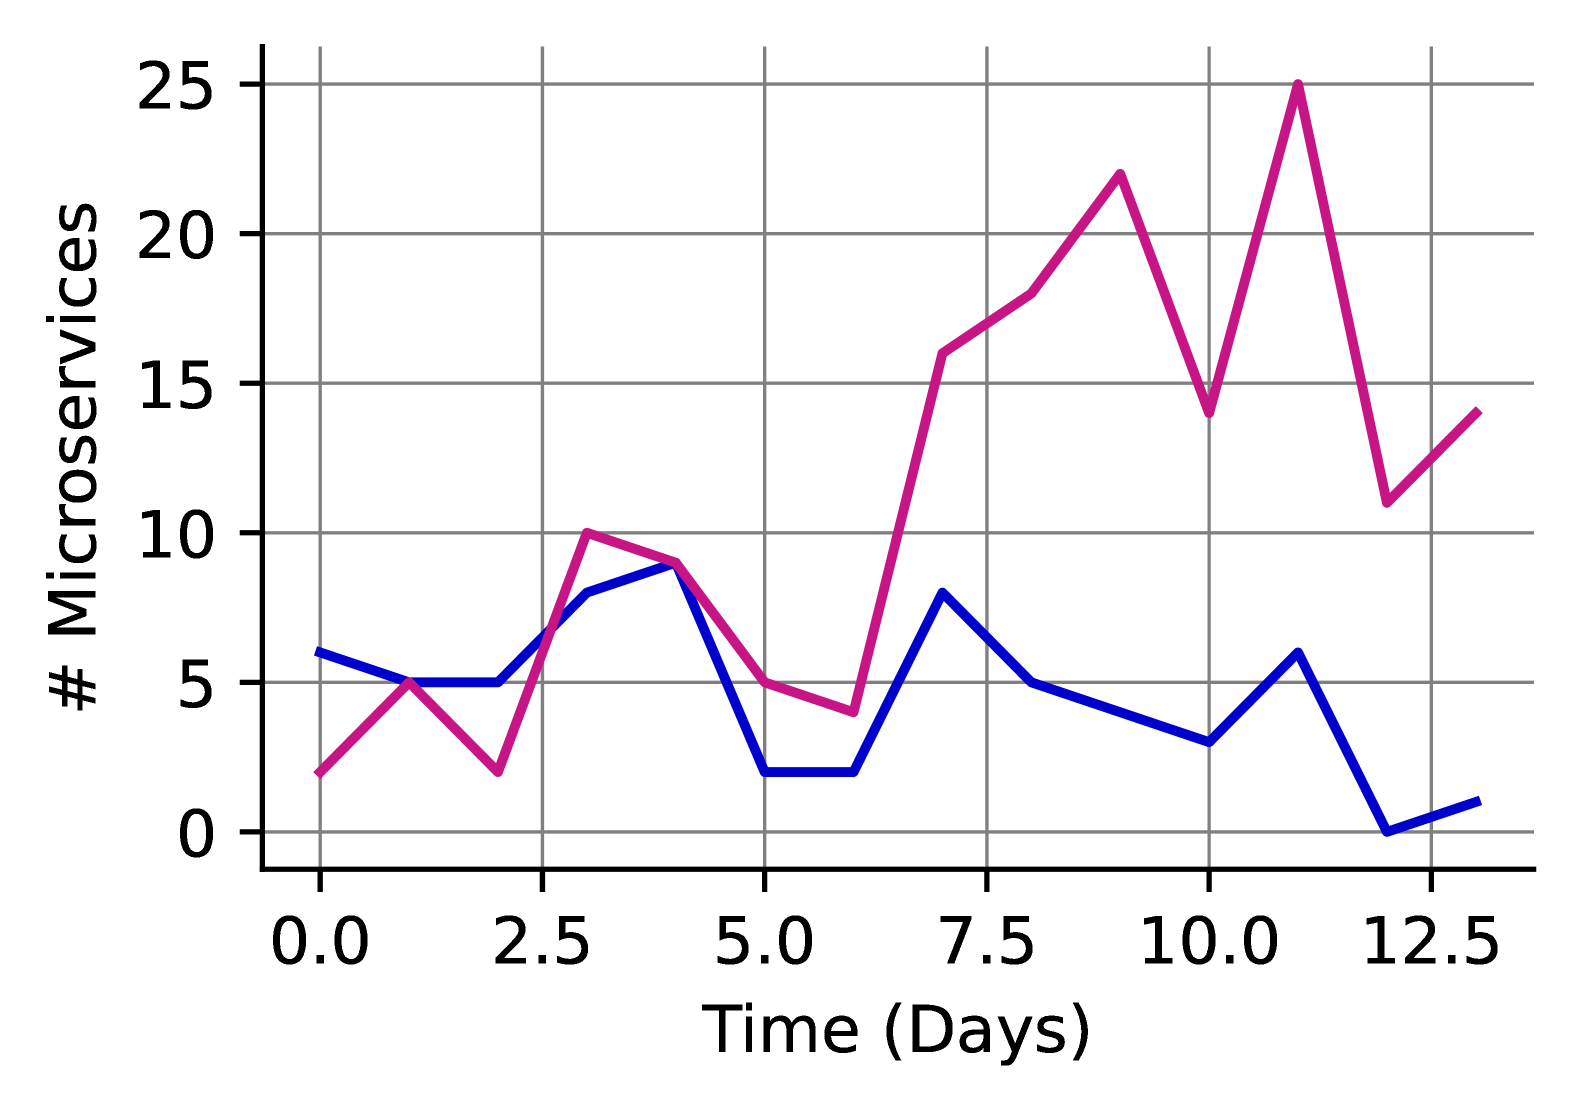
Results showed that across the 14 days, more MSs were deprecated than created, with 64 new MSs created and 157 MSs deprecated. Whilst the number of MS creations and deprecations are comparatively small compared to the size of the deployment, the number of new MSs added across two weeks alone was greater than the total size of most experimental testbeds (SocialNetwork - 26 MSs [75], MediaMicroservices - 30 MSs [75], TrainTicket - 68 MSs [27], SockShop - 8 MSs [29], HipsterShop - 10 MSs [28]).
Whilst we found more deprecation than creation events, up until day 6, the number of creations and deprecations were generally comparable before a significant jump in deprecations and a slight decrease in creations was observed. This suggests that the higher number of deprecations could be a result of a short-term fluctuation, and the number of creation and deprecation events may be more in equilibrium over a longer timescale.
Alibaba and Meta have similar rates of MS churn: When contrasting the number of MS creation and deprecation events within the dataset to those found by Meta, we found remarkably similar, albeit inverted, values with a median number of MS creations at 5 and 12, and the median number of deprecations at 10.5 and 4 per day for Meta and Alibaba, respectively. The higher deprecation values relative to creation for this dataset when compared to Meta’s may suggest that this MSA, being significantly larger than that of Meta, is in a lifecycle of consolidation and removal of unnecessary MS bloat, whilst Meta is still in a period of growth. However, it should be noted that Meta found significant jumps in creation and deprecation across their longer period of study [13] and thus our findings across just 14 days may not accurately depict the broader trend. Furthermore, the fact that the median values found for both MSAs are of similar magnitudes, despite a considerable difference in the total number of MSs (18,500 vs 28,000), suggests that the rate of growth of large-scale MSAs may be independent of total size.
V-D Dynamicity Implications
The static view of the system does not necessarily correspond to runtime dependencies
The discrepancies found between the static dependency view of the system and the temporal, runtime, view of the system has several implications for research into MS anti-patterns [8]. Previous research has looked at the static dependency structure of a MSA architecture, however, as we have found, this view does not necessarily give accurate insights into the dependency structure at runtime. Therefore, anti-patterns found by applying graph measures to this static view [8] could produce inaccurate results. Likewise, when attempting to identify the importance of a MS based on its involvement with system-wide functionality, the static view of the system may not inform us as to whether this MS is actually involved with that same functionality regularly at runtime. This reinforces the need to pair analysis of static views of MS dependencies with temporal views when performing network analysis on MSAs.
Microservice architectures evolve significantly on a daily basis:
Of all of the commonly used MS testbeds [26, 27, 28, 29] only one [76] includes versioning that evolves the functionality of the deployment. This may explain why the evolution of a MSA over time is not often a large consideration of management approaches. As discussed previously, a popular general approach for anomaly detection and localisation within MSAs is to learn or model the normal behaviour of the system through metric data [62, 77, 35, 78, 79, 51, 80, 46] and distributed tracing data [70, 50, 71, 69, 66, 67, 68]. However, our findings in Section V-C, in corroboration with Meta’s finding [13] and known MSA design principles [53], underscore that MSAs are not stationary. As MSs are created, deprecated, and updated, dependencies within the system are altered. This inevitably leads to the creation of new, and alteration of, call graphs produced by a MSA. Moreover, as existing MSs are multiplexed by new MSs and potentially front-end functionality, the normal behaviour of their associated metrics can also be expected to change. Therefore, approaches that model the normal behaviour of a MSA for fault management based on historical data are expected to see a degradation in performance due to concept drift over time without periodic updating and retraining. Despite some promising mechanisms to address MSA evolution, such as human-in-the-loop flagging of MSA updates [68] and transfer-learning [16], the implication of system evolution on fault management approaches and the additional overhead of frequent retraining is considerably underappreciated in state-of-the-art research.
VI Summary of Research Implications and Testbed Opportunities
As discussed in Sections III-E, IV-H, V-D many approaches designed for aiding the management of MSAs often fail to meet the challenges associated with large-scale MSAs. We discussed how anagement approaches often fail to consider (i) scalability in large-scale deployments (Section III-E), (ii) the fact that MSs may be multiplexed by many other MSs and front-end functionalities due to the core tenet of MS reuse in MSAs (Section IV-H), (iii) the variability of call graphs from the same front-end functionality (Section IV-H), (iv) the exposure of MSs to potential interference from co-habitation IV-H, and (v) adaptation to an evolving system V-D.
Many of the above limitations of current state-of-the-art approaches appear to stem, at least in part, from limited access to real-world MS deployments. The research testbeds that are commonly used throughout the literature [26, 27, 28, 29] are not sophisticated enough to capture the complexities of actual deployments, especially large-scale deployments such as the one studied here or Meta’s. Therefore, we join recent calls for improved testbed realism [10, 13]. Our findings enable us to identify several development opportunities that could help testbeds to more accurately replicate real-world deployments, as follows.
Expanding MSA functionality: MS testbeds are relatively small, containing on the order of 10’s of MSs [26, 27] or less [29, 28]. Furthermore, these deployments only comprise a single application, such as a social network [26] or train ticket ordering [27], with limited front-end functionalities. On the other hand, MSAs at Alibaba (Section III-B and III-A) and Meta [13] support many applications and front-end service functionalities. As most testbeds are real small-scale MS deployments, there is significant scope for the expansion of their functionality by providing new application functionality and subsequently increased MS scale.
Evolving user inputs and architecture: most MS testbeds only provide a single version [26, 27, 28, 29], meaning that there are limited opportunities for the kind of architectural evolution that was found in this dataset (V-C) and at Meta. This underscores the need for continued development of testbed functionality, which could naturally facilitate evolutionary behaviours through versioning support. To simulate user behaviour, testbeds use workload generators. However, some of these generators only produce stationary load [81]. On the other hand, user demand is in constant flux, as demonstrated in our findings (Section 4. The differing usage patterns of distinct front-end services can cause variation in the behaviour of a MSA, such as the prevalence of specific call graphs, and thus dependencies at specific times (Section V-C, [12]). The processed Alibaba dataset released with this paper [82] includes the front-end service usage patterns over the full 14-day period. This data can easily be used with workload generators that enable custom user behaviour [83] to create more realistic user usage patterns for testbeds.
Call graph variability: testbeds are generally too simplistic in their provided functionality and number of MSs to generate the wide degree of unique call graphs found here (Section IV-G). Furthermore, testbeds do not have scope for extensive call graph variability from the same front-end service functionality as identified here (IV-G, [11]) and at Meta [13]. To represent this behaviour, the development of testbeds is required to include mechanisms that are known to create variable call graphs such as graceful degradation, which provides alternative call paths under stress or failure conditions, and caching limits that lead to data eviction. Furthermore, front-end functionality can be designed with top-down variability in mind, for example, by using conditional user inputs that trigger alternative call paths.
VII Future Work
In this paper, we have undertaken an extensive quantitative exploration into a large-scale MSA released by Alibaba. Still, because of the substantial amount of data produced by a large-scale MSA, this investigation is far from exhaustive. Our analysis raises many open questions that warrant future investigation. For instance, we found that the degree of MSs varies in time (Section 21), however, we did not investigate to what extent other local dependency features change in time, nor if the global topology changes throughout the day, as has been explored in previous work [12]. Our analysis of call graph variability (Section IV-G) does not account for call graph structure, potentially underestimating true variability. Therefore, future work should assess how incorporating structure affects our results. Our findings indicated that the MSs with the most total calls, number of instances, and dependencies (Section IV-E) were generally not the same. There are aspects of this dataset that we did not explore but may help to elucidate a link between these groups, such as resource usage, performance metrics, and call graph multiplexing. To encourage further exploration from the community on this dataset, we have released all code and processed version of the dataset used in our analysis [82].
In conclusion, our analysis has highlighted similarities and differences between this Alibaba deployment and Meta’s, including surprising similarities in global and local dependency structures, MS inequality, and architectural evolution. However, this work only compares these characteristics between two MSAs due to the limited release of datasets from commercial entities. Therefore, we both call for future empirical explorations of other enterprise-grade MSAs and for companies to release datasets from their MSAs to help build our understanding of both common principles and idiosyncrasies in these large-scale MSAs.
References
- [1] J. Livens, “What are microservices, and what are their benefits?” Jan. 2023, accessed: April 15, 2025. [Online]. Available: https://www.dynatrace.com/news/blog/what-are-microservices/
- [2] J. Soldani, D. A. Tamburri, and W.-J. Van Den Heuvel, “The pains and gains of microservices: A Systematic grey literature review,” Journal of Systems and Software, vol. 146, pp. 215–232, Dec. 2018.
- [3] Atlassian, “Calculating the cost of downtime,” accessed: April 15, 2025. [Online]. Available: https://www.atlassian.com/incident-management/kpis/cost-of-downtime
- [4] Gremlin, “The Cost of Downtime,” accessed: April 15, 2025. [Online]. Available: https://www.gremlin.com/blog/the-cost-of-downtime
- [5] J. Nobre, E. J. S. Pires, and A. Reis, “Anomaly detection in microservice-based systems,” Applied Sciences, vol. 13, no. 13, 2023.
- [6] S. Zhang, S. Xia, W. Fan, B. Shi, X. Xiong, Z. Zhong, M. Ma, Y. Sun, and D. Pei, “Failure diagnosis in microservice systems: A comprehensive survey and analysis,” ACM Trans. Softw. Eng. Methodol., Jan. 2025.
- [7] S. Luo, H. Xu, K. Ye, G. Xu, L. Zhang, G. Yang, and C. Xu, “The power of prediction: microservice auto scaling via workload learning,” in Proceedings of the 13th Symposium on Cloud Computing, ser. SoCC ’22. New York, NY, USA: Association for Computing Machinery, 2022, p. 355–369.
- [8] I. U. P. Gamage and I. Perera, “Using dependency graph and graph theory concepts to identify anti-patterns in a microservices system: A tool-based approach,” in 2021 Moratuwa Engineering Research Conference (MERCon), 2021, pp. 699–704.
- [9] G. Parker, S. Kim, A. A. Maruf, T. Cerny, K. Frajtak, P. Tisnovsky, and D. Taibi, “Visualizing anti-patterns in microservices at runtime: A systematic mapping study,” IEEE Access, vol. 11, pp. 4434–4442, 2023.
- [10] V. Seshagiri, D. Huye, L. Liu, A. Wildani, and R. R. Sambasivan, “[SoK] Identifying Mismatches Between Microservice Testbeds and Industrial Perceptions of Microservices,” Journal of Systems Research, vol. 2, no. 1, 2022.
- [11] S. Luo, H. Xu, C. Lu, K. Ye, G. Xu, L. Zhang, Y. Ding, J. He, and C. Xu, “Characterizing microservice dependency and performance: Alibaba trace analysis,” in Proceedings of the ACM Symposium on Cloud Computing, ser. SoCC ’21. New York, NY, USA: Association for Computing Machinery, 2021, p. 412–426.
- [12] G. Winchester, G. Parisis, and L. Berthouze, “On the temporal behaviour of a large-scale microservice architecture,” in NOMS 2023-2023 IEEE/IFIP Network Operations and Management Symposium, 2023, pp. 1–6.
- [13] D. Huye, Y. Shkuro, and R. R. Sambasivan, “Lifting the veil on Meta’s microservice architecture: Analyses of topology and request workflows,” in 2023 USENIX Annual Technical Conference (USENIX ATC 23). Boston, MA: USENIX Association, Jul. 2023, pp. 419–432.
- [14] Alibaba, “alibaba/clusterdata,” Mar. 2025, accessed: April 15, 2025. [Online]. Available: https://github.com/alibaba/clusterdata
- [15] X. Zhou, X. Peng, T. Xie, J. Sun, C. Ji, W. Li, and D. Ding, “Fault analysis and debugging of microservice systems: Industrial survey, benchmark system, and empirical study,” IEEE Transactions on Software Engineering, vol. 47, no. 2, pp. 243–260, 2021.
- [16] Y. Gan, G. Liu, X. Zhang, Q. Zhou, J. Wu, and J. Jiang, “Sleuth: A trace-based root cause analysis system for large-scale microservices with graph neural networks,” in Proceedings of the 28th ACM International Conference on Architectural Support for Programming Languages and Operating Systems, Volume 4, ser. ASPLOS ’23. New York, NY, USA: Association for Computing Machinery, 2024, p. 324–337.
- [17] Y. Gan, M. Liang, S. Dev, D. Lo, and C. Delimitrou, “Sage: practical and scalable ml-driven performance debugging in microservices,” in Proceedings of the 26th ACM International Conference on Architectural Support for Programming Languages and Operating Systems, ser. ASPLOS ’21. New York, NY, USA: Association for Computing Machinery, 2021, p. 135–151.
- [18] Q. Lin, H. Zhang, J.-G. Lou, Y. Zhang, and X. Chen, “Log clustering based problem identification for online service systems,” in 2016 IEEE/ACM 38th International Conference on Software Engineering Companion (ICSE-C), 2016, pp. 102–111.
- [19] J. Yang, Y. Guo, Y. Chen, Y. Zhao, Z. Lu, and Y. Liang, “Robust anomaly diagnosis in heterogeneous microservices systems under variable invocations,” in GLOBECOM 2022 - 2022 IEEE Global Communications Conference, 2022, pp. 2722–2727.
- [20] J. Lin, P. Chen, and Z. Zheng, “Microscope: Pinpoint performance issues with causal graphs in micro-service environments,” in Service-Oriented Computing, C. Pahl, M. Vukovic, J. Yin, and Q. Yu, Eds. Cham: Springer International Publishing, 2018, pp. 3–20.
- [21] Kubernetes, “Production-grade container orchestration,” accessed: April 15, 2025. [Online]. Available: https://kubernetes.io/
- [22] X. Zhang, X. Zheng, Z. Wang, H. Yang, Y. Shen, and X. Long, “High-density multi-tenant bare-metal cloud,” in Proceedings of the Twenty-Fifth International Conference on Architectural Support for Programming Languages and Operating Systems, ser. ASPLOS ’20. New York, NY, USA: Association for Computing Machinery, 2020, p. 483–495.
- [23] A. Cloud, “Application real-time monitoring service (arms) learning path - getting started with alibaba cloud,” accessed: April 15, 2025. [Online]. Available: www.alibabacloud.com/en/getting-started/learningpath/arms
- [24] Z. Cai, W. Li, W. Zhu, L. Liu, and B. Yang, “A real-time trace-level root-cause diagnosis system in alibaba datacenters,” IEEE Access, vol. 7, pp. 142 692–142 702, 2019.
- [25] B. H. Sigelman, L. A. Barroso, M. Burrows, P. Stephenson, M. Plakal, D. Beaver, S. Jaspan, and C. Shanbhag, “Dapper, a large-scale distributed systems tracing infrastructure,” Google, Inc., Tech. Rep., 2010, accessed: April 15, 2025. [Online]. Available: http://research.google.com/archive/papers/dapper-2010-1.pdf
- [26] Y. Gan, Y. Zhang, D. Cheng, A. Shetty, P. Rathi, N. Katarki, A. Bruno, J. Hu, B. Ritchken, B. Jackson, K. Hu, M. Pancholi, Y. He, B. Clancy, C. Colen, F. Wen, C. Leung, S. Wang, L. Zaruvinsky, M. Espinosa, R. Lin, Z. Liu, J. Padilla, and C. Delimitrou, “An open-source benchmark suite for microservices and their hardware-software implications for cloud & edge systems,” in Proceedings of the Twenty-Fourth International Conference on Architectural Support for Programming Languages and Operating Systems, ser. ASPLOS ’19. New York, NY, USA: Association for Computing Machinery, 2019, p. 3–18.
- [27] FudanSELab, “Fudanselab/train-ticket,” Apr. 2025, accessed: April 15, 2025. [Online]. Available: https://github.com/FudanSELab/train-ticket
- [28] G. C. Platform, “Googlecloudplatform/microservices-demo,” Apr. 2025, accessed: April 15, 2025. [Online]. Available: https://github.com/GoogleCloudPlatform/microservices-demo
- [29] OCP-Power-Demos, “ocp-power-demos/sock-shop-demo,” Apr. 2025, accessed: April 15, 2025. [Online]. Available: https://github.com/ocp-power-demos/sock-shop-demo
- [30] M. Ma, J. Xu, Y. Wang, P. Chen, Z. Zhang, and P. Wang, “Automap: Diagnose your microservice-based web applications automatically,” in Proceedings of WWW 2020. New York, NY, USA: Association for Computing Machinery, 2020, p. 246–258.
- [31] P. Chen, Y. Qi, and D. Hou, “Causeinfer: Automated end-to-end performance diagnosis with hierarchical causality graph in cloud environment,” IEEE TSC, vol. 12, no. 2, pp. 214–230, 2019.
- [32] J. Qiu, Q. Du, K. Yin, S.-L. Zhang, and C. Qian, “A causality mining and knowledge graph based method of root cause diagnosis for performance anomaly in cloud applications,” Applied Sciences, vol. 10, no. 6, 2020.
- [33] P. Wang, J. Xu, M. Ma, W. Lin, D. Pan, Y. Wang, and P. Chen, “Cloudranger: Root cause identification for cloud native systems,” in 2018 18th IEEE/ACM International Symposium on Cluster, Cloud and Grid Computing (CCGRID), 2018, pp. 492–502.
- [34] L. Mariani, C. Monni, M. Pezzé, O. Riganelli, and R. Xin, “Localizing faults in cloud systems,” pp. 262–273, 2018.
- [35] L. Wu, J. Tordsson, J. Bogatinovski, E. Elmroth, and O. Kao, “Microdiag: Fine-grained performance diagnosis for microservice systems,” in 2021 IEEE/ACM CloudIntelligence, 2021, pp. 31–36.
- [36] M. Ma, W. Lin, D. Pan, and P. Wang, “Ms-rank: Multi-metric and self-adaptive root cause diagnosis for microservice applications,” in 2019 IEEE ICWS, 2019, pp. 60–67.
- [37] ——, “Servicerank: Root cause identification of anomaly in large-scale microservice architectures,” IEEE Transactions on Dependable and Secure Computing, vol. 19, no. 5, pp. 3087–3100, 2022.
- [38] W. Lin, M. Ma, D. Pan, and P. Wang, “Facgraph: Frequent anomaly correlation graph mining for root cause diagnose in micro-service architecture,” in 2018 IEEE 37th International Performance Computing and Communications Conference (IPCCC), 2018, pp. 1–8.
- [39] R. Xin, P. Chen, and Z. Zhao, “Causalrca: Causal inference based precise fine-grained root cause localization for microservice applications,” J. Syst. Softw., vol. 203, no. C, Sep. 2023.
- [40] P. Spirtes, C. Glymour, and R. Scheines, Causation, Prediction, and Search, ser. Lecture Notes in Statistics. Springer, 1993, vol. 81.
- [41] D. Colombo and M. H. Maathuis, “Order-independent constraint-based causal structure learning,” J. Mach. Learn. Res., vol. 15, no. 1, 2014.
- [42] S. Shimizu, P. O. Hoyer, A. Hyvärinen, and A. Kerminen, “A linear non-gaussian acyclic model for causal discovery,” J. Mach. Learn., vol. 7, no. 72, pp. 2003–2030, 2006.
- [43] S. Shimizu, T. Inazumi, Y. Sogawa, A. Hyvärinen, Y. Kawahara, T. Washio, P. O. Hoyer, and K. Bollen, “Directlingam: A direct method for learning a linear non-gaussian structural equation model,” J. Mach. Learn. Res., vol. 12, p. 1225–1248, Jul 2011.
- [44] X. Zhou, X. Peng, T. Xie, J. Sun, C. Ji, D. Liu, Q. Xiang, and C. He, “Latent error prediction and fault localization for microservice applications by learning from system trace logs,” in Proceedings of the 2019 27th ACM Joint Meeting on European Software Engineering Conference and Symposium on the Foundations of Software Engineering, ser. ESEC/FSE 2019. New York, NY, USA: Association for Computing Machinery, 2019, p. 683–694.
- [45] I. Kohyarnejadfard, M. Shakeri, and D. Aloise, “System performance anomaly detection using tracing data analysis,” in Proceedings of the 2019 5th International Conference on Computer and Technology Applications, ser. ICCTA ’19. New York, NY, USA: Association for Computing Machinery, 2019, p. 169–173.
- [46] D. Scheinert, A. Acker, L. Thamsen, M. K. Geldenhuys, and O. Kao, “Learning dependencies in distributed cloud applications to identify and localize anomalies,” in 2021 IEEE/ACM International Workshop on Cloud Intelligence (CloudIntelligence), 2021, pp. 7–12.
- [47] K. Zhang, C. Zhang, X. Peng, and C. Sha, “Putracead: Trace anomaly detection with partial labels based on gnn and pu learning,” in 2022 IEEE 33rd International Symposium on Software Reliability Engineering (ISSRE), 2022, pp. 239–250.
- [48] M. Raeiszadeh, A. Ebrahimzadeh, A. Saleem, R. H. Glitho, J. Eker, and R. A. F. Mini, “Real-time anomaly detection using distributed tracing in microservice cloud applications,” in 2023 IEEE 12th International Conference on Cloud Networking (CloudNet), 2023, pp. 36–44.
- [49] P. Liu, H. Xu, Q. Ouyang, R. Jiao, Z. Chen, S. Zhang, J. Yang, L. Mo, J. Zeng, W. Xue, and D. Pei, “Unsupervised detection of microservice trace anomalies through service-level deep bayesian networks,” in 2020 IEEE 31st International Symposium on Software Reliability Engineering (ISSRE), 2020, pp. 48–58.
- [50] Y. Yang, L. Wang, J. Gu, and Y. Li, “Capturing request execution path for understanding service behavior and detecting anomalies without code instrumentation,” pp. 996–1010, 2023.
- [51] J. Xu, Y. Wang, P. Chen, and P. Wang, “Lightweight and adaptive service api performance monitoring in highly dynamic cloud environment,” in 2017 IEEE International Conference on Services Computing (SCC), 2017, pp. 35–43.
- [52] E. Wolff, Microservices: Flexible Software Architecture. Addison-Wesley Professional, Oct. 2016, iSBN: 9780134650449.
- [53] S. Newman, Building Microservices Second edition: Designing Fine-Grained Systems. Beijing Boston Farnham Sebastopol Tokyo: O’Reilly, Sep. 2021.
- [54] C. Richardson, Microservice Patterns: With examples in Java, 1st ed. Shelter Island, New York: Manning Publications, Feb. 2019.
- [55] Y. Liu, B. Yang, Y. Wu, C. Chen, and X. Guan, “How to share: Balancing layer and chain sharing in industrial microservice deployment,” IEEE Transactions on Services Computing, vol. 16, no. 4, pp. 2685–2698, 2023.
- [56] D. Huye, L. Liu, and R. R. Sambasivan, “Systemizing and mitigating topological inconsistencies in alibaba’s microservice call-graph datasets,” in Proceedings of the 15th ACM/SPEC International Conference on Performance Engineering, ser. ICPE ’24. New York, NY, USA: Association for Computing Machinery, 2024, p. 276–285.
- [57] A. Samir and C. Pahl, “Dla: Detecting and localizing anomalies in containerized microservice architectures using markov models,” in 2019 7th International Conference on Future Internet of Things and Cloud (FiCloud), 2019, pp. 205–213.
- [58] A. Samir, N. El Ioini, I. Fronza, H. R. Barzegar, V. T. Le, and C. Pahl, “Anomaly detection and analysis for reliability management clustered container architectures,” International Journal On Advances in Systems and Measurements, vol. 12, no. 3-4, p. 18, 2019.
- [59] Z. Li, J. Chen, R. Jiao, N. Zhao, Z. Wang, S. Zhang, Y. Wu, L. Jiang, L. Yan, Z. Wang, Z. Chen, W. Zhang, X. Nie, K. Sui, and D. Pei, “Practical root cause localization for microservice systems via trace analysis,” in 2021 IEEE/ACM 29th International Symposium on Quality of Service (IWQOS), 2021, pp. 1–10.
- [60] D. Liu, C. He, X. Peng, F. Lin, C. Zhang, S. Gong, Z. Li, J. Ou, and Z. Wu, “Microhecl: high-efficient root cause localization in large-scale microservice systems,” in Proceedings of the 43rd International Conference on Software Engineering: Software Engineering in Practice, ser. ICSE-SEIP ’21. IEEE Press, 2021, p. 338–347.
- [61] M. Pal, R. Roy, J. Basu, and M. S. Bepari, “Blind source separation: A review and analysis,” in 2013 International Conference Oriental COCOSDA, 2013, pp. 1–5.
- [62] G. Yu, P. Chen, H. Chen, Z. Guan, Z. Huang, L. Jing, T. Weng, X. Sun, and X. Li, “Microrank: End-to-end latency issue localization with extended spectrum analysis in microservice environments,” in Proceedings of the Web Conference 2021, ser. WWW ’21. New York, NY, USA: Association for Computing Machinery, 2021, p. 3087–3098.
- [63] M. Li, Z. Li, K. Yin, X. Nie, W. Zhang, K. Sui, and D. Pei, “Causal inference-based root cause analysis for online service systems with intervention recognition,” in Proceedings of the 28th ACM SIGKDD Conference on Knowledge Discovery and Data Mining, ser. KDD ’22. New York, NY, USA: Association for Computing Machinery, 2022, p. 3230–3240.
- [64] C. Lee, T. Yang, Z. Chen, Y. Su, and M. R. Lyu, “Eadro: An end-to-end troubleshooting framework for microservices on multi-source data,” in Proceedings of the 45th International Conference on Software Engineering, ser. ICSE ’23. IEEE Press, 2023, p. 1750–1762.
- [65] O. Vallis, J. Hochenbaum, and A. Kejariwal, “A novel technique for long-term anomaly detection in the cloud,” in Proceedings of the 6th USENIX Conference on Hot Topics in Cloud Computing, ser. HotCloud’14. USA: USENIX Association, 2014, p. 15.
- [66] S. Nedelkoski, J. Cardoso, and O. Kao, “Anomaly detection and classification using distributed tracing and deep learning,” in 2019 19th IEEE/ACM International Symposium on Cluster, Cloud and Grid Computing (CCGRID), 2019, pp. 241–250.
- [67] L. Meng, Y. Sun, and S. Zhang, “Midiag: A sequential trace-based fault diagnosis framework for microservices,” in Services Computing – SCC 2020: 17th International Conference, Held as Part of the Services Conference Federation, SCF 2020, Honolulu, HI, USA, September 18–20, 2020, Proceedings. Berlin, Heidelberg: Springer-Verlag, 2020, p. 137–144.
- [68] Z. Purfallah Mazraemolla and A. Rasoolzadegan, “An effective failure detection method for microservice-based systems using distributed tracing data,” Engineering Applications of Artificial Intelligence, vol. 133, p. 108558, 2024.
- [69] M. Panahandeh, A. Hamou-Lhadj, M. Hamdaqa, and J. Miller, “Serviceanomaly: An anomaly detection approach in microservices using distributed traces and profiling metrics,” J. Syst. Softw., vol. 209, no. C, Mar. 2024.
- [70] T. Wang, W. Zhang, J. Xu, and Z. Gu, “Workflow-aware automatic fault diagnosis for microservice-based applications with statistics,” IEEE Transactions on Network and Service Management, vol. 17, no. 4, pp. 2350–2363, 2020.
- [71] L. Meng, F. Ji, Y. Sun, and T. Wang, “Detecting anomalies in microservices with execution trace comparison,” Future Generation Computer Systems, vol. 116, pp. 291–301, 2021.
- [72] G. Yu, Z. Huang, and P. Chen, “Tracerank: Abnormal service localization with dis-aggregated end-to-end tracing data in cloud native systems,” Journal of Software: Evolution and Process, vol. 35, no. 10, p. e2413, 2023.
- [73] A. Gluck. (2020, Jul.) Introducing domain-oriented microservice architecture. Accessed: April 15, 2025. [Online]. Available: https://www.uber.com/en-GB/blog/microservice-architecture/
- [74] B. Steer, N. A. Arnold, C. Tidiane, R. Lambiotte, H. Yousaf, L. Jeub, F. Murariu, S. Kapoor, P. Rico, R. Chan, L. Chan, J. Alford, R. G. Clegg, F. Cuadrado, M. R. Barnes, P. Zhong, J. Pougué-Biyong, and A. Alnaimi, “Raphtory: The temporal graph engine for rust and python,” Journal of Open Source Software, vol. 9, no. 95, p. 5940, 2024.
- [75] C. Delimitrou, “DeathStarBench,” accessed: April 15, 2025. [Online]. Available: https://github.com/delimitrou/DeathStarBench
- [76] Cisco DevNet, “CiscoDevNet/bookinfo‑cloudnative‑sample,” Jan. 2025, accessed: 9 Apr. 2025. [Online]. Available: https://github.com/CiscoDevNet/bookinfo-cloudnative-sample
- [77] A. Gulenko, F. Schmidt, A. Acker, M. Wallschläger, O. Kao, and F. Liu, “Detecting anomalous behavior of black-box services modeled with distance-based online clustering,” in 2018 IEEE 11th International Conference on Cloud Computing (CLOUD), 2018, pp. 912–915.
- [78] L. Wu, J. Tordsson, E. Elmroth, and O. Kao, “Microrca: Root cause localization of performance issues in microservices,” in NOMS 2020 - 2020 IEEE/IFIP Network Operations and Management Symposium, 2020, pp. 1–9.
- [79] M. Jin, A. Lv, Y. Zhu, Z. Wen, Y. Zhong, Z. Zhao, J. Wu, H. Li, H. He, and F. Chen, “An anomaly detection algorithm for microservice architecture based on robust principal component analysis,” IEEE Access, vol. 8, pp. 226 397–226 408, 2020.
- [80] L. Wu, J. Bogatinovski, S. Nedelkoski, J. Tordsson, and O. Kao, “Performance diagnosis in cloud microservices using deep learning,” in Service-Oriented Computing – ICSOC 2020 Workshops: AIOps, CFTIC, STRAPS, AI-PA, AI-IOTS, and Satellite Events, Dubai, United Arab Emirates, December 14–17, 2020, Proceedings. Berlin, Heidelberg: Springer-Verlag, 2020, p. 85–96.
- [81] G. Tene, “giltene/wrk2,” Jul. 2024, accessed: 9 Apr. 2025. [Online]. Available: https://github.com/giltene/wrk2
- [82] G. Winchester, “Processed Alibaba microservices-v2022 Dataset,” 2018, accessed: April 15, 2025. [Online]. Available: www.kaggle.com/datasets/gileswinchester/processed-alibaba-microservices-v2022-dataset
- [83] Locust.io, “Locust.io,” accessed: 2025-04-11. [Online]. Available: https://locust.io/