The RESOLVE and ECO G3 Initiative: Drivers of H I Content and X-ray Emission in Galaxy Groups
Abstract
Adding to the RESOLVE and ECO Gas in Galaxy Groups (G3) initiative, we examine possible drivers of group-integrated HI-to-halo mass ratios () and group X-ray emission, including group halo mass (), virialization as probed by crossing time (), presence of active galactic nuclei (AGN), and group-integrated fractional stellar mass growth rate (FSMGRgrp). G3 groups span with comprehensive HI and AGN information, which we combine with X-ray stacking of ROSAT All-Sky data. We detect hot gas emission exceeding AGN and X-ray binary backgrounds confidently for and unambiguously for , reflecting an inverse dependence of and hot gas emission on halo mass. At fixed halo mass, transitions to greater spread below Gyr. Dividing groups across this transition, lower- groups show elevated X-ray emission compared to higher- groups for , but this trend reverses for . Additionally, AGN-hosting halos below exhibit a broad, 0.25 dex deep valley in compared to non-AGN-hosting halos with correspondingly reduced FSMGRgrp. When diluted by non-AGN-hosting halos, this valley becomes shallower and narrower, falling roughly between and in the overall vs. relation. We may also detect a second, less easily interpreted valley at . Neither valley matches theoretical predictions of a deeper valley at or above .
1 Introduction
Neutral atomic hydrogen (H I) is the primary mass component of the interstellar medium in galaxies like the Milky Way (Kalberla & Kerp, 2009). Given its role in fueling star formation and AGN activity, H I is a crucial ingredient in galaxy evolution. To investigate how environment affects the H I content of galaxies and groups, recent observations and models have addressed the group H I–halo mass relation (here, the – relation, where “halo” refers to the shared group halo; if a halo contains only one galaxy, we call it an group). The – relation describes the total H I mass contained by a halo as a function of dark matter halo mass, and as such, its shape and scatter reflect cosmic gas accretion, assembly history, and feedback from active galactic nuclei (AGN) and star formation (Obuljen et al., 2019). Previous observations of this relation indicate (i) a transition to a shallower slope above , corresponding to the peak integrated H I-to-halo mass ratio, and (ii) a substantial scatter of at least 0.3 dex, suggesting that secondary factors regulate group H I content at fixed halo mass (Eckert et al., 2017; Obuljen et al., 2019; Guo et al., 2020; Dev et al., 2023; Hutchens et al., 2023; Saraf et al., 2024). In this paper, we investigate some of these secondary factors — virialization state, star formation, and AGN content — and relate them to both H I content and hot gas traced by X-ray emission.
In theoretical models, virial shocks are believed to be the primary halo mass-dependent mechanism of gas heating in groups. In the model of Dekel & Birnboim (2006, hereafter DB06), the onset of virial shock heating within occurs at the same scale where the – relation transitions in slope. This “gas-richness threshold scale” (as named by Kannappan et al., 2009 due to the preponderance of H I gas-dominated galaxies below it; see also Dekel & Silk, 1986; Garnett, 2002; Dalcanton et al., 2004; Kannappan, 2004; Kannappan et al., 2013) corresponds approximately to a stellar mass for the central galaxy of via the stellar mass–halo mass relation (Behroozi et al., 2010). Below the corresponding halo mass, theory predicts efficient gas cooling (Birnboim & Dekel, 2003; Kereš et al., 2005; Dekel & Birnboim, 2006; Nelson et al., 2013), as evidenced by the rapid refueling and stellar mass growth of galaxies in this regime (Kannappan et al., 2013). Slow, inefficient accretion is expected above the higher “bimodality scale” (corresponding to central galaxy ), where the Dekel & Birnboim (2006) model predicts full halo gas heating (see also, e.g., Gabor & Davé, 2015) and where observations show changes in galaxy morphology and stellar populations (Kauffmann et al., 2003). These critical transitions in galaxy properties suggest that halo-driven gas heating may suppress galaxy H I content via stripping and starvation. While hot gas halos have been detected in high-mass groups (Sun et al., 2009; Eckmiller et al., 2011; Anderson et al., 2015; Jakobs et al., 2018) and down to (Kim & Fabbiano, 2013; Goulding et al., 2016; Forbes et al., 2017; Bogdán & Vogelsberger, 2022; Zhang et al., 2024), these studies have generally not examined the interdependence of hot gas and H I gas as a function of halo mass or other group properties, such as virialization state. Prior work connecting group hot and cold gas content has largely focused on single groups or small samples of compact groups (e.g., Rasmussen et al., 2012; Desjardins et al., 2014; O’Sullivan et al., 2018).
The dynamical state of a group may affect gas heating at fixed halo mass. As the dynamical evolution of a group progresses, simulations suggest that major and minor mergers may result in shocks that heat, and generate turbulence within, the intragroup medium (Sinha & Holley-Bockelmann, 2009; Shi et al., 2020). In a small sample of NGC groups, Wilcots (2009) found that dynamically evolved groups host predominantly hot and ionized gas content, whereas dynamically young groups are more H I-rich. The importance of group assembly in regulating H I content is demonstrated in the results of Hess & Wilcots (2013), who found that H I-rich galaxies preferentially reside on the outskirts of groups, and that the infall of H I-rich satellites is crucial to replenish H I in group halos. Additionally, in a study of 172 SDSS groups with halo masses , Ai & Zhu (2018) showed that group H I-to-halo mass ratios decrease with decreasing crossing time, corresponding to lower- states. Further analysis is needed to assess whether the relationship between group H I content and crossing time extends to lower-mass halos, and if so, what physical processes drive the relationship.
Star formation (SF) and AGN are also expected to affect group H I content at fixed halo mass, via feedback within halos. In semi-analytic models, Eckert et al. (2017) found that ratios of hot halo gas to cold galaxy gas become widely varying in the regime, likely reflecting a transition in the dominant feedback source from SF to AGN. In lower-mass halos, SF feedback is expected from supernovae or the winds of young, massive stars; in higher-mass halos, AGN feedback is expected to heat or expel halo gas, thereby suppressing star formation or gas cooling (Somerville et al., 2008; Gaspari et al., 2014; Fielding et al., 2017). AGN feedback in dwarf galaxies may also lead to H I suppression in low-mass halos, as seen in the model of Dashyan et al. (2018) and observations of Bradford et al. (2018), in which dwarf galaxies are defined by virial mass and stellar mass , respectively. Without special attention to dwarf AGN, recent theoretical models of the – relation have predicted an AGN-driven “dip” at (Kim et al., 2017; Baugh et al., 2019; Chauhan et al., 2020). This dip has evaded direct observation, possibly being eroded by observational systematics (Chauhan et al., 2021). A fresh look with attention to dwarf AGN is warranted, given dramatic improvements in their detection (Polimera et al., 2022; Mezcua & Sánchez, 2024).
In this paper, we ask three questions about the drivers of group H I and hot gas:
-
1.
How do group cold gas and X-ray emission depend on halo mass?
-
2.
How do group cold gas and X-ray emission depend on virialization state at fixed halo mass?
-
3.
How do group cold gas and X-ray emission depend on AGN prevalence and recent (last Gyr) star formation history at fixed halo mass?
To answer these three questions, we combine archival ROSAT All-Sky Survey data (RASS; Voges, 1993) with data from the Gas in Galaxy Groups (G3) initiative, a spinoff of the highly complete and volume-limited RESOLVE (REsolved Spectroscopy Of a Local VolumE; Kannappan & Wei, 2008) and ECO (Environmental COntext; Moffett et al., 2015) surveys. RESOLVE and ECO provide a complete census of a combined 456,300 Mpc-3 volume of the Universe, with comprehensive H I mass, star formation history, and AGN data extending down to the dwarf regime, as needed to answer these questions. In G3 Paper I (Hutchens et al., 2023, hereafter H23), we constructed a group catalog for these surveys with optimal purity, completeness, and halo mass estimation. By stacking RASS imaging of G3 groups, we can analyze X-ray emission in relation to group H I content, virialization state, star formation, and AGN activity.
This paper proceeds as follows. We describe the RASS data and the optical group catalogs for the G3 initiative in §2. We describe our methods for reprocessing and stacking RASS imaging in §3. We outline our results in §4 and discuss their implications in §5. Finally, we summarize our findings in §6. Throughout this work, we adopt a cosmology with , , and .
2 Data
2.1 RESOLVE and ECO Gas in Galaxy Groups
In this section, we describe RESOLVE, ECO, and the G3 group catalogs.
2.1.1 RESOLVE
RESOLVE is a highly complete, volume- and luminosity-limited census of stellar, gas, and dynamical mass in 53,000 Mpc3 of the local Universe (Kannappan & Wei, 2008). It contains 1,600 galaxies in two equatorial strips, RESOLVE-A (, ) and RESOLVE-B (, ).111For both RESOLVE and ECO, our reported R.A. and Decl. ranges are in the J2000 coordinate frame. Both RESOLVE-A and RESOLVE-B are limited by , where is the Local Group-corrected recessional velocity of the galaxy’s group, described further in §2.1.3. RESOLVE-A is complete to in the SDSS band, while RESOLVE-B (overlapping the deeper Stripe 82 region) is complete to (Eckert et al., 2015, 2016). Thus, defining dwarfs as galaxies with , RESOLVE is dwarf-dominated. RESOLVE data products include custom-reprocessed UV-to-NIR photometry as well as stellar masses and star formation history data derived from stellar population synthesis modeling (Eckert et al., 2015, based on Kannappan et al., 2013).
RESOLVE also provides a comprehensive atomic gas census that offers H I detections or strong upper limits () for 94% of galaxies (Stark et al., 2016, updated in H23). These measurements were derived from targeted Arecibo and Green Bank Telescope observations (Stark et al., 2016) and supplemented by archival data from ALFALFA (Haynes et al., 2011, 2018) and Springob et al. (2005). Cases of confusion were identified automatically by searching for companions in existing redshift surveys, and deconfusion was attempted as outlined by Stark et al. (2016). A majority (81%) of RESOLVE’s H I gas masses are based on such clean H I detections, successfully deconfused detections, or strong upper limits, which we treat as best estimates of H I mass. For the remaining 19% of cases (missing 21cm observations, weak upper limits, or confused detections that could not be deconfused), H23 estimated H I gas masses using the photometric gas fractions technique (Kannappan, 2004; Eckert et al., 2015), as constrained by weak upper limits or confused total fluxes when available.
In addition to photometry and H I mass information, the present work uses RESOLVE’s AGN inventory (M.S. Polimera et al. 2025, in prep.). One of the advantages of our analysis is that this AGN catalog provides a uniform and unusually complete selection of low-mass galaxy AGN, found using both optical emission line diagnostics (which reveal the new “SF-AGN” class of low-metallicity/star-forming AGN found by Polimera et al., 2022 and additional dwarf AGN identified by the loosened BPT diagnostic of Stasińska et al., 2006) and mid-IR color diagnostics (which are sensitive to a complementary set of dwarf AGN candidates; Satyapal et al., 2018; M.S. Polimera et al. in prep., 2025; see §4.3 regarding reliability concerns for mid-IR AGN). Additionally, the catalog provides cross-matched data on previously identified X-ray AGN (Ranalli et al., 2003), broad-line AGN (Liu et al., 2019), and other AGN cross-matched from the literature (Véron-Cetty & Véron, 2006; Flesch, 2015).
2.1.2 ECO
The Environmental COntext (ECO; Moffett et al., 2015, updated by H23) catalog surrounds RESOLVE-A in a 10 times larger volume of 440,000 Mpc-3. ECO’s larger volume supports the smaller but superior RESOLVE survey by enabling larger-sample studies of environment and assessment of cosmic variance. The ECO volume is defined by , , and . ECO reaches the same luminosity completeness floor as RESOLVE-A (), but is purely archival, except where new observations were incorporated via its overlap with RESOLVE-A. All ECO data products, including photometry and H I mass information, were processed using RESOLVE pipelines to improve quality and harmonize the two surveys. Like RESOLVE, ECO offers a uniform and unusually complete AGN catalog based on multiple optical emission line diagnostics and mid-IR colors, which also provides cross-matched data on known broad-line AGN, X-ray AGN, and other AGN from the literature (see §2.1.1).
Additionally, ECO contains a flux-limited census of H I gas comprised of inherited RESOLVE-A observations and cross-matched sources from ALFALFA (Haynes et al., 2018), including new upper limits and confusion flags (see H23). As for RESOLVE, H23 computed the best H I mass estimate for each ECO galaxy by combining clean H I detections, upper limits, confused fluxes, and constrained photometric gas fraction estimates (see §2.1.1), with the exception that deconfusion was not attempted for confused ECO galaxies outside RESOLVE-A. For these confused sources in ECO, H I mass estimates are always from photometric gas fractions constrained by confused fluxes. For the entire ECO survey, 45% of our best H I mass estimates are based on clean detections, strong upper limits, or (in the RESOLVE-A overlap region only) de-confused observations; the remaining 55% are photometric gas fraction estimates for galaxies with weak upper limits, confused 21cm observations, or missing 21cm observations.
2.1.3 G3 Groups
The group catalogs used for our X-ray stacking analysis were created by H23 using the Gas in Galaxy Groups (G3) group finder, whose four-step algorithm offers improved completeness and halo mass recovery compared to friends-of-friends group finding. For the analysis in this paper, we combine the G3 group catalogs from RESOLVE-B and ECO (where the latter includes RESOLVE-A). We selected groups whose most luminous galaxies (which we refer to as “centrals”) are above the survey luminosity floors and whose average group redshifts fall within the respective survey redshift ranges of (ECO) or (RESOLVE-B). The selection on mitigates the clipping of groups when galaxy peculiar velocities would otherwise have extended beyond the survey redshift limits. The resulting selection yields 6,949 groups with halo masses spanning , consisting of 6,038 groups, 512 galaxy pairs, and 399 groups with galaxies. We exclude the Coma cluster from our stacking analyses, as its intense X-ray emission makes it an outlier among our other massive groups, so our final sample consists of 910 groups/pairs and 6,038 groups.
2.1.4 G3 Group Properties
In our analysis in §4, we use RESOLVE and ECO data to compute four main group properties needed to answer the questions introduced in §1:
-
1.
Group halo mass : Group halo masses for G3 groups were derived in H23 using abundance matching (Kravtsov et al., 2004; Blanton & Berlind, 2007). With this technique, H23 built a one-to-one monotonic relationship between group halo mass and group-integrated -band luminosity using the theoretical halo mass function of Tinker et al. (2008). The derived halo masses and radii assume a mean background overdensity of , representing the boundary of the virialized halo (e.g., D’Onghia et al., 2005). Compared to the common alternatives of 200 or 500, our halo masses scale as and . Since halo radii , our virial radii scale as and (see Hu & Kravtsov, 2003).
-
2.
Group-integrated H I Mass : As in H23, we compute group-integrated H I mass by summing galactic H I mass estimates for group members.222Given the sizes of the Arecibo and GBT beams, our galactic H I masses may sometimes include intragroup gas and/or gas-rich, optically undetected satellite galaxies. However, given that intragroup H I outweighs galactic H I by at most a factor of 1.5–2 even in intragroup-dominant systems (Van Driel et al., 1992; Borthakur et al., 2015), we do not expect a significant contribution from intragroup H I affecting our results. In fact, our group H I masses are largely consistent with those of Guo et al. (2020), who measured the H I–halo mass relation using a stacking method that intrinsically includes intragroup H I (see H23). These H I mass estimates are a combined dataset of clean H I detections, strong upper limits, deconfused H I detections, and estimates from photometric gas fractions (possibly constrained by upper limit/confused flux data; see H23 for a description of how this method incorporates upper limit and confused data). For groups, is the . In §4, we derive errors on median values using bootstrapping with 5,000 resamples.
-
3.
Group-integrated fractional stellar mass growth rate : The galaxy fractional stellar mass growth rate () is the ratio of stellar mass formed within the past Gyr, , to the preexisting stellar mass formed over all previous Gyr, (Kannappan et al., 2013). We calculate FSMGR using the SED modeling code of Kannappan et al. (2013, based on , ), which uses our custom NUV to IR photometry (see Eckert et al., 2015; Moffett et al., 2015; H23). We prefer FSMGR as a SF metric over the common alternative, specific star formation rate (), because FSMGR is better suited to probe high fractional growth regimes of star formation: an FSMGR can reach arbitrarily large values, whereas an sSFR approaches an asymptotic maximum as recent stellar mass growth increases, contributing to both SFR and . We calculate group-integrated FSMGR as , where these sums are computed over all group members. For groups, is the galaxy FSMGR. In §4, we derive errors on median values using bootstrapping with 5,000 resamples.
-
4.
Group crossing time : To assess virialization state, we use the crossing time (Rood & Dickel, 1978; see also Ferguson & Sandage, 1990; Firth et al., 2006), where and are the mean projected transverse distance and mean absolute line-of-sight velocity, respectively, for grouped galaxies relative to their average group center (see §2.2 below). This metric represents the mean time for a galaxy to traverse the group, and is usually expressed relative to the age of the Universe (Hickson et al., 1992). A system of galaxies freely expanding with the Hubble flow will have a crossing time comparable to the age of the Universe, whereas if the crossing time is short compared to the age of the Universe, then the group is a bound, virialized system (Gott III & Turner, 1977). Unlike other virialization metrics (e.g., the Dressler-Shectman statistic; Dressler & Shectman, 1988), can be calculated for all groups. However, we note that is a noisy metric of virialization, being both subject to observational projection effects and sensitive to abrupt changes due to merging (e.g., when the smallest values are eliminated after a merger).
2.2 ROSAT All-Sky Survey Data
We use archival X-ray imaging from the ROSAT All-Sky Survey (RASS; Voges, 1993; Snowden et al., 1994). The RASS survey was conducted in scanning mode using ROSAT’s Position Sensitive Proportional Counters (PSPC) to observe 1,378 fields in three energy bands. We obtained broad band (0.1–2.3 keV, PSPC channels 11–235) and hard band (0.44–2.04 keV, PSPC channels 52–201) photon count maps, exposure maps, and background count maps via HEASARC333https://heasarc.gsfc.nasa.gov/ (High Energy Astrophysics Science Research Center). Since we obtained the most significant results in the RASS hard band, we do not show broad band stacking results in this paper. For each G3 group, we extracted custom-mosaicked maps at the average group center (see H23), using the Python library reproject to ensure flux conservation. While the location of the brightest cluster galaxy (BCG) is a common alternative to the average group center, Skibba et al. (2011) showed that 25%–40% of BCGs in halos of mass are not actually the galaxies with the lowest specific potential energies in their halos. Moreover, Gozaliasl et al. (2019) measured considerable 0.2–0.3 offsets between BCGs and X-ray centroids of groups, which depend on both halo mass and magnitude gap (probing virialization state). These findings suggest that the position of the BCG is not the optimal location to stack X-ray emission in groups.
3 RASS Image Processing & Stacking
In this section, we outline our four-step strategy for reprocessing and stacking RASS data: (1) image masking to remove extraneous point and diffuse sources, (2) image scaling and cropping to enable stacking on a common scale, (3) group image stacking, and (4) random image stacking.
3.1 Source Masking
We implemented source masking to exclude nearby extraneous sources as well as to separate point-source (including unresolved galaxy) emission from extended emission within our groups. To do so, we applied an iterative sigma-clipping algorithm from the photutils Python library (Price-Whelan et al., 2022) to detect and then mask any sources lying outside the group virial radius in each image. This code creates a segmentation map in which sources may have arbitrary geometries, allowing us to mask both point and extended sources. In addition, we masked sources listed in the Second ROSAT X-ray Source catalog (2RXS; Boller et al., 2016). To select sources for masking from 2RXS, we excluded 2RXS objects with detection likelihood EXI_ML , which lowers the 2RXS spurious source fraction to 5% (see Boller et al., 2016). We also excluded nine 2RXS sources that cross-matched to RESOLVE or ECO galaxies within (the median effective radius of RESOLVE/ECO galaxies), as for some analyses we choose to include galactic emission and do not want these galaxies to be automatically masked. We automatically masked the remaining 2RXS point sources (EXI_ML and not cross-matched to RESOLVE/ECO) as described below.
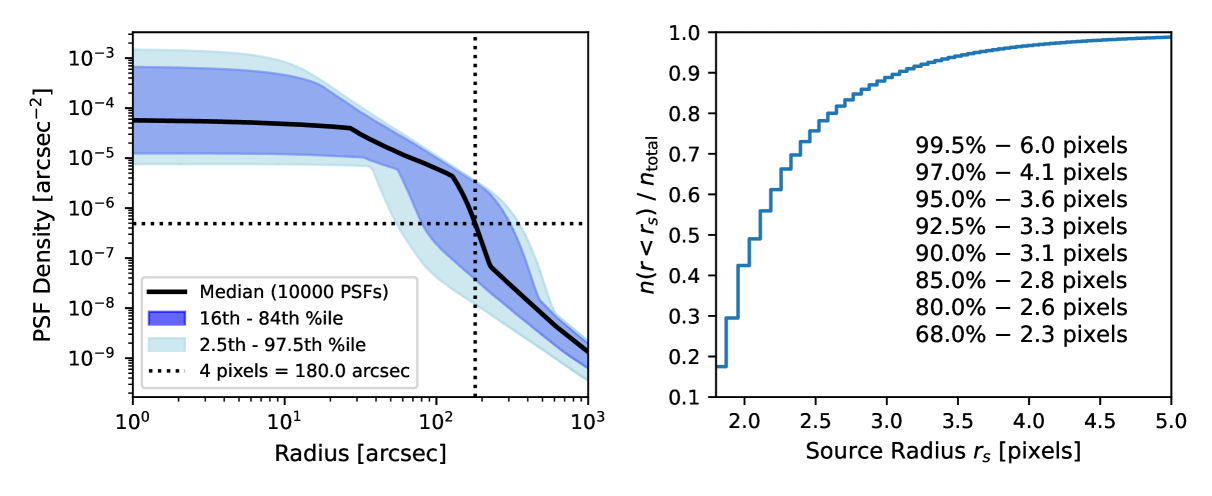
To determine mask apertures for both RESOLVE/ECO AGN galaxies and 2RXS sources, we considered whether these sources could be matched to sources identified by our sigma-clipping algorithm. If so, we extracted masks from the segmentation map, which naturally provides a custom aperture for each source. If the RESOLVE/ECO AGN or 2RXS source was not detected by the sigma-clipping algorithm, we applied a circular mask with radius 4 pixels, where each RASS pixel is . As illustrated in Figure 1, this value was chosen because 97% of the sources identified by the sigma-clipping algorithm can be enclosed by such an aperture. Figure 1 also shows that the median PSF of the PSPC reaches 1% of its maximum strength at this 4-pixel radius. We compute the median PSF from a sample of PSFs generated at random 0.44–2.04 keV photon energies and off-axis angles (the PSPC field of view), based on the analytic formula for the PSPC PSF (Boese, 2000). This statistical PSF computation is necessary because RASS imaging data are coadds of multiple visits to each field; thus, sources in the RASS data have been observed at a variety of unknown off-axis angles.
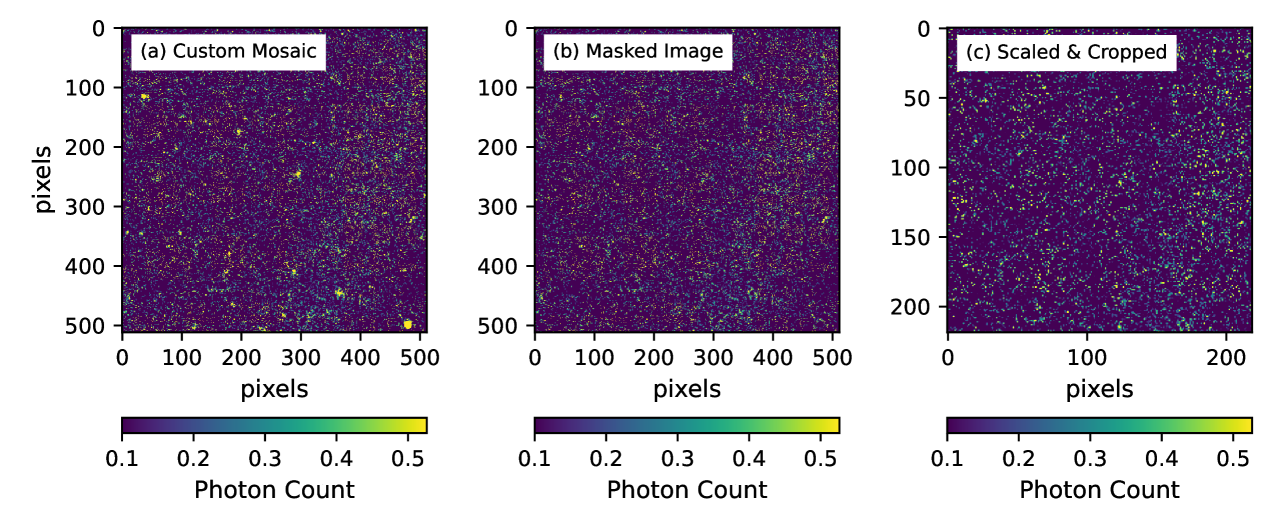
In §4, to separate galactic and intragroup X-ray emission, we provide stacking results both with AGN masked and with AGN unmasked. In the former, we masked the locations of all RESOLVE and ECO AGN contained within the custom-mosaicked count maps. For both masked AGN and 2RXS sources, we replace masked regions with the background count level. Figure 2 illustrates an example of this masking procedure.
3.2 Scaling and Cropping Images
Since we wish to stack images of groups at different distances, it is crucial that we add RASS images on a consistent scale. Following Dai et al. (2007), we scaled our masked group images to a common kpc/degree scale matching the outer distance of the ECO survey (100 Mpc for our chosen Hubble constant ) to ensure that all pixel resampling combines rather than oversamples pixels. The original masked mosaics are then contained within an inner square region of the scaled image, bordered by zeros. The scaled images conserve the number of photons in the original image, with a typical error of 1%. Conservation of photon number is appropriate, as this rescaling procedure is not meant to simulate artificial redshifting of groups. Rather, it enables us to stack individual group images on a common physical scale, i.e., to ensure that halos of the same mass are stacked consistently even if they are located at different distances. We also applied this same scaling procedure to our exposure and background count maps, which are needed to perform stacking.
Prior to stacking, we cropped our scaled count, exposure, and background maps to centered pixel cutouts. At the RASS pixel scale and our outer survey distance limit of 100 Mpc, the 219 pixel image width corresponds to 4.7 Mpc on-sky. Importantly, cropping to removes the zero-containing border regions left over from image scaling, even for the nearest ECO galaxy groups at 42.9 Mpc (noting that ), but still comfortably contains our largest groups with Mpc. The last panel of Figure 2 shows an example of a scaled and cropped count map.
3.3 Image Stacking and SNR Calculation
In §4, we present X-ray stacking results binned by halo mass and other group properties. To construct the stacked images, we applied stacking methods from prior RASS analyses (Dai et al., 2007; Anderson et al., 2012, 2015). For each stacking bin consisting of a set of groups, we have a set of masked count maps , exposure maps , and background maps . We summed these sets to obtain a stacked count map in counts, a stacked exposure map in seconds, and a stacked background map in counts. We compute the final background-subtracted intensity map for each stack as , in units of counts per second.444We note that averaging intensity maps directly, i.e., , will yield the same result when is the same for all groups. However, RASS coadd exposure times vary substantially across the sky (e.g., Voges et al., 1999 Figure 1), so we follow Dai et al. (2007) and Anderson et al. (2015) in using . This definition provides a more robust average, especially for our low stacks.
For each stack, we have accounted for source confusion by excluding pairs of groups whose angular separation is less than either of their individual virial radii (i.e., at least one of the groups resides within of the other in projection). However, since intragroup X-ray emission is typically concentrated to only 0.1–0.5 (Mulchaey, 2000), and because low-mass groups are less likely to show bright X-ray emission, we made an exception if the two confused groups have drastically different mass (1 dex) and are separated by more than , where is the virial radius of the lower-mass group and is the virial radius of the higher-mass group. In these cases, the lower-mass group is unlikely to contaminate the X-ray stack containing the higher-mass group, so we only excluded the lower-mass group. Based on this definition of confusion, we have flagged and excluded 21% of our groups from stacking. The fraction of groups retained as a function of halo mass is approximately constant at 70-80%.
After constructing stacks and excluding confused objects, we computed the X-ray signal-to-noise ratio (SNR) within for each stack, where is calculated using the halo mass at the bin center. The choice of stems from the typical concentration of emission in X-ray–detected galaxy groups (Mulchaey, 2000). Following De Grandi et al. (1997), we calculate the SNR as , where and are the numbers of source counts and total (background + source) counts, respectively, within the aperture. We report an SNR of zero when the stacked background-subtracted count rate is zero or negative, which is possible because the RASS background maps are smooth whereas the RASS count maps are noisy. We also compute the total count rate within , as well as its uncertainty , where is the root-mean-square noise of the intensity map and is the number of pixels in the aperture.
3.4 Randomized Stacking
SNR alone is not sufficient to justify a claim that we have detected diffuse X-ray emission associated with G3 groups, as (compact or diffuse) foreground or background X-ray sources landing within the group virial radius could create a false signal. To quantify possible contributions from such sources, we replicated our data processing and stacking procedures using a set of images extracted at random sky positions. We generated 4,093 (the total number of groups with , our largest stacking bin) sets of count maps, exposure maps, and background count maps at R.A. and Dec sampled randomly from the RESOLVE and ECO footprints, avoiding sky positions within projected of any known groups. By extracting these images within the RESOLVE and ECO footprints, we have avoided Galactic X-ray emission at low Galactic latitudes and ensured that our random images have the same statistical properties as the G3 group images.
For each stacking bin containing G3 groups, we sampled the 4,093 image-sets with replacement to create 30 random image set samples. For each of the 30 samples, we masked, scaled, cropped, and stacked the random images so that they were processed identically to the image-sets for the corresponding G3 groups assigned to that bin. The final product for each bin is a set of 30 stacks, which allows us to analyze the distributions of SNR and integrated count rate found in random image stacks.
3.5 Estimating X-ray Binary Contributions
In §4, to help understand the origins of our stacked X-ray emission, we have provided for each stacking result the expected count rate from low-mass and high-mass X-ray binaries (LMXBs and HMXBs). To estimate these contributions, we considered multiple estimates of XRB scaling relations from the literature, including estimates for LMXB-only emission (David et al., 2006; Boroson et al., 2011; Lehmer et al., 2020), HMXB-only emission (Mineo et al., 2012, 2014; Lehmer et al., 2022), and total XRB emission (Colbert et al., 2004; Lehmer et al., 2010, 2019, 2024). Including all possible pairs of these LMXB-only and HMXB-only estimators, we obtained 13 distinct estimators of total XRB emission. Next, for each stack, we computed exposure-weighted mean group-integrated properties (e.g., SFR, sSFR, , ) as needed to evaluate these estimators and derive expected XRB luminosity estimates for the stack. Finally, we converted these luminosities to fluxes, and converted the fluxes to expected RASS count rates using the PIMMS software (Portable, Interactive, Multi-Mission Software; Mukai, 1993). We used each paper’s reported spectral model to convert to the PSPC hard band, correcting for foreground absorption using Galactic H I column densities from the gdpyc Python library, which are based on the Leiden/Argentine/Bonn Galactic H I Survey (Kalberla et al., 2005).
Using these 13 estimators, we report for each stack in §4 the minimum and maximum estimated XRB contributions and our preferred estimated XRB contribution. The XRB contribution increases with group halo mass for all estimators due to the underlying increase of group with increasing halo mass. We have chosen the relation of Lehmer et al. (2019) as our default XRB estimator because (i) it is derived using a robust statistical sample of nearby galaxies with diverse morphologies, masses, and star formation rates, and (ii) it predicts RASS count rates consistent with our measured AGN-masked count rates within the uncertainties at low , where X-ray emission should be dominated by XRBs.555We prefer the relation of Lehmer et al. (2019) to that of Lehmer et al. (2024) because the latter yields XRB estimates that are systematically higher than our measured count rates in bins where the emission should be dominated by XRBs. The estimates from Lehmer et al. (2024) exceed our AGN-masked count rates in the three halo mass bins spanning , and they also exceed our total count rates (with AGN still included) in the and bins (see §4). Notwithstanding the good reasons for this choice of preferred estimator, we note that accurately estimating the contribution from XRBs is one of the greatest areas of uncertainty in this work and similar group X-ray stacking studies.
When analyzing X-ray stacks with AGN-host galaxies masked, we excluded these AGN-host galaxies’ XRB contributions from our expected XRB count rate calculation, as any XRB emission from these galaxies will have been excluded by the AGN masks.
4 Results
4.1 How do cold gas and group X-ray emission depend on halo mass?
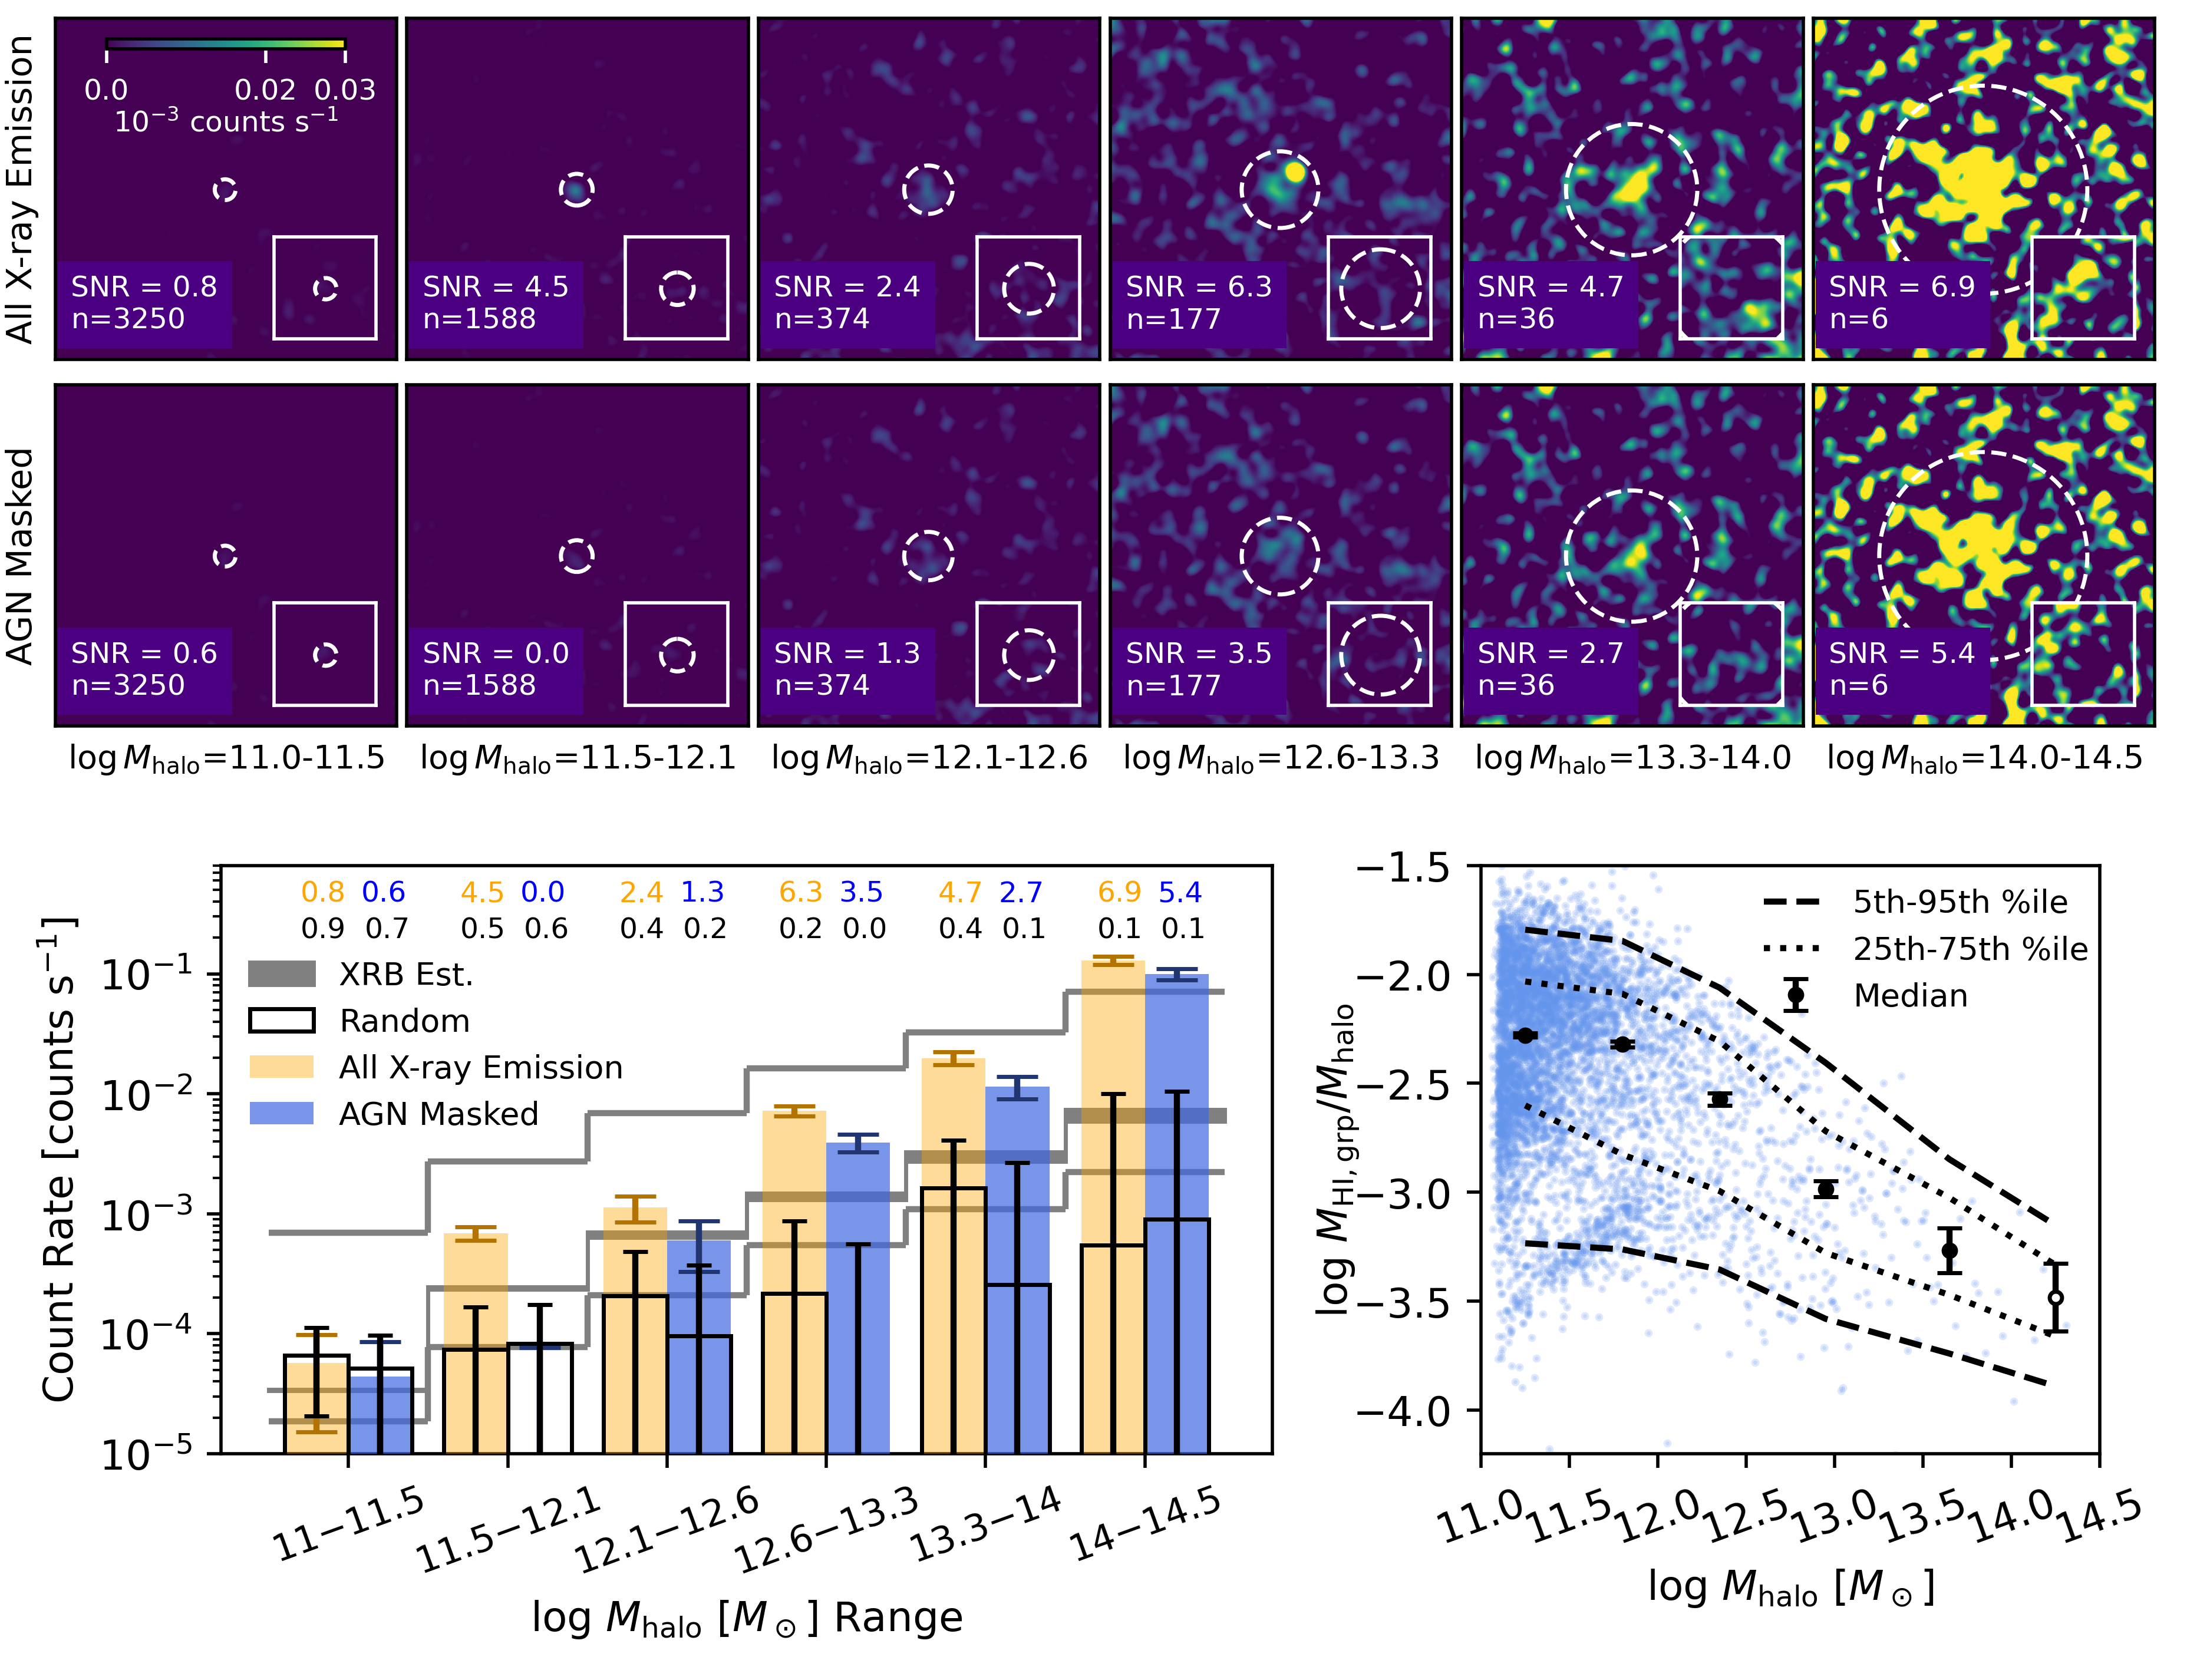
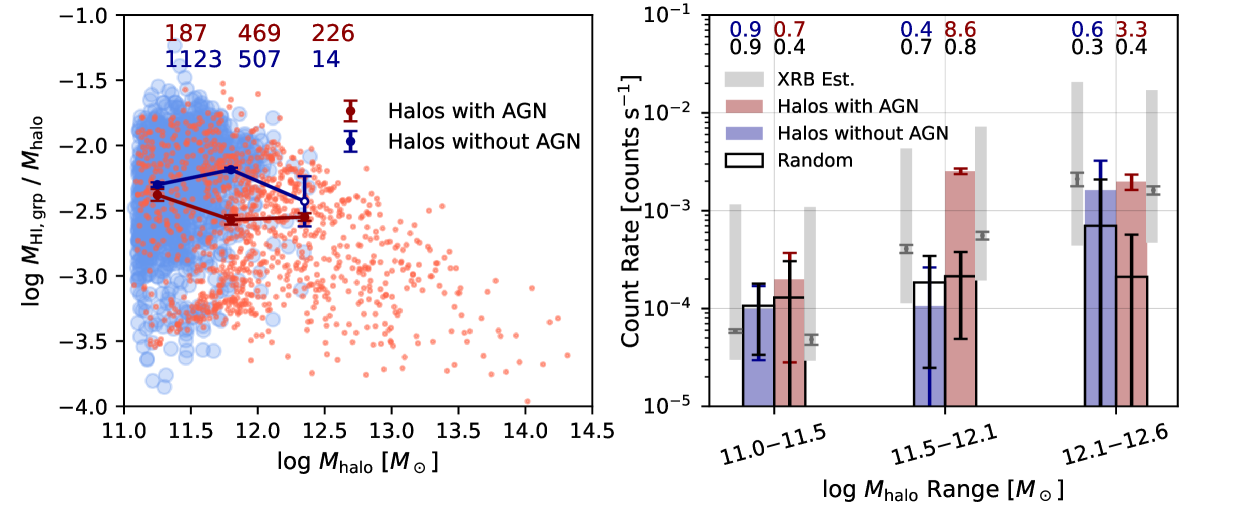
Figure 3 shows stacked X-ray emission in six bins of group halo mass, chosen to coincide with regimes around the threshold and bimodality scales (see §1) and also to facilitate comparison with past work (e.g., Anderson et al., 2015). We provide total stacked count rates, stacked count rates with AGN galaxies masked, and expected XRB count rates. In all three cases, count rates increase as a function of halo mass.
With galaxies and AGN not masked (“all X-ray emission”), we detect X-ray emission with SNR2 in excess of the random stacks for all halo mass bins except , with more confident SNR4 detections at and in the three individual bins spanning . 666The detection in the bin drops to SNR5.5 if we exclude group #1345, which contains an extremely X-ray-bright galaxy (ECO04631 / 2RXS J141759.5+250817). Interestingly, the bin shows a marginal 2.4 detection despite being surrounded by more significant detections in adjacent bins. We speculate that this result may represent the confluence of decreasing (resulting in lower stacking depth) and increasing intrinsic X-ray emission as halo mass increases.
After AGN are masked, all count rates decrease relative to total count rates, albeit total and AGN-masked count rates are similar when considering their uncertainties. With AGN masked, we detect X-ray emission in excess of random stacking expectations in the three bins spanning , with the middle bin at reaching only a marginal SNR of 2.7 and the flanking bins reaching SNRs of 3.5 and 5.4.
Since masking AGN removes any AGN X-ray emission777Masking AGN may also mask intragroup hot gas in the foreground or background of the AGN-host galaxies, so our AGN-masked count rates are subject to this caveat. However, in each halo mass bin, the ratio of AGN-masked pixels to total stacked pixels is only 10%., any remaining X-ray emission would be most likely attributed to XRBs or hot gas; thus, we compare to the expected X-ray binary contribution for each stack. In the highest mass bin at , our preferred XRB estimate accounts for only of the observed AGN-masked count rate. In the next lower bins at and , our preferred XRB estimates account for only and , respectively, of the observed AGN-masked count rates. However, for these bins, our measured AGN-masked count rates are smaller than the highest estimates from the 13 XRB estimators we reviewed. Consequently, our results unambiguously confirm the presence of hot gas only for , though we consider our hot gas detections in the two bins spanning to be reasonably secure. In lower halo mass bins, our observed AGN-masked count rates are consistent with or smaller than expectations for XRBs.
For comparison with the X-ray count rates, the lower right panel of Figure 3 shows the distribution of as a function of halo mass. From the lowest to highest halo mass bin, the median drops by 1.1 dex (a factor of 13) as the stacked X-ray intensity increases.
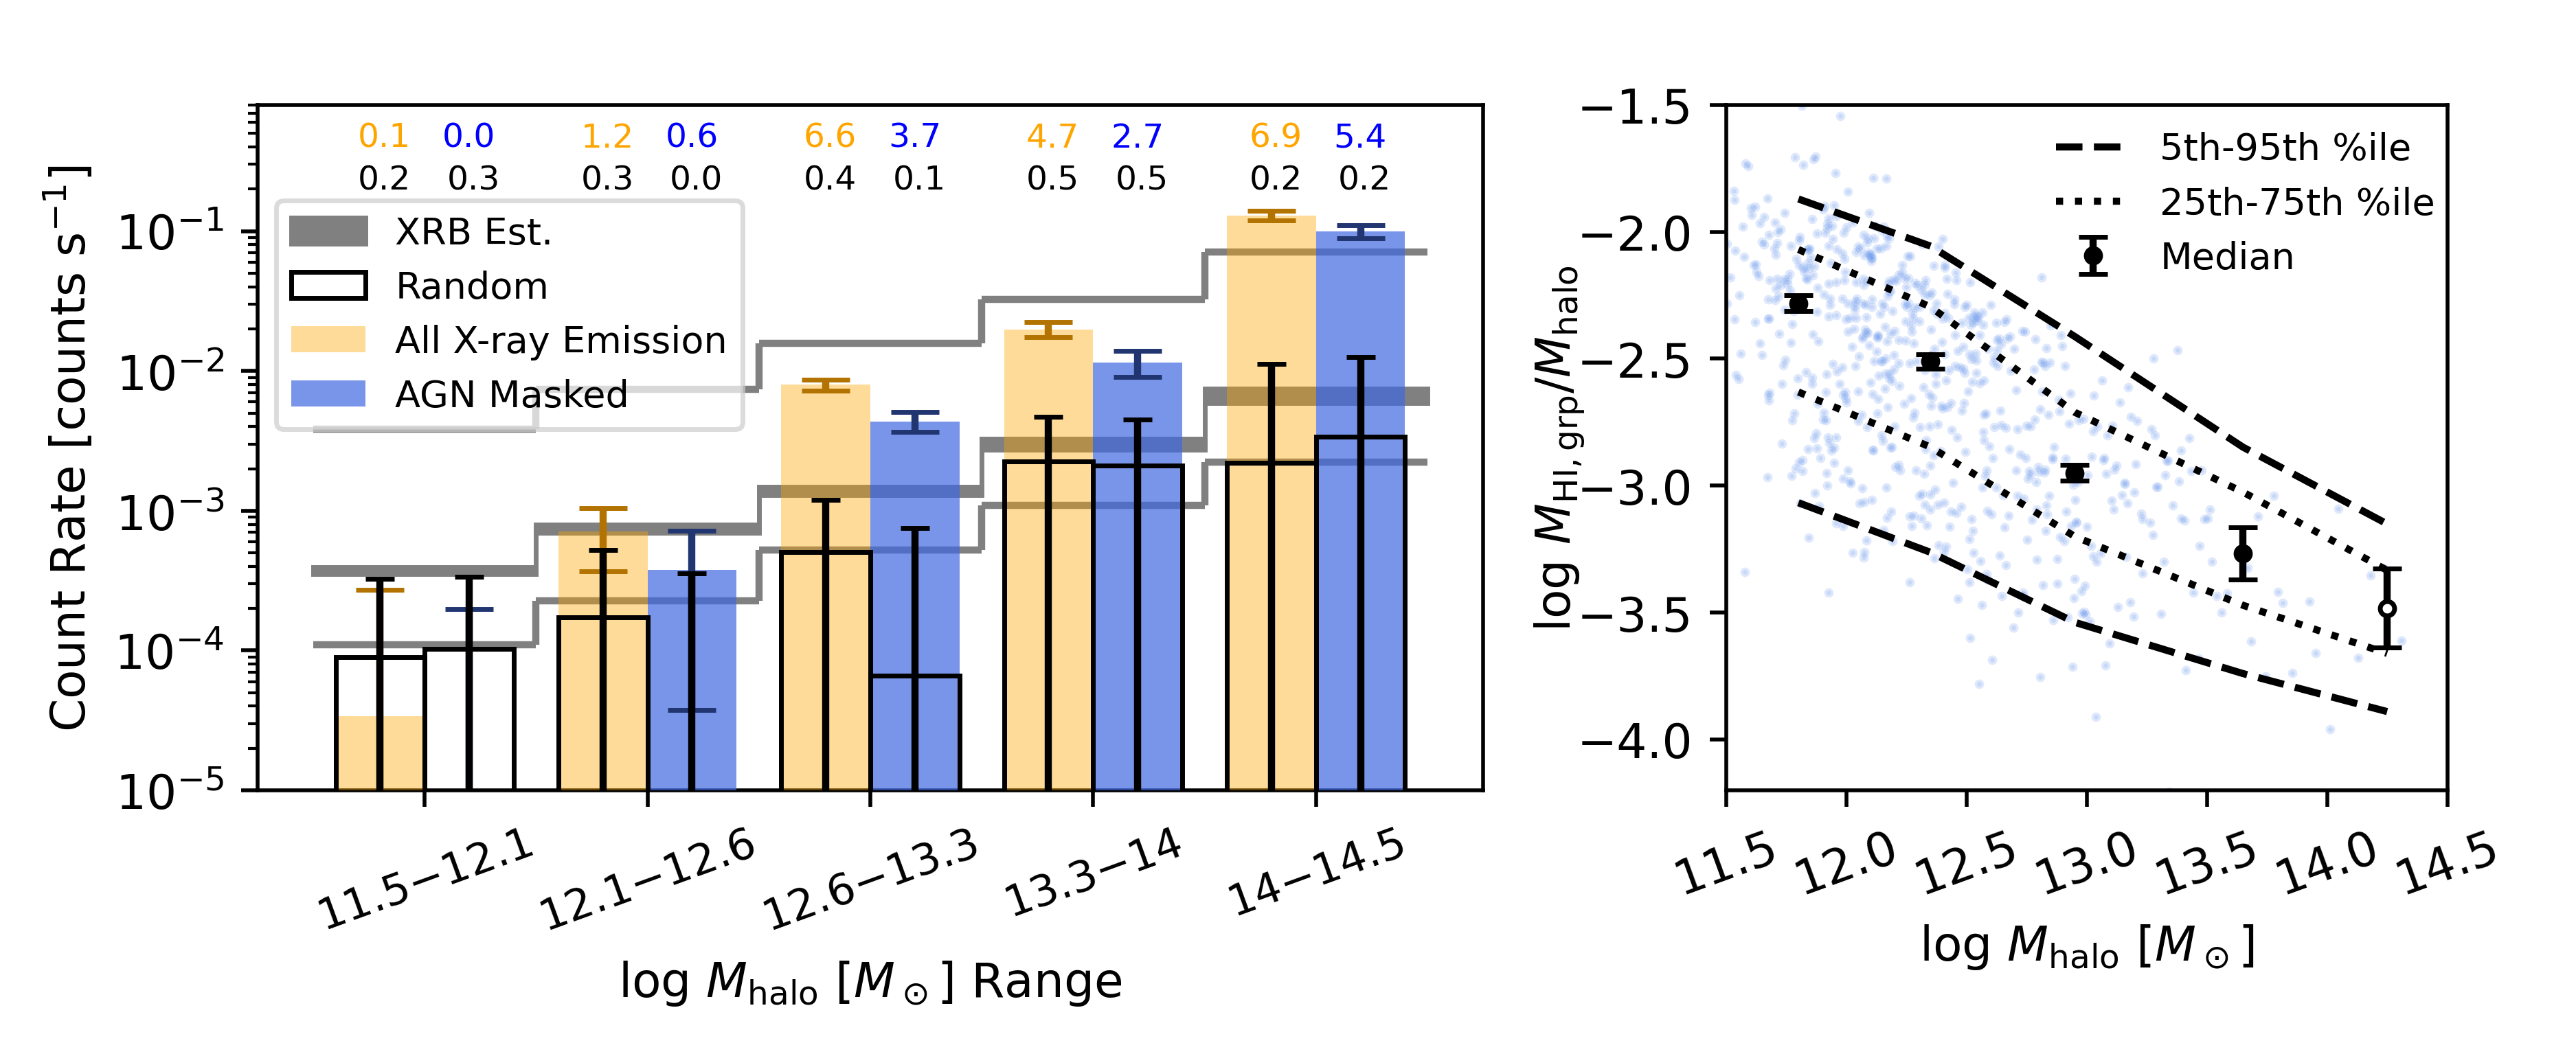
To highlight X-ray contributions driven by the group environment, Figure 4 assesses stacked X-ray emission excluding groups and considering only galaxy groups with halo masses , below which there are insufficient halos for stacking. With AGN not masked, Figure 4 shows X-ray emission in excess of random stacking expectations with SNR4 in the three bins spanning .
After masking AGN, the detections in these bins are maintained with lower SNR, although the bin detection is still marginal as above. As in our Figure 3 analysis, comparing AGN-masked count rates and XRB expectations in Figure 4 shows that (i) only the bin has an AGN-masked count rate that exceeds all 13 XRB estimators we considered, with our preferred XRB estimator accounting for just of the observed AGN-masked count rate, and (ii) our preferred XRB estimator accounts for just and , respectively, of the AGN-masked count rates in the two lower and bins, indicating likely hot gas detections in these bins as well. Although other XRB estimators among the 13 we considered could fully explain these bins’ AGN-masked emission, the same estimators would overpredict the emission in lower mass bins.
The right panel of Figure 4 shows the corresponding distribution of as a function of halo mass. Group H I content smoothly declines by 1.2 dex over the same halo mass range in which X-ray counts increase. Based on expected XRB contributions, our detections of diffuse X-rays from hot gas become confident across and unambiguous above , where simultaneously reaches its lowest values as a function of halo mass. Together, these results suggest an inverse relationship between halo-integrated H I content and halo-integrated X-ray emission, reflecting both hot gas and galactic X-ray sources. This relationship is discussed further in §5.
4.2 How do group cold gas and X-ray emission depend on virialization state at fixed halo mass?
With their halo mass dependence established, we can now assess how group H I content and X-ray emission depend on virialization state, as parameterized by crossing time, at fixed halo mass. Figure 5 shows groups distributed in versus , in three panels representing bins of group halo mass. Analysis of requires groups, so we again exclude . For and , Figure 5 shows a transition to greater spread in as crossing time decreases, with many more low- values appearing despite the upper end of the range not changing. We see this transition occurring across (marked with vertical line), which is similar to the median values of in the bins shown (, , , respectively) and represents 2 Gyr. The existence of this transition motivates us to ask whether X-ray emission increases below the same value, possibly due to virial shock heating and/or environmental triggering of star formation or AGN.
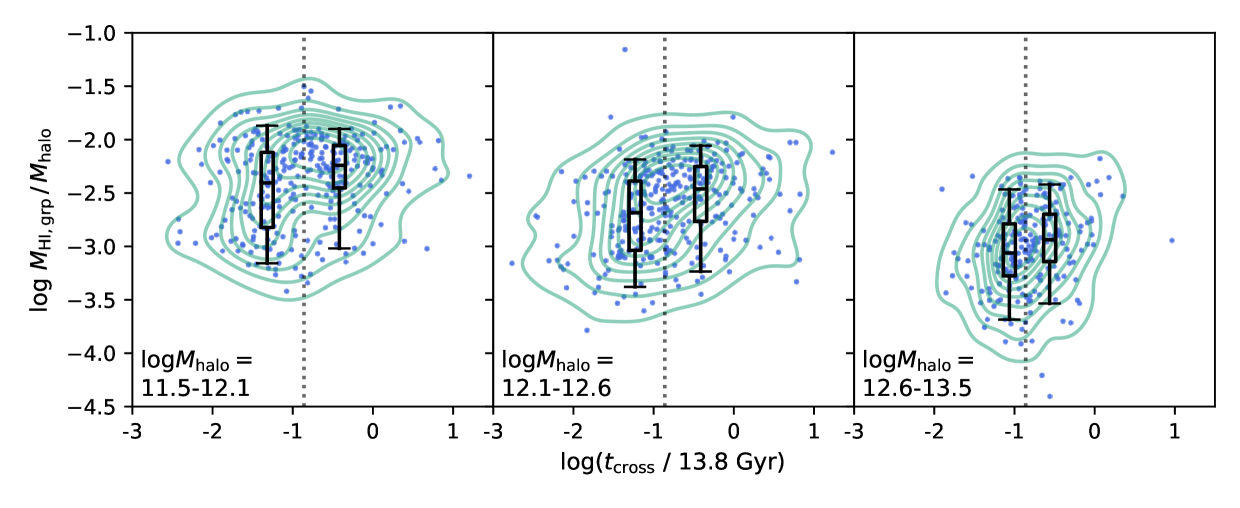
To address this question, we provide two figures connecting group H I content (Figure 6) and X-ray emission (Figure 7) to . In Figure 6, we show trends of median versus for lower- and higher- groups, which are separated at based on Figure 5.888For both Figures 6 and 7, our results do not noticeably change when adopting boundary values of or instead of our chosen value of . Lower- groups exhibit lower median than higher- groups at fixed halo mass, with a maximum difference of 0.2 dex (a factor of 1.6). We note that while Figure 6 includes X-ray confused groups in calculations (whereas Figure 7 excludes these groups), the trends in Figure 6 are not noticeably different if these confused groups are excluded.
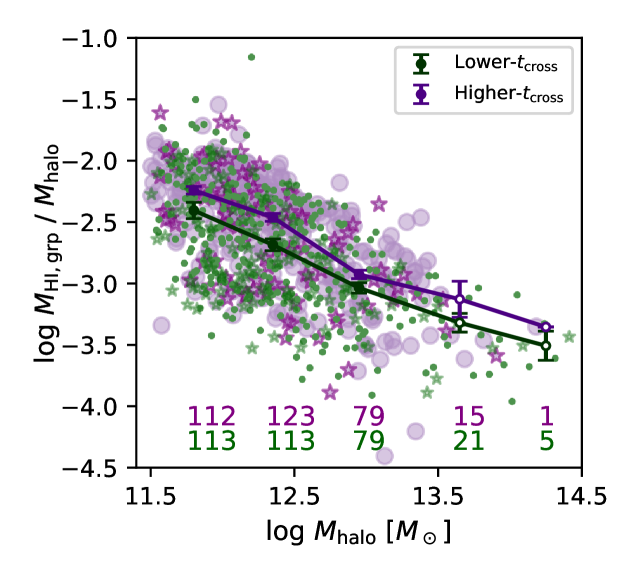
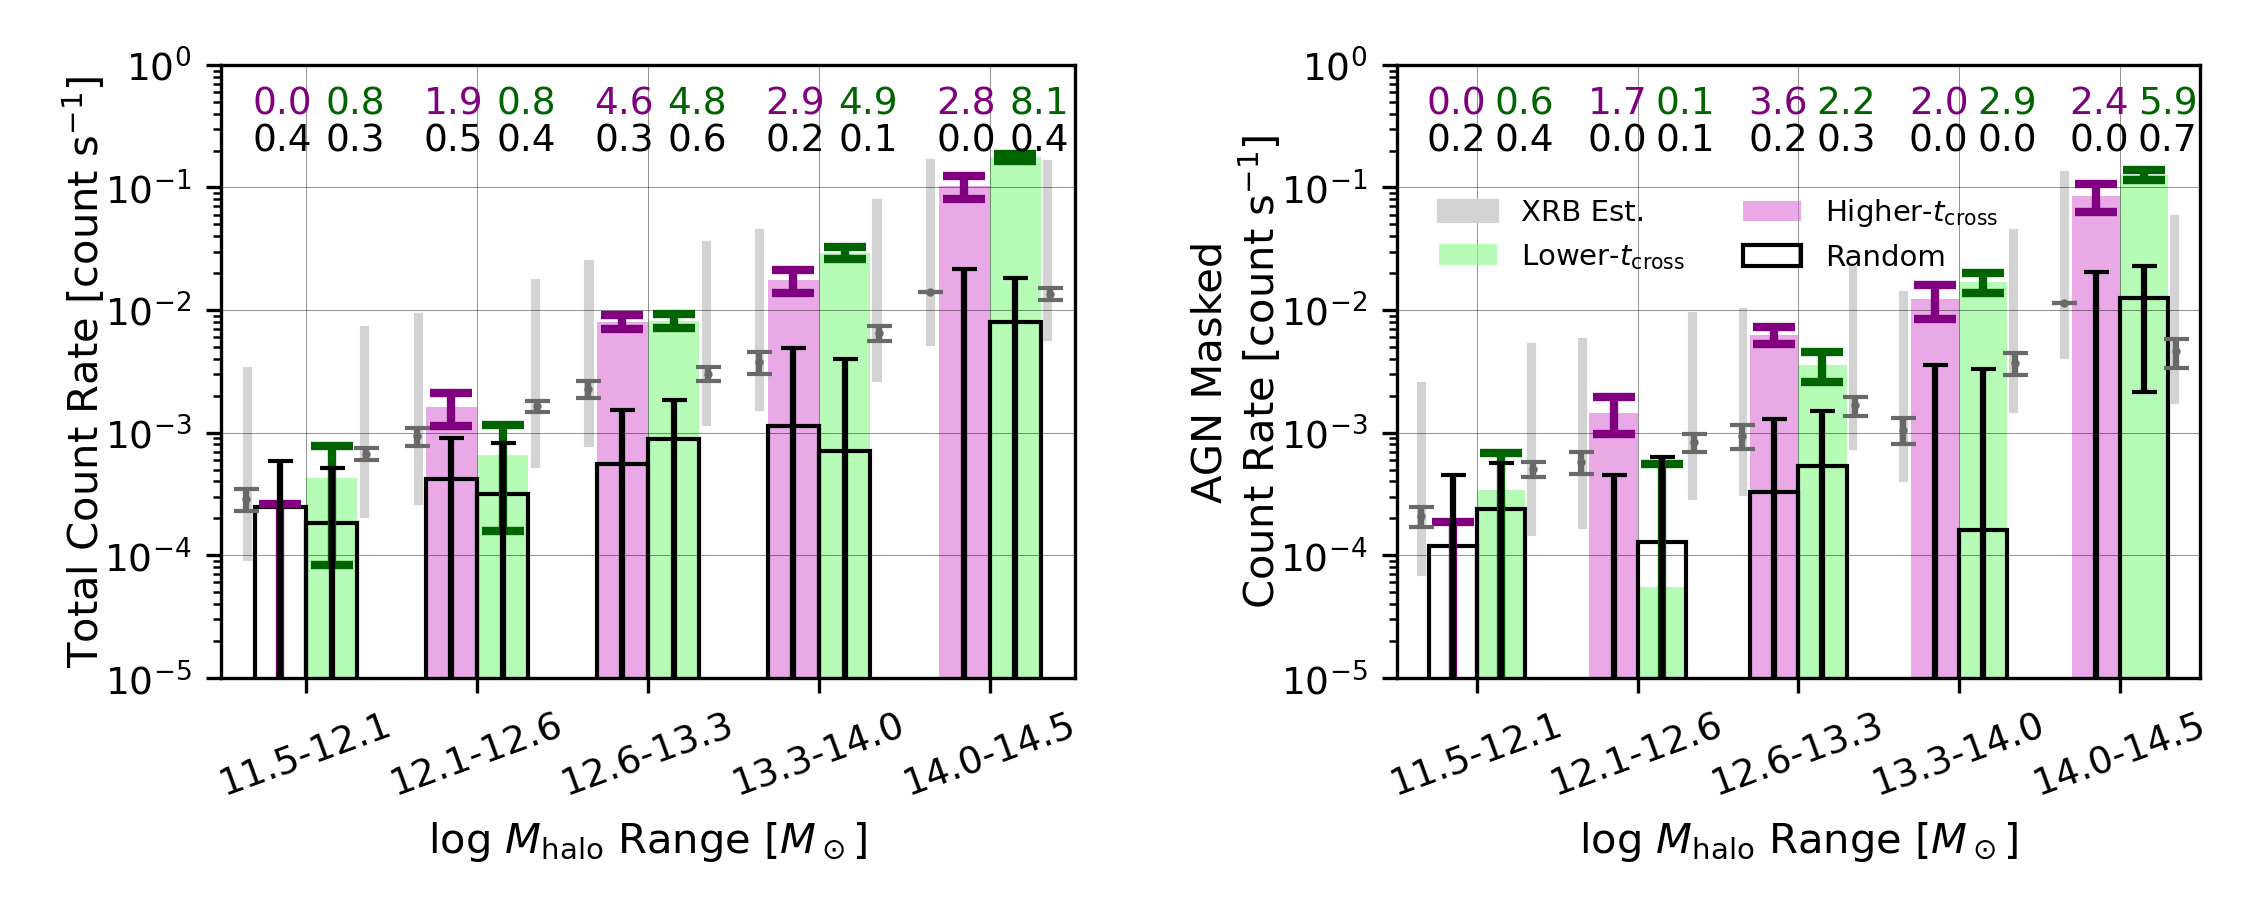
Figure 7 illustrates stacked X-ray count rates for galaxy pairs and groups in the same bins and categories as in Figure 6. With AGN not masked, as shown in the left panel, we find SNR4.5 detections for both categories at . In the and bins, we find weak SNR2.8 detections for higher- bins and significant SNR4.9 detections for lower- bins. The measured count rate exceeds random stacking expectations in all cases. We note that if we exclude group #1345 (see Footnote 6) from the higher- bin, the SNR of that stack drops to 4.
The SNRs of these detections drop when AGN are masked, as illustrated in the right panel, and in this case we still find SNR2.9 detections in excess of random stacks for higher- groups at and for lower- groups in the two bins spanning . There is additionally a weaker SNR2.2 detection for lower- groups at , consistent with XRB expectations. The most significant detection is for lower- groups at , where the SNR reaches 5.9.
With these results, we cannot confidently ascertain whether a general relationship exists between group X-ray emission and group crossing time at fixed halo mass. There is a hint, however, that enhanced group X-ray emission from hot gas or galactic sources is associated with greater virialization (lower-) above . With AGN masked, the low- bins at and show enhanced count rates, of which (based on our preferred XRB estimator) XRBs are expected to contribute and , respectively. This result flips in the lower halo mass bin, where higher- groups show enhanced count rate. In this case, XRBs contribute . Deeper X-ray data over a larger number of groups would be needed to confirm and better understand these results. The binning of our sample by both and , on top of excluding halos and confused halos, leaves us 125 groups per stacking bin, thereby reducing our stacking depth and increasing our sensitivity to outliers. We further discuss these results and their connection to group H I content in §5.2.
4.3 How do group cold gas content and X-ray emission depend on AGN and SF at fixed halo mass?
Figures 8–10 assess how AGN and SF relate to cold gas content and X-ray emission. Figure 8 shows trends of median and , dividing our sample into AGN-hosting and non-AGN-hosting halos. halos are included. Trendlines are computed in sliding 0.3-dex halo mass bins. The sliding statistic helps us better identify fine structure in the data that might be suppressed by discrete binning. However, we also superpose points with error bars (derived from bootstrapping) for independent 0.3-dex bins.
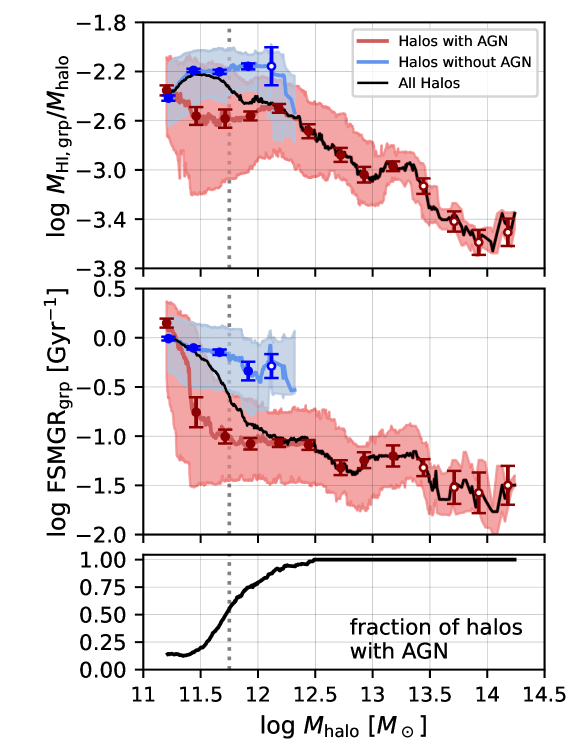
Figure 8 demonstrates that below the bimodality scale of , halos with AGN have reduced median and compared to halos without AGN.999Given that our calculated FSMGRs (see §2.1.3) could reflect potential systematics associated with SED fitting (Lower et al., 2020), we have confirmed that our result still holds if we instead calculate using UV and mid-IR photometry from M.S. Polimera et al. (2025, in prep.). These alternative FSMGRs have been calculated using standard composite SFR prescriptions (Buat et al., 2011), which typically assume a constant star formation history over a relatively short timescale 100 Myr, and they rely on SED fitting only in the use of internal extinction corrections. The reduced for AGN-hosting halos is significant to 5 according to a two-sample Kolmogorov-Smirnov test, and it reaches a depth of 0.4 dex at . Within this halo mass range, non-AGN-hosting halos exhibit a plateau in , whereas AGN-hosting halos exhibit a broad valley in over 1 dex in halo mass centered on (based on a parabolic fit to the valley labeled “a” in Figure 11). Valley “a” underlies the noticeable yet narrower depression in ratios labeled “b” that is seen for all halos (black line), which occurs across as the fraction of halos with AGN rises, crossing 50% at . To assess the statistical significance of valley “b,” we constructed a baseline for our median vs. data by fitting to the analytic model of Obuljen et al. (2019), resulting in , , and (see also H23), then divided the integrated area above the valley into the integrated noise expected from our uncertainties in the median values. This calculation indicates a confidence of 2.5 for valley “b” across . While we lack a model baseline to quantify the larger valley “a” seen for AGN-hosting halos taken alone, the fact that it represents a 5 deviation from non-AGN-hosting halos provides a physical explanation for valley “b” and compels us to consider both valleys meaningful.
Above the bimodality scale, we note another potential valley in the trend for AGN-hosting halos located at approximately (labeled “c” in Figure 11), which is mirrored in the trend for all halos. This high-mass valley deviates from our model fit to the median vs. relation (see above) with a significance of 3.9; however, this deviation could also be interpreted as a 1.3 bump at rather than a valley at . If the high-mass valley labeled “c” in Figure 11 is truly a valley rather than a positive bump, it has higher significance than the narrow valley labeled “b,” which has a demonstrable physical origin in the (larger and more significant valley) labeled “a.” Finally, given concerns about the reliability of mid-IR AGN classifications in the dwarf regime (e.g., Hainline et al., 2016; Sturm et al., 2025), we note that our results in Figure 8 do not noticeably change if we treat mid-IR AGN host galaxies as non-AGN-hosting galaxies, due to their relative infrequency (2.5% of our AGN).
To investigate whether these relationships may have associated X-ray emission signatures reflecting galactic X-ray sources or hot gas, Figure 9 shows background-subtracted X-ray count rates versus halo mass for AGN-hosting and non-AGN-hosting halos, measured with AGN unmasked. We have stacked halos in bins up to , the highest mass bin that contains non-AGN-hosting halos. For non-AGN-hosting halos, we do not detect significant X-ray emission in any of the bins. However, for AGN-hosting halos, we detect SNR3 X-ray emission in excess of random stacking expectations in the two halo mass bins spanning but not from the lower mass bin at . To test whether the excess emission arises from or near the AGN, we replicated the analysis of Figure 9 but instead masked known AGN (not pictured). The detections in the and bins dropped to SNR2. This result confirms that some of the excess X-rays we measure in Figure 9 derive from AGN directly or from hot gas (possibly heated by AGN).
4.4 Connecting crossing time and AGN results
Finally, we consider whether our separate results connecting group H I content to crossing time and to AGN/SF are related, as might occur if group assembly lowers and thereby increases the likelihood of triggering AGN or enhancing SF. This analysis requires that we exclude groups to calculate , leaving only 410 AGN-hosting groups and only 30 non-AGN-hosting groups at all halo masses. Given this small number of non-AGN-hosting groups as well as our inconclusive §4.2 X-ray stacking results when binning in and , we do not consider X-ray emission in this joint analysis.
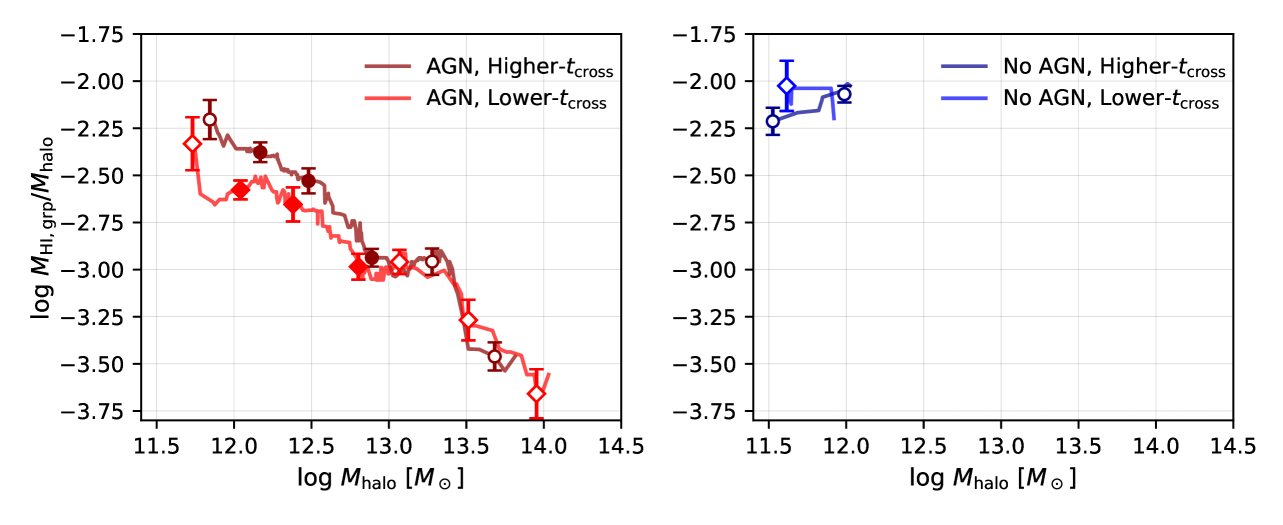
Figure 10 shows the vs. relation subdivided into four bins, representing AGN-hosting and non-AGN-hosting halos as well as lower- and higher- groups. Lines represent median values in sliding windows and point represent medians and errors in independent 0.4 dex bins on the sliding median trendline; as in Figure 8, the points may not overlap since for different subsamples the sliding medians start and end at different halo masses.
The left panel illustrates that AGN-hosting halos at higher have elevated compared to AGN-hosting halos at lower . At and higher masses, the median trendlines for higher- and lower- AGN-hosting halos become consistent, given the error bars on the points. In the right panel, we see that low- and high- non-AGN-hosting halos have similar , albeit with the caveat that the bootstrapped uncertainties on may not be reliable given the small number of groups that lack AGN. Thus, a larger sample of non-AGN-hosting halos would be helpful for ascertaining whether the relationships connecting group H I content to group crossing time and AGN presence are independent.
5 Discussion
Our results in the previous section connect the relationship between group H I content and X-ray emission to group crossing time, star formation, and AGN activity. We now discuss broader implications and compare to past observational and theoretical work. We first discuss the gas inventory in halos, then discuss possible physical scenarios relating virialization state, AGN, and star formation to halo H I content.
5.1 The Gas Inventory in Halos
In §4.1, our results implied an inverse relationship between group H I content and the presence of hot intragroup gas. At high halo masses , groups have low H I-to-halo mass ratios, and their stacked X-ray count rates are unlikely to be fully explained by X-ray binaries and AGN,101010Dwarf AGN appear to be typically underluminous in X-rays (Latimer et al., 2019, M.S. Polimera et al. 2025, in prep.). Moreover, among dwarf AGN detected using all the aforementioned methods, the “SF-AGN” identified by Polimera et al. (2022) are the most abundant and have the most dwarf-like host galaxy properties, i.e., metal-poor, gas-rich, and star-forming. The abundance of these “typical dwarf” AGN exceeds that of X-ray-detected dwarf AGN by at least a factor of five (comparing Polimera et al., 2022 to Birchall et al., 2022), so we do not expect an additional undetected dwarf AGN population with significant X-ray emission to contribute to our stacks, although we cannot rule it out. suggesting the presence of diffuse hot gas. We found that lower-mass halos have higher H I-to-halo mass ratios and stacked X-ray emission that can probably be explained in full by AGN or XRBs.
X-ray detections at these high halo masses are expected from previous work. In a stacking analysis using RASS data, Anderson et al. (2012) detected strong X-ray emission from both early- and late-type luminous, isolated galaxies but reported that faint, isolated galaxies (central galaxy , typically in ECO) showed no evidence of extended emission. In a larger RASS stacking analysis of 250,000 SDSS brightest cluster galaxies, Anderson et al. (2015) further detected extended hot gas down to central galaxy , corresponding to . Furthermore, deeper X-ray observations using Chandra, XMM-Newton, and eROSITA have measured hot gas luminosity vs. group halo mass down to (Kim & Fabbiano, 2013; Goulding et al., 2016; Forbes et al., 2017; Bogdán & Vogelsberger, 2022; Zhang et al., 2024). The steep slope of this power law highlights the much weaker X-ray emission of lower-mass halos in comparison to higher-mass halos. As such, our stacking analysis, despite being based on volume-limited, dwarf-dominated surveys, may have lacked enough low-mass halos (compared to these other studies) to detect hot gas at these low halo masses.
Scarcity of hot gas in low-mass halos would be consistent with both theoretical and observational expectations that most halo gas in these halos is in the form of the warm-hot intergalactic medium (WHIM). In simulations, WHIM constitutes 40–50% of the baryonic mass inventory at temperatures and densities that emit only weakly in X-rays (Cen & Ostriker, 1999; Davé et al., 2001; Smith et al., 2011). Examining the cold baryonic mass (stars + atomic gas) function in RESOLVE and ECO and combining it with literature prescriptions for hot halo gas and galactic molecular gas, Eckert et al. (2017) found a mass deficit below between the observed baryonic mass function and the expected baryonic mass function, based on the halo mass function and assuming a uniform baryonic fraction. This deficit matched theoretical estimates for WHIM in low-mass halos.
5.2 Group Virialization State
In §4.2, we demonstrated that lower- galaxy groups show statistically lower ratios and greater spread in than higher- groups at fixed halo mass. The transition to greater spread in group H I content occurs across , or 2 Gyr. It is interesting that this transition becomes prominent for and even more so for , whereas at higher halo masses there is a smoother relationship between and across this 2 Gyr scale (see Figure 5).
Using a sample of 172 SDSS groups, Ai & Zhu (2018) have also examined the relationship between and . Their results do not appear to show such a transition to greater spread in across , perhaps due to the higher halo masses of their groups, which span . However, our results are consistent with theirs in showing suppressed median for groups with lower . Through comparison of crossing time to H I depletion timescales, the authors argued that this relationship implies that long-timescale processes (e.g., starvation; Bekki et al., 2002) are more important in group evolution than short-timescale environmental quenching processes (e.g., ram-pressure stripping; Abadi et al., 1999). These processes are usually associated with massive groups and clusters (due to their being more effective in environments with hot gas), but their effects have been seen in less massive halos around the bimodality scale and even below it (e.g., Grcevich & Putman, 2009; Li et al., 2017; Putman et al., 2021; Zhu & Putman, 2023; Jones et al., 2024). Thus the continued trend we see down to (Figure 6) is not surprising.
In addition, mergers are expected to be common in halos typical of small groups, given the more effective dynamical friction at low peculiar velocities (Chandrasekhar, 1943). Thus, the scatter toward low in halos with low could alternatively reflect increased rates of H I processing in more compact halos. As groups collapse, mergers and interactions may become more frequent or more intense, and prior observations indicate these interactions may trigger atomic gas consumption and associated feedback that may also deplete gas. Many studies have directly linked interactions and minor mergers to enhancement of AGN activity and SF (e.g., Di Matteo et al., 2008; Stark et al., 2013; Pipino et al., 2014; Kaviraj, 2014; Comerford et al., 2015; Gao et al., 2020). It is possible, however, that the relationships connecting group H I to and AGN presence are independent; our result in Figure 10 includes too few non-AGN-hosting groups for us to say conclusively.
AGN aside, our X-ray emission results complicate the story. If lower truly indicates virialization state, AGN-masked X-ray count rates are greater for more-virialized groups at but greater for less-virialized groups at . These results follow expectations at high halo mass: above the “shutdown” scale at , models predict full halo gas heating to multiple virial radii (Dekel & Birnboim, 2006) and observations find that nearly all galaxies are gas-poor and quenched (Kannappan et al., 2009, 2013; Moffett et al., 2015).
The opposite result for is an open puzzle. We note that crossing time is an imperfect metric of virialization state, and our broad categories of higher- versus lower- may oversimplify the full diversity of group H I content as a function of halo mass and virialization state. Groups with are relatively small, so discrete merger events may make noisy. As group galaxies merge and the group evolves towards becoming a “fossil group” (e.g., Ponman et al., 1994), the group H I content will drop (see Guo et al., 2020) but the group crossing time may not smoothly decrease. In fact, since galaxy mergers can remove some of the smallest group-relative on-sky distances from the calculation, crossing time could increase (contrary to expectations for increased virialization) after a merger. This scenario exemplifies that crossing time may not perfectly capture how H I content relates to group assembly, especially for small groups in which low velocity dispersions enable enhanced merging (e.g., Carlberg et al., 2001). Given this caveat and the additional complication that is subject to projection effects, future work on this topic may benefit from incorporating additional virialization metrics sensitive to merging history (e.g., magnitude gap; Trevisan & Mamon, 2017).
5.3 AGN and Star Formation
One of our key results in §4.3 (Figure 8) is the connection of AGN to halo-integrated H I content and FSMGR. At low halo masses , AGN-hosting halos show a broad valley in median and median compared to non-AGN-hosting halos at fixed halo mass. The trend that non-AGN-hosting halos have higher median and continues just past the bimodality scale to , above which all of our halos host AGN. At higher masses, we find a possible valley at , though whether it has a relationship to AGN is unknown. Interestingly, Ellison et al. (2019) found that the H I-richness of AGN host galaxies is statistically lower than that of non-AGN-hosts below galaxy (corresponding to centrals in ECO), with opposite behavior at higher stellar masses. In this section, we discuss possible scenarios that may account for these trends and features below, across, and above the bimodality scale.
5.3.1 Below the Bimodality Scale
We consider two scenarios that may explain the valley in and for AGN-hosting halos below the bimodality scale: (1) AGN feedback may suppress H I content and star formation, and (2) a reduction in star formation and associated feedback, perhaps for reasons unrelated to AGN fueling, may enable efficient gas inflow to fuel AGN activity or may simply enable AGN detection.
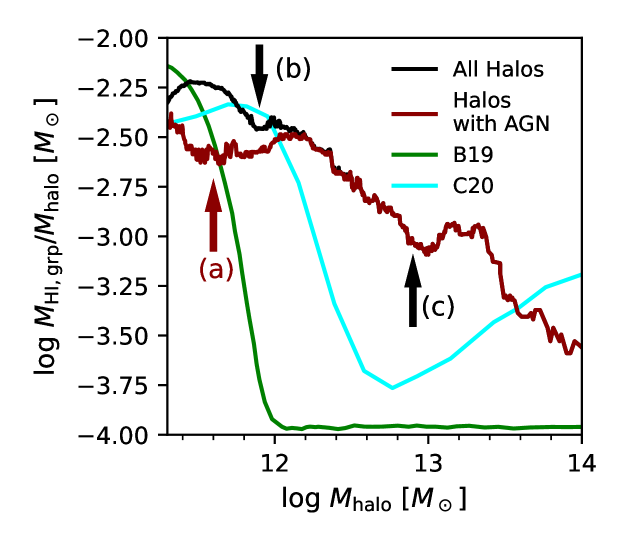
In scenario (1), AGN feedback may heat the halo gas or cause atomic gas blowout in galaxies, reducing the fuel supply for star formation. This scenario, gas heating specifically, is predicted by multiple semi-analytic models of the – relation, which show a dip at (Kim et al., 2017; Baugh et al., 2019; Chauhan et al., 2020). Prior observational efforts including H23 have failed to detect a dip directly, a failure usually attributed to systematic errors in binning or halo mass estimation (Chauhan et al., 2021; Dev et al., 2023). In hindsight, a hint of a dip near was present in the combined G3 data set in H23 (their Figs. 16 and 18). Figure 11 shows how this dip manifests in a plot of versus along with two theoretical predictions. By comparing the lines for all halos and for AGN-hosting halos, Figure 11 shows that a shallow valley in the vs. relation across is caused by a deeper depression in the H I content of low-mass, AGN-hosting halos. Below the bimodality scale, this deeper valley is diluted by the large fraction of non-AGN-hosting halos, so the shallow valley becomes prominent as the fraction of AGN-hosting halos crosses 50% around (see Figure 8). Figure 11 also shows that the Baugh et al. (2019) and Chauhan et al. (2020) SAMs deviate substantially from this observed valley in , predicting much deeper and wider “troughs” at higher masses. The observed valley for all halos is much smaller, only 0.1 dex deep, albeit it is much deeper for AGN-hosting halos taken alone, 0.25 dex. Also, the observed valley is located mostly below the bimodality scale, for both AGN-hosting halos specifically and all halos (Figure 11). (We do also see structure in the relation near , which could be a weaker valley similar to that of C20, as will be discussed in §5.3.2.) The failure of theoretical models to predict a valley below the bimodality scale suggests these models are not yet realistically including low-metallicity and/or highly star-forming AGN populations such as composite galaxies and SF-AGN (AGN registering as AGN in the Veilleux & Osterbrock, 1987 diagnostic plots but as SF in the Baldwin et al., 1981 BPT plot; Polimera et al., 2022). Composites and SF-AGN dominate the RESOLVE/ECO AGN inventory up to the bimodality scale (Polimera et al., 2022; M.S. Polimera et al. 2025, in prep.).
In scenario (2), the suppressed H I content of AGN-hosting groups could reflect an inverted causality, wherein lower H I content and thus reduced star formation feedback might allow gas to flow all the way to the black hole, as predicted especially for dwarf galaxies in some models (Anglés-Alcázar et al., 2017; Habouzit et al., 2017; Trebitsch et al., 2018). In observations, Latimer et al. (2019) have found that AGN are disproportionately uncommon in highly starbursting compact blue dwarfs (see also Bradford et al., 2018; Penny et al., 2018). Another version of scenario (2) is that reduced SF makes AGN easier to detect (Polimera et al., 2022). The black hole masses of dwarf AGN galaxies are expected to be , so their optical AGN signatures can be diluted in the presence of the intense star formation typical of dwarf galaxies (Reines et al., 2020). This bias is reduced in the metallicity-insensitive Veilleux & Osterbrock (1987) diagnostic plots, which can identify AGN down to 8–16% AGN spectral contribution for a typical metal-poor dwarf (Polimera et al., 2022).
5.3.2 Above the Bimodality Scale
Above the bimodality scale, we see that the trend of higher median and continues to , above which non-AGN-hosting halos become nonexistent in our sample. Interestingly, we also find a possible high-mass valley for AGN-hosting halos near (see Figure 11). We leave open the interpretation of this apparent feature, but we note that by analogy with the lower-mass valley, future work may benefit from examining whether the higher-mass feature is associated with any special sub-populations of AGN and their feedback properties. For example, a high-mass valley could hypothetically derive from a more prominent valley associated with halos hosting AGN in an efficient feedback mode that is diluted by other halos hosting AGN with less intense feedback. The AGN classifications used for our analysis are based on optical emission line diagnostics and mid-IR photometry (Polimera et al., 2022; M.S. Polimera et al. 2025, in prep.), so we do not have the ability to test such a scenario. Since we lack systematic X-ray and radio AGN classifications, our AGN data will not fully reflect feedback from obscured or radio-loud AGN. Past work suggests that AGN feedback may operate in two modes of growth, “bright” and “radio” (Somerville et al., 2008; Heckman & Best, 2014), both of which could influence halo H I content. In the bright mode, AGN may produce harsh radiation and winds that suppress accretion and star formation. In the radio mode, relativistic jets may heat accreting gas and thereby counteract gas cooling. The numerical abundance of these AGN subtypes may vary with halo mass or galaxy stellar mass. For example, Miraghaei (2020) showed that the fractions of radio and optical AGN vary with both galaxy stellar mass and environment, considering both field versus group galaxies and centrals versus satellites. Thus, a careful assessment of AGN subtypes and their corresponding feedback modes would be needed to ascertain how our results relate to AGN feedback.
5.3.3 Across the Bimodality Scale
As mentioned, Ellison et al. (2019) have observed a reversal across the bimodality scale in whether AGN-hosting or non-AGN-hosting galaxies have higher H I gas-to-stellar mass ratios. In particular, they found elevated H I content in massive AGN-hosting galaxies () at fixed stellar mass. Our results do not show an analogous reversal, but we also lack any non-AGN-hosting halos above , illustrating the difference between analyzing individual galaxies and analyzing entire halos. With halo mass increasing above the bimodality scale, galaxies increasingly reside in higher richness multiple-galaxy groups, so non-AGN-hosting groups can be scarce even if there are still many individual non-AGN-hosting galaxies. In any case, the reversal Ellison et al. (2019) observed disappeared when the AGN and non-AGN samples were fixed in star formation rate in addition to stellar mass. The authors argued that the original difference stemmed from the fact that, at fixed stellar mass, AGN preferentially reside in star-forming or green-valley galaxies, which tend to have higher H I content. In our case, we have not replicated our Figure 8 analysis in fixed bins of and together, but we note that the similar behavior of the and lines in Figure 8 is expected given the tight correlation between galaxy atomic gas-to-stellar mass ratio and FSMGR (Kannappan et al., 2013).
The question, then, is why AGN are more common in gas-rich and star-forming galaxies. The simple explanation that cold gas fuels both star formation and AGN seems incomplete, since below the bimodality scale, AGN-hosting halos instead have lower H I content and than non-AGN-hosting halos. The reversal of this result across the bimodality scale could suggest a relationship to halo gas physics. In the theoretical model of Dashyan et al. (2018), there exists a critical halo mass (at ) below which AGN can expel H I gas from dwarf galaxies, and observations have indeed found evidence for H I gas suppression in dwarf galaxy AGN hosts (e.g., Bradford et al., 2018). This ejective AGN feedback mode contrasts with the feedback mode that is theoretically expected for halos above the bimodality scale, in which the halo gas, having been shock-heated into a dilute medium, becomes more susceptible to radiative feedback from radio jets (Dekel & Birnboim, 2006). Understanding the galaxy mass and/or halo mass dependences of different modes of AGN feedback remains a key research question.
Since AGN feedback efficiency (see Croton et al., 2006) controls the location and depth of the dip in the predicted – relation of Chauhan et al. (2020), such that higher AGN feedback efficiency corresponds to dips located at lower halo masses, the features we observe may help place constraints on the frequency and/or intensity of AGN feedback. The possibility that there are two valleys may imply different regimes of feedback mode and efficiency. We defer quantitative analysis of the location and depth of the valleys to future work. Even interpreting the more convincing valley in this context would require evaluation with mock catalogs since systematic group-finding and halo mass estimation errors affect the shape and scatter of the – relation (Eckert et al., 2017; Hutchens et al., 2023; Chauhan et al., 2021; Dev et al., 2023).
6 Conclusions
In this work, we have combined archival RASS X-ray observations with the highly complete and volume-limited RESOLVE and ECO surveys. Using these surveys’ G3 group catalogs, comprehensive H I gas and SF data, and state-of-the-art census of optical and mid-IR AGN (including the new SF-AGN category introduced by Polimera et al., 2022 that tracks dwarf AGN), we have examined the connection between group cold gas content and group X-ray emission as a function of halo mass, virialization state, star formation, and AGN presence. Our key results can be summarized as follows:
-
•
We find that as halo mass increases, group H I content decreases while total X-ray emission and hot gas increase. Stacking RASS data, we detect hot gas in groups confidently at and unambiguously at . We find that the X-ray emission from lower-mass halos can most likely be explained by AGN or X-ray binaries, though we note that the estimation of XRB emission is a key area of uncertainty where future improvements can lead to better measurements of the group hot gas inventory (§5.1; Figs. 3, 4).
-
•
We identify a transition to increased spread in group gas content at fixed halo mass below , corresponding to . Defining lower- and higher- categories across this transition, we find that lower- groups show reduced median compared to higher- groups at fixed halo mass. Above , we additionally find increased X-ray emission for lower- groups. In contrast, we find enhanced X-ray emission for higher- groups at . In this small-group regime, mergers and projection effects are expected to have a larger influence on (§4.2, §5.2; Figs. 5–7).
-
•
Below the bimodality scale (), halos with AGN exhibit a broad valley in and H I-to-halo mass ratio compared to non-AGN-hosting halos at fixed halo mass. We have argued that this result may be consistent with either of two physical scenarios: (1) gas heating or blowout from AGN removes H I and suppresses star formation, or (2) reduced SF feedback enables H I inflow for AGN fueling, or reduced SF simply makes AGN easier to detect (§4.3, §5.3; Figs. 8–10).
-
•
The trend of elevated H I-to-halo mass ratio and for non-AGN-hosting halos continues until such halos become nonexistent in our sample at , just above the bimodality scale. We also detect significant X-ray emission from AGN-hosting halos at and . These results hold even if we treat all mid-IR AGN host galaxies as non-AGN-hosting galaxies (§4.3, §5.3; Figs. 8–10).
-
•
We find that AGN-hosting halos below and just above the bimodality scale show reduced at fixed halo mass compared to non-AGN-hosting halos. This pattern for matches that for H I content, as expected based on the tight relationship between galaxy FSMGR and galaxy H I-to-stellar mass ratio seen in Kannappan et al. (2013) (§4.3, §5.3, Fig. 8).
-
•
Updating H23, we now report evidence for a dip in the – relation (in hindsight evident in H23 Figures 16 and 18). This dip coincides with a shallow valley in the median vs. relation across as the fraction of halos containing AGN crosses 50%, reflecting a deeper and wider valley in for AGN-hosting halos below the bimodality scale. While an AGN feedback-driven dip in the – relation has been theoretically predicted (Kim et al., 2016; Baugh et al., 2019; Chauhan et al., 2020, 2021), these predicted dips correspond to much deeper troughs at masses above the bimodality scale. The valley we have discovered is centered between the threshold and bimodality scales for all halos and is driven by an even broader valley that extends well into the dwarf regime for AGN-hosting halos. We do see a possible high-mass valley in the vs. relation near . If it is a valley, it is much shallower than theory predicts, and its relationship to AGN or AGN subtype activity is unknown (§4.3, §5.3; Figs. 8–11).
These results illustrate the wide variety of drivers of group H I content and group X-ray emission at fixed halo mass, thereby deepening our understanding of the rich scatter in the – relation, which has only recently been quantified. While our work has clearly demonstrated the importance of virialization state, star formation, and AGN presence in shaping the group gas inventory, it has also raised several interesting puzzles. Some unresolved questions include (a) the physical meaning of the transition in group gas content; (b) the cause of the reversal of enhanced X-ray emission for lower- vs. higher- groups across the shutdown scale; and (c) the physical drivers of reduced H I content in AGN-hosting halos, especially in relation to the newly discovered dip in the – relation below the bimodality scale. Future work to address these puzzles will provide essential insights into how galaxies evolve in relation to their dark matter halos.
References
- Abadi et al. (1999) Abadi, M. G., Moore, B., & Bower, R. G. 1999, Monthly Notices of the Royal Astronomical Society, 308, 947
- Ai & Zhu (2018) Ai, M., & Zhu, M. 2018, The Astrophysical Journal, 862, 48
- Anderson et al. (2012) Anderson, M. E., Bregman, J. N., & Dai, X. 2012, The Astrophysical Journal, 762, 106
- Anderson et al. (2015) Anderson, M. E., Gaspari, M., White, S. D., Wang, W., & Dai, X. 2015, Monthly Notices of the Royal Astronomical Society, 449, 3806
- Anglés-Alcázar et al. (2017) Anglés-Alcázar, D., Davé, R., Faucher-Giguère, C.-A., Özel, F., & Hopkins, P. F. 2017, Monthly Notices of the Royal Astronomical Society, 464, 2840
- Baldwin et al. (1981) Baldwin, J. A., Phillips, M. M., & Terlevich, R. 1981, Publications of the Astronomical Society of the Pacific, 93, 5
- Baugh et al. (2019) Baugh, C., Gonzalez-Perez, V., Lagos, C. D., et al. 2019, Monthly Notices of the Royal Astronomical Society, 483, 4922
- Behroozi et al. (2010) Behroozi, P. S., Conroy, C., & Wechsler, R. H. 2010, The Astrophysical Journal, 717, 379
- Bekki et al. (2002) Bekki, K., Couch, W. J., & Shioya, Y. 2002, The Astrophysical Journal, 577, 651
- Birchall et al. (2022) Birchall, K. L., Watson, M. G., Aird, J., & Starling, R. L. C. 2022, MNRAS, 510, 4556, doi: 10.1093/mnras/stab3573
- Birnboim & Dekel (2003) Birnboim, Y., & Dekel, A. 2003, Monthly Notices of the Royal Astronomical Society, 345, 349
- Blanton & Berlind (2007) Blanton, M. R., & Berlind, A. A. 2007, The Astrophysical Journal, 664, 791
- Boese (2000) Boese, F. 2000, Astronomy and Astrophysics Supplement Series, 141, 507
- Bogdán & Vogelsberger (2022) Bogdán, Á., & Vogelsberger, M. 2022, Handbook of X-ray and Gamma-ray Astrophysics, 1
- Boller et al. (2016) Boller, T., Freyberg, M., Trümper, J., et al. 2016, Astronomy & Astrophysics, 588, A103
- Boroson et al. (2011) Boroson, B., Kim, D.-W., & Fabbiano, G. 2011, The Astrophysical Journal, 729, 12
- Borthakur et al. (2015) Borthakur, S., Yun, M. S., Verdes-Montenegro, L., et al. 2015, The Astrophysical Journal, 812, 78
- Bradford et al. (2018) Bradford, J. D., Geha, M. C., Greene, J. E., Reines, A. E., & Dickey, C. M. 2018, The Astrophysical Journal, 861, 50
- Buat et al. (2011) Buat, V., Giovannoli, E., Takeuchi, T., et al. 2011, Astronomy & Astrophysics, 529, A22
- Carlberg et al. (2001) Carlberg, R., Yee, H., Morris, S., et al. 2001, The Astrophysical Journal, 563, 736
- Cen & Ostriker (1999) Cen, R., & Ostriker, J. P. 1999, The Astrophysical Journal, 514, 1
- Chandrasekhar (1943) Chandrasekhar, S. 1943, Astrophysical Journal, 97, 255
- Chauhan et al. (2021) Chauhan, G., Lagos, C. d. P., Stevens, A. R., et al. 2021, arXiv preprint arXiv:2102.12203
- Chauhan et al. (2020) —. 2020, Monthly Notices of the Royal Astronomical Society, 498, 44
- Colbert et al. (2004) Colbert, E. J., Heckman, T. M., Ptak, A. F., Strickland, D. K., & Weaver, K. A. 2004, The Astrophysical Journal, 602, 231
- Comerford et al. (2015) Comerford, J. M., Pooley, D., Barrows, R. S., et al. 2015, The Astrophysical Journal, 806, 219
- Croton et al. (2006) Croton, D. J., Springel, V., White, S. D., et al. 2006, Monthly Notices of the Royal Astronomical Society, 365, 11
- Dai et al. (2007) Dai, X., Kochanek, C. S., & Morgan, N. D. 2007, The Astrophysical Journal, 658, 917
- Dalcanton et al. (2004) Dalcanton, J. J., Yoachim, P., & Bernstein, R. A. 2004, The Astrophysical Journal, 608, 189
- Dashyan et al. (2018) Dashyan, G., Silk, J., Mamon, G. A., Dubois, Y., & Hartwig, T. 2018, Monthly Notices of the Royal Astronomical Society, 473, 5698
- Davé et al. (2001) Davé, R., Cen, R., Ostriker, J. P., et al. 2001, The Astrophysical Journal, 552, 473
- David et al. (2006) David, L. P., Jones, C., Forman, W., Vargas, I. M., & Nulsen, P. 2006, The Astrophysical Journal, 653, 207
- De Grandi et al. (1997) De Grandi, S., Molendi, S., Böhringer, H., Chincarini, G., & Voges, W. 1997, The Astrophysical Journal, 486, 738
- Dekel & Birnboim (2006) Dekel, A., & Birnboim, Y. 2006, Monthly notices of the royal astronomical society, 368, 2
- Dekel & Silk (1986) Dekel, A., & Silk, J. 1986, The Astrophysical Journal, 303, 39
- Desjardins et al. (2014) Desjardins, T. D., Gallagher, S. C., Hornschemeier, A. E., et al. 2014, ApJ, 790, 132, doi: 10.1088/0004-637X/790/2/132
- Dev et al. (2023) Dev, A., Driver, S. P., Meyer, M., et al. 2023, Monthly Notices of the Royal Astronomical Society, 523, 2693
- Di Matteo et al. (2008) Di Matteo, P., Bournaud, F., Martig, M., et al. 2008, Astronomy & Astrophysics, 492, 31
- Dressler & Shectman (1988) Dressler, A., & Shectman, S. A. 1988, AJ, 95, 985, doi: 10.1086/114694
- D’Onghia et al. (2005) D’Onghia, E., Sommer-Larsen, J., Romeo, A., et al. 2005, The Astrophysical Journal, 630, L109
- Eckert et al. (2016) Eckert, K. D., Kannappan, S. J., Stark, D. V., et al. 2016, The Astrophysical Journal, 824, 124
- Eckert et al. (2015) —. 2015, The Astrophysical Journal, 810, 166
- Eckert et al. (2017) Eckert, K. D., Kannappan, S. J., Lagos, C. d. P., et al. 2017, The Astrophysical Journal, 849, 20
- Eckmiller et al. (2011) Eckmiller, H., Hudson, D., & Reiprich, T. 2011, Astronomy & Astrophysics, 535, A105
- Ellison et al. (2019) Ellison, S. L., Brown, T., Catinella, B., & Cortese, L. 2019, MNRAS, 482, 5694, doi: 10.1093/mnras/sty3139
- Ferguson & Sandage (1990) Ferguson, H. C., & Sandage, A. 1990, AJ, 100, 1, doi: 10.1086/115486
- Fielding et al. (2017) Fielding, D., Quataert, E., McCourt, M., & Thompson, T. A. 2017, Monthly Notices of the Royal Astronomical Society, 466, 3810
- Firth et al. (2006) Firth, P., Evstigneeva, E., Jones, J., et al. 2006, Monthly Notices of the Royal Astronomical Society, 372, 1856
- Flesch (2015) Flesch, E. W. 2015, PASA, 32, e010, doi: 10.1017/pasa.2015.10
- Forbes et al. (2017) Forbes, D. A., Alabi, A., Romanowsky, A. J., et al. 2017, MNRAS, 464, L26, doi: 10.1093/mnrasl/slw176
- Gabor & Davé (2015) Gabor, J. M., & Davé, R. 2015, Monthly Notices of the Royal Astronomical Society, 447, 374
- Gao et al. (2020) Gao, F., Wang, L., Pearson, W., et al. 2020, Astronomy & Astrophysics, 637, A94
- Garnett (2002) Garnett, D. R. 2002, The Astrophysical Journal, 581, 1019, doi: 10.1086/344301
- Gaspari et al. (2014) Gaspari, M., Brighenti, F., Temi, P., & Ettori, S. 2014, The Astrophysical Journal Letters, 783, L10
- Gott III & Turner (1977) Gott III, J. R., & Turner, E. L. 1977, Astrophysical Journal, Vol. 213, pp. 309-322 (1977)., 213, 309
- Goulding et al. (2016) Goulding, A. D., Greene, J. E., Ma, C.-P., et al. 2016, The Astrophysical Journal, 826, 167
- Gozaliasl et al. (2019) Gozaliasl, G., Finoguenov, A., Tanaka, M., et al. 2019, Monthly Notices of the Royal Astronomical Society, 483, 3545
- Grcevich & Putman (2009) Grcevich, J., & Putman, M. E. 2009, The Astrophysical Journal, 696, 385
- Guo et al. (2020) Guo, H., Jones, M. G., Haynes, M. P., & Fu, J. 2020, The Astrophysical Journal, 894, 92
- Habouzit et al. (2017) Habouzit, M., Volonteri, M., & Dubois, Y. 2017, Monthly Notices of the Royal Astronomical Society, 468, 3935
- Hainline et al. (2016) Hainline, K. N., Reines, A. E., Greene, J. E., & Stern, D. 2016, The Astrophysical Journal, 832, 119
- Haynes et al. (2011) Haynes, M. P., Giovanelli, R., Martin, A. M., et al. 2011, The astronomical journal, 142, 170
- Haynes et al. (2018) Haynes, M. P., Giovanelli, R., Kent, B. R., et al. 2018, The Astrophysical Journal, 861, 49
- Heckman & Best (2014) Heckman, T. M., & Best, P. N. 2014, Annual Review of Astronomy and Astrophysics, 52, 589
- Hess & Wilcots (2013) Hess, K. M., & Wilcots, E. M. 2013, The Astronomical Journal, 146, 124
- Hickson et al. (1992) Hickson, P., Mendes de Oliveira, C., Huchra, J. P., & Palumbo, G. G. 1992, Astrophysical Journal, Part 1 (ISSN 0004-637X), vol. 399, no. 2, p. 353-367., 399, 353
- Hu & Kravtsov (2003) Hu, W., & Kravtsov, A. V. 2003, The Astrophysical Journal, 584, 702
- Hutchens et al. (2023) Hutchens, Z. L., Kannappan, S. J., Berlind, A. A., et al. 2023, The Astrophysical Journal, 956, 51, doi: 10.3847/1538-4357/acefd4
- Jakobs et al. (2018) Jakobs, A., Viola, M., McCarthy, I., et al. 2018, Monthly Notices of the Royal Astronomical Society, 480, 3338
- Jones et al. (2024) Jones, M. G., Sand, D. J., Karunakaran, A., et al. 2024, The Astrophysical Journal, 966, 93
- Kalberla et al. (2005) Kalberla, P. M., Burton, W., Hartmann, D., et al. 2005, Astronomy & Astrophysics, 440, 775
- Kalberla & Kerp (2009) Kalberla, P. M., & Kerp, J. 2009, Annual review of astronomy and Astrophysics, 47, 27
- Kannappan (2004) Kannappan, S. J. 2004, The Astrophysical Journal, 611, L89
- Kannappan & Gawiser (2007) Kannappan, S. J., & Gawiser, E. 2007, The Astrophysical Journal, 657, L5
- Kannappan et al. (2009) Kannappan, S. J., Guie, J. M., & Baker, A. J. 2009, The Astronomical Journal, 138, 579
- Kannappan & Wei (2008) Kannappan, S. J., & Wei, L. H. 2008, AIP Conference Proceedings, 1035, 163
- Kannappan et al. (2013) Kannappan, S. J., Stark, D. V., Eckert, K. D., et al. 2013, The Astrophysical Journal, 777, 42
- Kauffmann et al. (2003) Kauffmann, G., Heckman, T. M., White, S. D. M., et al. 2003, Monthly Notices of the Royal Astronomical Society, 341, 54, doi: 10.1046/j.1365-8711.2003.06292.x
- Kaviraj (2014) Kaviraj, S. 2014, Monthly Notices of the Royal Astronomical Society, 440, 2944
- Kereš et al. (2005) Kereš, D., Katz, N., Weinberg, D. H., & Davé, R. 2005, Monthly Notices of the Royal Astronomical Society, 363, 2
- Kim & Fabbiano (2013) Kim, D.-W., & Fabbiano, G. 2013, The Astrophysical Journal, 776, 116, doi: 10.1088/0004-637X/776/2/116
- Kim et al. (2016) Kim, H.-S., Wyithe, J. S. B., Baugh, C., et al. 2016, Monthly Notices of the Royal Astronomical Society, stw2779
- Kim et al. (2017) Kim, H.-S., Wyithe, J. S. B., Baugh, C. M., et al. 2017, Monthly Notices of the Royal Astronomical Society, 465, 111, doi: 10.1093/mnras/stw2779
- Kravtsov et al. (2004) Kravtsov, A. V., Berlind, A. A., Wechsler, R. H., et al. 2004, The Astrophysical Journal, 609, 35
- Latimer et al. (2019) Latimer, L. J., Reines, A. E., Plotkin, R. M., Russell, T. D., & Condon, J. J. 2019, The Astrophysical Journal, 884, 78
- Lehmer et al. (2010) Lehmer, B., Alexander, D., Bauer, F., et al. 2010, The Astrophysical Journal, 724, 559
- Lehmer et al. (2022) Lehmer, B. D., Eufrasio, R. T., Basu-Zych, A., et al. 2022, The Astrophysical Journal, 930, 135
- Lehmer et al. (2019) Lehmer, B. D., Eufrasio, R. T., Tzanavaris, P., et al. 2019, The Astrophysical Journal Supplement Series, 243, 3
- Lehmer et al. (2020) Lehmer, B. D., Ferrell, A. P., Doore, K., et al. 2020, The Astrophysical Journal Supplement Series, 248, 31
- Lehmer et al. (2024) Lehmer, B. D., Monson, E. B., Eufrasio, R. T., et al. 2024, arXiv preprint arXiv:2410.19901
- Li et al. (2017) Li, T., Simon, J. D., Drlica-Wagner, A., et al. 2017, The Astrophysical Journal, 838, 8
- Liu et al. (2019) Liu, H.-Y., Liu, W.-J., Dong, X.-B., et al. 2019, ApJS, 243, 21, doi: 10.3847/1538-4365/ab298b
- Lower et al. (2020) Lower, S., Narayanan, D., Leja, J., et al. 2020, The Astrophysical Journal, 904, 33
- Mezcua & Sánchez (2024) Mezcua, M., & Sánchez, H. D. 2024, Monthly Notices of the Royal Astronomical Society, 528, 5252
- Mineo et al. (2014) Mineo, S., Gilfanov, M., Lehmer, B. D., Morrison, G. E., & Sunyaev, R. 2014, MNRAS, 437, 1698, doi: 10.1093/mnras/stt1999
- Mineo et al. (2012) Mineo, S., Gilfanov, M., & Sunyaev, R. 2012, Monthly Notices of the Royal Astronomical Society, 419, 2095
- Miraghaei (2020) Miraghaei, H. 2020, The Astronomical Journal, 160, 227, doi: 10.3847/1538-3881/abafb1
- Moffett et al. (2015) Moffett, A. J., Kannappan, S. J., Berlind, A. A., et al. 2015, The Astrophysical Journal, 812, 89
- Mukai (1993) Mukai, K. 1993, Legacy, 3, 21
- Mulchaey (2000) Mulchaey, J. S. 2000, Annual Review of Astronomy and Astrophysics, 38, 289
- Nelson et al. (2013) Nelson, D., Vogelsberger, M., Genel, S., et al. 2013, Monthly Notices of the Royal Astronomical Society, 429, 3353
- Obuljen et al. (2019) Obuljen, A., Alonso, D., Villaescusa-Navarro, F., Yoon, I., & Jones, M. 2019, Monthly Notices of the Royal Astronomical Society, 486, 5124, doi: 10.1093/mnras/stz1118
- O’Sullivan et al. (2018) O’Sullivan, E., Kolokythas, K., Kantharia, N. G., et al. 2018, Monthly Notices of the Royal Astronomical Society, 473, 5248
- Penny et al. (2018) Penny, S. J., Masters, K. L., Smethurst, R., et al. 2018, Monthly Notices of the Royal Astronomical Society, 476, 979
- Pipino et al. (2014) Pipino, A., Cibinel, A., Tacchella, S., et al. 2014, The Astrophysical Journal, 797, 127
- Polimera et al. (2022) Polimera, M. S., Kannappan, S. J., Richardson, C. T., et al. 2022, The Astrophysical Journal, 931, 44
- Ponman et al. (1994) Ponman, T., Allan, D., Jones, L., et al. 1994, Nature, 369, 462
- Price-Whelan et al. (2022) Price-Whelan, A. M., Lim, P. L., Earl, N., et al. 2022, The Astrophysical Journal, 935, 167
- Putman et al. (2021) Putman, M. E., Zheng, Y., Price-Whelan, A. M., et al. 2021, The Astrophysical Journal, 913, 53
- Ranalli et al. (2003) Ranalli, P., Comastri, A., & Setti, G. 2003, A&A, 399, 39, doi: 10.1051/0004-6361:20021600
- Rasmussen et al. (2012) Rasmussen, J., Bai, X.-N., Mulchaey, J. S., et al. 2012, ApJ, 747
- Reines et al. (2020) Reines, A. E., Condon, J. J., Darling, J., & Greene, J. E. 2020, The Astrophysical Journal, 888, 36
- Rood & Dickel (1978) Rood, H. J., & Dickel, J. R. 1978, ApJ, 224, 724, doi: 10.1086/156422
- Saraf et al. (2024) Saraf, M., Cortese, L., Wong, O. I., et al. 2024, Monthly Notices of the Royal Astronomical Society, stae942
- Satyapal et al. (2018) Satyapal, S., Abel, N. P., & Secrest, N. J. 2018, ApJ, 858, 38, doi: 10.3847/1538-4357/aab7f8
- Shi et al. (2020) Shi, X., Nagai, D., Aung, H., & Wetzel, A. 2020, Monthly Notices of the Royal Astronomical Society, 495, 784
- Sinha & Holley-Bockelmann (2009) Sinha, M., & Holley-Bockelmann, K. 2009, Monthly Notices of the Royal Astronomical Society, 397, 190
- Skibba et al. (2011) Skibba, R. A., van den Bosch, F. C., Yang, X., et al. 2011, Monthly Notices of the Royal Astronomical Society, 410, 417
- Smith et al. (2011) Smith, B. D., Hallman, E. J., Shull, J. M., & O’Shea, B. W. 2011, The Astrophysical Journal, 731, 6
- Snowden et al. (1994) Snowden, S., McCammon, D., Burrows, D., & Mendenhall, J. 1994, Astrophysical Journal, Part 1 (ISSN 0004-637X), vol. 424, no. 2, p. 714-728, 424, 714
- Somerville et al. (2008) Somerville, R. S., Hopkins, P. F., Cox, T. J., Robertson, B. E., & Hernquist, L. 2008, MNRAS, 391, 481, doi: 10.1111/j.1365-2966.2008.13805.x
- Springob et al. (2005) Springob, C. M., Haynes, M. P., Giovanelli, R., & Kent, B. R. 2005, The Astrophysical Journal Supplement Series, 160, 149
- Stark et al. (2013) Stark, D. V., Kannappan, S. J., Wei, L. H., et al. 2013, The Astrophysical Journal, 769, 82
- Stark et al. (2016) Stark, D. V., Kannappan, S. J., Eckert, K. D., et al. 2016, The Astrophysical Journal, 832, 126
- Stasińska et al. (2006) Stasińska, G., Cid Fernandes, R., Mateus, A., Sodré, L., & Asari, N. V. 2006, Monthly Notices of the Royal Astronomical Society, 371, 972, doi: 10.1111/j.1365-2966.2006.10732.x
- Sturm et al. (2025) Sturm, M. R., Hayes, B., & Reines, A. E. 2025, arXiv preprint arXiv:2501.09791
- Sun et al. (2009) Sun, M., Voit, G., Donahue, M., et al. 2009, The Astrophysical Journal, 693, 1142
- Tinker et al. (2008) Tinker, J., Kravtsov, A. V., Klypin, A., et al. 2008, The Astrophysical Journal, 688, 709, doi: 10.1086/591439
- Trebitsch et al. (2018) Trebitsch, M., Volonteri, M., Dubois, Y., & Madau, P. 2018, Monthly Notices of the Royal Astronomical Society, 478, 5607
- Trevisan & Mamon (2017) Trevisan, M., & Mamon, G. A. 2017, Monthly Notices of the Royal Astronomical Society, 471, 2022
- Van Driel et al. (1992) Van Driel, W., Augarde, R., Bottinelli, L., et al. 1992, Astronomy and Astrophysics, 259, 71
- Veilleux & Osterbrock (1987) Veilleux, S., & Osterbrock, D. E. 1987, Astrophysical Journal Supplement Series (ISSN 0067-0049), vol. 63, Feb. 1987, p. 295-310. NSERC-supported research., 63, 295
- Véron-Cetty & Véron (2006) Véron-Cetty, M. P., & Véron, P. 2006, A&A, 455, 773, doi: 10.1051/0004-6361:20065177
- Voges (1993) Voges, W. 1993, Advances in Space Research, 13, 391
- Voges et al. (1999) Voges, W., Aschenbach, B., Boller, T., et al. 1999, arXiv preprint astro-ph/9909315
- Wilcots (2009) Wilcots, E. M. 2009, Astronomische Nachrichten: Astronomical Notes, 330, 1059
- Zhang et al. (2024) Zhang, Y., Comparat, J., Ponti, G., et al. 2024, arXiv e-prints, arXiv:2401.17309, doi: 10.48550/arXiv.2401.17309
- Zhu & Putman (2023) Zhu, J., & Putman, M. E. 2023, Monthly Notices of the Royal Astronomical Society, 521, 3765