TESS Light Curve of the Interacting Binary W Serpentis
Abstract
The unusual light curve of the massive eclipsing binary W Ser was recently observed with high S/N and fast cadence by the NASA TESS mission. The TESS light curve records two eclipses and relatively fast variations outside of the eclipses. The eclipse timings verify the period increase of the binary, and the period derivative implies a mass transfer rate in excess of yr-1. The light curve shows a fading trend from just after an eclipse until the start of the next eclipse. The brightest flux source in the system is the accretion torus surrounding the mass gainer star, and we argue that these orbital-phase related fadings are the result of the injection of cooler gas from the mass donor entering the outskirts of the accretion torus. There are cyclic variations in the out-of-eclipse sections of the light curve that vary on a 2.8 day timescale. This equals the orbital period for gas in the outer regions of the accretion torus, so the photometric variations are probably the result of transitory, over-dense regions that form at the rim of the accretion torus.
1 Introduction
Massive stars are often found in close pairs that are destined to become interacting binaries (S. E. de Mink et al., 2013). The mass transfer and loss that occurs during their interacting stage will dramatically alter their evolutionary paths. The initially more massive star will be the first to grow in size to fill its Roche radius. This mass donor star will then begin mass transfer to the gainer companion at an ever increasing rate as the separation decreases. Once the mass ratio reverses, the system will enlarge with continued mass transfer at a decreasing rate. The mass donor will eventually lose most of its outer envelope, while the mass gainer will become a massive rapid rotator. Eventually the gainer will attain critical rotation and will no longer be able to gather mass from its surrounding accretion disk. The accretion disk will become a holding-zone torus that will leak gas away from the binary through the outer L3 Lagrangian point to create an equatorial circumbinary outflow (W. Lu et al., 2023). How much mass is lost at this stage is critical to the final outcome of the binary system.
This stage of intense mass transfer is very short ( years; S. Wellstein et al. 2001; W. van Rensbergen et al. 2008), so binaries caught at this evolutionary point will be rare. Nevertheless, there is a class of Algol-type eclipsing binaries that are probably experiencing this phase of strong mass transfer. These are members of the W Serpentis category of binary stars that show abundant evidence of mass transfer and an optically thick torus that blocks out the gainer star from view. There are some dozen known examples of which the brightest (and most famous) is probably Lyrae (D. Mourard et al., 2018). W Ser (HD 166126, TIC 106163940) is the prototype of the category. It is an eclipsing binary with an orbital period of about days (E. F. Guinan, 1989; A. Erdem & O. Öztürk, 2014; K. Shepard et al., 2024). The visible spectrum is dominated by deep shell lines and strong emission lines that mainly originate in a thick circumbinary disk (C. A. Bauer, 1945; J. Sahade & O. Struve, 1957; R. Barba, 1993). However, the ultraviolet spectrum shows an extended, short wavelength continuum and an array of highly excited emission lines that implicate a hot temperature for the hidden mass gainer (M. J. Plavec, 1989; J. L. Weiland et al., 1995; M. R. Sanad & M. Bobrowsky, 2013). New echelle spectroscopy of W Ser has revealed for the first time the faint spectral absorption lines associated with the cool mass donor star (K. Shepard et al., 2024). The donor star’s radial velocity semiamplitude can be compared to the star’s projected rotational velocity to determine the system mass ratio by assuming that the donor fills its Roche lobe. The resulting mass estimates are 2.0 and for the donor and gainer, respectively (K. Shepard et al., 2024). These results indicate that W Ser is a massive binary that is experiencing an extreme mass transfer rate and systemic mass loss.
The light curve of W Ser presents a number of puzzling features that are described by E. F. Guinan (1989). Timings of the deep primary eclipses from over the last century indicate that the orbital period is increasing at a rate of 19 seconds per year, which implies a large mass transfer rate (A. Erdem & O. Öztürk, 2014). However, the secondary eclipse has eluded detection presumably because the mass donor star is quite cool compared to the mass gainer and its accretion torus (K. Shepard et al., 2024). K. Shepard et al. (2024) present a discussion of the All Sky Automated Survey (ASAS) light curve (G. Pojmanski & G. Maciejewski, 2004) that was obtained between 2001 and 2004. It shows an unusual jump in brightness from before to after the primary eclipse as well as relatively large mag stochastic variations that are unrelated to orbital phase. We can now explore the origin of these light curve properties thanks to measurements made by the NASA TESS mission (G. R. Ricker et al., 2015) in 2024 July. Here we present an analysis of the new TESS light curve of W Ser to investigate the long-term, orbital, and fast variations that are clearly revealed for the first time.
2 Ephemeris and Period Change
The NASA TESS mission obtained its first light curve of W Ser over 26 days in Sector 80 at a cadencce of 200 seconds. The TESS spectral throughput corresponds to a band covering the 6000 – 10000 Å range. The TESS pixel scale is approximately 21 arcsec per pixel, so blending with the flux of other nearby stars can present a problem for data analysis. However, an inspection of the Gaia DR3 catalog (Gaia Collaboration et al., 2023) indicates that the combined flux of all the other sources within a few pixels of the target amounts to no more than of the flux of W Ser, so no correction was made in the light curve model for additional third light (Section 3). We obtained the MIT Quick-Look Pipeline version of the light curve (C. X. Huang et al., 2020) from the Mikulski Archive for Space Telescopes111https://mast.stsci.edu/portal/Mashup/Clients/Mast/Portal.html. We present here the systematics-corrected flux that is formed by applying small instrumental corrections without detrending. We removed those measurements that had bad calibration quality flags. The normalized flux as a function of time is plotted in Figure 1. The TESS observations recorded two deep, primary eclipses and the faster variations seen outside of the eclipses.
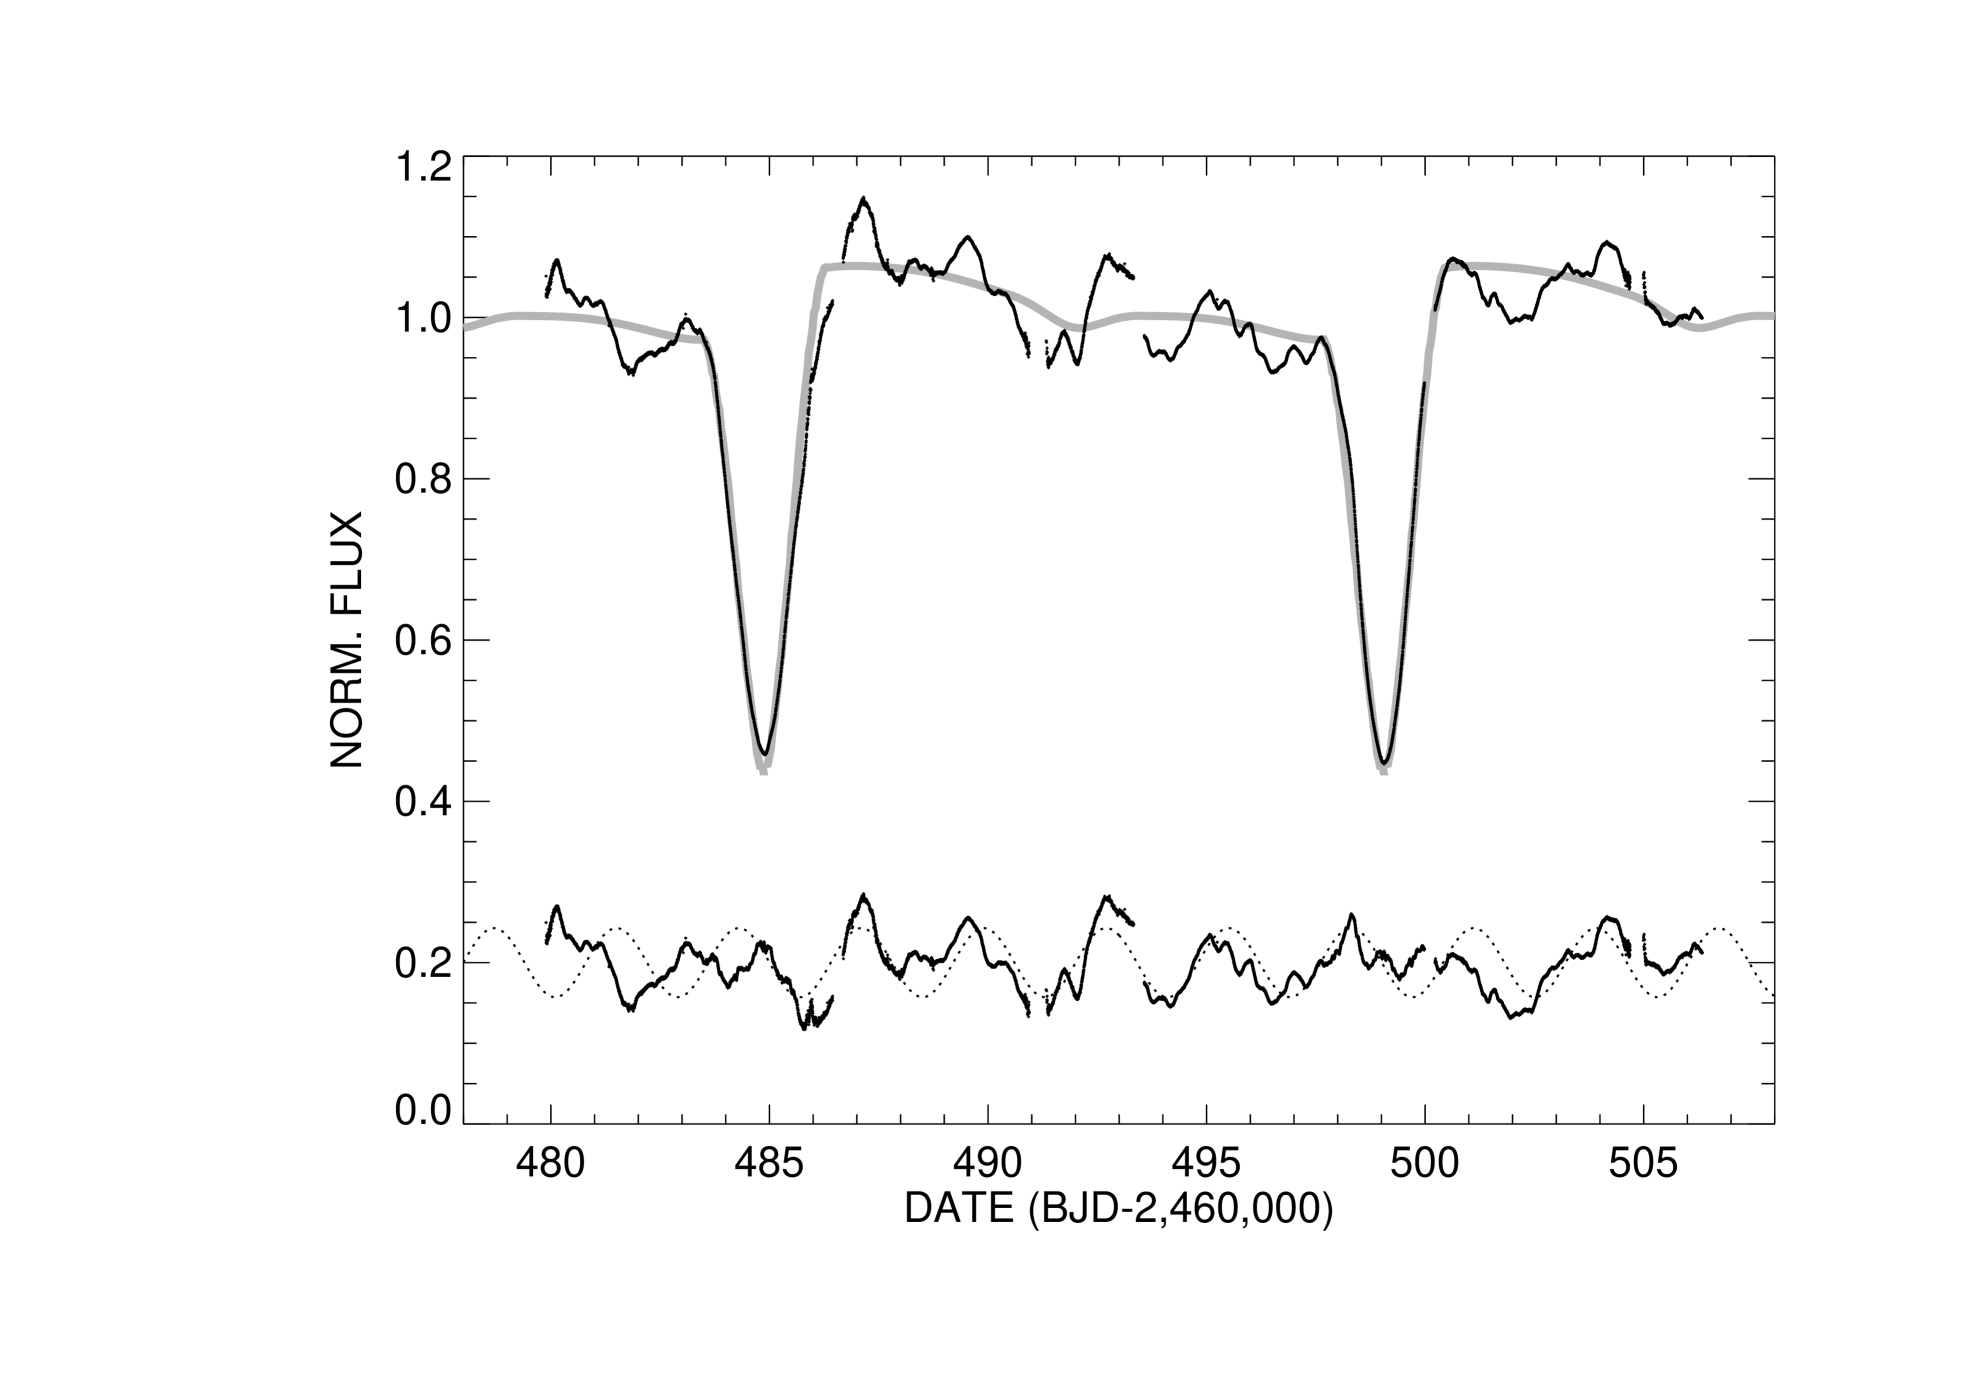
The excellent quality of the light curve reveals subtle asymmetries in the shapes of the eclipses, so fits of eclipse mid-point depend upon the time range included in the fit. We made parabolic fits to the lower parts of the eclipse plot over samples from to of the eclipse depth. We then constructed a linear fit of eclipse time as a function of residual depth, and we extrapolated to zero depth to derive the estimated eclipse time. The eclipses occurred at BJD 2,460,484.8759 and 2,460,499.0616 , where the uncertainties are taken conservatively as the standard deviation of the individual fits at different line depths.
The difference in the eclipse times yields a period of at the epoch of the TESS observations. A. Erdem & O. Öztürk (2014) found a net period increase of seconds per year from the historical record of eclipse timings, and their predicted period at the TESS epoch of agrees within uncertainties with that derived from the TESS observations.
The period derivative is related to the mass transfer rate in the case of conservative mass transfer (A. Erdem & O. Öztürk, 2014). Comparing the current period from the TESS light curve with the results from A. Erdem & O. Öztürk (2014) yields a period increase rate of 19.7 seconds per year. Adopting the masses from K. Shepard et al. (2024), this implies a mass transfer rate of yr-1. This estimate is a lower limit if some fraction of the mass transfer is lost through the outer Lagrangian point (R. W. Hilditch, 2001).
3 Light Curve Model
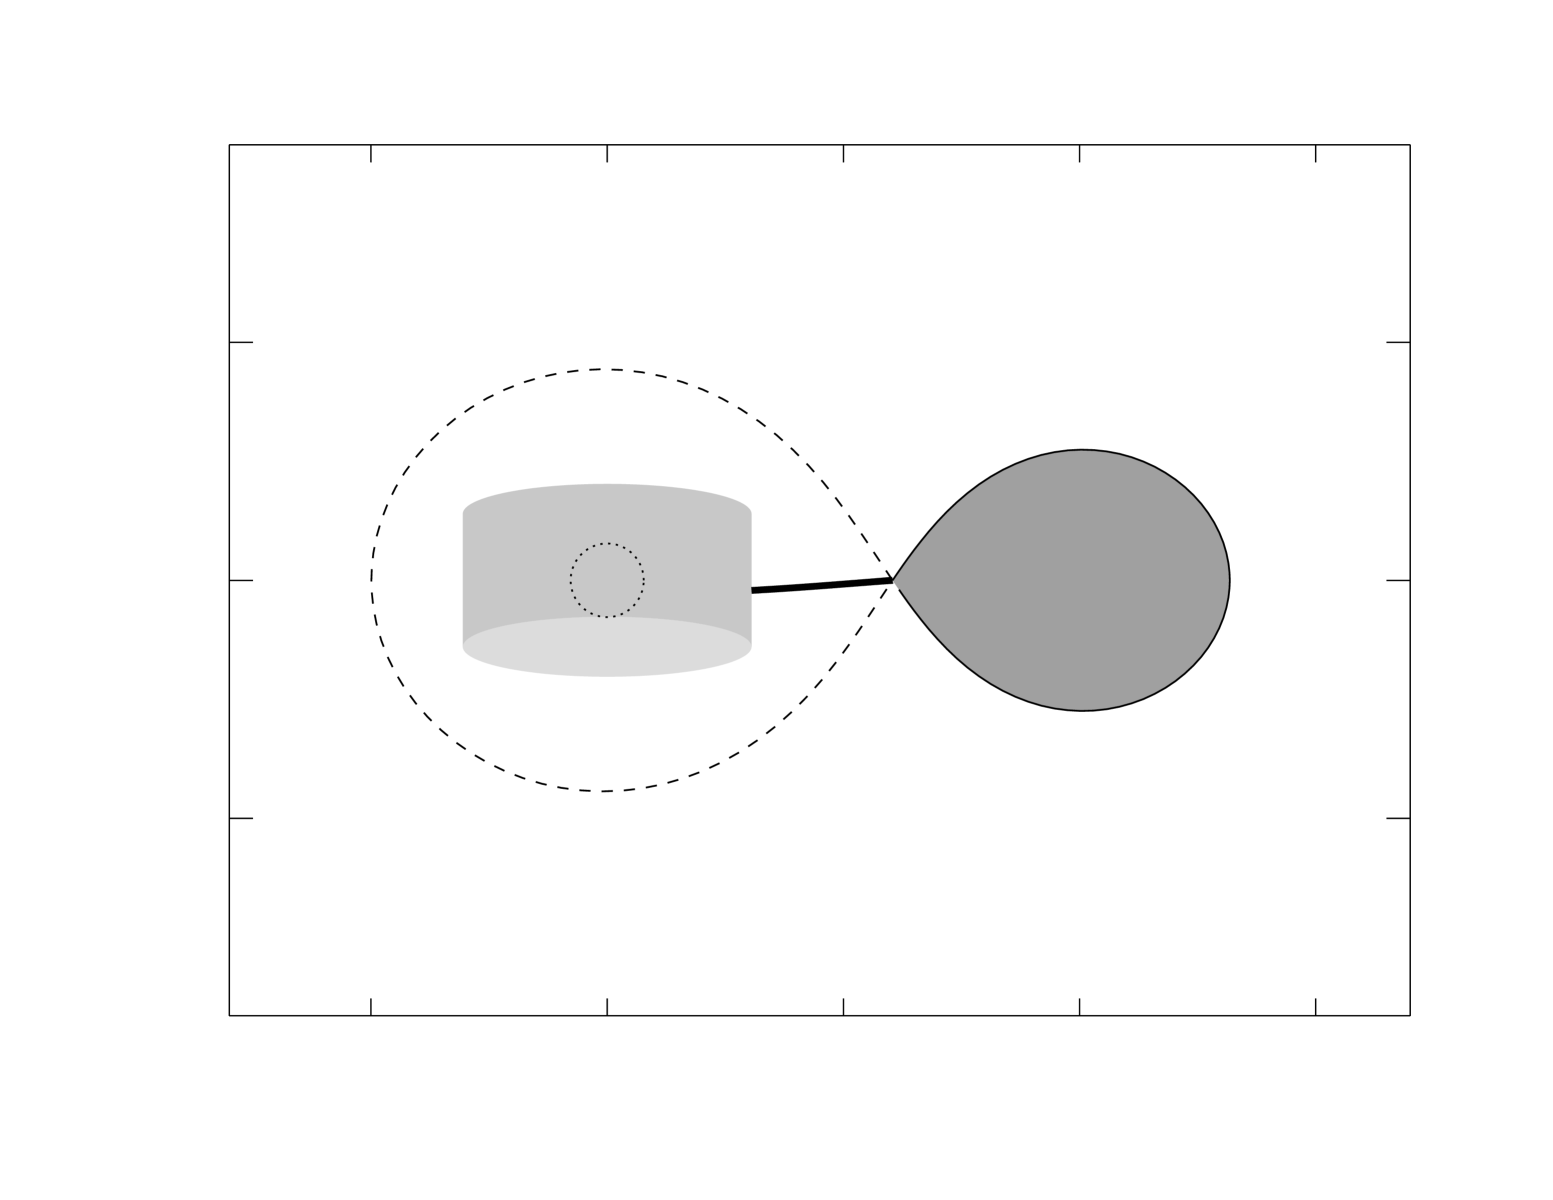
K. Shepard et al. (2024) described a fit of the ASAS light curve that they calculated using the ELC binary star code (J. A. Orosz & P. H. Hauschildt, 2000). The model creates an orbital light curve based upon the flux from an optically thick torus surrounding the mass gainer star and from the fainter mass donor star. The geometry of components is shown in Figure 2. We adopted the same basic parameters to make a fit of the orbital variations in the TESS light curve. These are summarized in Table 4 of the paper by K. Shepard et al. (2024). The torus extends outwards from the gainer star to a radius of at an opening angle of from the orbital plane. The gas temperature in the torus decreases from 14.3 kK at the inner boundary to 8.0 kK at the disk rim, all much higher than the temperature of the mass donor kK. The vertical extent at the gas torus rim () is large enough to completely block the flux from the gainer star for an orbital inclination of (Fig. 2).
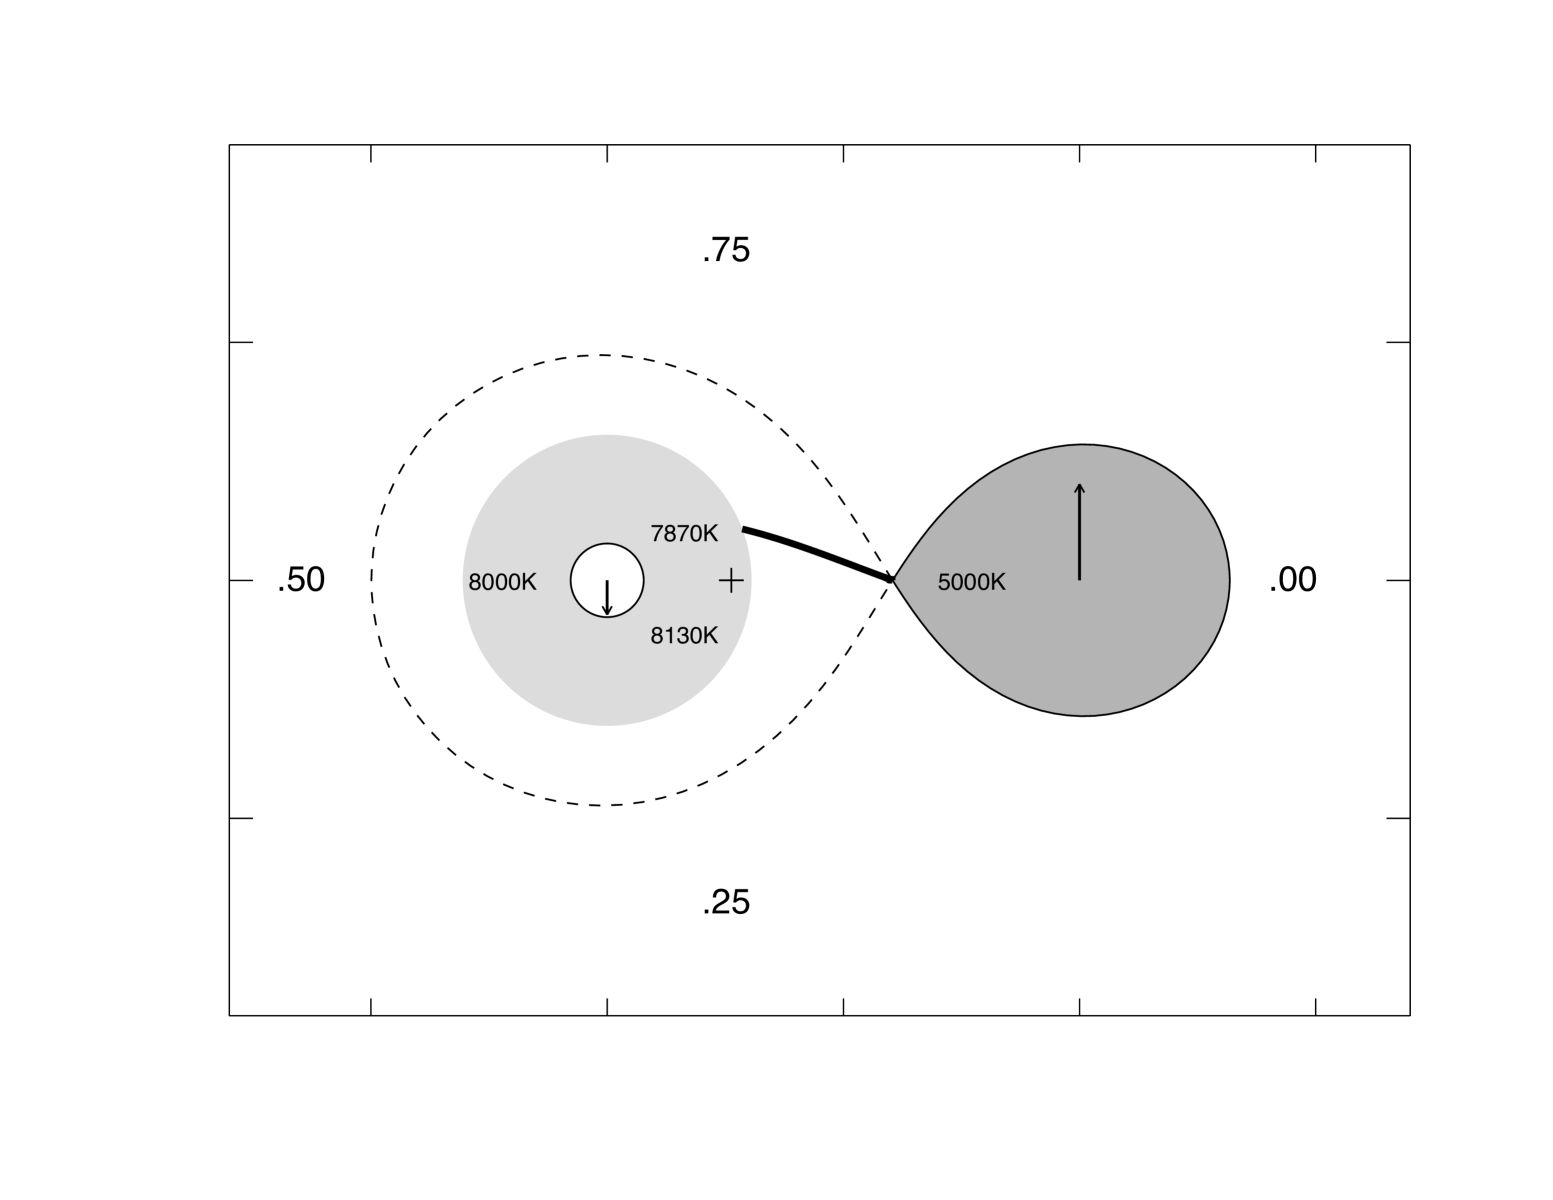
We applied the same approach in fitting the TESS light curve, but we added a scheme to consider a temperature change at the torus rim that is related to azimuthal position. The incoming gas stream from the mass donor has a lower temperature than the average gas temperature in the outskirts of the torus, and this would tend to lower the torus gas temperature in the vicinity of the stream-torus intersection point. As this accreted gas is carried around the torus, it would increase in temperature through mixing with the hotter torus gas. Thus, we might expect that the average gas temperature at the torus rim would be slightly lower at positions just ahead of the axis joining the stars and slightly higher at azimuthal positions below the axis (Fig. 2). Such a temperature variation could explain the observed lower flux before and higher flux after the eclipse (Fig. 1). Note that in some Algol binaries there is evidence of a heated region where the incoming gas stream strikes the accretion disk or gainer star (G. J. Peters & R. S. Polidan, 1984). Indeed, J. L. Weiland et al. (1995) consider such a hot spot as the possible source of the Si IV emission lines in the spectrum of W Ser. However, such a hot spot would add to the observed flux at orbital phases before the eclipse, when in fact the system appears relatively faint. Thus, we suspect that any shock heating at the stream - torus meeting point is less evident in the case of W Ser because the torus is large, vertically extended, and has a relatively low gas density compared to an equatorially confined accretion disk.
We implemented this change by calculating light curves for two temperatures bracketing the default torus rim temperature of 8.0 kK. We then determined the model light curve flux as a function of orbital phase by interpolating between these two models for an assumed relation between torus azimuthal position and temperature. We set the temperature variation function as an inverse sawtooth waveform centered on the eclipse that was smoothed with a Gaussian transfer function of FWHM = . This produced a smoothly varying function with a maximum (minimum) near phase 0.1 (0.9). The only fitting parameter is the maximum temperature deviation from the default value. We found we could make a good fit of the TESS light curve with a full temperature variation at the disk rim of degrees. This range of rim temperature is labeled within the torus in Figure 2 at the approximate positions of the temperature extrema and mean values. The model light curve is shown as a gray line in Figure 1, and the introduction of the temperature variation in the torus rim is able to match the observed flux decline between eclipses.
4 Fast Variations
The residuals from the orbital fit of the light curve are shown in the lower part of Figure 1, and they show clearly the faster than orbital fluctuations that were so striking in earlier light curve investigations. The periodic content of the variations is plotted in the power spectrum given in Figure 3. This shows the Discrete Fourier Transform of the residuals corrected for aliases using the CLEAN algorithm (D. H. Roberts et al., 1987). There is little power at high frequencies, and the main signals correspond to periods longer than 2 days. The most prominent peak occurs at a frequency of cycles per day. The corresponding periodic variation of days is shown as a dotted line superimposed on the residuals in Figure 1. It appears that a quasi-sinusoidal variation is present that may last for six or so cycles before losing coherence.

The main flux contributing component to the TESS measurements is the edge rim of the bright torus surrounding the gainer star (Fig. 2). The orbital period for torus gas at the outer rim is 2.79 days for a gainer mass of (K. Shepard et al., 2024). This is the same within uncertainties as the fast variation seen in the TESS light curve. We suggest the fast variations are the result of turbulent knots in the torus gas that create dense and bright sub-regions at the torus rim.
5 The 1956 Light Curve
A comparison of the TESS light curve with that obtained by A. Fresa (1957) in 1956 provides us with a glimpse into changes that have occurred over timescales of decades. A. Fresa (1957) made photoelectric observations on 109 nights over a period of 134 days, and because of the diurnal sampling, these measurements are useful to study variations on timescales longer than 2 days. The photometry was obtained with an unfiltered IP21 photocell that was sensitive to flux in the 3000 – 6000 Å range. His measurements are presented in Table 1 of his paper, and these are provided in a machine-readable table that is available with the electronic version of our paper.
A. Fresa (1957) estimated that the orbital period was days in 1956. We rescaled our model light curve to this period, and we found that a small phase offset () was required to register the observations and model in orbital phase. The revised eclipse epoch for the 1956 observations is HJD 2,435,686.247. The flux normalized version of the 1956 light curve is shown as a function of orbital phase in Figure 4. The full temporal version of the light curve is given in Figure 1 in the paper by A. Fresa (1957). The model light curve from the fit of the TESS data is also shown in Figure 4. The 1956 light curve shows similar eclipses and the general flux decline between eclipses as seen in the TESS light curve, but the residuals from the fit show a larger dispersion, and there is a local flux maximum near orbital phase 0.5 that is absent in the TESS light curve.
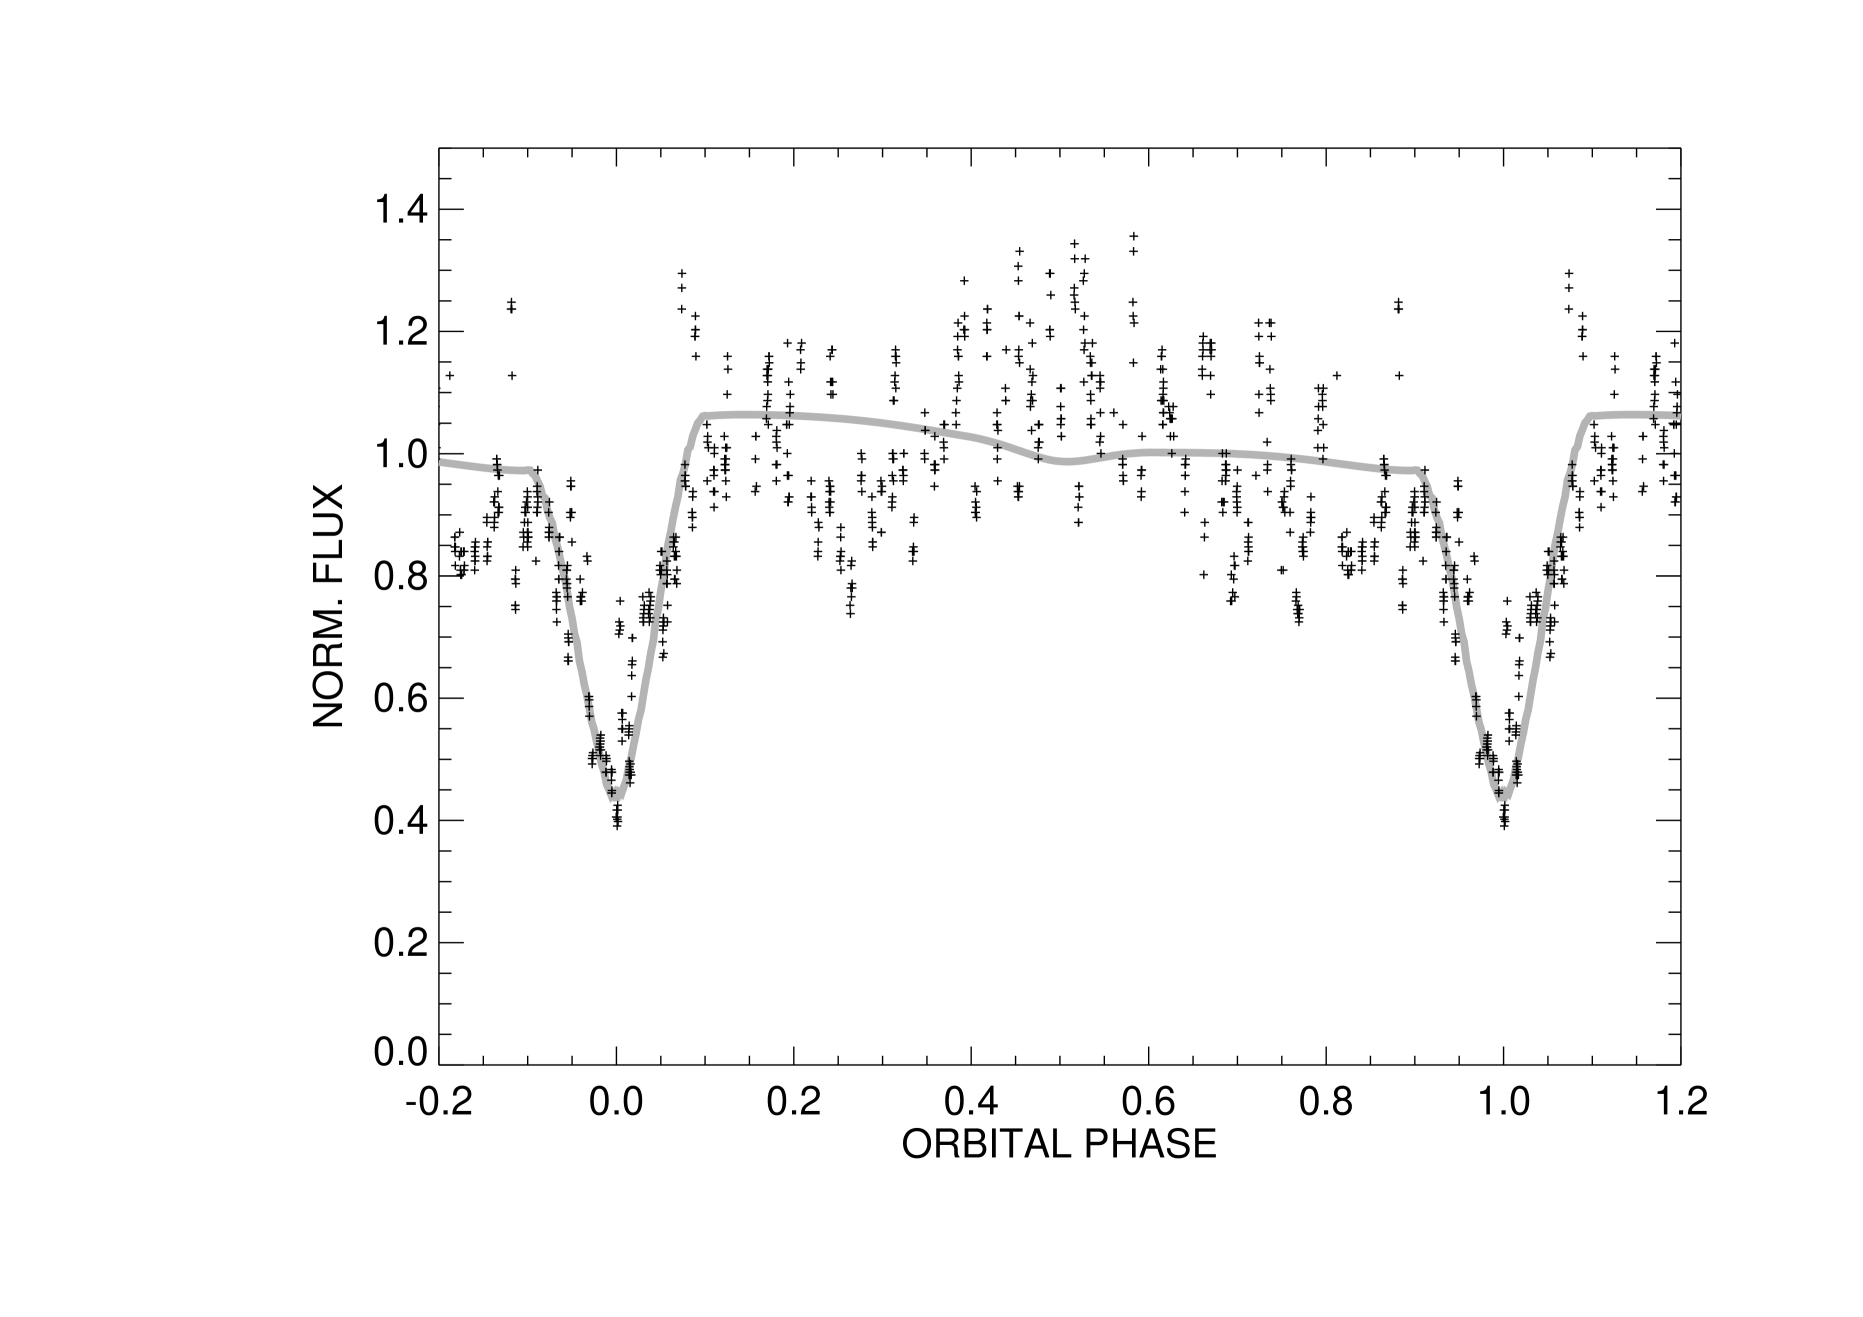
The power spectrum of the time series formed by subtracting the model from the observed 1956 light curve is presented in Figure 5. The corresponding power spectrum for the TESS light curve (Fig. 3) is plotted as a dotted line. The comparison shows that the same rapid signal found in the TESS data at a frequency of 0.357 cycles per day (Section 4) was also present in the 1956 light curve with approximately the same amplitude. This is consistent with the visual impression of a 2.8 day oscillation that is apparent in some sections of the temporal light curve in Figure 1 of A. Fresa (1957). There are other stronger peaks in the 1956 power spectrum on time scales related to the orbital period, half the orbital period, and the full observing season. The orbital and half orbital peaks are related to the local brighter appearance in the light curve near orbital phase 0.5 (Fig. 4). The low frequency peak corresponds to a period of 117 days that is comparable to the timespan the observations (134 days). This may be related to longer, year-to-year variations that were found by D. B. McLaughlin (1961) from observations obtained between 1928 and 1931. The local maximum at phase 0.5 appearing in the 1956 light curve is not evident in the mean adjusted light curve from 1928 – 1930 (see Fig. 2 of D. B. McLaughlin 1961), nor in the 2024 TESS light curve (Fig. 1). Taken together, the photometric record indicates that significant changes occur beyond those on the orbital and 2.8 day timescales highlighted in this paper.

6 Conclusions
The exquisite TESS light curve of W Ser has solved several of the mysteries about the system’s unusual light curve. The eclipse timings verify the period increase observed over the last century, and the period derivative implies that large scale mass transfer is taking place. The gainer cannot easily accrete this mass flow, and the gas accumulates in a large accretion torus that effectively blocks the gainer from view. The orbital variation in the TESS light curve is well matched by a model for this optically thick torus. In particular, the strange jump in brightness across the eclipse can be explained by considering how cooler gas enters the torus at an azimuthal position slightly ahead of the direction of the donor star. The TESS light curve shows that the dominant timescale of the stochastic or fast variations is the same as the gas orbital period at the outer rim of the torus. This same periodicity is present in the detailed 1956 light curve from A. Fresa (1957). These photometric variations are probably caused by relatively brighter sub-regions in the outer rim of gas torus that are carried into and out of view as those regions orbit the mass gainer star. Thus, high quality, fast cadence photometry offers us a window into the fast changing weather conditions in the outer accretion torus. We will soon have two more opportunities to follow such variations when TESS again captures the flux variations of W Ser in future observing sectors 90 and 91 (in 2025 April and May).
References
- R. Barba (1993) Barba, R. 1993, \bibinfotitleNew optical spectrographic observations of W Serpentis., A&A, 269, 390
- C. A. Bauer (1945) Bauer, C. A. 1945, \bibinfotitleThe Spectrum of W Serpentis., ApJ, 101, 208, doi: 10.1086/144705
- S. E. de Mink et al. (2013) de Mink, S. E., Langer, N., Izzard, R. G., Sana, H., & de Koter, A. 2013, \bibinfotitleThe Rotation Rates of Massive Stars: The Role of Binary Interaction through Tides, Mass Transfer, and Mergers, ApJ, 764, 166, doi: 10.1088/0004-637X/764/2/166
- A. Erdem & O. Öztürk (2014) Erdem, A., & Öztürk, O. 2014, \bibinfotitleNon-conservative mass transfers in Algols, MNRAS, 441, 1166, doi: 10.1093/mnras/stu630
- A. Fresa (1957) Fresa, A. 1957, \bibinfotitlePhotoelectric observations of the peculiar variable star W Serpentis., AJ, 62, 362, doi: 10.1086/107552
- Gaia Collaboration et al. (2023) Gaia Collaboration, Vallenari, A., Brown, A. G. A., et al. 2023, \bibinfotitleGaia Data Release 3. Summary of the content and survey properties, A&A, 674, A1, doi: 10.1051/0004-6361/202243940
- E. F. Guinan (1989) Guinan, E. F. 1989, \bibinfotitleAlgol, Beta Lyrae, and W Serpentis: Some new results for three well studied eclipsing binaries, Space Sci. Rev., 50, 35, doi: 10.1007/BF00215917
- R. W. Hilditch (2001) Hilditch, R. W. 2001, An Introduction to Close Binary Stars (Cambridge, UK: Cambridge University Press)
- C. X. Huang et al. (2020) Huang, C. X., Vanderburg, A., Pál, A., et al. 2020, \bibinfotitlePhotometry of 10 Million Stars from the First Two Years of TESS Full Frame Images: Part I, Research Notes of the American Astronomical Society, 4, 204, doi: 10.3847/2515-5172/abca2e
- W. Lu et al. (2023) Lu, W., Fuller, J., Quataert, E., & Bonnerot, C. 2023, \bibinfotitleOn rapid binary mass transfer - I. Physical model, MNRAS, 519, 1409, doi: 10.1093/mnras/stac3621
- D. B. McLaughlin (1961) McLaughlin, D. B. 1961, \bibinfotitleVisual photometric observations of W Serpentis., AJ, 66, 351, doi: 10.1086/108433
- D. Mourard et al. (2018) Mourard, D., Brož, M., Nemravová, J. A., et al. 2018, \bibinfotitlePhysical properties of Lyrae A and its opaque accretion disk, A&A, 618, A112, doi: 10.1051/0004-6361/201832952
- J. A. Orosz & P. H. Hauschildt (2000) Orosz, J. A., & Hauschildt, P. H. 2000, \bibinfotitleThe use of the NextGen model atmospheres for cool giants in a light curve synthesis code, A&A, 364, 265, doi: 10.48550/arXiv.astro-ph/0010114
- G. J. Peters & R. S. Polidan (1984) Peters, G. J., & Polidan, R. S. 1984, \bibinfotitleEvidence for a high-temperature accretion region in Algol-type binarysystems., ApJ, 283, 745, doi: 10.1086/162359
- M. J. Plavec (1989) Plavec, M. J. 1989, \bibinfotitleCircumstellar Matter in ALGOLS and Serpentids, Space Sci. Rev., 50, 95, doi: 10.1007/BF00215922
- G. Pojmanski & G. Maciejewski (2004) Pojmanski, G., & Maciejewski, G. 2004, \bibinfotitleThe All Sky Automated Survey. Catalog of Variable Stars. III. 12h-18h Quarter of the Southern Hemisphere, Acta Astron., 54, 153, doi: 10.48550/arXiv.astro-ph/0406256
- G. R. Ricker et al. (2015) Ricker, G. R., Winn, J. N., Vanderspek, R., et al. 2015, \bibinfotitleTransiting Exoplanet Survey Satellite (TESS), Journal of Astronomical Telescopes, Instruments, and Systems, 1, 014003, doi: 10.1117/1.JATIS.1.1.014003
- D. H. Roberts et al. (1987) Roberts, D. H., Lehar, J., & Dreher, J. W. 1987, \bibinfotitleTime series analysis with CLEAN. I. Derivation of a spectrum., AJ, 93, 968, doi: 10.1086/114383
- J. Sahade & O. Struve (1957) Sahade, J., & Struve, O. 1957, \bibinfotitleThe Spectrum of Serpentis., ApJ, 126, 87, doi: 10.1086/146374
- M. R. Sanad & M. Bobrowsky (2013) Sanad, M. R., & Bobrowsky, M. 2013, \bibinfotitleSimilarities and differences in the spectral behavior of W Ser and UX Mon in the ultraviolet, Ap&SS, 344, 405, doi: 10.1007/s10509-012-1343-8
- K. Shepard et al. (2024) Shepard, K., Gies, D. R., Schaefer, G. H., et al. 2024, \bibinfotitleA Spectroscopic and Interferometric Study of W Serpentis Stars. I. Circumbinary Outflow in the Interacting Binary W Serpentis, ApJ, 977, 236, doi: 10.3847/1538-4357/ad82e7
- W. van Rensbergen et al. (2008) van Rensbergen, W., De Greve, J. P., De Loore, C., & Mennekens, N. 2008, \bibinfotitleSpin-up and hot spots can drive mass out of a binary, A&A, 487, 1129, doi: 10.1051/0004-6361:200809943
- J. L. Weiland et al. (1995) Weiland, J. L., Shore, S. N., Beaver, E. A., Lyons, R. W., & Rosenblatt, E. I. 1995, \bibinfotitleGoddard High-Resolution Spectrograph Observations of the Interacting Binary System W Serpentis, ApJ, 447, 401, doi: 10.1086/175883
- S. Wellstein et al. (2001) Wellstein, S., Langer, N., & Braun, H. 2001, \bibinfotitleFormation of contact in massive close binaries, A&A, 369, 939, doi: 10.1051/0004-6361:20010151