WorldMove, a global open data for human mobility
Abstract
High-quality human mobility data is crucial for applications such as urban planning, transportation management, and public health, yet its collection is often hindered by privacy concerns and data scarcity-particularly in less-developed regions. To address this challenge, we introduce WorldMove, a large-scale synthetic mobility dataset covering over 1,600 cities across 179 countries and 6 continents. Our method leverages publicly available multi-source data, including gridded population distribution, point-of-interest (POI) maps, and commuting origin-destination (OD) flows, to generate realistic city-scale mobility trajectories using a diffusion-based generative model. The generation process involves defining city boundaries, collecting multi-source input features, and simulating individual-level movements that reflect plausible daily mobility behavior. Comprehensive validation demonstrates that the generated data closely aligns with real-world observations, both in terms of fine-grained individual mobility behavior and city-scale population flows. Alongside the pre-generated datasets, we release the trained model and a complete open-source pipeline, enabling researchers and practitioners to generate custom synthetic mobility data for any city worldwide. WorldMove not only fills critical data gaps, but also lays a global foundation for scalable, privacy-preserving, and inclusive mobility research, empowering data-scarce regions and enabling universal access to human mobility insights.
1 Background & Summary
High-quality human mobility data plays a crucial role in diverse domains such as urban planning, transportation management, public health interventions, and sustainable development. However, recent research has revealed that existing mobility datasets, which are often derived from isolated platforms or providers, can exhibit significant structural biases. For instance, Gallotti et al. [1] demonstrate that different mobility data sources (e.g., GPS, CDR, census, Google, Facebook) show substantial divergences in fundamental patterns such as movement distance distribution and network connectivity, which in turn can lead to contradictory outcomes in downstream modeling tasks. These discrepancies are particularly problematic when such data are used as universal proxies for human mobility without adequate scrutiny or cross-validation. In parallel, data access remains severely constrained due to privacy concerns, proprietary restrictions, and infrastructural limitations, especially in low-resource regions. Consequently, most large-scale studies are skewed toward well-surveyed cities or countries, exacerbating global knowledge asymmetries and limiting the universality of urban and behavioral research.
To address these challenges, there is a growing interest in using generative artificial intelligence (AI) to produce synthetic mobility data. Recent works [2, 3, 4, 5] have successfully employed AI models to simulate trajectory data by learning from limited samples. For example, Feng et al. [6] and Yuan et al. [7] propose GAN-based models to simulate human mobility from real-world data. Similarly, diffusion models [8, 9] have been employed to generate synthetic mobility trajectories. However, these efforts are typically constrained to limited cities and often require access to real-world trajectory data for each target region, thus failing to overcome the global coverage gap or alleviate dependence on city-specific ground truth data.
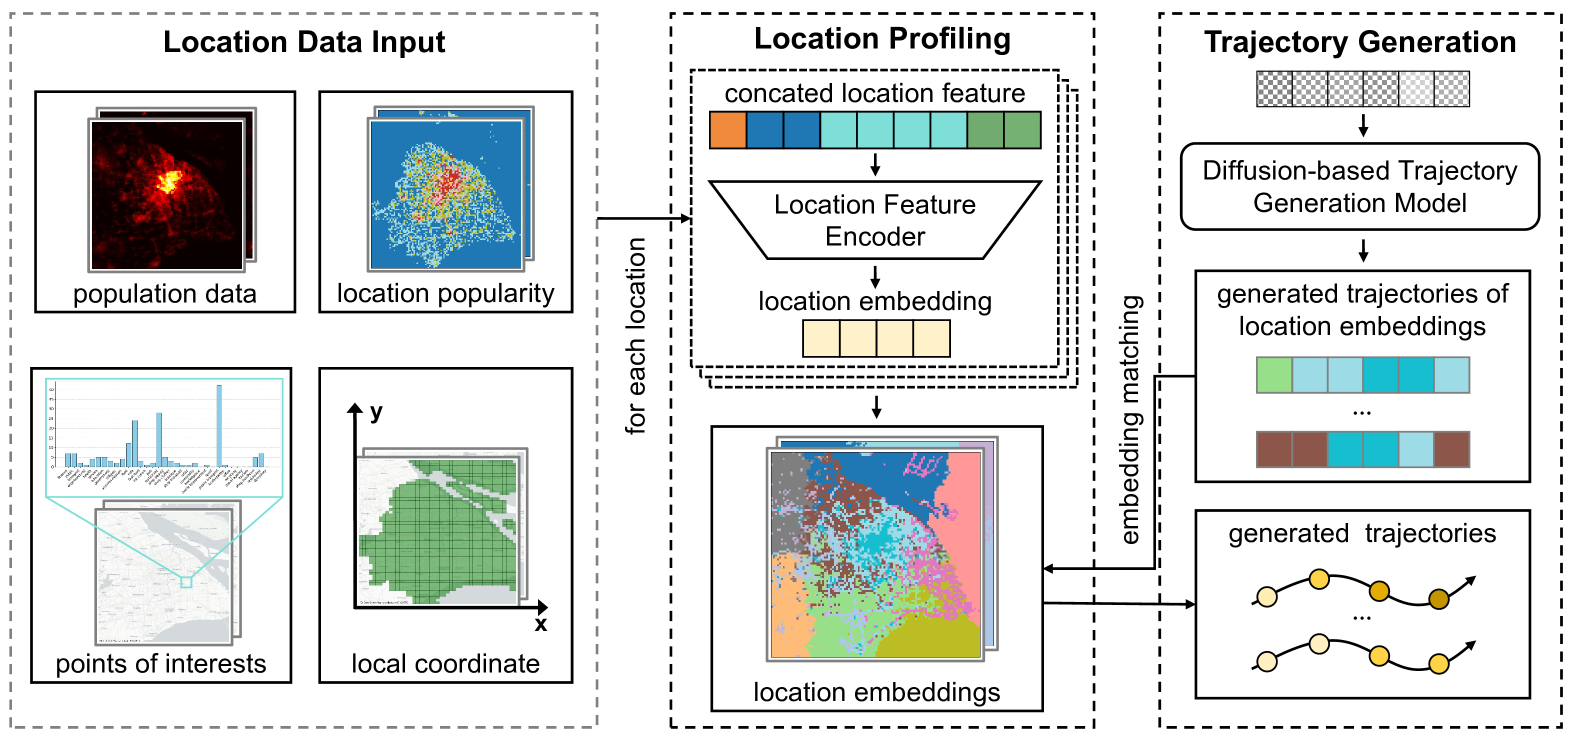
In this paper, we introduce WorldMove, a large-scale synthetic mobility dataset generated via a diffusion-based generative AI model trained on multi-source real-world data, including GPS, CDR, and credit card-based mobility records. Our method explicitly acknowledges the structural biases across different data sources and leverages their complementary strengths during training, thereby producing harmonized and realistic synthetic mobility data across 1600+ cities worldwide. The generation pipeline combines geographic features (population, POIs, OD flows) and mobility semantics within a shared embedding space, enabling model transferability and generation for cities with no available mobility data. As illustrated in Fig. 1, our generation process consists of three steps: (1) encoding multi-source location features into a unified embedding space; (2) training a diffusion model on real mobility data to generate trajectories in this space; and (3) mapping the generated embeddings to the target city’s locations via minimum-distance matching to construct the final trajectories.
Our contribution is twofold: (1) we release a globally unified and privacy-preserving mobility dataset that can serve as an open resource for large-scale urban and social analysis; and (2) we provide an extensible generation pipeline and pretrained model that allow practitioners to generate synthetic trajectories for any city of interest. Through extensive evaluations, including distributional similarity, aggregate OD matching, mobility law recovery, geospatial realism, and privacy protection, we demonstrate that the data generated by WorldMove is highly realistic, effectively captures key human mobility patterns, and preserves user privacy. Moreover, we showcase the utility of WorldMove through two representative applications: simulating urban transportation emissions for sustainable mobility planning, and modeling green space exposure to support public health and equity research. By addressing critical challenges such as limited data availability and the lack of accessible mobility datasets, WorldMove lays a solid foundation for advancing fair, transparent, and reliable urban modeling and policy simulation at a global scale.
2 Methods
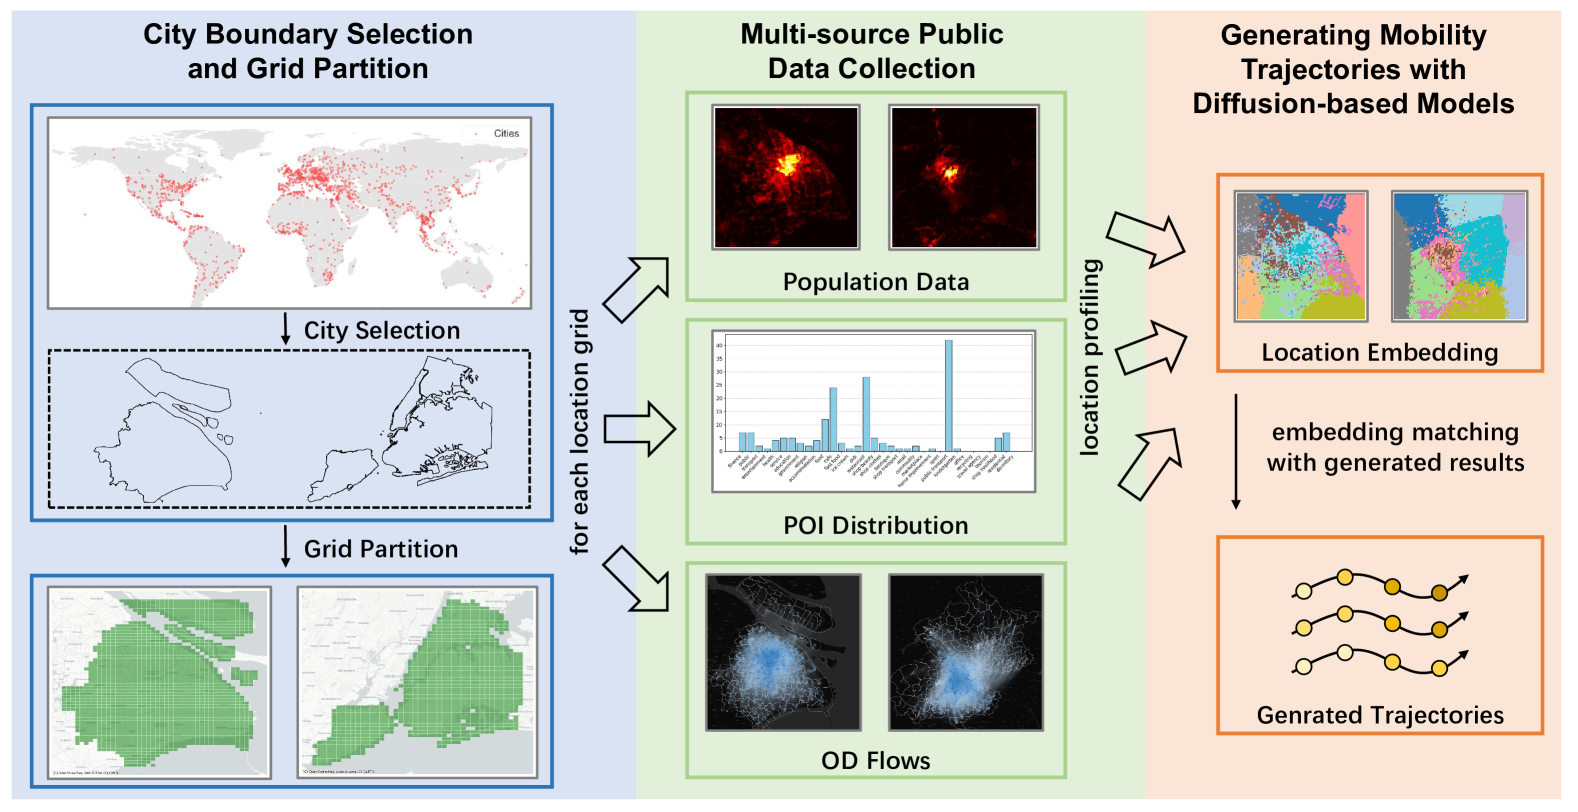
In this section, we present the methodology for constructing the WorldMove dataset. As illustrated in Figure 2, the pipeline consists of three main stages. First, we define city boundaries and partition each city into locations. Second, we extract features from multi-source global public data to learn location representations. Finally, we employ diffusion-based generative models to synthesize realistic mobility trajectories.
2.1 Defining city boundaries and locations
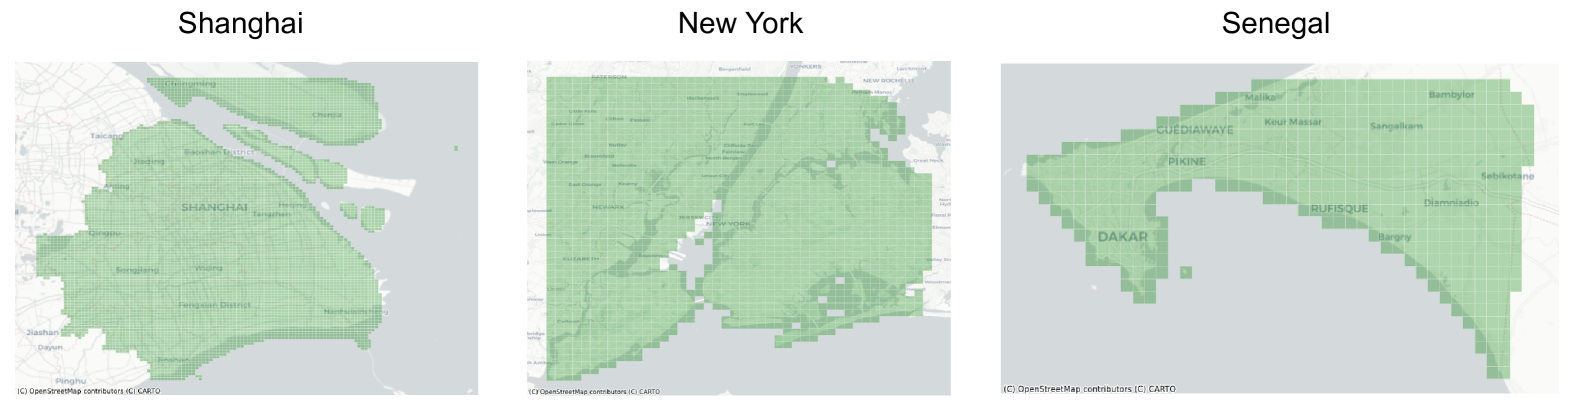
For each city, we begin by defining its geographic boundaries using map tools to ensure an accurate representation of its spatial extent. To achieve comprehensive global coverage, we integrate data from multiple sources to establish detailed and reliable boundaries for cities. Specifically, we utilize the WhosOnFirst (WOF) database111https://whosonfirst.org/, an open-source global gazetteer of places, which provides boundary data in GeoJSON format. From this dataset, we select cities with explicitly defined boundaries represented as polygons, ensuring consistency and precision for each selected city.
Once the city boundary is defined, the area is divided into uniform grids, with each grid cell measuring 1km × 1km. These grids form the foundational units of "locations" in our mobility trajectory data. It is important to note that a "location" does not represent a specific point but rather a small, bounded area within the city.
2.2 Globally accessible multi-source data for location profiling
To create a comprehensive profile for each location, we integrate various globally accessible multi-source datasets that provide key attributes for every grid cell. The profiling incorporates the following components:
-
•
Population data: We use population data from the WorldPop dataset222https://www.worldpop.org/, which provides high-resolution (100m) population distribution estimates. This data enables accurate representation of population density within each grid in the selected city area.
-
•
Points of interests (POIs): POIs effectively capture urban functional characteristics as they represent specific sites associated with various human activities. In our dataset, POI data is sourced from OpenStreetMap (OSM)333https://www.openstreetmap.org/ and categorized by type within the boundaries of each urban region. This process generates a 34-dimension vector that reflects the distribution of POIs by type, providing a detailed description of the functional attributes of the corresponding area.
-
•
Location popularity: In addition to the static characteristics of each location, such as population density and POI distribution, we also extract mobility-related features, specifically location popularity. This is quantified as the visitation frequency rank, derived from a global high-resolution origin-destination commuting flow dataset444https://fi.ee.tsinghua.edu.cn/worldod/. By analyzing this dataset, we calculate the visitation flow for each location, providing a movement perspective on its significance within the mobility network.
-
•
Local coordinate system: For each location, apart from the features related to trajectory semantics, we also introduce a local coordinate system to assist our model in learning the spatial relationships between the locations visited by the trajectory. As shown in Figure 1, for each selected city’s boundary, a two-dimensional coordinate system is established based on the minimum bounding rectangle that encloses the boundary. Each location within this boundary is assigned a two-dimensional coordinate, which is then normalized to the range of 0 to 1 using the rectangle’s length and width as the maximum values. The incorporation of local coordinates aids the model in understanding the relative distances between regions, thereby facilitating the generation of more realistic mobility data.
Combining the above four aspects, we construct a feature vector for each location, resulting in a vector of 38 dimensions: 1 dimension derived from population data, 34 from points of interest, 1 from location popularity, and 2 from the local coordinate system. The location feature vector effectively captures geographical characteristics and facilitates trajectory generation by enabling location selection based on both movement patterns and location functions.
2.3 Generating mobility trajectories via diffusion models
Based on the collected location feature data, we employ a diffusion-based model [8] to generate mobility trajectories, and the whole process consists of three key steps. First, the multi-source location feature data is processed through a location feature encoder, compressing and projecting the regional characteristics into a unified embedding space. Building upon the location embeddings, we leverage real-world human mobility data to encode physical location sequences from different cities into a unified semantic space, forming a comprehensive mobility dataset that encompasses diverse urban mobility patterns. Our diffusion model is then trained on this unified dataset. During the generation process, the diffusion model first generates a transition sequence within the embedding space. This embedding sequence is subsequently matched to the target city’s location embeddings using a minimum-distance mapping, ultimately constructing the final mobility trajectory. The detailed process is introduced in the following subsections.
2.3.1 Location encoding
As described in Section 2.2, each location’s feature is represented as a 38-dimensional vector , including attributes such as population , POI distribution , popularity rank , and local coordinates . To enable the generative model to comprehend regional characteristics across different cities, we employ an autoencoder [10] to learn these location features. This process compresses the feature vectors, reducing their dimensionality while projecting them into a unified embedding space that is more interpretable for the model. This transformation ensures that the model can effectively capture and generalize location attributes across diverse urban environments. The autoencoder is formulated as follows:
| (1) |
The autoencoder reduces feature dimensionality while preserving patterns by reconstructing location features. In our experiment, we set the embedding dimension to 8 and train a unified autoencoder on regions from six cities across China, the United States, and Africa. For different types of location features, the autoencoder employs tailored reconstruction loss functions: mean squared error (MSE) loss for numerical features such as population and coordinates, Kullback–Leibler (KL) divergence for POI distributions, and cross-entropy loss for rank-based features. The loss function is as follows:
| (2) |
2.3.2 Embedding-space generation
To enable unified trajectory generation across cities, we first encode location features into a shared embedding space using a trained encoder. Each individual trajectory—originally a sequence of spatiotemporal points —is converted into a sequence of embedding vectors with equal temporal intervals. These sequences are then reshaped into fixed-length vectors on a daily basis, forming the training set aggregated from multiple cities.
We train a diffusion model over the embedding space to learn the generative distribution of human mobility. Following standard denoising diffusion probabilistic modeling, we learn a denoising network that reconstructs clean samples from noisy inputs:
| (3) |
where defines the noise schedule. After training, the model generates embedding-space trajectories by denoising Gaussian noise through a deterministic DDIM sampling process [11]:
| (4) |
2.3.3 Embedding-to-location decoding
After generating synthetic embedding sequences using the diffusion model, we decode them into real-world mobility trajectories by mapping each embedding back to a geographic location. Specifically, the diffusion model produces a sequence of location embeddings , where each encodes latent spatial semantics. To recover trajectories grounded in real geography, we employ a minimum-distance matching approach. First, we use the encoder to compute the set of location embeddings from the geographic locations in the target city. Then, each generated embedding is mapped to its nearest neighbor in by:
| (5) |
which yields a location sequence corresponding to real-world coordinates. Finally, we assign timestamps based on fixed time intervals to form a complete spatiotemporal trajectory . This decoding process enables the model to generate real-world mobility trajectories for any given city, by conditioning on city-specific embedding spaces while maintaining semantic consistency across regions.
2.4 Ethics statement.
In this section, we outline the measures implemented to safeguard user privacy and eliminate potential risks associated with utilizing mobility trajectory data. First, the Terms of Service for mobile operations explicitly include user consent for research purposes, ensuring ethical data usage. Second, all potential individual identifiers are replaced with anonymized hash codes, preventing any records from being linked to specific individuals. Third, all research data is securely stored on offline servers with access strictly limited to authorized researchers under binding confidentiality agreements. These measures collectively ensure robust data security and compliance with ethical standards.
3 Data Records
3.1 Provided datasets
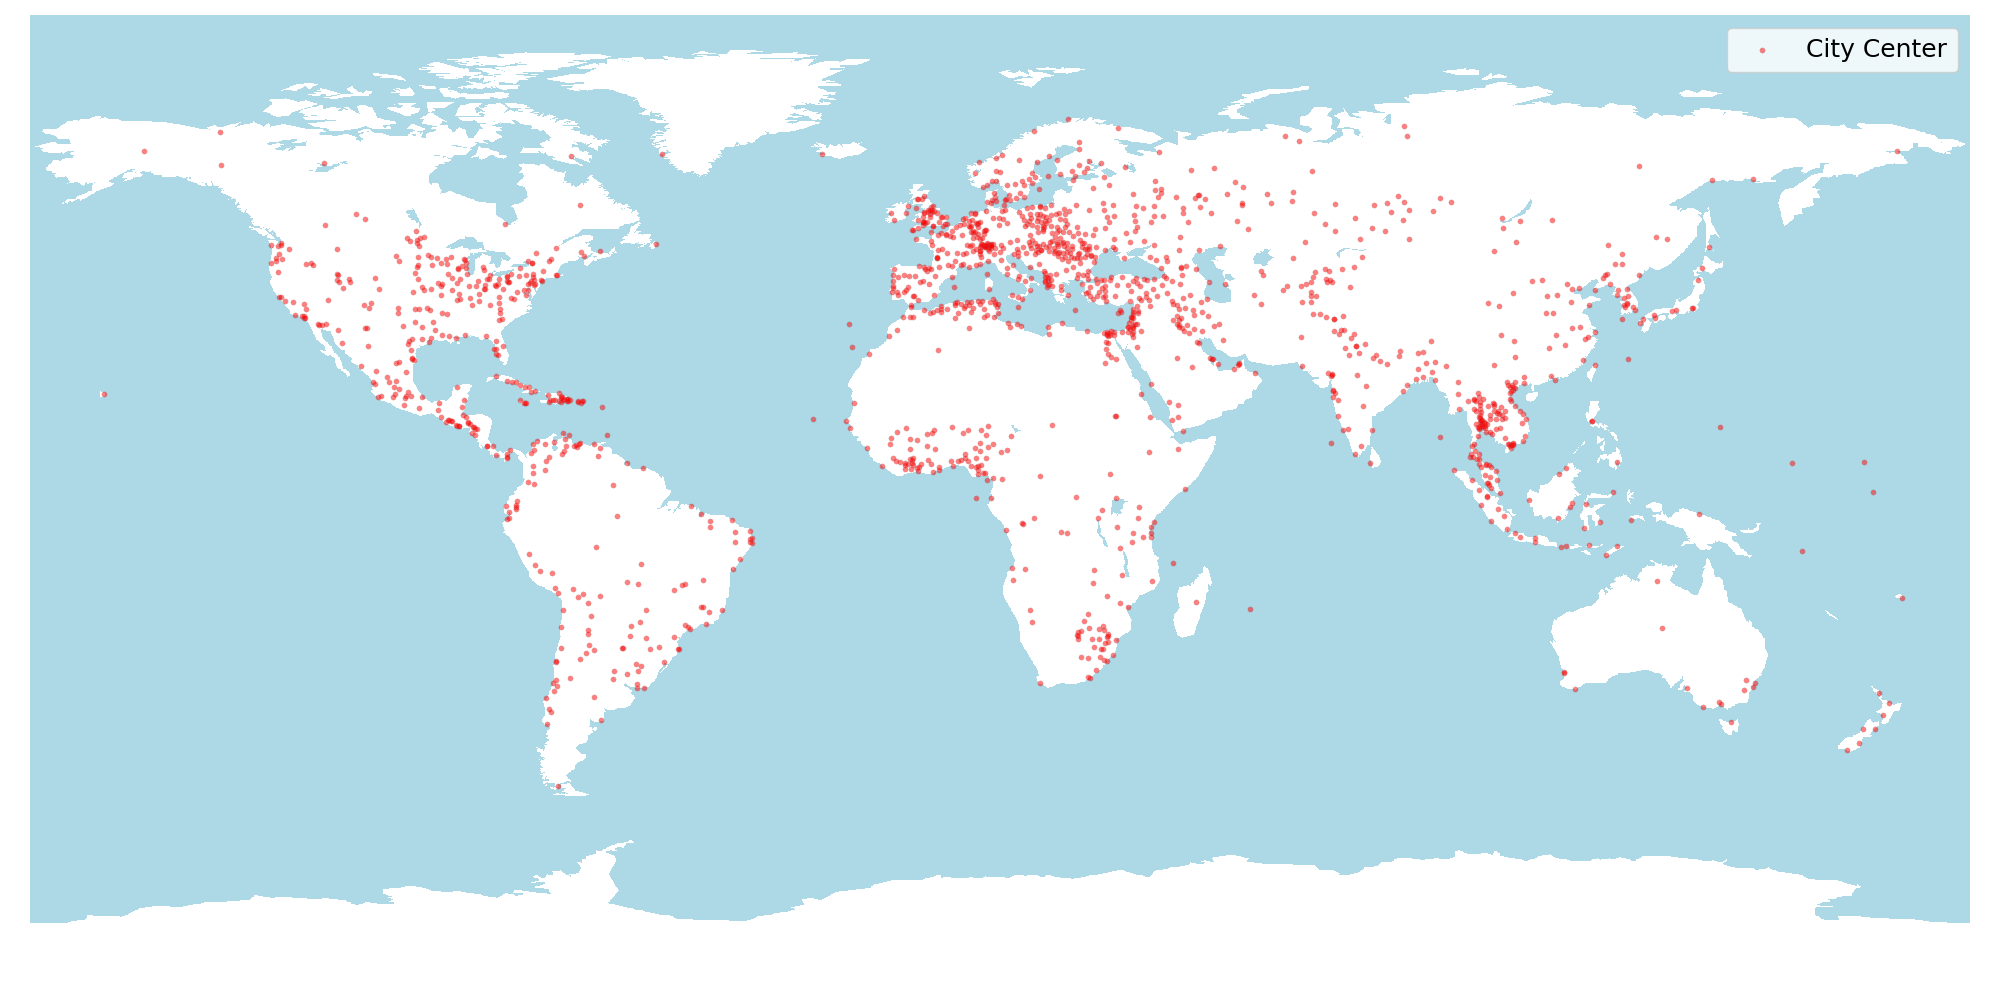
The released dataset includes synthetic mobility data for over 1,600 cities across 179 countries and 6 continents, covering a diverse range of urban environments. To support open research and encourage broad use, we provide access to the dataset through multiple platforms. A static version is archived on Figshare [12] to ensure long-term accessibility and citation. Meanwhile, a live version is maintained and regularly updated on our GitHub repository555https://github.com/tsinghua-fib-lab/WorldMove. In addition, we offer an interactive web portal666https://fi.ee.tsinghua.edu.cn/worldmove, where users can explore cities on a global map and directly download data for any selected city. Alternatively, users can search by city name to quickly locate and retrieve the corresponding dataset. For each city, we organize the data into a dedicated folder, which includes synthetic individual mobility trajectories, city boundary shapefiles, regional divisions, POI distributions, and commuting OD matrices. The folder structure is designed to be intuitive and easy to navigate, enabling seamless integration into downstream research tasks.
3.1.1 City boundary and location division
The city boundary data is provided in shapefile format, ensuring compatibility with various geographic information systems. Additionally, location data is indexed, with each index corresponding to the longitude and latitude of the center of its respective grid.
3.1.2 Mobility trajectory data
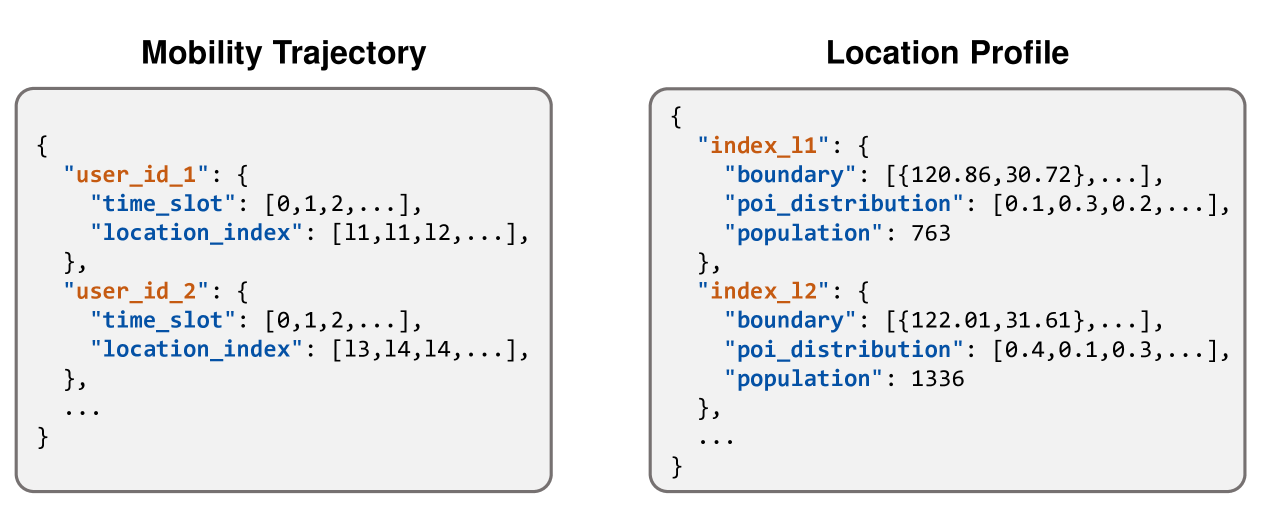
The mobility trajectory data is provided in a dictionary (Dict) format, as illustrated in Fig. 6, and contains multiple user trajectories. In this structure:
-
•
Key: Each key represents a unique User ID, which is an anonymized identifier assigned to individual users. This ensures privacy while allowing analysis at the individual level.
-
•
Value: The value associated with each User ID is a sequence of tokens. Each token contains:
-
–
Time slot: A half-hour time interval represented by an index. For example, 0 corresponds to 00:00 AM–00:30 AM, and 27 corresponds to 1:30 PM–2:00 PM.
-
–
Location index: The grid index represents a specific location within the city’s spatial grid. Each index corresponds to the center of a grid cell, ensuring precise spatial representation.
-
–
3.1.3 Location profiling
The location profiling data is provided in a dictionary (Dict) format. Each key represents a location index, and the corresponding value is another dictionary. This nested dictionary contains the following keys:
-
•
"POIs": Represents the profile of points of interest for the location, detailing the number and types of POIs within the grid.
-
•
"Popularity": Indicates the location’s popularity, typically represented by a visitation frequency or rank derived from mobility patterns.
-
•
"Population": Provides the population density or estimate for the location.
This structure facilitates a comprehensive representation of each location by encapsulating key attributes within an easily accessible format.
3.2 Mobility Data Generation Pipeline
In addition to the provided datasets, we also offer a pre-trained model and a pipeline tool for generating mobility datasets for any city worldwide. The pipeline follows a straightforward process:
-
•
Step 1: Acquire population data. The population data can be obtained from WorldPop using the script Generate_pop.py.
-
•
Step 2: Generate location profiling. Location profiling data can be created by running the script generate_profile.py, which integrates data such as population distribution and POI attributes.
-
•
Step 3: Generate mobility data. Using the prepared location profiling and population data, mobility data can be generated with the script generate_mobility.py.
4 Technical Validation
In this section, we evaluate the quality of the generated mobility data to demonstrate that it not only adheres to the characteristics and patterns observed in real-world data but can also serve as a reliable substitute for real-world data in downstream applications. The technical validation is conducted across four key aspects: (1) data fidelity, by comparing the generated data with real-world data; (2) reproduction of mobility laws, by examining key distributions of mobility characteristics; (3) alignment with commuting origin-destination (OD) flows, which represent aggregated mobility patterns; and (4) privacy evaluation, to ensure that the generated data safeguards user privacy by preventing the retrieval of individual-level information.
4.1 Data fidelity
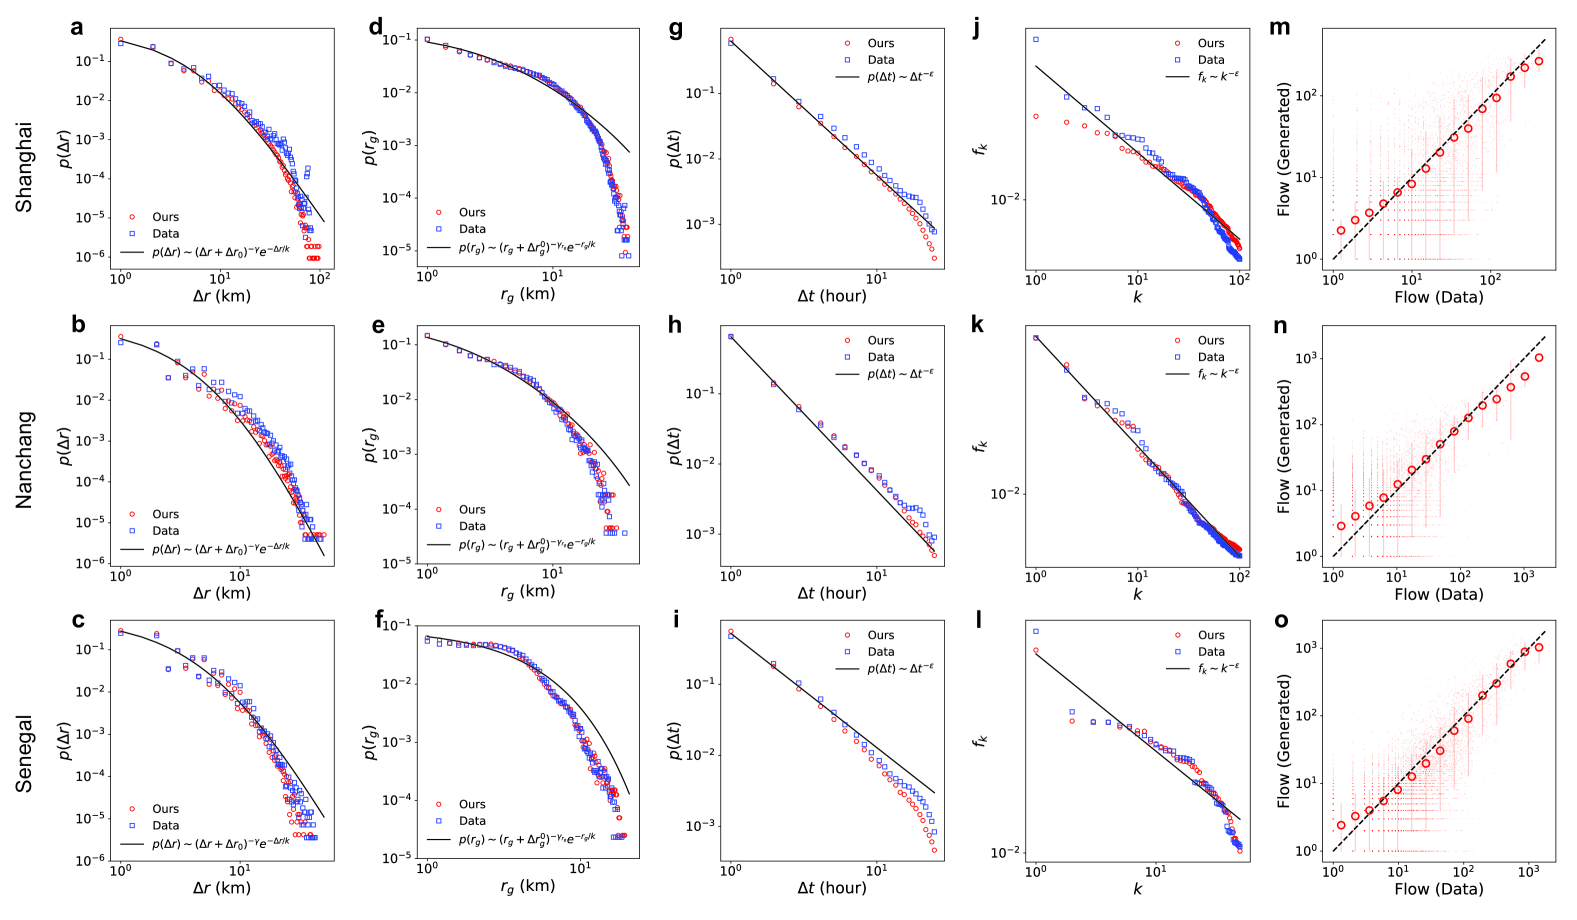
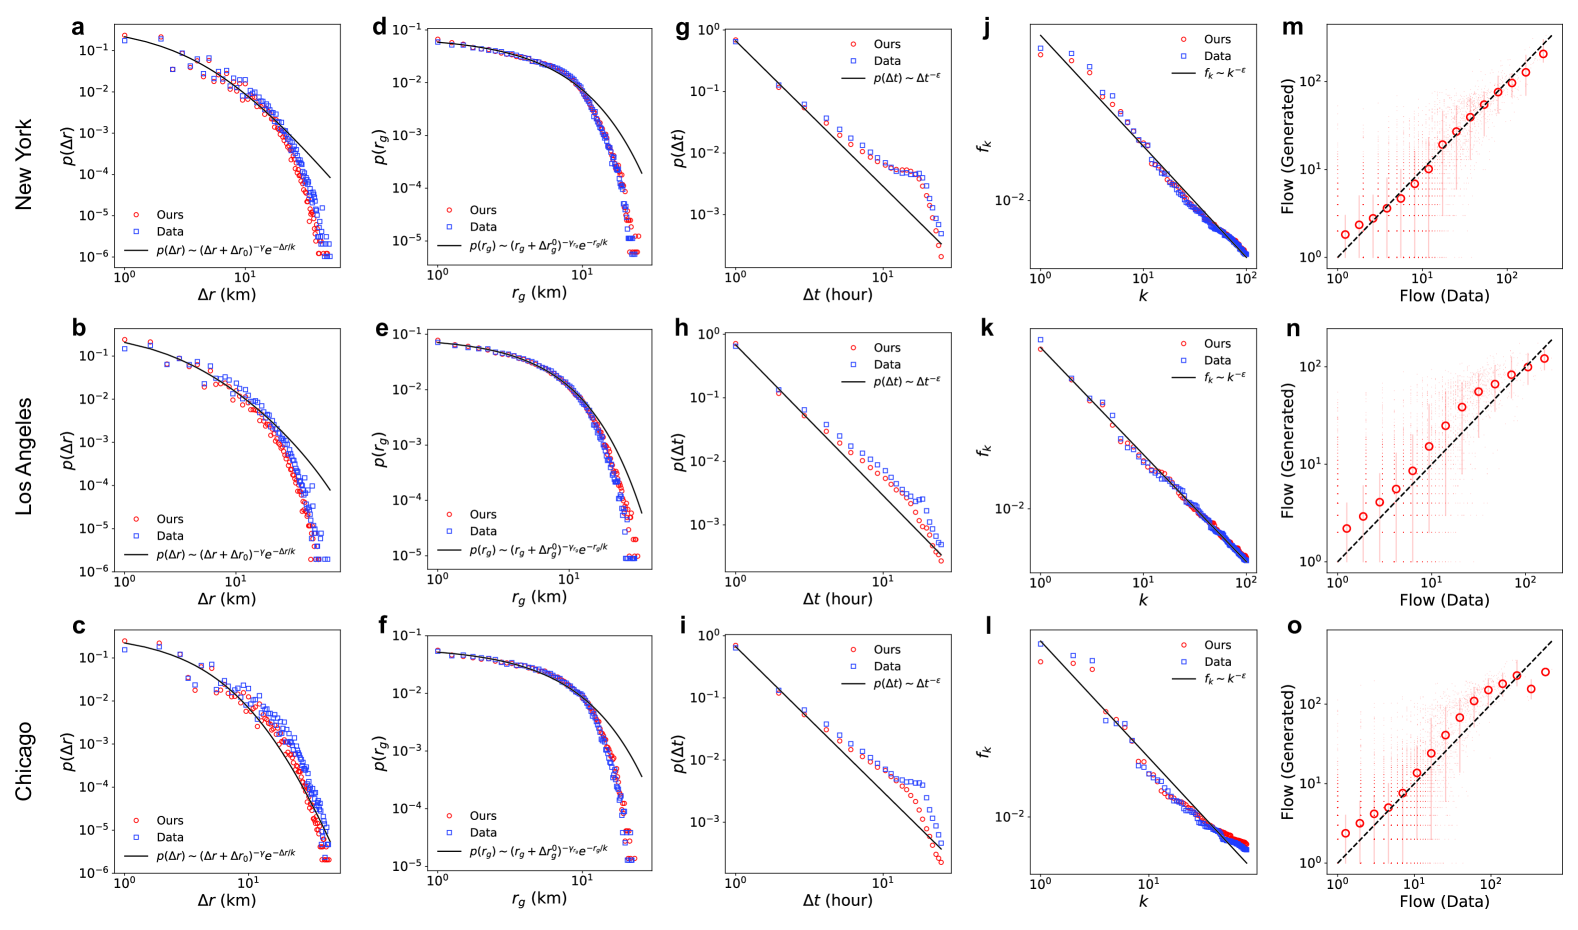
We evaluate data fidelity from two perspectives: individual trajectory fidelity and population flow consistency. At the individual level, we assess the statistical alignment of the generated trajectories with real-world data using distribution differences, measured by Jensen-Shannon divergence (JSD) and the Kolmogorov-Smirnov (KS) test [13, 6]. Both metrics range from , with 0 indicating perfect match. We evaluate several key mobility metrics [14, 15, 16], including jump length (), daily trip distance (), radius of gyration (), waiting time (), and daily visited locations ().Additionally, we assess adherence to Zipf’s law [17], which captures the power-law distribution of location visit frequencies in real-world mobility. These metrics assess spatial and temporal regularities (, ) [18], individual variability () [18], and the slow growth of travel distances and visited locations (, ) [19]. We also evaluate aggregated mobility patterns (population flows), comparing observed and generated flows by calculating metrics such as Root Mean Square Error (RMSE) and common parts of commuting (CPC). CPC ranges from [0,1], with 1 indicating perfect correlation, while RMSE quantifies the difference between the distributions, further validating data accuracy. These two metrics are defined as follows:
where Represents the observed flow for location pair , Represents the generated flow for location pair , and : The total number of location pairs.
Through our collaboration with mobile operators and credit card companies, we have access to mobility trajectory data from multiple cities across China, Senegal, and the US. This enables a comprehensive evaluation of the quality of the generated data. While we are unable to release real-world data due to strict non-disclosure agreements (NDAs), we leverage them to assess the performance of our generated data. Table 2 presents the numerical results, including individual-level metrics (JSD and KS test) and population-level metrics (RMSE and CPC). The generated data achieves JSD and KS values below 0.05 and 0.28, respectively, indicating strong alignment with the real-world distribution of mobility characteristics. These results represent state-of-the-art performance in the field of mobility trajectory generation, surpassing prior benchmarks where JSD and KS values typically range around 0.07 [6, 20, 21] and 0.30 [13]. In terms of CPC, our method reaches a value of 0.41, significantly higher than the 0.32 reported in recent studies [3], further confirming that population-level movement patterns in our synthetic data are highly consistent with real-world behavior. To present the results in more detail, we plot the distribution of these key metrics in Figure 7 and Figure 8, which clearly demonstrate that the generated data closely matches the real-world data.
4.2 Reproduction of mobility laws
Human mobility has been extensively studied, leading to the identification of several mobility laws documented in the literature . To evaluate whether the generated data not only resemble real-world data but also adhere to fundamental mobility laws, we analyze the generated mobility patterns and visualize them in Figure 7 and Figure 8. The jump length , which measures the spatial distance between consecutive stops, follows a truncated power-law distribution: , with the scaling exponent ), which remains consistent across different cities and aligns closely with empirical values () [18]. Similarly, the radius of gyration, which quantifies the spatial spread of an individual’s movements, also follows a truncated power-law distribution, with [18, 19]. The distribution of waiting times, , follows a power-law form with , further reflecting the mobility laws observed in real-world data. In addition to these, we explore another critical scaling property of human mobility: Zipf’s law [18], which characterizes the frequency distribution of visited locations. As shown in Figure 7 and Figure 8, it follows a power-law form: (), closely matching the empirical values [18]. These results demonstrate that the generated data do not merely fit real-world data, but rather reflect the ability of our generation method to capture the fundamental mobility laws that govern human movement.
4.3 Visualization of commuting OD flows
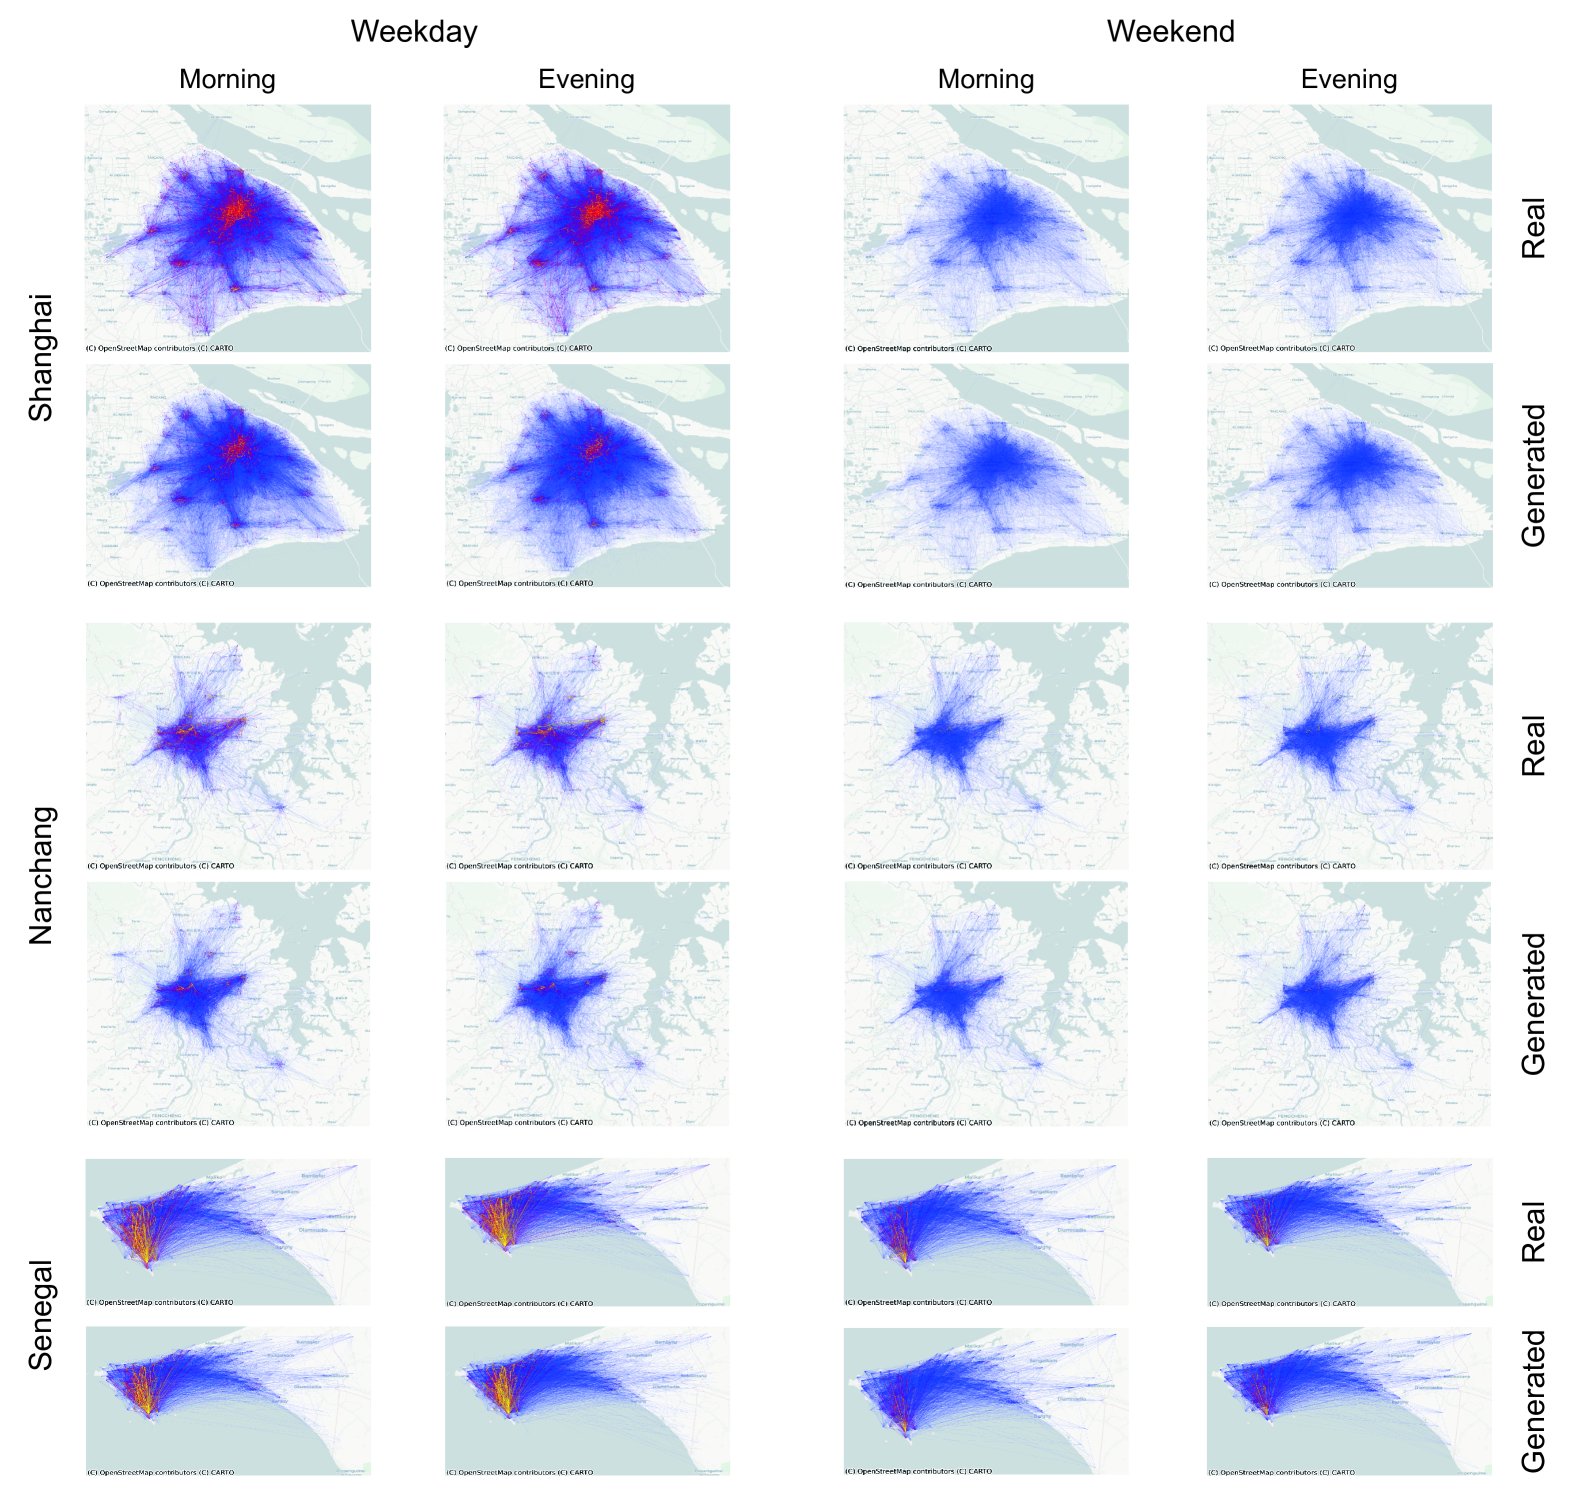
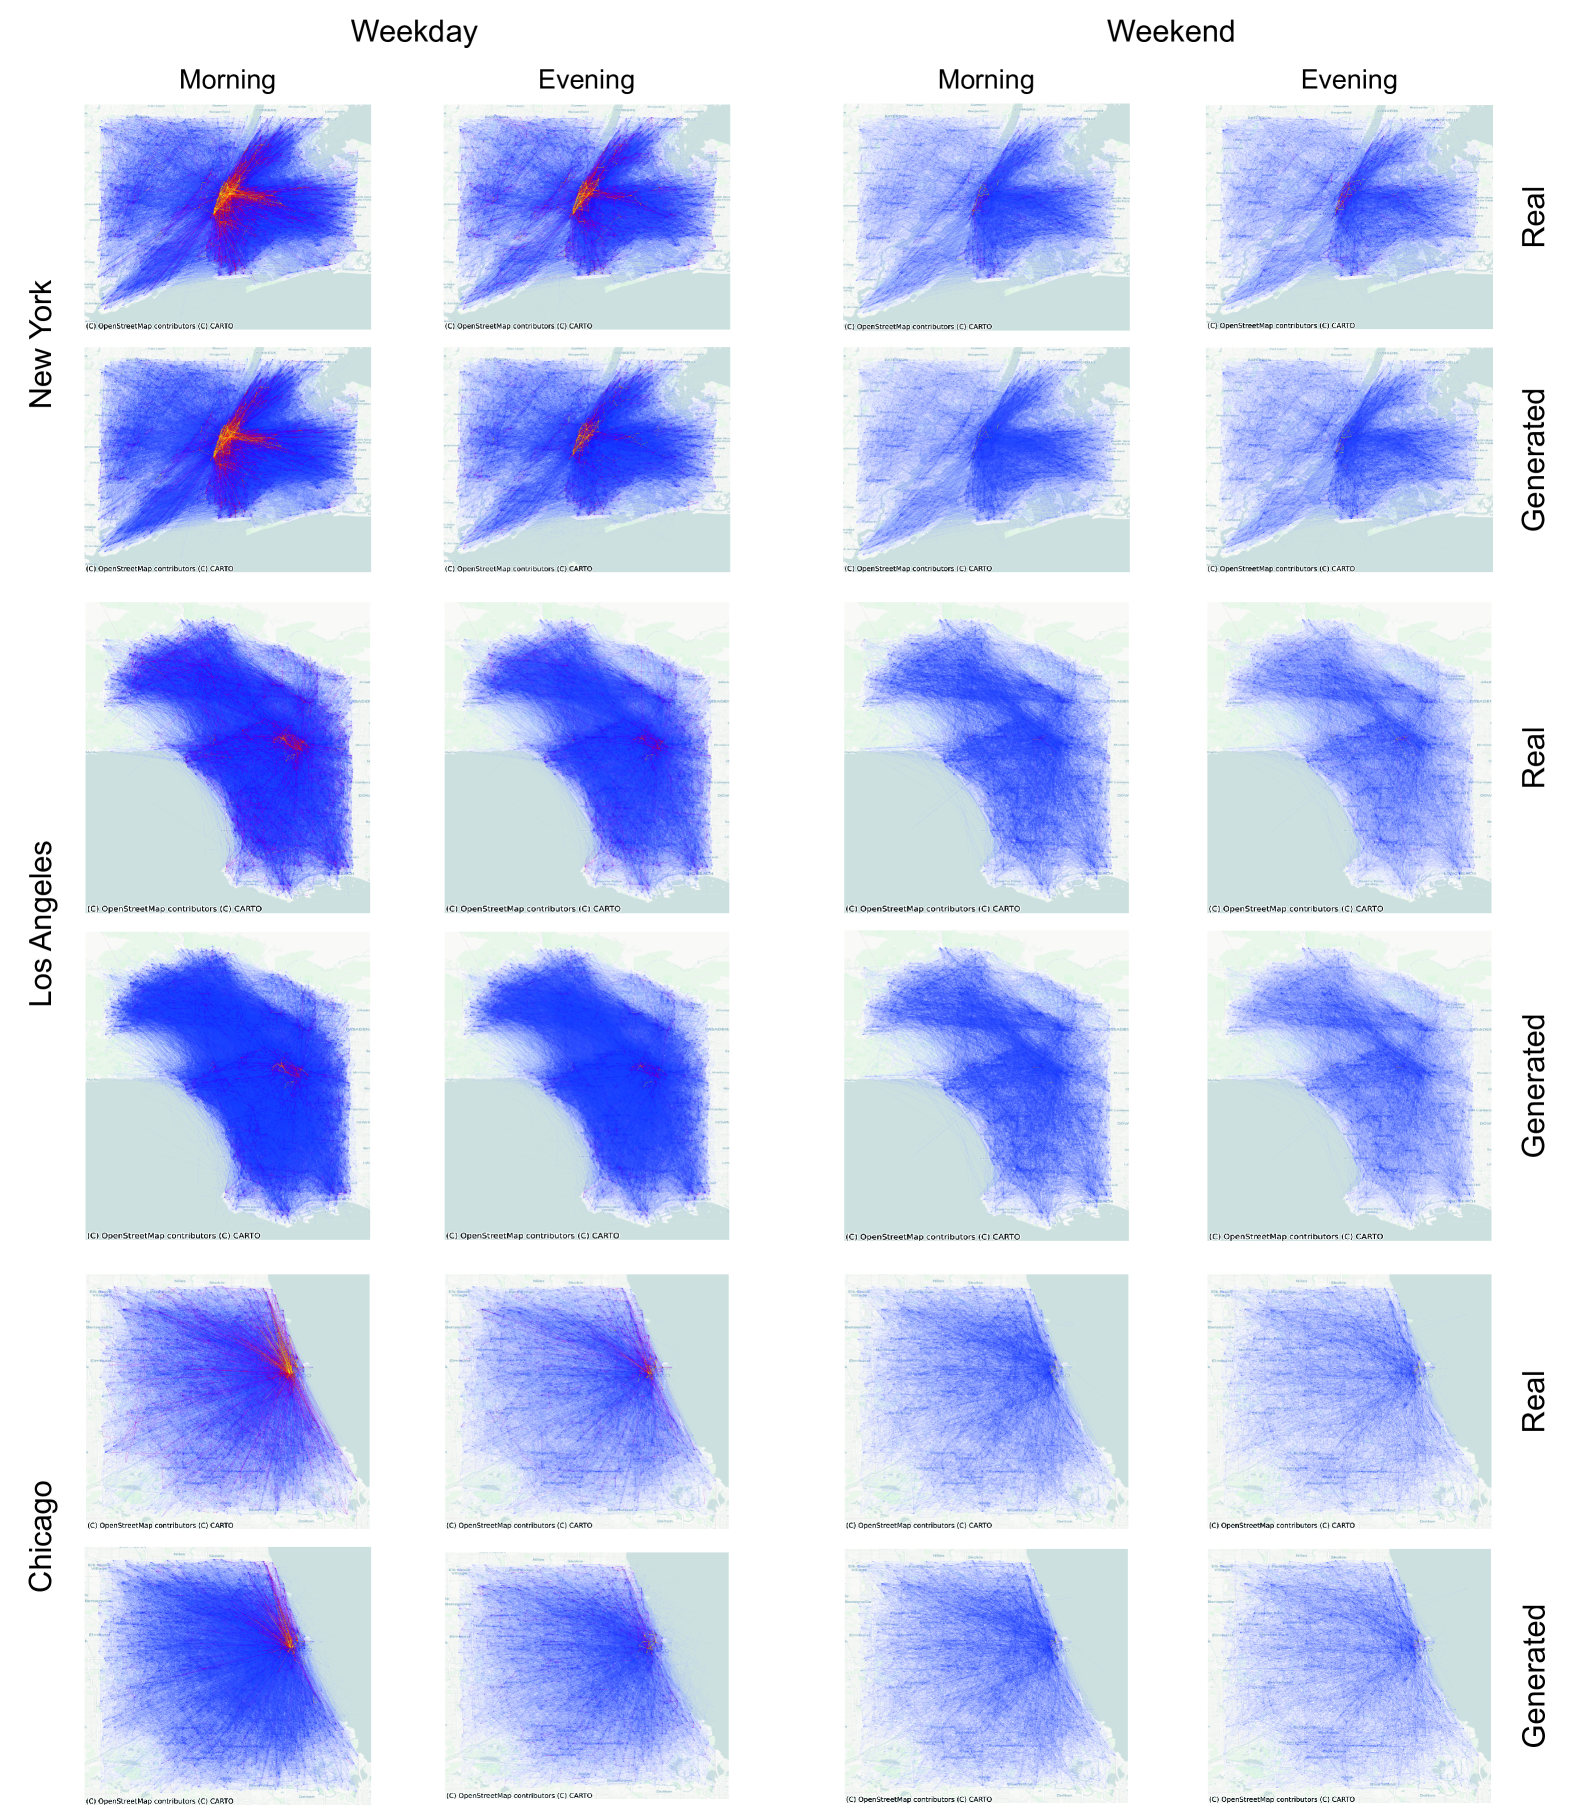
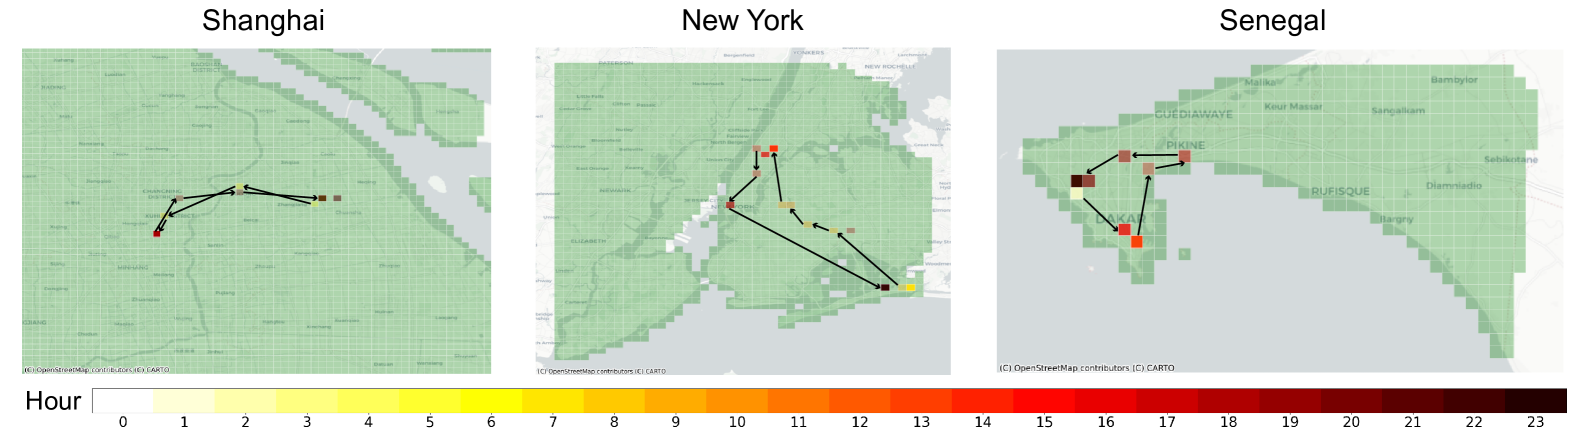
While WorldMove generates individual-level mobility trajectories, it is important to ensure that these fine-grained movements can accurately reproduce aggregated urban mobility patterns. One key proxy for such patterns is the commuting origin-destination (OD) flow [22], which reflects where people travel from and to during typical commuting hours. To intuitively demonstrate that the generated trajectories accurately reflect commuting OD flows, we visualize the distribution of these flows during morning and evening commuting times in Figure 9 and Figure 10. We include cities from various continents, including China, Africa, and the Americas, to provide a diverse range of examples.
As we can observe, the generated OD flows closely resemble the real-world patterns, indicating that the generated mobility data can capture aggregated mobility trends effectively. In addition, the generated data reflects regional heterogeneity in commuting structures. For example, in large metropolitan areas such as Shanghai and several U.S. cities, we observe clear directional flows from peripheral residential zones to central business districts in the morning, and the reverse in the evening—patterns typical of centralized urban employment. On weekends, this structured pattern becomes less prominent, consistent with reduced work-related travel. In contrast, in medium-sized cities such as Nanchang, China, where residential and workplace zones are less spatially segregated, the OD flows are more evenly distributed. The generated data accurately captures these distinctions, further validating its ability to reproduce nuanced urban commuting behaviors.
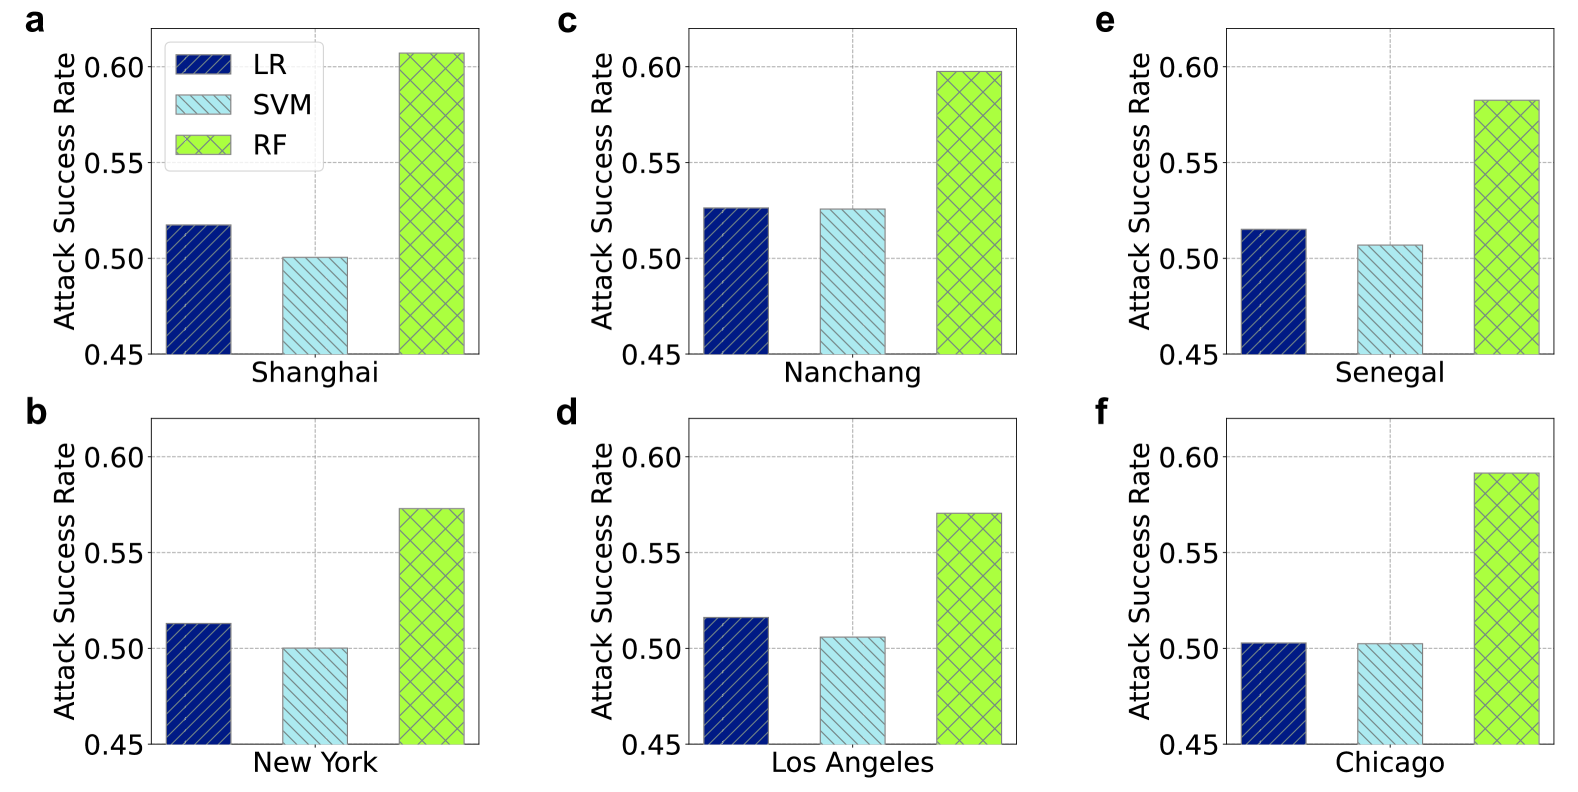
4.4 Privacy protection evaluation
As a synthetic global dataset, we evaluate whether the generated data protects individual privacy and avoids potential information leakage. To this end, we conduct a membership inference attack, which is a common method used to assess the risk of privacy breaches. The attack attempts to infer whether a particular data sample was part of the training set, which could indicate potential memorization or leakage of sensitive information. In our evaluation, we train a binary classifier to distinguish between real (training) and synthetic samples based on their latent representations. To ensure the robustness of the results, we adopt three commonly used binary classifiers: logistic regression (LR), support vector machines (SVM), and random forests (RF).
As shown in Fig. 11, the attack success rate remains between 0.5 and 0.6 across different cities and scenarios, which is close to random guessing (0.5). This indicates that the diffusion model does not memorize specific individual trajectories and that the generated data does not reveal identifiable information about real users. These results confirm that our synthetic dataset offers strong privacy protection, making it suitable for open sharing and safe use in research and application scenarios involving human mobility data.
5 Usage Notes
The generated mobility data serves as a versatile and valuable resource for a wide range of research fields. By simulating realistic human mobility patterns, it can support the development and evaluation of models, algorithms, and policies in areas where real-world data may be limited or difficult to obtain. Below are some key areas where this data can be applied:
-
•
Sustainable transportation optimization: WorldMove enables realistic simulation of urban transportation systems and carbon emissions analysis. In our case study, we integrate WorldMove-generated human mobility data with vehicle type information [23], and simulate daily urban traffic using the MOSS microscopic traffic simulator [24]. The simulation captures carbon emissions across six vehicle types over a day, revealing clear peaks during commuting hours (Figure 12a). We further conduct a counterfactual experiment by reducing vehicle numbers during peak periods. As shown in Figure 12b, a 30% reduction in vehicles results in a 60% drop in emissions, highlighting the nonlinear benefits of congestion mitigation. This example illustrates WorldMove’s potential to support data-driven research on sustainable transportation and emission reduction strategies.
-
•
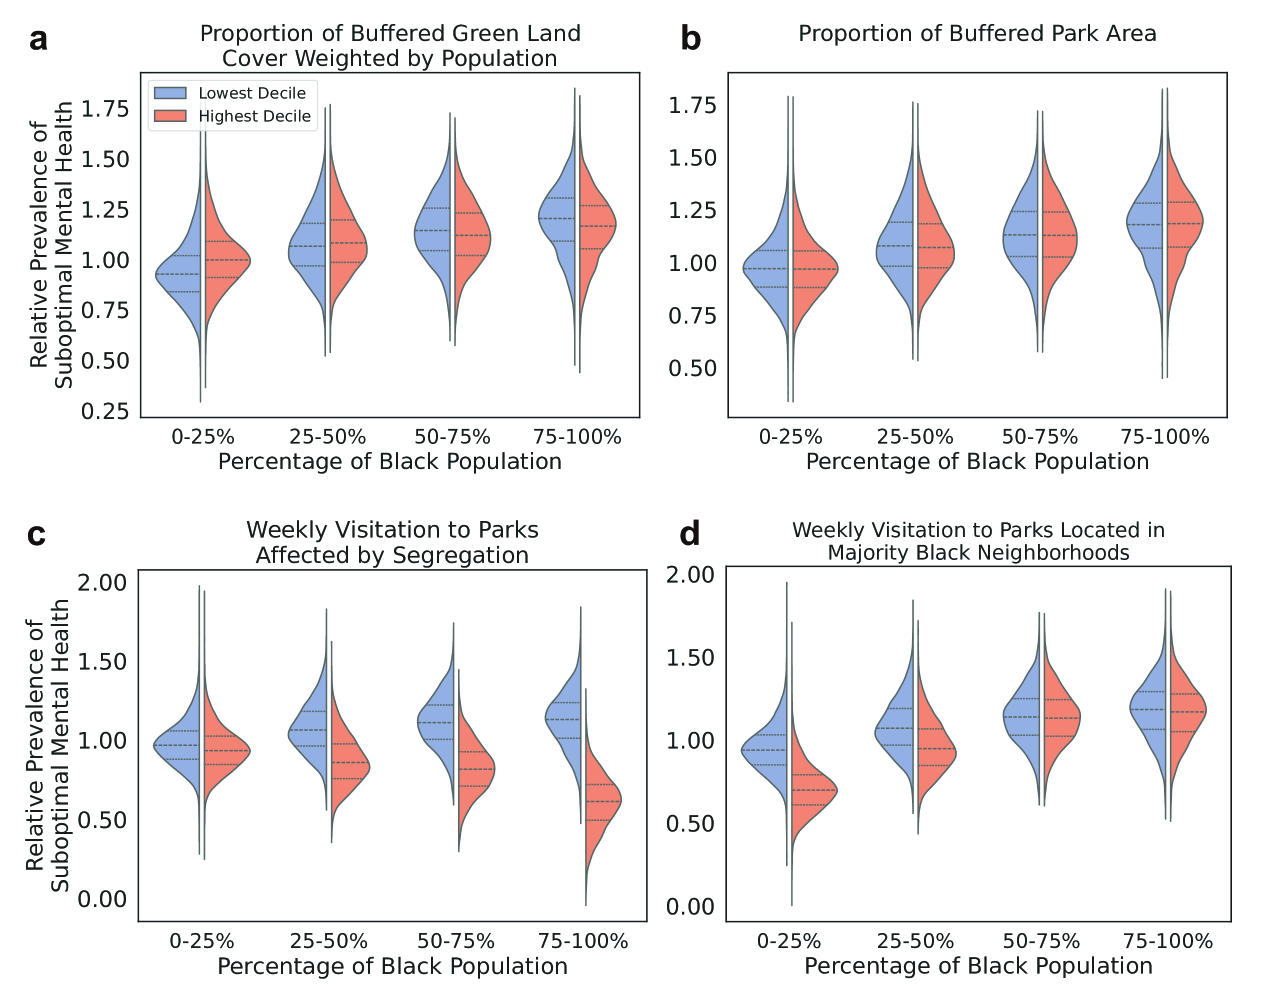
Urban environment and exposure analysis: The dataset supports research in environmental exposure modeling, such as estimating population exposure to green spaces, noise, or air pollution. As an example, we analyze the relationship between residents’ exposure to green spaces and mental health outcomes in multiple U.S. cities777See https://github.com/tsinghua-fib-lab/MentalHealthInequity for details.. We combine WorldMove-generated mobility trajectories with land-use maps, community demographic profiles, and mental health index data. As shown in Figure 13, traditional static indicators (e.g., green space coverage) do not fully explain disparities in mental health across neighborhoods. In contrast, dynamic exposure patterns derived from mobility data—such as inter-community access to parks—reveal stronger correlations with mental health, particularly in racially diverse areas. This case highlights the value of incorporating mobility-based exposure metrics into public health and urban equity research.
-
•
Public health and epidemiological modeling: The generated mobility data can be a valuable tool in public health research, particularly in understanding the spread of diseases [5, 6]. By capturing how individuals move within a city, public health experts can model the transmission of infectious diseases, such as COVID-19, and simulate how movement patterns influence disease spread. Additionally, by analyzing daily mobility routines, researchers can investigate how mobility affects health behaviors, such as access to healthcare facilities, physical activity levels, and dietary habits.
While WorldMove provides realistic and globally scalable synthetic mobility data, several limitations should be considered when using the dataset. First, the urban space in each city is discretized into regular grid cells rather than administrative boundaries or semantic regions (e.g., neighborhoods or functional zones). While this allows for spatial consistency across cities, it may limit analyses that rely on fine-grained or policy-relevant geographic units. Second, the generated trajectories cover a week, capturing typical daily and weekly mobility patterns. However, the dataset does not reflect seasonal variability, holiday-related travel behaviors, or responses to extreme events such as severe weather or lockdowns. Third, although the generative model is trained on a diverse set of real-world mobility sources, it inevitably inherits the sampling biases present in these datasets. These include lower-income populations, rural areas, and demographic skewness toward specific user groups (e.g., younger or tech-savvy individuals). Such biases may subtly propagate into the generated data and should be considered in downstream applications.
6 Code availability
Example Python code for loading and processing the data is available in the GitHub repository at https://github.com/tsinghua-fib-lab/WorldMove, along with detailed environment requirements and installation instructions. The synthetic mobility datasets for over 1600 cities can be directly downloaded from the WorldMove website at https://fi.ee.tsinghua.edu.cn/worldmove/. Alternatively, users can generate customized mobility data for any city using the provided Python interface and pretrained model, enabling flexible applications across various spatial and temporal settings.
References
- [1] Gallotti, R., Maniscalco, D., Barthelemy, M. & De Domenico, M. Distorted insights from human mobility data. \JournalTitleCommunications Physics 7, 421 (2024).
- [2] Yu, F. et al. City-scale vehicle trajectory data from traffic camera videos. \JournalTitleScientific data 10, 711 (2023).
- [3] Li, Y., Yuan, Y., Ding, J. & Jin, D. Learning the complexity of urban mobility with deep generative collaboration network. \JournalTitlePNAS Nexus (2023).
- [4] Yuan, Y., Ding, J., Wang, H. & Jin, D. Generating daily activities with need dynamics. \JournalTitleACM Transactions on Intelligent Systems and Technology 15, 1–28 (2024).
- [5] Yuan, Y., Ding, J., Wang, H., Jin, D. & Li, Y. Activity trajectory generation via modeling spatiotemporal dynamics. In Proceedings of the 28th ACM SIGKDD Conference on Knowledge Discovery and Data Mining, 4752–4762 (2022).
- [6] Feng, J. et al. Learning to simulate human mobility. In ACM SIGKDD, 3426–3433 (2020).
- [7] Yuan, Y., Wang, H., Ding, J., Jin, D. & Li, Y. Learning to simulate daily activities via modeling dynamic human needs. In Proceedings of the ACM Web Conference 2023, 906–916 (2023).
- [8] Zhang, Y., Yuan, Y., Ding, J., Yuan, J. & Li, Y. Noise matters: Diffusion model-based urban mobility generation with collaborative noise priors. \JournalTitlearXiv preprint arXiv:2412.05000 (2024).
- [9] Zhu, Y., Ye, Y., Zhang, S., Zhao, X. & Yu, J. Difftraj: Generating gps trajectory with diffusion probabilistic model. \JournalTitleAdvances in Neural Information Processing Systems 36, 65168–65188 (2023).
- [10] Bank, D., Koenigstein, N. & Giryes, R. Autoencoders (2021). 2003.05991.
- [11] Song, J., Meng, C. & Ermon, S. Denoising diffusion implicit models. In International Conference on Learning Representations (2021).
- [12] Team, W. Worldmove: A global-scale synthetic human mobility dataset. https://doi.org/10.6084/m9.figshare.28759355 (2024). Figshare. Dataset. Available at https://doi.org/10.6084/m9.figshare.28759355.
- [13] Jiang, S. et al. The timegeo modeling framework for urban mobility without travel surveys. \JournalTitleProceedings of the National Academy of Sciences 113, E5370–E5378 (2016).
- [14] Barbosa, H. et al. Human mobility: Models and applications. \JournalTitlePhysics Reports 734, 1–74 (2018).
- [15] Wang, J., Kong, X., Xia, F. & Sun, L. Urban human mobility: Data-driven modeling and prediction. \JournalTitleAcm Sigkdd Explorations Newsletter 21, 1–19 (2019).
- [16] Luca, M., Barlacchi, G., Lepri, B. & Pappalardo, L. A survey on deep learning for human mobility. \JournalTitleACM Computing Surveys (CSUR) 55, 1–44 (2021).
- [17] Zipf, G. K. Human behavior and the principle of least effort. addison-wesley press (1949).
- [18] Gonzalez, M. C., Hidalgo, C. A. & Barabasi, A.-L. Understanding individual human mobility patterns. \JournalTitlenature 453, 779–782 (2008).
- [19] Song, C., Koren, T., Wang, P. & Barabási, A.-L. Modelling the scaling properties of human mobility. \JournalTitleNature physics 6, 818–823 (2010).
- [20] Chu, C., Zhang, H., Wang, P. & Lu, F. Simulating human mobility with a trajectory generation framework based on diffusion model. \JournalTitleInternational Journal of Geographical Information Science 38, 847–878 (2024).
- [21] Long, Q. et al. Practical synthetic human trajectories generation based on variational point processes. In Proceedings of the 29th ACM SIGKDD Conference on Knowledge Discovery and Data Mining, 4561–4571 (2023).
- [22] Rong, C., Ding, J. & Li, Y. An interdisciplinary survey on origin-destination flows modeling: Theory and techniques. \JournalTitleACM Computing Surveys 57, 1–49 (2024).
- [23] Yu, F. et al. City-scale vehicle trajectory data from traffic camera videos. \JournalTitleScientific Data 10, 711, 10.1038/s41597-023-02589-y (2023).
- [24] Zhang, J. et al. Moss: A large-scale open microscopic traffic simulation system (2024). 2405.12520.
- [25] Zheng, Y., Fu, H., Xie, X., Ma, W.-Y. & Li, Q. Geolife gps trajectory dataset-user guide, geolife gps trajectories 1.july 2011, geolife gps trajectories 1.1. \JournalTitleJuly 2011 geolife GPS trajectories 1.1 .
- [26] Yuan, J. et al. T-drive: driving directions based on taxi trajectories. In Proceedings of the 18th SIGSPATIAL International conference on advances in geographic information systems, 99–108 (2010).
- [27] New York City Taxi and Limousine Commission. TLC Trip Record Data. https://www.nyc.gov/site/tlc/about/tlc-trip-record-data.page (2023). [Online; accessed 16-November-2023].
- [28] Kashiyama, T., Pang, Y., Sekimoto, Y. & Yabe, T. Pseudo-pflow: Development of nationwide synthetic open dataset for people movement based on limited travel survey and open statistical data. \JournalTitlearXiv preprint arXiv:2205.00657 (2022).
- [29] Yang, D., Qu, B., Yang, J. & Cudre-Mauroux, P. Revisiting user mobility and social relationships in lbsns: a hypergraph embedding approach. In The world wide web conference, 2147–2157 (2019).
- [30] Zhu, Y., Ye, Y., Wu, Y., Zhao, X. & Yu, J. Synmob: Creating high-fidelity synthetic gps trajectory dataset for urban mobility analysis. \JournalTitleAdvances in Neural Information Processing Systems 36, 22961–22977 (2023).
- [31] Yabe, T. et al. Yjmob100k: City-scale and longitudinal dataset of anonymized human mobility trajectories. \JournalTitleScientific Data 11, 397 (2024).
Acknowledgments
In this work, we collect the data from multiple sources, including mobility trajectory data, WorldPop, WorldOD, and OpenStreetMap. We would like to express our gratitude to the contributors of these datasets. We also thank the advancing diffusion models, such as DDPM and DDIM, for providing the convenient usage of their architectures as key components in our dataset construction pipeline.
Author contributions statement
Yong Li and Yuan Yuan conceived the idea of the dataset. Yuan Yuan designed the dataset construction pipeline. Yuheng Zhang wrote the code for the generation including: downloading and processing the data from WorldPop, WorldOD, and OpenStreetMap, training the diffusion model, and generating the urban mobility. Yuan Yuan, Yuheng Zhang, Jingtao Ding, and Yong Li wrote the manuscript. All authors reviewed the manuscript.
Competing interests
(mandatory statement)
The corresponding author is responsible for providing a competing interests statement on behalf of all authors of the paper. This statement must be included in the submitted article file.
Figures & Tables
| Dataset | Available | Real-world | Type | Global | Privacy |
|---|---|---|---|---|---|
| GeoLife [25] | ✓ | ✓ | Human | ✗ | ✗ |
| T-Drive [26] | ✓ | ✓ | Taxi | ✗ | ✗ |
| NYC Taxi [27] | ✓ | ✓ | Taxi | ✗ | ✗ |
| NYC-TLC [27] | ✓ | ✓ | Taxi | ✗ | ✗ |
| Pseudo-PFLOW [28] | ✓ | ✓ | Human | ✗ | ✗ |
| Foursquare [29] | ✓ | ✓ | Human | ✗ | ✗ |
| SynMob [30] | ✗ | ✗ | Taxi | ✗ | ✓ |
| YJMob100K [31] | ✓ | ✓ | Human | ✗ | ✗ |
| WorldMove (ours) | ✓ | ✗ | Human | ✓ | ✓ |
| Metrics | KS-Test | JSD | Flow | |||||||
|---|---|---|---|---|---|---|---|---|---|---|
| Radius | Distance | Duration | DailyLoc | Radius | Distance | Duration | DailyLoc | CPC | RMSE | |
| Shanghai | 0.2198 | 0.2301 | 0.1347 | 0.2391 | 0.0224 | 0.0275 | 0.0378 | 0.0245 | 0.4218 | 15.02 |
| Nanchang | 0.1729 | 0.2273 | 0.1016 | 0.1844 | 0.0119 | 0.0204 | 0.0016 | 0.0213 | 0.4376 | 13.94 |
| Senegal | 0.1480 | 0.2451 | 0.1795 | 0.2866 | 0.0114 | 0.0332 | 0.0241 | 0.0431 | 0.4067 | 49.77 |
| New York | 0.1570 | 0.1996 | 0.1315 | 0.1835 | 0.0115 | 0.0149 | 0.0114 | 0.0224 | 0.4392 | 12.34 |
| Los Angeles | 0.1510 | 0.2709 | 0.1871 | 0.2864 | 0.0015 | 0.0223 | 0.0129 | 0.0320 | 0.3884 | 17.59 |
| Chicago | 0.1338 | 0.2654 | 0.1914 | 0.2664 | 0.0112 | 0.0232 | 0.0133 | 0.0427 | 0.3956 | 13.68 |